ʻ ‘
A Broad-line, Low-luminosity Active Galactic Nucleus at Anchoring a Large Galaxy Overdensity
Abstract
The James Webb Space Telescope has uncovered a puzzling population of UV-faint broad-line active galactic nuclei (AGN), nicknamed “Little Red Dots”[Matthee2024] owing to their compact morphology and red rest-frame optical colours[Kocevski2023, Maiolino2023, Furtak2024, Greene2024]. Interpreted as dust attenuated AGN[Greene2024], their inferred intrinsic luminosities and supermassive black hole (SMBH) masses rival those of UV-luminous quasars, although they are times more abundant[Matthee2024, Greene2024, Akins2024, Kokorev2024]. If Little Red Dots and quasars are members of the same underlying population, they should inhabit comparable mass dark matter halos, traced by similar overdensities of galaxies. Otherwise, they represent distinct populations with different physical properties and formation histories. Characterizing Little Red Dot environments thus provides a critical test of their nature. Here, we report the discovery of a Little Red Dot at , attenuated by moderate amounts of dust, , with an intrinsic bolometric luminosity of and a SMBH mass of . Most notably, this object is embedded in an overdensity of eight nearby galaxies, allowing us to calculate the first spectroscopic estimate of the clustering of galaxies around Little Red Dots. We find a Little Red Dot-galaxy cross-correlation length of , comparable to that of UV-luminous quasars[Eilers2024]. The resulting estimate of their minimum dark matter halo mass of indicates that nearly all halos above this mass must host actively accreting SMBHs at , in strong contrast with the far smaller duty cycle of luminous quasars (). Our results, taken at face value, motivate a picture in which Little Red Dots are the obscured counterparts of UV-luminous quasars, which provides a natural explanation for the short UV-luminous lifetimes inferred from both quasar clustering[Eilers2024, Pizzati2024] and quasar proximity zones[Davies2019, Durovcikova2024].
James Webb Space Telescope (JWST) spectroscopy has confirmed dozens of (type-1) active galactic nuclei (AGN) by detection of a broad () emission-line component to the (or ) line[Harikane2023, Kocevski2023, Maiolino2023, Uebler2023a, Furtak2024, Greene2024, Matthee2024, Akins2024a], characteristic of gas motion in the gravitational field of a supermassive black hole (SMBH). A particularly intriguing subclass of these broad-line AGN () appear as compact, red sources in JWST/NIRCAM imaging ()[Harikane2023, Matthee2024, Greene2024]. Broad-line AGN photometrically selected with similar criteria have become known as “Little Red Dots”[Matthee2024] (LRDs). Their spectral energy distributions are characterized by a red rest-frame optical slope (), often observed in combination with a blue rest-frame UV slope (), resulting in V-shaped continua[Matthee2024, Greene2024] with a minimum around . These have been interpreted as moderately obscured () AGN[Harikane2023, Matthee2024, Greene2024] superimposed on a galaxy stellar component or a fraction of unextincted scattered AGN light. However, the underlying physical processes that produce the characteristic LRD spectra are not yet fully understood[Setton2024]. While their intrinsic bolometric luminosities and SMBH masses can rival those of quasars, their number densities[Matthee2024, Greene2024, Kocevski2024, Kokorev2024] () place them a factor of () to () above the faint-end extrapolations of the quasar luminosity function[Niida2020, Matsuoka2023].
The existence of quasars[Fan2023] with SMBHs challenges models of SMBH formation. In the canonical picture, SMBH growth is bounded by the Eddington limit and black holes grow exponentially with the Salpeter timescale[Salpeter1964]. With an average radiative efficiency of , this e-folding timescale is . Assuming continuous accretion, duty cycles of , there is not enough time to assemble the majority of SMBHs, shining as luminous quasars, from Pop III stellar remnants[Inayoshi2020]. Clustering measurements place quasars in massive dark matter halos[Arita2023, Eilers2024, Pizzati2024] () and motivate small UV-luminous duty cycles of , phases of active growth of , exacerbating the challenge to grow their SMBHs from stellar seeds to by . Radiatively inefficient accretion, which directly results in much faster SMBH growth, or UV-obscured, dust-enshrouded growth phases for the bulk of the SMBH population and thus a much larger intrinsic duty cycle are two proposed solutions to this problem[Davies2019, Satyavolu2023, Eilers2024, Hopkins2005, Ricci2017]. In this context, LRDs are appealing candidates for obscured phases of quasar growth, if they are found in similarly massive dark matter halos and thus belong to the same population. In this article, we present the first spectroscopic LRD-galaxy clustering measurement to determine how LRDs are embedded in the evolving cosmic web of dark matter halos, enabling a direct comparison with high-z UV luminous quasars.
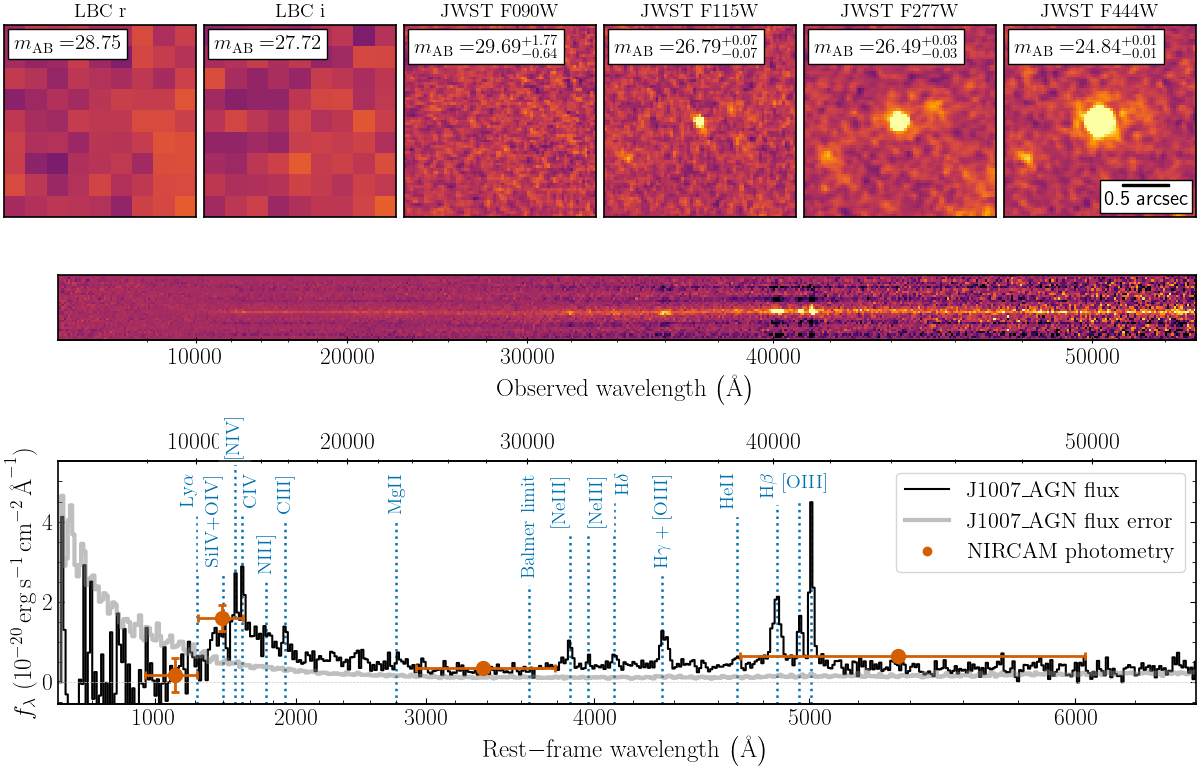
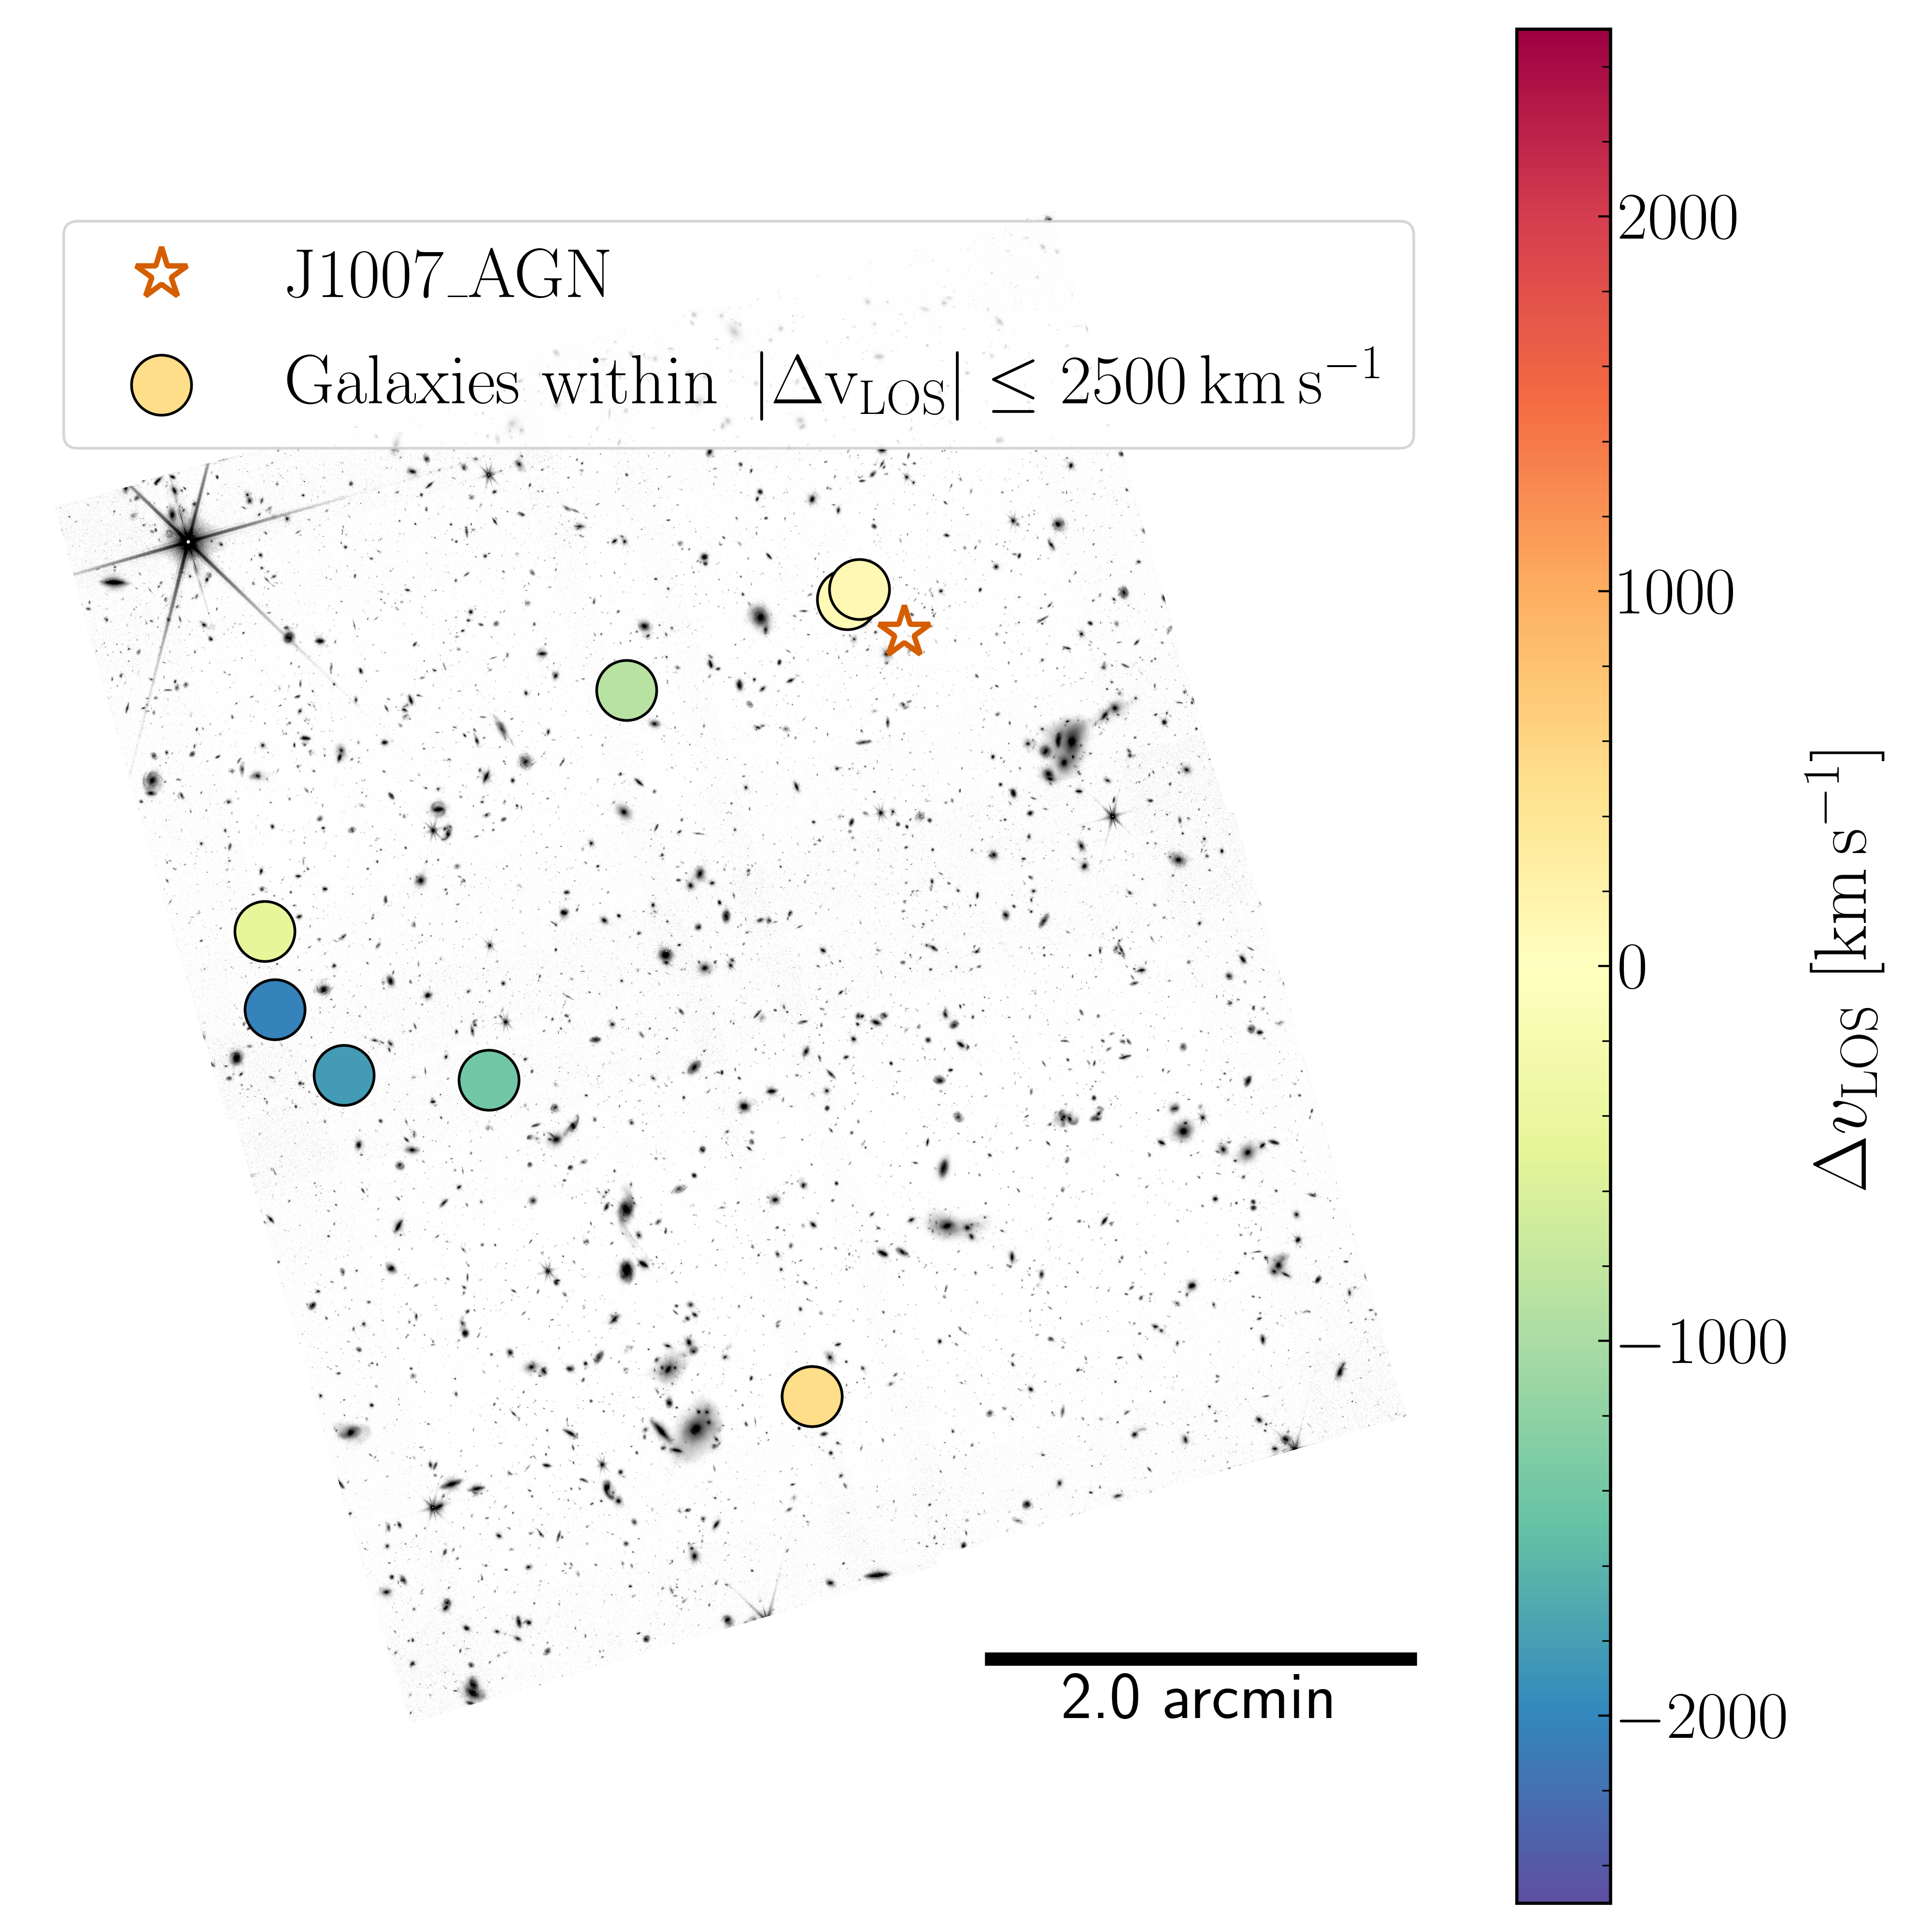
Selected on LBT/LBC and JWST/NIRCam photometry (see Methods), we identified a broad-line AGN at , J1007_AGN, and eight nearby galaxies at similar redshifts () in the field of quasar J1007+2115[YangJinyi2020] (). These observations were taken as part of the JWST program GO 2073, which builds the foundation to map the morphology of the ionized intergalactic medium around two quasars for stringent constraints on SMBH growth. The immediate goals of program GO 2073 are to identify galaxies at and beyond the quasars’ redshift to study quasar-galaxy clustering and to provide targets for subsequent deep spectroscopic observations to map the quasar “light-echoes”.
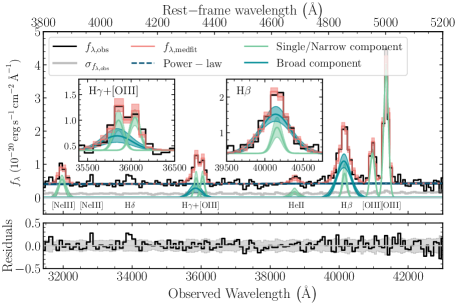
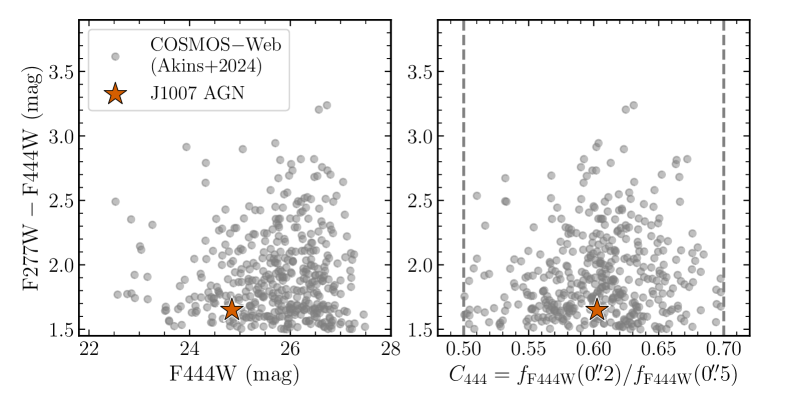
Figure 1 displays the photometric and spectroscopic discovery observations of J1007_AGN. It appears as a compact source with a red rest-frame optical colour (F277WF444W=; also see Figure E1), placing this source among the population of LRDs[Matthee2024, Greene2024]. The NIRSpec/MSA PRISM spectrum of J1007_AGN (Figure 1, bottom panel) has a clearly detected continuum, featuring a plethora of strong emission lines. The most prominent feature is the [O iii] doublet, from which we derive the source redshift of (see Methods). As shown in Figure 2 (left), we decompose the spectrum with a multi-component fit (see Methods) and find a broad line width of ( at ), allowing us to unambiguously classify this source as a type-1 AGN. The source exhibits and (blended with [O iii]) Balmer lines as well as several high-ionization emission lines, such as [Ne iii] , [Ne iii] , and He ii , typical for AGN. In many LRDs, rest-frame UV lines (Si iv, C iv, C iii], Mg ii) are uncharacteristically weak for type-1 AGN, fully absent, or more consistent with photoionization from massive stars[Akins2024a]. In contrast, our spectrum shows emission of rest-frame UV lines (Si iv, C iv, C iii]), including a weak detection of the Mg ii line and a possible detection of N iv emission. While N iv emission is rarely detected in AGN or quasars[Jiang2008], recent observations have reported nitrogen-enriched gas in a range of galaxies[Cameron2023, Topping2024, Castellano2024]. Curiously, we also observe a downturn of the continuum flux blueward of C iv in combination with the absence of strong emission, which might indicate the presence of a strong broad absorption line system. However, the low resolution of our present data in this wavelength range precludes further interpretation.
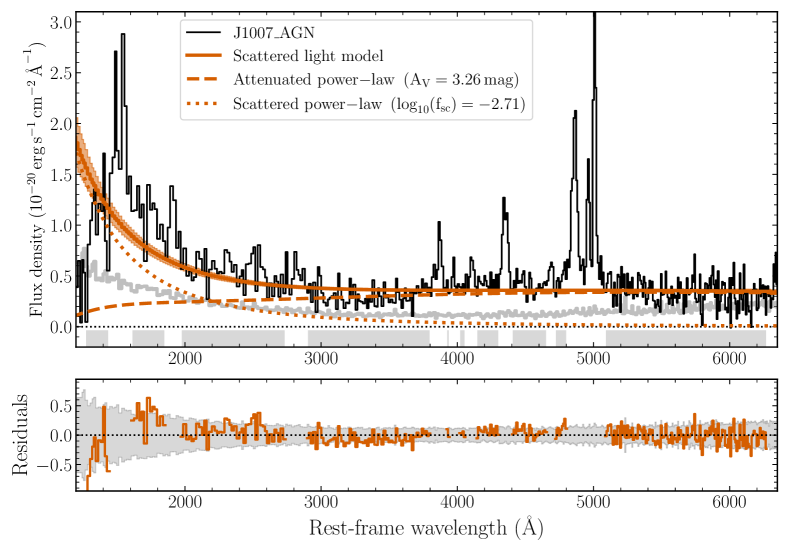
We measure an absolute magnitude at rest-frame of from the spectrum. In comparison to large samples of LRDs[Kocevski2024], J1007_AGN stands out as a particularly luminous source. For the time being, we follow the literature[Kocevski2023, Greene2024] in interpreting the spectral continuum as a combination of a dust-reddened AGN component, dominating the rest-frame optical, and scattered AGN light, which produces the observed rest-frame UV emission. Fitting an appropriate continuum model to the data (see Methods and Figure E2), we find J1007_AGN to be moderately dust obscured with .
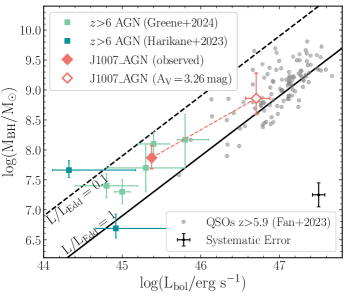
The standard approach to estimate the black hole masses of LRDs utilizes scaling relations[Greene2005] between the line width, , and the line luminosity, , of the broad line component. We carefully decompose the rest-frame optical emission with a parametric model (see Methods) as shown in Figure 2 (left) and measure the properties of the individual components as summarized in Table LABEL:tab:spec_info. Using the measured line properties, we derive a black hole mass of . The bolometric luminosity is typically estimated from the rest-frame UV continuum emission. However, in LRDs this emission is not fully understood. Therefore, we convert the line luminosity () to a continuum luminosity () using a relation derived from low-z AGN[Greene2005] and then adopt a bolometric correction[ShenYue2011] of . We estimate a bolometric luminosity of . With an Eddington luminosity ratio of , J1007_AGN is rapidly accreting mass. These measurements were derived based on the observed spectrum. However, our continuum model suggests that the AGN emission that dominates at the wavelength is attenuated by dust. Correcting the spectral model for dust extinction of , we derive significantly larger values for the SMBH mass , bolometric luminosity , and Eddington luminosity ratio . Figure 2 (right) places these results in the context of quasars[Fan2023] and other AGN[Harikane2023, Greene2024], using the same assumptions to derive bolometric luminosities and black hole masses. Based on its observed bolometric luminosity and black hole mass, J1007_AGN straddles the boundary region between the more luminous LRDs and the faint high-z quasar population[Onoue2019]. Taking into account the dust attenuation, it could intrinsically be as luminous () and massive () as a typical UV-luminous quasar.
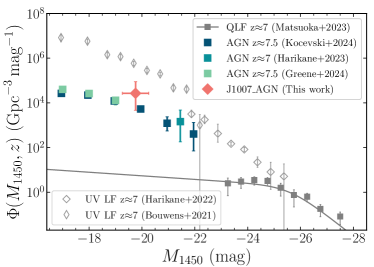
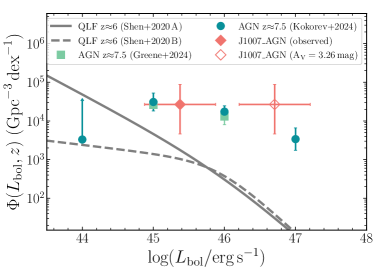
Correcting for our selection function, we estimate a number density of LRDs of based on our serendipitous discovery (detailed description in Methods). In Figure 3 we compare this number density (orange diamond) with luminosity function measurements for LRDs (coloured squares) and quasars (gray filled symbols and lines), as a function of UV magnitude (left) and bolometric luminosity (right). The figure underlines that our discovery is consistent with the expectation from LRDs, but times above the best constraints of the quasar luminosity function[Matsuoka2023, ShenXuejian2020].
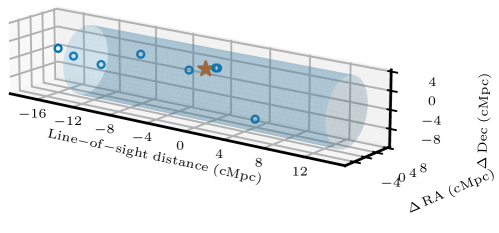
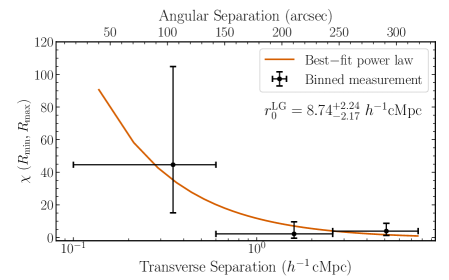
With the preceding analysis, we established that J1007_AGN is a bright LRD. Exploiting the discovery of eight galaxies in the vicinity of J1007_AGN, we conduct a clustering analysis to constrain the environment of a LRD for the first time. Details on the galaxies can be found in the Methods section (Figures E3 and E4, Tables LABEL:tab:source_info and LABEL:tab:galaxy_info). For our fiducial analysis, we restrict ourselves to the six nearest galaxies out of the eight, which are within . However, the results do not strongly depend on this assumption (see Methods). Taking our survey selection function and targeting completeness into account, we calculate the volume-averaged LRD-galaxy cross-correlation function in three radial bins (see Methods). We find a significant excess of galaxies within the innermost bin (Figure E5, left), resulting in an overdensity of . Assuming a real space LRD-galaxy two-point correlation function of the form[Eilers2024] with , we find a best-fit cross-correlation length of (see Methods). Our result on is comparable to the recent quasar clustering measurement[Eilers2024] at with a cross-correlation length of .
Assuming that galaxies and LRDs trace the same underlying dark matter overdensities[GarciaVergara2017], we adopt a recent estimate of the galaxy auto-correlation length[Eilers2024] of , to estimate the LRD auto-correlation length, , and the minimum mass of dark matter halos hosting LRDs: (see Methods). Our result is broadly consistent with similar minimum halo mass estimates for (luminous) quasars[Arita2023, Eilers2024] at , which would imply that quasars and LRDs are indeed hosted by comparable mass dark matter halos, traced by similar overdensities of galaxies, and thus drawn from the same underlying population. We further adopt the published LRD abundance[Kokorev2024] at () to estimate the LRD duty cycle, defined as , where is the number density of dark matter halos with from the halo mass function, yielding a duty cycle of . Taken at face value, the range of duty cycles implied by our measurement appear to be unphysical, since LRDs outnumber the number of dark matter halo hosts allowed by our cosmological model. This problem was foreseen in a recent paper[Pizzati2024b], leading the authors to conclude that LRDs and comparably luminous quasars cannot be hosted in dark matter halos with similar masses. However, we do note that of our posterior for the duty cycle falls into the physically allowed region . Given 1) our small sample size of a single LRD, 2) that we have likely underestimated our error bars by neglecting cosmic variance, and 3) potential systematics associated with assuming a power-law correlation function[Pizzati2024], we believe our results argue for a high LRD duty cycle rather than a departure from the standard cosmology.
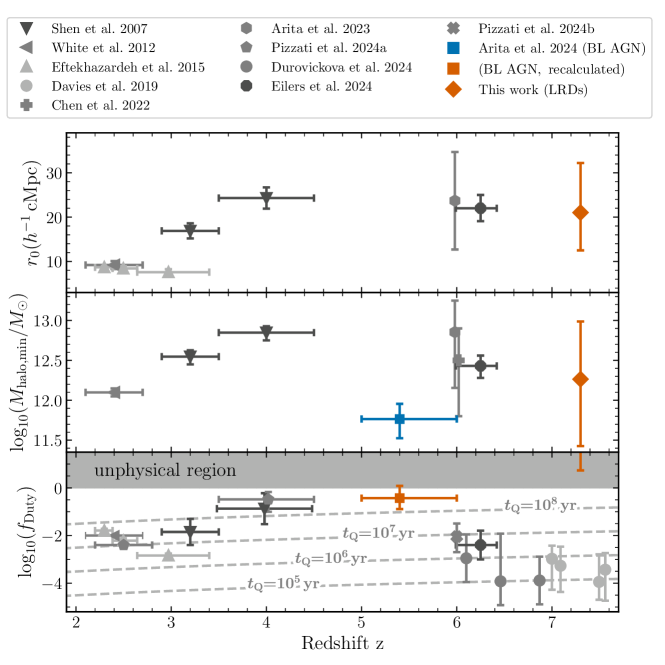
In Figure 4 we place our clustering results in context with the redshift evolution of auto-correlation lengths, minimum host dark matter halo masses, and duty cycles for UV-luminous quasars and JWST broad-line AGN[Arita2024]. Our LRD auto-correlation length and dark matter halo mass measurements are generally consistent with both UV-luminous quasars at and JWST broad-line AGN at . But the order unity duty cycle we estimate (driven by the high LRD abundance) is in stark contrast with the far lower duty cycle inferred for UV-luminous quasars ( at ) from both quasar-galaxy clustering[Eilers2024, Pizzati2024] and their Ly forest proximity zones[Davies2019, Durovcikova2024], although it is in line with the duty cycle implied by the clustering of galaxies around broad-line AGN [Arita2024] (recalculated, see Methods), which have similar properties to LRDs.
We established that J1007_AGN is an LRD with inferred intrinsic properties akin to UV-luminous quasars. At face value, our clustering measurement places it in a dark matter halo, indicating that it is indeed drawn from the same underlying population as UV-luminous quasars. The simplest way to interpret the high LRD duty cycles of relative to the far smaller of UV-luminous quasars, is to argue that the bulk () of SMBH growth occurs in long-lived dust-extincted phases wherein they appear as LRDs, and that these SMBHs appear as UV-luminous quasars just a short fraction () of cosmic time. In this picture, the factor of LRD:quasar abundance ratio, naturally results from the fraction of time SMBHs spend in each phase [Davies2019, Satyavolu2023, Eilers2024, Jahnke2024], which alleviates the tension between the short inferred lifetimes of UV-luminous quasars relative to the time required to grow their SMBHs in less than 1 Gyr after the Big Bang[Inayoshi2020]. Although highly suggestive, an important caveat is that the UV-luminous quasars we compare with in Figure 4 have five to 20 times brighter than that of J1007_AGN, which is itself uncertain due the reddening correction, and there is likely a dependence of clustering, halo mass, and duty cycle on [Pizzati2024b]. Furthermore, our analysis, based on a handful of galaxies in a single LRD field, has large statistical errors, which are likely underestimated owing to cosmic variance and the simplicity of our modelling. Nevertheless, our study presents highly suggestive evidence for strong LRD clustering and high duty cycles, which provides a compelling motivation to further pursue precise LRD clustering measurements, to unravel the nature of this puzzling population, and its connection to quasars and SMBH growth.
References
- [1] Matthee, J. et al. Little Red Dots: An Abundant Population of Faint Active Galactic Nuclei at z 5 Revealed by the EIGER and FRESCO JWST Surveys. \JournalTitleApJ 963, 129 (2024). URL https://ui.adsabs.harvard.edu/abs/2023arXiv230605448M. DOI 10.3847/1538-4357/ad2345. 2306.05448.
- [2] Kocevski, D. D. et al. Hidden Little Monsters: Spectroscopic Identification of Low-mass, Broad-line AGNs at with CEERS. \JournalTitleApJ 954, L4 (2023). URL https://ui.adsabs.harvard.edu/abs/2023ApJ...954L...4K. DOI 10.3847/2041-8213/ace5a0. 2302.00012.
- [3] Maiolino, R. et al. JADES. The diverse population of infant Black Holes at : merging, tiny, poor, but mighty. \JournalTitlearXiv e-prints arXiv:2308.01230 (2023). URL https://ui.adsabs.harvard.edu/abs/2023arXiv230801230M. DOI 10.48550/arXiv.2308.01230. 2308.01230.
- [4] Furtak, L. J. et al. A high black-hole-to-host mass ratio in a lensed AGN in the early Universe. \JournalTitleNature 628, 57–61 (2024). URL https://ui.adsabs.harvard.edu/abs/2023arXiv230805735F. DOI 10.1038/s41586-024-07184-8. 2308.05735.
- [5] Greene, J. E. et al. UNCOVER Spectroscopy Confirms the Surprising Ubiquity of Active Galactic Nuclei in Red Sources at . \JournalTitleApJ 964, 39 (2024). DOI 10.3847/1538-4357/ad1e5f. 2309.05714.
- [6] Akins, H. B. et al. COSMOS-Web: The over-abundance and physical nature of “little red dots”–Implications for early galaxy and SMBH assembly. \JournalTitlearXiv e-prints arXiv:2406.10341 (2024). DOI 10.48550/arXiv.2406.10341. 2406.10341.
- [7] Kokorev, V. et al. A Census of Photometrically Selected Little Red Dots at in JWST Blank Fields. \JournalTitlearXiv e-prints arXiv:2401.09981 (2024). DOI 10.48550/arXiv.2401.09981. 2401.09981.
- [8] Eilers, A.-C. et al. EIGER VI. The Correlation Function, Host Halo Mass and Duty Cycle of Luminous Quasars at . \JournalTitlearXiv e-prints arXiv:2403.07986 (2024). DOI 10.48550/arXiv.2403.07986. 2403.07986.
- [9] Pizzati, E. et al. A unified model for the clustering of quasars and galaxies at . \JournalTitlearXiv e-prints arXiv:2403.12140 (2024). DOI 10.48550/arXiv.2403.12140. 2403.12140.
- [10] Davies, F. B., Hennawi, J. F. & Eilers, A.-C. Evidence for Low Radiative Efficiency or Highly Obscured Growth of Quasars. \JournalTitleApJ 884, L19 (2019). DOI 10.3847/2041-8213/ab42e3. 1906.10130.
- [11] Ďurovčíková, D. et al. Chronicling the Reionization History at with Emergent Quasar Damping Wings. \JournalTitleApJ 969, 162 (2024). DOI 10.3847/1538-4357/ad4888. 2401.10328.
- [12] Harikane, Y. et al. A JWST/NIRSpec First Census of Broad-line AGNs at z = 4-7: Detection of 10 Faint AGNs with 106-108 and Their Host Galaxy Properties. \JournalTitleApJ 959, 39 (2023). URL https://ui.adsabs.harvard.edu/abs/2023ApJ...959...39H. DOI 10.3847/1538-4357/ad029e. 2303.11946.
- [13] Übler, H. et al. GA-NIFS: A massive black hole in a low-metallicity AGN at revealed by JWST/NIRSpec IFS. \JournalTitleA&A 677, A145 (2023). URL https://ui.adsabs.harvard.edu/abs/2023A&A...677A.145U. DOI 10.1051/0004-6361/202346137. 2302.06647.
- [14] Akins, H. B. et al. Strong rest-UV emission lines in a “little red dot” AGN at : Early SMBH growth alongside compact massive star formation? \JournalTitlearXiv e-prints arXiv:2410.00949 (2024). DOI 10.48550/arXiv.2410.00949. 2410.00949.
- [15] Setton, D. J. et al. Little Red Dots at an Inflection Point: Ubiquitous “V-Shaped” Turnover Consistently Occurs at the Balmer Limit. \JournalTitlearXiv e-prints arXiv:2411.03424 (2024). DOI 10.48550/arXiv.2411.03424. 2411.03424.
- [16] Kocevski, D. D. et al. The Rise of Faint, Red AGN at : A Sample of Little Red Dots in the JWST Extragalactic Legacy Fields. \JournalTitlearXiv e-prints arXiv:2404.03576 (2024). DOI 10.48550/arXiv.2404.03576. 2404.03576.
- [17] Niida, M. et al. The Faint End of the Quasar Luminosity Function at z 5 from the Subaru Hyper Suprime-Cam Survey. \JournalTitleApJ 904, 89 (2020). DOI 10.3847/1538-4357/abbe11. 2010.00481.
- [18] Matsuoka, Y. et al. Quasar Luminosity Function at z = 7. \JournalTitleApJ 949, L42 (2023). DOI 10.3847/2041-8213/acd69f. 2305.11225.
- [19] Fan, X., Bañados, E. & Simcoe, R. A. Quasars and the Intergalactic Medium at Cosmic Dawn. \JournalTitleARA&A 61, 373–426 (2023). DOI 10.1146/annurev-astro-052920-102455. 2212.06907.
- [20] Salpeter, E. E. Accretion of Interstellar Matter by Massive Objects. \JournalTitleApJ 140, 796–800 (1964). DOI 10.1086/147973.
- [21] Inayoshi, K., Visbal, E. & Haiman, Z. The Assembly of the First Massive Black Holes. \JournalTitleARA&A 58, 27–97 (2020). DOI 10.1146/annurev-astro-120419-014455. 1911.05791.
- [22] Arita, J. et al. Subaru High-z Exploration of Low-luminosity Quasars (SHELLQs). XVIII. The Dark Matter Halo Mass of Quasars at z 6. \JournalTitleApJ 954, 210 (2023). DOI 10.3847/1538-4357/ace43a. 2307.02531.
- [23] Satyavolu, S., Kulkarni, G., Keating, L. C. & Haehnelt, M. G. The need for obscured supermassive black hole growth to explain quasar proximity zones in the epoch of reionization. \JournalTitleMNRAS 521, 3108–3126 (2023). DOI 10.1093/mnras/stad729. 2209.08103.
- [24] Hopkins, P. F. et al. A Physical Model for the Origin of Quasar Lifetimes. \JournalTitleApJ 625, L71–L74 (2005). DOI 10.1086/431146. astro-ph/0502241.
- [25] Ricci, C. et al. Growing supermassive black holes in the late stages of galaxy mergers are heavily obscured. \JournalTitleMNRAS 468, 1273–1299 (2017). DOI 10.1093/mnras/stx173. 1701.04825.
- [26] Yang, J. et al. Pōniuāʻena: A Luminous z = 7.5 Quasar Hosting a 1.5 Billion Solar Mass Black Hole. \JournalTitleApJ 897, L14 (2020). URL https://ui.adsabs.harvard.edu/abs/2020ApJ...897L..14Y. DOI 10.3847/2041-8213/ab9c26. ADS Bibcode: 2020ApJ…897L..14Y.
- [27] Jiang, L., Fan, X. & Vestergaard, M. A Sample of Quasars with Strong Nitrogen Emission Lines from the Sloan Digital Sky Survey. \JournalTitleApJ 679, 962–966 (2008). URL https://ui.adsabs.harvard.edu/abs/2008ApJ...679..962J. DOI 10.1086/587868. 0802.4234.
- [28] Cameron, A. J., Katz, H., Rey, M. P. & Saxena, A. Nitrogen enhancements 440 Myr after the big bang: supersolar N/O, a tidal disruption event, or a dense stellar cluster in GN-z11? \JournalTitleMNRAS 523, 3516–3525 (2023). DOI 10.1093/mnras/stad1579. 2302.10142.
- [29] Topping, M. W. et al. Metal-poor star formation at with JWST: new insight into hard radiation fields and nitrogen enrichment on 20 pc scales. \JournalTitleMNRAS 529, 3301–3322 (2024). DOI 10.1093/mnras/stae682. 2401.08764.
- [30] Castellano, M. et al. JWST NIRSpec Spectroscopy of the Remarkable Bright Galaxy GHZ2/GLASS-z12 at Redshift 12.34. \JournalTitleApJ 972, 143 (2024). DOI 10.3847/1538-4357/ad5f88. 2403.10238.
- [31] Greene, J. E. & Ho, L. C. Estimating Black Hole Masses in Active Galaxies Using the Emission Line. \JournalTitleApJ 630, 122–129 (2005). URL https://ui.adsabs.harvard.edu/abs/2005ApJ...630..122G. DOI 10.1086/431897. astro-ph/0508335.
- [32] Shen, Y. et al. A Catalog of Quasar Properties from Sloan Digital Sky Survey Data Release 7. \JournalTitleApJS 194, 45 (2011). DOI 10.1088/0067-0049/194/2/45. 1006.5178.
- [33] Onoue, M. et al. Subaru High-z Exploration of Low-luminosity Quasars (SHELLQs). VI. Black Hole Mass Measurements of Six Quasars at 6.1 z 6.7. \JournalTitleApJ 880, 77 (2019). DOI 10.3847/1538-4357/ab29e9. 1904.07278.
- [34] Shen, X. et al. The bolometric quasar luminosity function at z = 0-7. \JournalTitleMNRAS 495, 3252–3275 (2020). DOI 10.1093/mnras/staa1381. 2001.02696.
- [35] García-Vergara, C., Hennawi, J. F., Barrientos, L. F. & Rix, H.-W. Strong Clustering of Lyman Break Galaxies around Luminous Quasars at Z 4. \JournalTitleApJ 848, 7 (2017). DOI 10.3847/1538-4357/aa8b69. 1701.01114.
- [36] Pizzati, E. et al. “Little Red Dots” cannot reside in the same dark matter halos as comparably luminous unobscured quasars. \JournalTitlearXiv e-prints arXiv:2409.18208 (2024). DOI 10.48550/arXiv.2409.18208. 2409.18208.
- [37] Arita, J. et al. The nature of low-luminosity AGNs discovered by JWST at based on clustering analysis: ancestors of quasars at ? \JournalTitlearXiv e-prints arXiv:2410.08707 (2024).
- [38] Jahnke, K. The Soltan argument at : UV-luminous quasars contribute less than 10% to early black hole mass growth. \JournalTitlearXiv e-prints arXiv:2411.03184 (2024). DOI 10.48550/arXiv.2411.03184. 2411.03184.
- [39] Bouwens, R. J. et al. New Determinations of the UV Luminosity Functions from z 9 to 2 Show a Remarkable Consistency with Halo Growth and a Constant Star Formation Efficiency. \JournalTitleAJ 162, 47 (2021). DOI 10.3847/1538-3881/abf83e. 2102.07775.
- [40] Harikane, Y. et al. GOLDRUSH. IV. Luminosity Functions and Clustering Revealed with 4,000,000 Galaxies at : Galaxy-AGN Transition, Star Formation Efficiency, and Implication for Evolution at . \JournalTitleApJS 259, 20 (2022). DOI 10.3847/1538-4365/ac3dfc. 2108.01090.
- [41] Gehrels, N. Confidence Limits for Small Numbers of Events in Astrophysical Data. \JournalTitleApJ 303, 336 (1986). DOI 10.1086/164079.
- [42] Shen, Y. et al. Clustering of High-Redshift () Quasars from the Sloan Digital Sky Survey. \JournalTitleAJ 133, 2222–2241 (2007). DOI 10.1086/513517. astro-ph/0702214.
- [43] White, M. et al. The clustering of intermediate-redshift quasars as measured by the Baryon Oscillation Spectroscopic Survey. \JournalTitleMNRAS 424, 933–950 (2012). DOI 10.1111/j.1365-2966.2012.21251.x. 1203.5306.
- [44] Eftekharzadeh, S. et al. Clustering of intermediate redshift quasars using the final SDSS III-BOSS sample. \JournalTitleMNRAS 453, 2779–2798 (2015). DOI 10.1093/mnras/stv1763. 1507.08380.
- [45] Pizzati, E., Hennawi, J. F., Schaye, J. & Schaller, M. Revisiting the extreme clustering of z 4 quasars with large volume cosmological simulations. \JournalTitleMNRAS 528, 4466–4489 (2024). DOI 10.1093/mnras/stae329. 2311.17181.
- [46] Chen, H. et al. Measuring the Density Fields around Bright Quasars at with XQR-30 Spectra. \JournalTitleApJ 931, 29 (2022). DOI 10.3847/1538-4357/ac658d. 2110.13917.
Acknowledgements
J.-T.S. is supported by the Deutsche Forschungsgemeinschaft (DFG, German Research Foundation) - Project number 518006966.
S.E.I.B. is funded by the Deutsche
Forschungsgemeinschaft (DFG) under Emmy Noether grant number BO 5771/1-1.
F.W. and X.F. acknowledge support from NSF Grant AST-2308258.
KK is supported by the DAWN Fellowship from the Cosmic Dawn Center (DAWN), which is funded by the Danish National Research Foundation under grant DNRF140.
This paper includes data from the LBT. The LBT is an international collaboration among institutions in the United States, Italy, and Germany. The LBT Corporation partners are: The University of Arizona on behalf of the Arizona university system; Istituto Nazionale di Astrofisica, Italy; LBT Beteiligungsgesellschaft, Germany, representing the Max Planck Society, the Astrophysical Institute Potsdam, and Heidelberg University; The Ohio State University; The Research Corporation, on behalf of The University of Notre Dame, University of Minnesota and University of Virginia.
This work is based [in part] on observations made with the NASA/ESA/CSA James Webb Space Telescope. The data were obtained from the Mikulski Archive for Space Telescopes at the Space Telescope Science Institute, which is operated by the Association of Universities for Research in Astronomy, Inc., under NASA contract NAS 5-03127 for JWST. These observations are associated with program GO 2073.
Support for program GO 2073 was provided by NASA through a grant from the Space Telescope Science Institute, which is operated by the Association of Universities for Research in Astronomy, Inc., under NASA contract NAS 5-03127.
Author Contributions
As the first author J.-T.S. led large parts of the observing program, the data reduction, the presented analysis and the manuscript preparation.
J.F.H. and F.B.D. lead the initial design of the observation program and the preparation for the photometric observations.
The photometric data reduction and subsequent spectroscopic follow-up observations preparation were led by J.-T.S. and supported by the team (J.F.H., F.B.D., S.E.I.B., F.W., M.M., and R.N.).
Spectroscopic observations were reduced by J.-T.S
with support from J.F.H and F.B.D. J.F.H. and E.P. contributed to the interpretation of the results.
All co-authors contributed to the discussion of the presented results and to the manuscript preparation.
Competing interests
The authors declare no competing interests.
Data availability
The JWST data used in this publication from program GO 2073 are publicly available.
All further datasets generated and analysed during this study are available from the corresponding author upon reasonable request.
Code availability
N/A.
The JWST data were in part processed with the JWST calibration pipeline (https://jwst-pipeline.readthedocs.io).
Correspondence
Correspondence and requests for materials should be addressed J.-T. Schindler (jan-torge.schindler@uni-hamburg.de).
Methods
Data & data reduction
The data presented in this work were taken as part of the JWST program GO 2073 “Towards Tomographic Mapping of Reionization Epoch Quasar Light-Echoes with JWST”. The goal of the program is to understand the timescales on which quasars grow by tomographically mapping the extended structure of the ionized region around those quasars, their “light-echos”[Schmidt2019]. For this purpose, one measures the transmission of flux in the spectra of background galaxies, which serve as line-of-sight tracers for the ionized region. For all cosmological calculations we adopt a concordance cosmology[Hinshaw2013] with , , and .
Photometric data
The source J1007_AGN was discovered in a field centred on the redshift quasar J1007+2115 [YangJinyi2020]. The JWST/NIRCam observations cover the F090W, F115W, F277W, and F444W filter bands to enable galaxy dropout selection. The mosaic is built from two pointings employing a FULLBOX 6 dither pattern using the MEDIUM 8 readout pattern. With 3736.4 s of exposure time per pointing and SW/LW filter pair, the NIRCam/imaging was charged a total science time of 14952 s.
We downloaded the data using the jwst_mas_query***https://github.com/spacetelescope/jwst_mast_query python package. Our image data reduction was carried out using version 1.6.3 of the JWST Science calibration pipeline†††https://jwst-pipeline.readthedocs.io/en/latest (CALWEBB; CRDS context jwst_1046.pmap).
During the reduction, we executed a range of additional steps. After CALWEBB stage 1, we performed 1/f-noise subtraction on a row-by-row and column-by-column basis for each amplifier[Schlawin2020]. We continued by running stage 2 of the pipeline on these 1/f-noise subtracted images. Detector-dependent noise features were apparent in the stage 2 outputs. In order to remove them, we constructed master background images for each filter and detector combination by median filtering all available exposures in our program. Scaled master backgrounds were then subtracted from our stage 2 outputs. Proper alignment of individual detector images proved challenging due to the low number of point sources in reference catalogues. Therefore, we devised a multi-stage alignment process. We began by running CALWEBB stage 3 on the F444W dither groups with the largest overlap. This resulted in four F444W sub-mosaics corresponding to combined images for each detector and each of our two pointings. These four sub-mosaics were then aligned to the positions of known Gaia stars in the field using tweakwcs‡‡‡https://github.com/spacetelescope/tweakwcs. Choosing one tile as a reference, we iteratively aligned the other three tiles using the Gaia star catalogue and point sources from the reference tile. The aligned F444W sub-mosaics were resampled into one mosaic with a pixel scale of . As a final step, the full mosaic is then aligned to the full set of Gaia reference stars in the field. With the F444W full mosaic as a reference image, we align the CALWEBB stage 2 output files to a common reference frame, (including the F444W images). Then we create association files for the aligned images of each filter and run CALWEBB stage 3 (with the tweakregstep disabled) to create mosaics with a pixel scale of for each filter band. The mean alignment accuracy measured from the full mosaics and the Gaia reference star catalogue is , , , for the F090W, F115W, F277W, F444W bands, respectively. We estimate that our full mosaics cover a field of view of .
In order to calculate source photometry, we begin by resampling the mosaics to a common WCS grid. Then we convolve the resampled F090W, F115W, and F277W mosaics to the lower resolution of the F444W filter. The point-spread function (PSF) convolution kernels are generated empirically from point sources in the field. To extract photometry, we use the SExtractor[Bertin1996] software. Source detection is performed on an inverse variance weighted signal-to-noise image stack of the four mosaics. We calculate Kron[Kron1980] aperture photometry on all detected sources using a Kron parameter of 1.2. The fluxes measured in these small apertures are then aperture corrected in two steps, equivalent to common procedures[Bouwens2016]. The correction for the PSF wings uses empirically generated PSFs based on point sources in the field.
To improve our high-redshift galaxy selection, we obtained deep r-band and i-band dropout images with LBT/LBC[Giallongo2008]. The observations were performed in binocular mode, with individual exposures for all images set to 180 s to minimize the effects from cosmic rays and the saturation of bright stars in the field. In total, the on-source time is 9.5 hours for both r-band and i-band. We processed the LBC data using a custom data reduction pipeline named PyPhot§§§https://github.com/PyPhot/PyPhot. The pipeline introduces standard imaging data reduction processes including bias subtraction, flat fielding, and sky background subtraction. The master bias and flat frames were constructed using the sigma-clipped median on a series of bias and sky flats, respectively. For i-band, we further corrected fringing by subtracting off a master fringe frame constructed from our science exposures. The sky background was estimated using SExtractor[Bertin1996] after masking out bright objects in the images. In addition, we masked cosmic rays using the Laplacian edge detection algorithm[vanDokkum2001]. Finally, we aligned all individual images to GAIA DR3 and calibrated the zero points with well detected point sources in the Pan-STARRS[Chambers2016] photometric catalogues. After the image processing, we created the final mosaics for each band using SCAMP[Bertin2006] and Swarp[Bertin2002]. The pixel scales of the final mosaics are pixel for the LBC images.
Galaxy candidate selection
High-redshift galaxy candidates selected from the photometric data were then spectroscopically followed-up with the NIRSpec/MSA. We devised a probabilistic dropout selection strategy based on the aperture fluxes, which utilizes JWST galaxy mock spectra from the JAGUAR catalogue[Williams2018] to estimate a selection purity. We combined this with a selection purity based on photometric redshifts of our candidates compared to JAGUAR sources calculated with bagpipes[Carnall2018]¶¶¶https://bagpipes.readthedocs.io/en/latest/. A more detailed description of the candidate selection process will be provided in a forthcoming publication (Hennawi et al. 2025, in prep.). The candidates were then binned in purity with 100 sources for priority 1, 2, and 3. The next 700 sources were given priority 4 and the subsequent 1000 sources priority 5. The remaining sources were assigned a priority of 6. We performed visual inspection of our candidates. As we do not expect source flux in the NIRCam F090W filter (), galaxy candidates with a significant F090W detection were demoted to a lower priority class. This procedure results in a low-redshift cut-off for our galaxy selection of .
Spectroscopic data
Galaxy candidates were observed in two NIRSpec/MSA pointings with the PRISM/CLEAR disperser filter combination, providing continuous spectra from to with a resolving power of . The MSA masks were designed using the eMPT tool[Bonaventura2023]∥∥∥https://github.com/esdc-esac-esa-int/eMPT_v1 with the goal to maximize the coverage of priority 1 sources from our candidate list. Before designing the mask, we visually inspected all priority 1 through 5 candidates, removing sources where the photometry was obviously affected by image artefacts. Of all priority 1 (2, 3) candidates, 78 (64, 52) passed this step, of which 34 (9, 9) out of 56 (35, 33) available in the field of view of the final two MSA pointings were targeted for spectroscopy, resulting in a targeting completeness of 61%, 26%, 27% for priorities 1 through 3. Each pointing was observed using the standard 3 shutter slitlet nod pattern with 55 groups per integrations and 2 integrations per exposure and read out using the NRSIRS2RAPID pattern. This resulted in a total exposure time of per pointing.
The raw rate files were downloaded from STScI using jwst_mas_query and then reduced with a combination of the CALWEBB pipeline and the PypeIt[Prochaska2020]******https://pypeit.readthedocs.io/en/release/ python package. The spectroscopic reduction was carried out using version 1.13.4 of the JWST Science calibration pipeline††††††https://jwst-pipeline.readthedocs.io/en/latest (CALWEBB; CRDS context jwst_1188.pmap‡‡‡‡‡‡J1007_AGNhas been re-reduced recently with the CRDS context jwst_1225.pmap). PypeIt is a semi-automated pipeline for the reduction of astronomical spectroscopic data, which includes JWST/NIRSpec as a supported spectrograph. The rate files were first processed with the CALWEBB Spec2Pipeline skipping the bkg_subtract, master_background_mos, resample_spec, and extract_1d steps, which were then performed using PypeIt. We used difference imaging with PypeIt for background subtraction and then co-added the 2D spectra according to the nod pattern, super-sampled on a finer pixel grid (factor 0.8). The final 1D spectra for all sources were optimally extracted from their 2D coadded spectra.
Analysis
Spectroscopic Analysis of J1007_AGN
We use the Sculptor[Schindler2022] python package to model the J1007_AGN rest-frame optical spectrum in the wavelength range 31000 Å to 43000 Å (Å to Å rest-frame) with a combination of a power-law for the continuum and Gaussian profiles for the emission lines. The wavelength range is set to not include too much flux redward of the [O iii] lines, where the power-law slope of the continuum is expected to change[VandenBerk2001]. The [O iii] , [O iii] , [O iii] , He ii , and [Ne iii] lines are modelled with one Gaussian component each. We approximate the broad line and lines with two Gaussian components each. Due to the low signal-to-noise ratio of the [Ne iii] and emission lines, we decided against including them in the model and accordingly mask out their contribution.
Modelling the rest-frame optical continuum is complicated by contributions from a multitude of atomic and ionic iron emission lines blending into a pseudo-continuum[Boroson1992, Vestergaard2001]. Adding an iron pseudo-continuum to the model produces the same results, because the amplitude is effectively set to zero. This indicates that the low-resolution and modest SNR of our spectrum cannot constrain the iron pseudo-continuum at present and hence we do not include it in our fit.
We expect the widths and redshifts of some of the narrow or broad emission lines to be correlated. In order to better decompose these line components, we couple the redshift and FWHM of the and narrow line components to the [O iii] , [O iii] , and [O iii] lines. Additionally, the redshift and FWHM of the and broad line components are also coupled together. To constrain the model of the low signal-to-noise detection of the He ii line, we couple its redshift to the redshift of the narrow emission lines.
AGNs and type-1 quasars excite both and [O iii] emission[VandenBerk2001], which are usually blended due to the broad nature of the lines. Unfortunately, the quality of our spectrum does not allow us to uniquely decompose the individual line contributions without coupling the redshifts and widths as described above (Figure 1). Even if this can approximate the blended lines with a broad and narrow component for and one component for [O iii] , we deem the resulting amplitudes to be unreliable. Calculating the reddening from the Balmer decrement of the and line fluxes, for example, leads to discrepant and unphysical (i.e., ) results. Therefore, we caution against over-interpreting these line properties.
We sample the full parameter space of the model fit using emcee[ForemanMackey2013]. As results we quote the median value of the fit parameter and report the 68th percentile range of the fit posterior as our uncertainty. The width of the emission lines as measured by the FWHM is then corrected for spectral broadening[Peterson2004] by subtracting the wavelength dependent resolution in quadrature (). As an example, at rest-frame the nominal resolution of the JWST/NIRSpec PRISM observations is according to the JWST documentation. As we measure a FWHM of for the narrow emission lines ([O iii] , [O iii] ) and line components ( ), below the nominal resolution, we note that these lines and line components remain unresolved. Table LABEL:tab:spec_info summarizes the main source properties of J1007_AGN calculated from the fit in addition to the source redshift, which is determined from a separate line fit to the [O iii] and [O iii] lines. The absolute magnitude at Å, directly calculated from the average spectral flux in a Å window around rest-frame Å.
Nature of the continuum emission
The width of the broad-line component ( leaves little doubt that our source is a bona-fide type-1 AGN. However, rest-frame UV emission lines (C iv, Si iv, Mg ii, C iii]), which are expected to be strong in type-1 AGN appear weak and the continuum beyond Å has an unusually red slope (). The resulting red rest-frame optical colour (F277-F444W) and the source’s compact nature (see Figure E1) mark this source as belonging to the population of LRDs[Matthee2024, Greene2024, Akins2024]. These are compact, red (rest-frame optical) sources discovered in JWST imaging data. Spectroscopic surveys have identified broad or line components in photometrically selected LRDs, suggesting that a significant fraction are (type-1) AGN ([Greene2024]). However, their lack of strong rest-frame UV emission lines typical for AGN and their unusual V-shaped continuum (blue rest-frame UV and red rest-frame optical) makes it challenging to classify them in the AGN unification paradigm. One leading hypothesis is that the continuum emission is the superposition of a significantly dust extincted AGN continuum and much weaker scattered intrinsic AGN emission, responsible for the blue rest-frame UV slope[Greene2024, Akins2024], similar to lower-redshift dust reddened quasars[Stepney2024]. Alternatively, the spectrum could be explained with dust attenuated AGN emission in combination with unattenuated[Brooks2024] stellar light dominating the rest-frame UV emission[Greene2024, Akins2024a]. However, this requires special conditions e.g., extremely high stellar densities within a small radius[MaYilun2024].
If the accretion disk and the broad line region of J1007_AGN are significantly attenuated, any measurements of the bolometric luminosity, black hole mass and Eddington luminosity ratio derived from the rest-frame optical spectrum will be biased low. Hence, we decided to model the continuum emission with a combination of an attenuated power-law model and a scattered-light power law . Both power laws are defined by the same intrinsic flux at Å, , and the same slope, . The former model is then attenuated by using a standard extinction curve[Calzetti2000] and the latter is multiplied by a scattered light fraction . With these models, we perform an MCMC likelihood fit using emcee[ForemanMackey2013] to line-free regions only. Within the assumptions of this model, our results indicate that the underlying continuum emission originates from a steep power law (; ), which has been significantly attenuated (). We find a scattered light fraction of . Figure E2 displays the median model along with the 68-percentile posterior range in orange. The model can reasonably well approximate the continuum emission within the flux uncertainties. However, the rest-frame Å region seems slightly underpredicted, whereas the rest-frame region is slightly overpredicted by this fit. Nonetheless, in order to provide an order of magnitude estimate for the dereddened AGN properties in the next section, we adopt the posterior extinction value .
As the power law index is unusually steep for quasars, we performed a test imposing a Gaussian prior (, ) on the power law slope . The resulting best-fit slope increases to and we retain a slightly lower value for the extinction, . As a consequence, the bolometric continuum luminosity decreases by to . This change would still push the dereddened source properties into the quasar regime and not change any of our conclusions. Therefore, we adopt or first model fit result with the uniform priors.
We would like to note that in general one can derive a robust extinction measure from the flux of two Balmer lines (i.e., the Balmer decrement), under the assumption that the nebular emission originates under similar physical conditions. However, as our decomposition of the and [O iii] line blend does not yield reliable results, we cannot calculate the Balmer decrement given the current quality of the spectrum.
Derivation of the SMBH mass and the Eddington ratio
We estimate the black hole mass and Eddington luminosity ratio of J1007_AGN using single-epoch virial estimators. Assuming that the broad-line region (BLR) emitting gas is in virial motion around the SMBH, we use the line-of-sight velocity width, as measured by the of the line, to trace the gravitational potential of the SMBH mass :
| (1) |
where is the average radius of the line-emitting region and encapsulates our ignorance on the detailed gas structure, its orientation towards the line of sight and more complex BLR kinematics. Correlations connecting the radius to the continuum luminosity of broad-line AGN[Kaspi2000, Bentz2006] then allow us to rewrite the expression above in terms of direct observables[Vestergaard2002], i.e. a virial SMBH mass estimator. Traditionally, these relations estimate the SMBH mass from the FWHM of a line (e.g., the line) and a measure of the continuum luminosity of the source (e.g., the luminosity at Å, ). For quasars that dominate the emission at Å this choice is appropriate. However, it is unclear to what extent the emission in the rest-frame optical is dominated by the AGN or by galaxy light. Therefore, we employ a single-epoch virial estimator[Greene2005] that uses the total line luminosity as a proxy for the continuum luminosity for our fiducial SMBH estimate, . Additionally, we adopt three different single-epoch virial estimators[Greene2005, Vestergaard2006, Park2012] that use the FWHM and continuum luminosity for comparison. We use these to gauge the systematic uncertainty inherent in this form of SMBH mass measurement.
To estimate the bolometric luminosity, we apply a typical bolometric correction factor[ShenYue2011] () to estimate the bolometric luminosity from the continuum luminosity at Å, . In order to produce consistent results for our fiducial SMBH mass estimator, we alternatively use the empirical line-to-continuum luminosity relations[Greene2005] to calculate the approximate from and then convert to a bolometric luminosity (denoted as ). We use the appropriate bolometric luminosities to calculate the Eddington luminosity ratios, , for the different SMBH mass estimates. All measured spectral properties along with the luminosities, SMBH masses and Eddington luminosity ratios are presented in Table LABEL:tab:spec_info. Based on the observed spectrum, we find J1007_AGN to host a SMBH with a mass of with an Eddington luminosity ratio of . At face value J1007_AGN hosts a rapidly () accreting, relatively massive SMBH (), akin to the least luminous quasars[Fan2023] identified at (see Figure 2, right panel for a comparison). The SMBH mass estimates based on different single-epoch scaling relation vary within a factor of 2, in agreement with the expected systematic uncertainties[Vestergaard2006] of depending on the adopted estimator and model assumptions[Bertemes2024].
Following the assumption that the spectral shape of J1007_AGN is the superposition of a dust attenuated and a scattered AGN emission component, we derived a extinction value of for attenuated emission dominating the rest-frame optical. Correcting for the attenuation, we recalculate the luminosities, SMBH mass and the Eddington luminosity ratio for our fiducial choice of single-epoch virial estimator[Greene2005] based on the line luminosity. These results are summarized in Table LABEL:tab:dereddened_prop. Accounting for the extinction, J1007_AGN reaches quasar-like bolometric luminosities and an SMBH mass of , now fully overlapping with the quasar distribution[Fan2023] at as shown in the right panel of Figure 2.
Number density estimate
To place our serendipitous discovery of J1007_AGN in context with the population of faint high-redshift AGN discovered with JWST, we calculate its approximate number density. J1007_AGN was discovered as a priority 1 source while following up galaxy candidates in a redshift range of , i.e. at the redshift of quasar J1007+2115 and beyond. Given the brightness of J1007_AGN and the strength of its emission features, we assume that we would have detected it up to the end of the targeted redshift interval of . Therefore, to calculate the surveyed volume in our observations we set a redshift interval of and use a total survey area of , the overlap of our NIRCam photometry and NIRSpec MSA spectroscopy. We derive a survey volume of . This leads to an approximate source density of , assuming a total selection completeness of 100%. However, we already know that our targeting selection completeness for priority 1 sources is only 61%. Correcting for this effect, we calculate . In order to compare these number estimates in the context of other samples of faint high-redshift AGN, we calculate luminosity function estimates based on this one source. This is solely for illustration and we do caution that calculating a statistical property from a single source has significant systematic biases due to the small sample size and cosmic variance. First, we place J1007_AGN in the context of the high-redshift UV luminosity function. As a proxy for the absolute UV magnitude, we use the absolute magnitude at Å as measured from the spectrum, (see Table LABEL:tab:spec_info) and choose a bin size of . With these assumptions, our corrected luminosity function measurement is , where the uncertainties encompass the confidence interval for a Poisson distribution that corresponds to in Gaussian statistics. We compare our estimate with the UV luminosity functions of faint AGN[Harikane2023, Greene2024], galaxies, and quasars in Figure 3 (left). The right panel of Figure 3 shows our luminosity function estimate converted to bolometric luminosity. In correspondence with the literature[Greene2024, Kokorev2024], we use the bolometric luminosity estimate derived from the line luminosity, . These panels show that our luminosity function estimate agrees well with other measurements for faint high-redshift AGN, indicating that the identification of this source in our surveyed volume was likely to be expected. We note that the luminosity function of these AGN remains orders of magnitude above the quasar luminosity function extrapolation[Matsuoka2023] at .
Galaxy discoveries
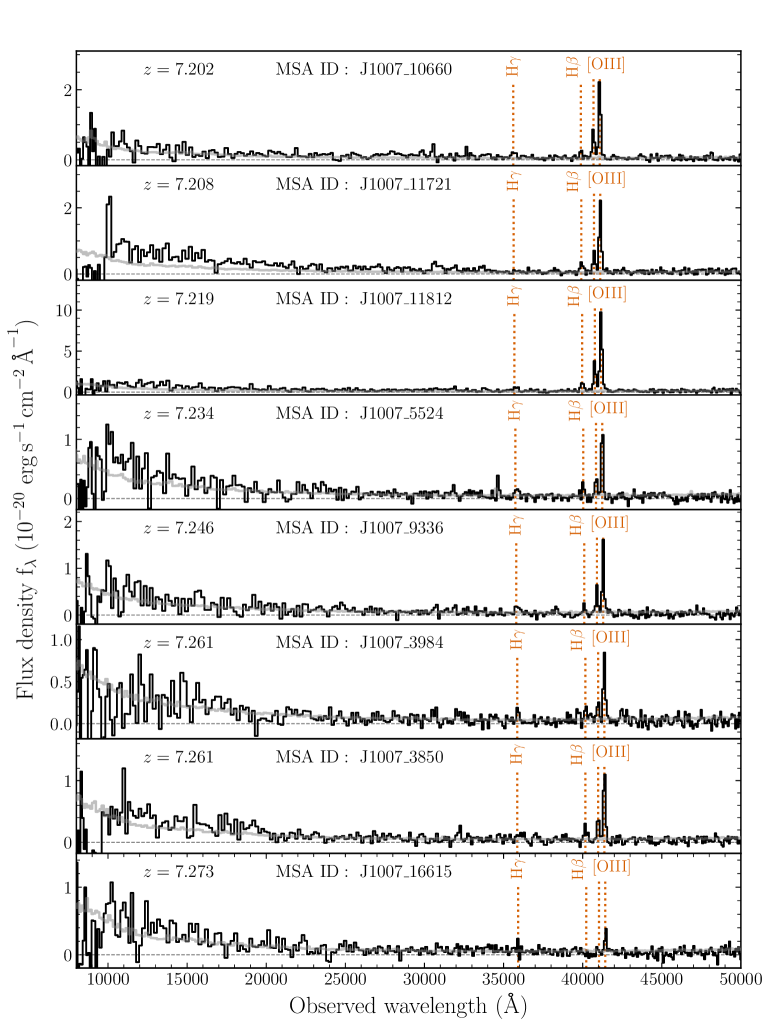
The goal of the Cycle 1 program GO 2073 was to discover bright galaxies at the redshifts of two high-redshift quasars and beyond. We followed up galaxy candidates spectroscopically using the NIRSpec MSA with the PRISM disperser. Our spectroscopy allowed us to identify 13 galaxies at by their [O iii] emission line doublet. There are 107 priority 1 and 2 photometric candidates with median photometric redshifts in this redshift range, of which 38 were targeted by MSA spectroscopy. Hence, we would expect up to times as many galaxy discoveries if our follow-up had been complete. We find that 8 of these 13 galaxies are within a line-of-sight-velocity difference of relative to J1007_AGN. Their redshifts have been determined by fitting for the redshift of the [O iii] doublet in the galaxy spectra. The spectra were modelled using a power-law continuum component and one Gaussian component for each of the doublet emission lines, whose redshift and FWHM were coupled. Table LABEL:tab:source_info provides the galaxy coordinates, their redshift, and their NIRCam fluxes. For each galaxy we further calculate the line-of-sight velocity distance , the angular separation (both in arcseconds and in proper kpc), and their absolute UV magnitudes , approximated by the absolute magnitude of the F115W filter band. These properties are summarized in Table LABEL:tab:galaxy_info and are used in our analysis of the LRD-galaxy cross-correlation measurement. We note that the faintest galaxy we could identify in our spectroscopic sample has a UV magnitude of , which we adopt as our spectroscopic UV detection limit for galaxies in the following clustering analysis.
LRD-galaxy cross correlation measurement
The LRD-galaxy cross-correlation function averaged over an effective volume can be related to the LRD-galaxy two-point correlation function via
| (2) |
equivalent to luminous quasars[Hennawi2006, GarciaVergara2017]. In this case we have chosen a cylindrical geometry with radial coordinate , being the transverse comoving distance, and the cylinder height , the radial comoving distance,
| (3) |
where is the Hubble constant at redshift . The volume averaged cross-correlation is calculated in radial bins with bin edges . We effectively calculate via
| (4) |
where is the number of LRD-galaxy pairs in the enclosed cylindrical volume and is the number of random LRD-galaxy pairs in average regions of the Universe. We consider only J1007_AGN for the LRD-galaxy clustering measurement here and thus is simply the number of associated galaxies in the volume. The random number of galaxies can be expressed in terms of the background volume density of galaxies at redshift in the cylindrical volume : . Our survey volume is not large enough to allow us to empirically determine the background volume density of galaxies. Hence, we calculate an estimate of from the galaxy luminosity function[Bouwens2022]. We integrate the luminosity over a magnitude range of , where the faint-end limit corresponds to the faintest spectroscopically identified galaxy in our sample. The resulting galaxy background density is . The effective volume in cylindrical geometry can be expressed as
| (5) |
where is the galaxy selection function in terms of both and . We decompose into three components:
| (6) |
where is the redshift dependent completeness, radially dependent coverage completeness, and is the radially dependent targeting completeness.
Due to the limited number of companion galaxies, we choose three radial bins with bin edges and ( and ). For these bins we calculate a radial coverage completeness of and , respectively, based on the fractional area covered by our NIRSpec observations. We limit our selection of galaxies for the clustering measurement by restricting the relative line-of-sight velocity to and , selecting six or alternatively all of the eight galaxies presented in Table LABEL:tab:galaxy_info. These line-of-sight velocity differences correspond to redshift intervals of or , respectively. For simplicity, we conservatively set the redshift dependent completeness to a constant over these narrow redshift intervals, providing us with a lower limit on the cross-correlation measurement.
In addition, our assignment of MSA slits with the eMPT tool introduces a targeting selection function that depends on the candidate’s priority class. For each priority and radial bin we calculate our targeting completeness as the fraction of targeted to photometrically selected galaxy candidates in the MSA area. All our identified galaxies belong to the priority classes and (see Table LABEL:tab:galaxy_info). The relevant completeness values for our three radial bins in increasing distance to J1007_AGN are , , , and . Based on these values, we can calculate the “corrected” number of LRD-galaxy pairs per radial bin as
| (7) |
where is the number of LRD-galaxy pairs per radial bin and priority . Finally, the targeting selection function is approximated by the fraction of observed to corrected LRD-galaxy pairs
| (8) |
with values of , , and for the three radial bins in order of increasing distance. We present our binned clustering measurement in Table LABEL:tab:cross_corr for the two samples with relative line-of-sight velocities and , finding an overdensity in the innermost radial bin with or , respectively.
We now aim to constrain the real-space LRD-galaxy two-point correlation function by parameterizing its shape as
| (9) |
where is the radial coordinate, is the cross-correlation length, and is its power-law slope. This form is governed by two parameters. However, our limited statistics do not allow to uniquely constrain both and . Hence, we assume a value of for our analysis, which is chosen to allow for comparison with the quasar literature[Eilers2024]. We perform a fit to the binned data and sample a Poisson likelihood on a grid. We present the median of the posterior as our results on the cross-correlation length in Table LABEL:tab:cross_corr. Uncertainties reflect the confidence interval for a Poisson distribution that corresponds to in Gaussian statistics[Gehrels1986]. Figure E5 (left) presents our binned LRD-galaxy cross correlation measurement with , including the targeting completeness correction. The corresponding best-fit cross-correlation length is . Increasing the line-of-sight distance to to encompass all discovered nearby galaxies produces a consistent result (see Table LABEL:tab:cross_corr). A recent study[Eilers2024] finds for luminous quasars at . That our measurement of the LRD-galaxy cross correlation length is close to that of quasars, indicates that J1007_AGN, and by extension the wider population of LRDs, could be hosted in quasar-like () dark matter halos. However, we caution that our result is based on one LRD field with six (eight) galaxies. Quasar clustering[Eilers2024] at has shown a large quasar-to-quasar variance in their overdensities. This means that quasars are hosted in a wide distribution of dark matter halo masses[Pizzati2024]. In order to reduce the unconstrained systematic uncertainties from cosmic variance and from sampling a distribution of dark matter halo masses for LRDs, more expansive studies of LRD clustering are required.
Keeping in mind the limitations of our clustering measurement, we will continue to estimate the minimum dark matter halo mass of LRDs based on our cross-correlation measurement. Assuming that galaxies and LRDs trace the same underlying overdensities[GarciaVergara2017], the LRD-LRD auto-correlation can be expressed by the galaxy-galaxy auto-correlation and the LRD-galaxy cross-correlation according to
| (10) |
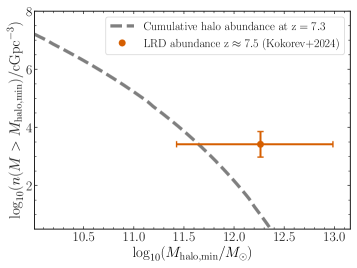
For our analysis we fix the slopes of the auto-correlation functions similar to previous work on quasars[ShenYue2007, Eftekharzadeh2015, GarciaVergara2017, Eilers2024], assuming and . As all of our identified galaxies show prominent [O iii] lines (Figure E3), we adopt a the recent measurement of the galaxy auto-correlation length, , at based on [O iii]-emitters[Eilers2024]. Using our cross-correlation length estimate for , , we derive an auto-correlation length of . We use predictions of a halo model framework (halomod)[Murray2013, Murray2021], to link the auto-correlation length to a minimum dark matter halo mass for LRDs at . Assuming that all LRDs live in dark matter halos with a minimum mass threshold , we predict the quasar auto-correlation function using the halo model for different . For each quasar auto-correlation function, we tabulate the auto-correlation length and the cumulative abundance of halos with . This allows us to link our estimate to a minimum halo mass. We calculate a minimum halo mass of with a corresponding abundance of . If we compare this value with the number density of LRDs[Kokorev2024] (, ), , it becomes evident that at a large range of the estimated minimum halo mass would be inconsistent with our current cosmology (see Figure E5, right). Assuming that LRDs subsample their host distribution, one can relate their number density and the minimum mass host halo abundance to their lifetime using the same arguments as for UV-luminous quasars[Haiman2001, Martini2001],
| (11) |
Here, denotes the Hubble time at redshift . We emphasize that the LRD lifetime is the average time period, in which we observe the source as an LRD. In this context, the ratio of LRD lifetime to Hubble time is referred to as the duty cycle . Based on the abundance of LRDs and our inferred cumulative halo abundance , we calculate a duty cycle of , resulting in a lifetime for LRDs of . We accounted for the uncertainties by calculating realizations drawn from our best-fit posterior for , assuming a log-normal distribution for and reporting the 16th to 84th percentiles as uncertainties.
We display the redshift evolution of the auto-correlation length, the minimum halo mass and the duty cycle for quasars, broad-line AGN, and our result for LRDs in Figure 4. The unphysical regime for duty cycles is marked in the gray region in the bottom panel. Furthermore, we recalculated the duty cycle for broad-line AGN[Arita2024] (orange square, ). In the original work, the authors integrate over a large range of halo mass abundances () well beyond their derived characteristic halo mass of . Adopting their result as a minimum halo mass, we use the same approach as above and calculate the halo abundance using halomod at . Figure 4 highlights the strong discrepancy between the duty cycles of luminous () quasars with measured from quasar clustering[Arita2023, Eilers2024, Pizzati2024a], quasar proximity zones[ChenHuanqing2022], and Ly damping wings[Davies2019, Durovcikova2024] compared to broad-line AGN[Arita2024] and LRDs with .
| Property | Value |
|---|---|
| Redshift | |
| Property | Value |
|---|---|
| Target ID | R.A. (J2000) | Dec. (J2000) | F090W | F115W | F277W | F444W | |
|---|---|---|---|---|---|---|---|
| (decimal degrees) | (nJy) | (nJy) | (nJy) | (nJy) | |||
| J1007_AGN | 151.978226 | 21.283994 | 7.2583 | 4.85 3.90 | 70.07 4.65 | 92.00 2.58 | 421.30 3.52 |
| J1007_10660 | 152.030665 | 21.254673 | 7.2022 | 2.75 7.70 | 65.71 8.64 | 82.61 5.57 | 184.26 7.25 |
| J1007_11721 | 152.024914 | 21.249581 | 7.2083 | 12.28 8.89 | 94.01 8.44 | 113.79 6.03 | 193.79 9.03 |
| J1007_11812 | 152.012827 | 21.249211 | 7.2193 | 2.50 6.87 | 35.67 6.94 | 53.74 3.43 | 229.07 5.38 |
| J1007_5524 | 152.001375 | 21.279459 | 7.2341 | 1.24 4.64 | 43.39 4.54 | 46.23 2.43 | 101.88 3.52 |
| J1007_9336 | 152.031510 | 21.260753 | 7.2458 | -0.13 4.42 | 21.59 4.28 | 32.42 2.66 | 70.22 4.00 |
| J1007_3984 | 151.982968 | 21.286523 | 7.2605 | 0.48 4.62 | 21.68 4.61 | 15.11 2.31 | 34.05 3.34 |
| J1007_3850 | 151.981961 | 21.287311 | 7.2612 | 3.59 4.15 | 35.25 4.30 | 26.62 2.40 | 50.84 3.16 |
| J1007_16615 | 151.985916 | 21.224606 | 7.2725 | -3.89 6.73 | 35.31 6.79 | 34.98 3.03 | 44.93 4.88 |
Note: In order to make the velocity shifts in Table LABEL:tab:galaxy_info consistent with the quoted redshift here, we provide a higher accuracy for the redshift than the nominal redshift uncertainty of from the fit.
| Target ID | Priority | Angular separation | Angular separation | ||||
|---|---|---|---|---|---|---|---|
| (arcseconds) | (mag) | ||||||
| J1007_10660 | 1 | -2038 | 205.16 | 1049.60 | |||
| J1007_11721 | 1 | -1817 | 199.70 | 1021.69 | |||
| J1007_11812 | 1 | -1416 | 170.75 | 873.55 | |||
| J1007_5524 | 1 | -879 | 79.35 | 405.96 | |||
| J1007_9336 | 1 | -455 | 197.37 | 1009.73 | |||
| J1007_3984 | 1 | 80 | 18.33 | 93.76 | |||
| J1007_3850 | 1 | 107 | 17.31 | 88.55 | |||
| J1007_16615 | 2 | 516 | 215.35 | 1101.72 |
Note: Given an accuracy on the emission line redshifts of the velocity along the line of sight has an uncertainty of .
| 0.1 | 0.6 | 2 | 0.04 | ||
|---|---|---|---|---|---|
| 0.6 | 2.6 | 1 | 0.42 | ||
| 2.6 | 7.6 | 3 | 1.63 | ||
| ; | |||||
| 0.1 | 0.6 | 2 | 0.07 | ||
| 0.6 | 2.6 | 1 | 0.69 | ||
| 2.6 | 7.6 | 5 | 2.72 | ||
| ; | |||||
References
- [1] Schmidt, T. M. et al. Mapping Quasar Light Echoes in 3D with Ly Forest Tomography. \JournalTitleApJ 882, 165 (2019). DOI 10.3847/1538-4357/ab2fcb. 1810.05156.
- [2] Hinshaw, G. et al. Nine-year Wilkinson Microwave Anisotropy Probe (WMAP) Observations: Cosmological Parameter Results . \JournalTitleThe Astrophysical Journal Supplement Series 208, 19 (2013). URL https://dx.doi.org/10.1088/0067-0049/208/2/19. DOI 10.1088/0067-0049/208/2/19.
- [3] Yang, J. et al. Pōniuāʻena: A Luminous z = 7.5 Quasar Hosting a 1.5 Billion Solar Mass Black Hole. \JournalTitleApJ 897, L14 (2020). URL https://ui.adsabs.harvard.edu/abs/2020ApJ...897L..14Y. DOI 10.3847/2041-8213/ab9c26. ADS Bibcode: 2020ApJ…897L..14Y.
- [4] Schlawin, E. et al. JWST Noise Floor. I. Random Error Sources in JWST NIRCam Time Series. \JournalTitleAJ 160, 231 (2020). DOI 10.3847/1538-3881/abb811. 2010.03564.
- [5] Bertin, E. & Arnouts, S. SExtractor: Software for source extraction. \JournalTitleA&AS 117, 393–404 (1996). DOI 10.1051/aas:1996164.
- [6] Kron, R. G. Photometry of a complete sample of faint galaxies. \JournalTitleApJS 43, 305–325 (1980). DOI 10.1086/190669.
- [7] Bouwens, R. J. et al. The Bright End of the and UV Luminosity Functions Using All Five CANDELS Fields*. \JournalTitleApJ 830, 67 (2016). DOI 10.3847/0004-637X/830/2/67. 1506.01035.
- [8] Giallongo, E. et al. The performance of the blue prime focus large binocular camera at the large binocular telescope. \JournalTitleA&A 482, 349–357 (2008). DOI 10.1051/0004-6361:20078402. 0801.1474.
- [9] van Dokkum, P. G. Cosmic-Ray Rejection by Laplacian Edge Detection. \JournalTitlePASP 113, 1420–1427 (2001). DOI 10.1086/323894. astro-ph/0108003.
- [10] Chambers, K. C. et al. The Pan-STARRS1 Surveys. \JournalTitlearXiv e-prints arXiv:1612.05560 (2016). DOI 10.48550/arXiv.1612.05560. 1612.05560.
- [11] Bertin, E. Automatic Astrometric and Photometric Calibration with SCAMP. In Gabriel, C., Arviset, C., Ponz, D. & Enrique, S. (eds.) Astronomical Data Analysis Software and Systems XV, vol. 351 of Astronomical Society of the Pacific Conference Series, 112 (2006).
- [12] Bertin, E. et al. The TERAPIX Pipeline. In Bohlender, D. A., Durand, D. & Handley, T. H. (eds.) Astronomical Data Analysis Software and Systems XI, vol. 281 of Astronomical Society of the Pacific Conference Series, 228 (2002).
- [13] Williams, C. C. et al. The JWST Extragalactic Mock Catalog: Modeling Galaxy Populations from the UV through the Near-IR over 13 Billion Years of Cosmic History. \JournalTitleApJS 236, 33 (2018). DOI 10.3847/1538-4365/aabcbb. 1802.05272.
- [14] Carnall, A. C., McLure, R. J., Dunlop, J. S. & Davé, R. Inferring the star formation histories of massive quiescent galaxies with BAGPIPES: evidence for multiple quenching mechanisms. \JournalTitleMNRAS 480, 4379–4401 (2018). DOI 10.1093/mnras/sty2169. 1712.04452.
- [15] Bonaventura, N., Jakobsen, P., Ferruit, P., Arribas, S. & Giardino, G. The Near-Infrared Spectrograph (NIRSpec) on the James Webb Space Telescope. V. Optimal algorithms for planning multi-object spectroscopic observations. \JournalTitleA&A 672, A40 (2023). DOI 10.1051/0004-6361/202245403. 2302.10957.
- [16] Prochaska, J. et al. PypeIt: The Python Spectroscopic Data Reduction Pipeline. \JournalTitleThe Journal of Open Source Software 5, 2308 (2020). DOI 10.21105/joss.02308. 2005.06505.
- [17] Schindler, J.-T. Sculptor: Interactive modeling of astronomical spectra. Astrophysics Source Code Library, record ascl:2202.018 (2022).
- [18] Vanden Berk, D. E. et al. Composite Quasar Spectra from the Sloan Digital Sky Survey. \JournalTitleAJ 122, 549–564 (2001). URL https://ui.adsabs.harvard.edu/abs/2001AJ....122..549V. DOI 10.1086/321167. astro-ph/0105231.
- [19] Boroson, T. A. & Green, R. F. The Emission-Line Properties of Low-Redshift Quasi-stellar Objects. \JournalTitleApJS 80, 109 (1992). DOI 10.1086/191661.
- [20] Vestergaard, M. & Wilkes, B. J. An Empirical Ultraviolet Template for Iron Emission in Quasars as Derived from I Zwicky 1. \JournalTitleApJS 134, 1–33 (2001). DOI 10.1086/320357. astro-ph/0104320.
- [21] Foreman-Mackey, D., Hogg, D. W., Lang, D. & Goodman, J. emcee: The MCMC Hammer. \JournalTitlePASP 125, 306 (2013). DOI 10.1086/670067. 1202.3665.
- [22] Peterson, B. M. et al. Central Masses and Broad-Line Region Sizes of Active Galactic Nuclei. II. A Homogeneous Analysis of a Large Reverberation-Mapping Database. \JournalTitleApJ 613, 682–699 (2004). DOI 10.1086/423269. astro-ph/0407299.
- [23] Matthee, J. et al. Little Red Dots: An Abundant Population of Faint Active Galactic Nuclei at z 5 Revealed by the EIGER and FRESCO JWST Surveys. \JournalTitleApJ 963, 129 (2024). URL https://ui.adsabs.harvard.edu/abs/2023arXiv230605448M. DOI 10.3847/1538-4357/ad2345. 2306.05448.
- [24] Greene, J. E. et al. UNCOVER Spectroscopy Confirms the Surprising Ubiquity of Active Galactic Nuclei in Red Sources at . \JournalTitleApJ 964, 39 (2024). DOI 10.3847/1538-4357/ad1e5f. 2309.05714.
- [25] Akins, H. B. et al. COSMOS-Web: The over-abundance and physical nature of “little red dots”–Implications for early galaxy and SMBH assembly. \JournalTitlearXiv e-prints arXiv:2406.10341 (2024). DOI 10.48550/arXiv.2406.10341. 2406.10341.
- [26] Stepney, M. et al. A big red dot: scattered light, host galaxy signatures, and multiphase gas flows in a luminous, heavily reddened quasar at cosmic noon. \JournalTitleMNRAS 533, 2948–2965 (2024). DOI 10.1093/mnras/stae1970. 2408.10403.
- [27] Brooks, M. et al. Here There Be (Dusty) Monsters: High Redshift AGN are Dustier Than Their Hosts. \JournalTitlearXiv e-prints arXiv:2410.07340 (2024). DOI 10.48550/arXiv.2410.07340. 2410.07340.
- [28] Akins, H. B. et al. Strong rest-UV emission lines in a “little red dot” AGN at : Early SMBH growth alongside compact massive star formation? \JournalTitlearXiv e-prints arXiv:2410.00949 (2024). DOI 10.48550/arXiv.2410.00949. 2410.00949.
- [29] Ma, Y. et al. UNCOVER: 404 Error – Models Not Found for the Triply Imaged Little Red Dot A2744-QSO1. \JournalTitlearXiv e-prints arXiv:2410.06257 (2024). DOI 10.48550/arXiv.2410.06257. 2410.06257.
- [30] Calzetti, D. et al. The Dust Content and Opacity of Actively Star-forming Galaxies. \JournalTitleApJ 533, 682–695 (2000). DOI 10.1086/308692. astro-ph/9911459.
- [31] Kaspi, S. et al. Reverberation measurements for 17 quasars and the size-mass-luminosity relations in active galactic nuclei. \JournalTitleThe Astrophysical Journal 533, 631 (2000). URL https://dx.doi.org/10.1086/308704. DOI 10.1086/308704.
- [32] Bentz, M. C., Peterson, B. M., Pogge, R. W., Vestergaard, M. & Onken, C. A. The radius-luminosity relationship for active galactic nuclei: The effect of host-galaxy starlight on luminosity measurements. \JournalTitleThe Astrophysical Journal 644, 133 (2006). URL https://dx.doi.org/10.1086/503537. DOI 10.1086/503537.
- [33] Vestergaard, M. Determining central black hole masses in distant active galaxies. \JournalTitleThe Astrophysical Journal 571, 733 (2002). URL https://dx.doi.org/10.1086/340045. DOI 10.1086/340045.
- [34] Greene, J. E. & Ho, L. C. Estimating Black Hole Masses in Active Galaxies Using the Emission Line. \JournalTitleApJ 630, 122–129 (2005). URL https://ui.adsabs.harvard.edu/abs/2005ApJ...630..122G. DOI 10.1086/431897. astro-ph/0508335.
- [35] Vestergaard, M. & Peterson, B. M. Determining Central Black Hole Masses in Distant Active Galaxies and Quasars. II. Improved Optical and UV Scaling Relationships. \JournalTitleApJ 641, 689–709 (2006). DOI 10.1086/500572. astro-ph/0601303.
- [36] Park, D., Kelly, B. C., Woo, J.-H. & Treu, T. Recalibration of the Virial Factor and M BH-∗ Relation for Local Active Galaxies. \JournalTitleApJS 203, 6 (2012). DOI 10.1088/0067-0049/203/1/6. 1209.3773.
- [37] Shen, Y. et al. A Catalog of Quasar Properties from Sloan Digital Sky Survey Data Release 7. \JournalTitleApJS 194, 45 (2011). DOI 10.1088/0067-0049/194/2/45. 1006.5178.
- [38] Fan, X., Bañados, E. & Simcoe, R. A. Quasars and the Intergalactic Medium at Cosmic Dawn. \JournalTitleARA&A 61, 373–426 (2023). DOI 10.1146/annurev-astro-052920-102455. 2212.06907.
- [39] Bertemes, C. et al. JWST ERS Program Q3D: The pitfalls of virial BH mass constraints shown in a z = 3 quasar with an ultramassive host. \JournalTitlearXiv e-prints arXiv:2404.14475 (2024). DOI 10.48550/arXiv.2404.14475. 2404.14475.
- [40] Harikane, Y. et al. A JWST/NIRSpec First Census of Broad-line AGNs at z = 4-7: Detection of 10 Faint AGNs with 106-108 and Their Host Galaxy Properties. \JournalTitleApJ 959, 39 (2023). URL https://ui.adsabs.harvard.edu/abs/2023ApJ...959...39H. DOI 10.3847/1538-4357/ad029e. 2303.11946.
- [41] Kokorev, V. et al. A Census of Photometrically Selected Little Red Dots at in JWST Blank Fields. \JournalTitlearXiv e-prints arXiv:2401.09981 (2024). DOI 10.48550/arXiv.2401.09981. 2401.09981.
- [42] Matsuoka, Y. et al. Quasar Luminosity Function at z = 7. \JournalTitleApJ 949, L42 (2023). DOI 10.3847/2041-8213/acd69f. 2305.11225.
- [43] Hennawi, J. F. et al. Binary Quasars in the Sloan Digital Sky Survey: Evidence for Excess Clustering on Small Scales. \JournalTitleAJ 131, 1–23 (2006). DOI 10.1086/498235. astro-ph/0504535.
- [44] García-Vergara, C., Hennawi, J. F., Barrientos, L. F. & Rix, H.-W. Strong Clustering of Lyman Break Galaxies around Luminous Quasars at Z 4. \JournalTitleApJ 848, 7 (2017). DOI 10.3847/1538-4357/aa8b69. 1701.01114.
- [45] Bouwens, R. J., Illingworth, G., Ellis, R. S., Oesch, P. & Stefanon, M. Galaxies Magnified by the Hubble Frontier Field Clusters. II. Luminosity Functions and Constraints on a Faint-end Turnover. \JournalTitleApJ 940, 55 (2022). DOI 10.3847/1538-4357/ac86d1. 2205.11526.
- [46] Eilers, A.-C. et al. EIGER VI. The Correlation Function, Host Halo Mass and Duty Cycle of Luminous Quasars at . \JournalTitlearXiv e-prints arXiv:2403.07986 (2024). DOI 10.48550/arXiv.2403.07986. 2403.07986.
- [47] Gehrels, N. Confidence Limits for Small Numbers of Events in Astrophysical Data. \JournalTitleApJ 303, 336 (1986). DOI 10.1086/164079.
- [48] Pizzati, E. et al. A unified model for the clustering of quasars and galaxies at . \JournalTitlearXiv e-prints arXiv:2403.12140 (2024). DOI 10.48550/arXiv.2403.12140. 2403.12140.
- [49] Shen, Y. et al. Clustering of High-Redshift () Quasars from the Sloan Digital Sky Survey. \JournalTitleAJ 133, 2222–2241 (2007). DOI 10.1086/513517. astro-ph/0702214.
- [50] Eftekharzadeh, S. et al. Clustering of intermediate redshift quasars using the final SDSS III-BOSS sample. \JournalTitleMNRAS 453, 2779–2798 (2015). DOI 10.1093/mnras/stv1763. 1507.08380.
- [51] Murray, S. G., Power, C. & Robotham, A. S. G. HMFcalc: An online tool for calculating dark matter halo mass functions. \JournalTitleAstronomy and Computing 3, 23 (2013). DOI 10.1016/j.ascom.2013.11.001. 1306.6721.
- [52] Murray, S. G. et al. THEHALOMOD: An online calculator for the halo model. \JournalTitleAstronomy and Computing 36, 100487 (2021). DOI 10.1016/j.ascom.2021.100487. 2009.14066.
- [53] Haiman, Z. & Hui, L. Constraining the Lifetime of Quasars from Their Spatial Clustering. \JournalTitleApJ 547, 27–38 (2001). DOI 10.1086/318330. astro-ph/0002190.
- [54] Martini, P. & Weinberg, D. H. Quasar Clustering and the Lifetime of Quasars. \JournalTitleApJ 547, 12–26 (2001). DOI 10.1086/318331. astro-ph/0002384.
- [55] Arita, J. et al. The nature of low-luminosity AGNs discovered by JWST at based on clustering analysis: ancestors of quasars at ? \JournalTitlearXiv e-prints arXiv:2410.08707 (2024).
- [56] Arita, J. et al. Subaru High-z Exploration of Low-luminosity Quasars (SHELLQs). XVIII. The Dark Matter Halo Mass of Quasars at z 6. \JournalTitleApJ 954, 210 (2023). DOI 10.3847/1538-4357/ace43a. 2307.02531.
- [57] Pizzati, E., Hennawi, J. F., Schaye, J. & Schaller, M. Revisiting the extreme clustering of z 4 quasars with large volume cosmological simulations. \JournalTitleMNRAS 528, 4466–4489 (2024). DOI 10.1093/mnras/stae329. 2311.17181.
- [58] Chen, H. et al. Measuring the Density Fields around Bright Quasars at with XQR-30 Spectra. \JournalTitleApJ 931, 29 (2022). DOI 10.3847/1538-4357/ac658d. 2110.13917.
- [59] Davies, F. B., Hennawi, J. F. & Eilers, A.-C. Evidence for Low Radiative Efficiency or Highly Obscured Growth of Quasars. \JournalTitleApJ 884, L19 (2019). DOI 10.3847/2041-8213/ab42e3. 1906.10130.
- [60] Ďurovčíková, D. et al. Chronicling the Reionization History at with Emergent Quasar Damping Wings. \JournalTitleApJ 969, 162 (2024). DOI 10.3847/1538-4357/ad4888. 2401.10328.