A supermassive black hole in the early universe growing in the shadows
Abstract
Early JWST observations have uncovered a new, substantial population of red sources that might represent a previously overlooked phase of actively growing supermassive black holes[1, 2, 3]. One of the most intriguing examples is an extremely red, point-like object that was found to be triply-imaged by the strong lensing galaxy cluster Abell 2744[4], allowing an unprecedented detailed look into this enigmatic population. Here we present deep spectroscopic JWST/NIRSpec observations of this object, Abell2744-QSO1. The spectroscopy confirms that the three images are of the same object, and that it is a highly reddened () broad emission-line Active Galactic Nucleus (AGN) at a redshift of . From the width of H () we derive a black hole mass of . We infer a very high ratio of black hole to galaxy mass of at least 3 % and possibly as high as 100 %, an order of magnitude or more than is seen in local galaxies. The lack of strong metal lines in the spectrum together with the high bolometric luminosity () suggest that we are seeing the black hole in a phase of rapid growth, accreting at 30 % of the Eddington limit. Based on early JWST imaging studies we estimate that such heavily reddened, low-mass black holes can be times more common than UV-selected ones at this epoch. The rapid growth and high black hole to galaxy mass ratio of A2744-QSO1 suggests that it may represent the missing link between black hole seeds[5, 6, 7] and the first luminous quasars[8].
Physics Department, Ben-Gurion University of the Negev, P.O. Box 653, Beer-Sheva 8410501, Israel
Centre for Astrophysics and Supercomputing, Swinburne University of Technology, Melbourne, VIC 3122, Australia
Department of Astrophysical Sciences, Princeton University, 4 Ivy Lane, Princeton, NJ 08544
Kapteyn Astronomical Institute, University of Groningen, P.O. Box 800, 9700 AV Groningen, The Netherlands
Institut d’Astrophysique de Paris, CNRS, Sorbonne Université, 98bis Boulevard Arago, 75014, Paris, France
Department of Astronomy, Yale University, New Haven, CT 06511, USA
Center for Interdisciplinary Exploration and Research in Astrophysics (CIERA) and Department of Physics and Astronomy, Northwestern University, 1800 Sherman Ave, Evanston IL 60201, USA
Department of Physics and Astronomy and PITT PACC, University of Pittsburgh, Pittsburgh, PA 15260, USA
Cosmic Dawn Center (DAWN), Niels Bohr Institute, University of Copenhagen, Jagtvej 128, København N, DK-2200, Denmark
Department of Astronomy, University of Massachusetts, Amherst, MA 01003, USA
Department of Astronomy & Astrophysics, The Pennsylvania State University, University Park, PA 16802, USA
Institute for Computational & Data Sciences, The Pennsylvania State University, University Park, PA 16802, USA
Institute for Gravitation and the Cosmos, The Pennsylvania State University, University Park, PA 16802, USA
Department of Physics and Astronomy, Tufts University, 574 Boston Ave., Medford, MA 02155, USA
Center for Astrophysics Harvard & Smithsonian, 60 Garden Street, Cambridge, MA 02138, USA
Centre for Astrophysics Research, Department of Physics, Astronomy and Mathematics, University of Hertfordshire, Hatfield AL10 9AB, UK
Department of Astronomy, Yale University, New Haven, CT 06511, USA
Department of Astronomy, The University of Texas at Austin, Austin, TX 78712, USA
Institute for Computational Science, University of Zurich, CH-8057 Zurich, Switzerland
Waseda Research Institute for Science and Engineering, Faculty of Science and Engineering, Waseda University, 3-4-1 Okubo, Shinjuku, Tokyo 169-8555, Japan
National Astronomical Observatory of Japan, 2-21-1, Osawa, Mitaka, Tokyo, Japan
Max-Planck-Institut für Astronomie, Königstuhl 17, 69117 Heidelberg, Germany
NSF’s National Optical-Infrared Astronomy Research Laboratory, 950 N. Cherry Avenue, Tucson, AZ 85719, USA
Department of Astronomy, University of Wisconsin-Madison, 475 N. Charter St., Madison, WI 53706 USA
Department for Astrophysical and Planetary Science, University of Colorado, Boulder, CO 80309, USA
Department of Astronomy, University of Geneva, Chemin Pegasi 51, 1290 Versoix, Switzerland
Steward Observatory, University of Arizona, 933 N Cherry Ave, Tucson, AZ 85721 USA
A2744-QSO1[4] was discovered in JWST/Near Infrared Camera[9] (NIRCam) pre-imaging from the Ultra-deep NIRSpec and NIRCam ObserVations before the Epoch of Reionization[10] (UNCOVER) program, behind the Hubble Frontier Fields[11] (HFF) SL cluster Abell 2744[12, 13, 14, 11] (; A2744 hereafter), known to be capable of significantly magnifying distant background objects[15, 16, 17, 18, 19]. It had been identified as a UV-faint (), lensed high-redshift candidate[20, 16], but remained an otherwise inconspicuous source in previous m observations with the Hubble Space Telescope (HST). The NIRCam m imaging revealed it to be an unusually red (F277W F444W; F356W F444W ), unresolved point-source triply imaged by the foreground cluster[4], with the high-redshift nature of the source further supported geometrically by the lensing configuration. A photometric redshift was obtained by modeling the multi-band HST and JWST (F814W, F115W, F150W, F200W, F277W, F356W, F410M, F444W) spectral energy distribution (SED). The unique SED, combined with the point-like light-profile, hinted that the source may be a highly reddened AGN at redshift [4, 3].
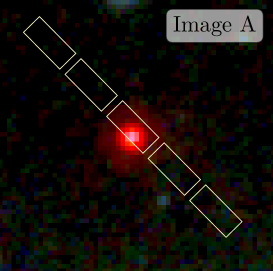
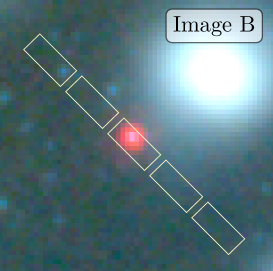
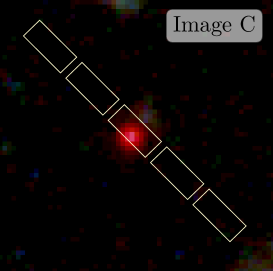
The three images of A2744-QSO1 were recently targeted with the Near Infrared Spectrograph[21, 22, 23] (NIRSpec) aboard JWST as part of the UNCOVER program (see Fig. 1). The observations were taken July 31 - August 2 2023, using NIRSpec’s multi-shutter array (MSA) mode with the low resolution prism disperser, which covers the wavelength range at spectral resolutions . The exposure times for the three images ranged from h. The spectra of three images are stacked to result in one h spectrum, the deepest spectrum so far of any single high-redshift object observed with JWST. After correcting for gravitational magnifications[19] of , and , this spectrum reaches effective limits up to AB at in the continuum at 1.5 micron, equivalent to integrating for h in a blank field.
The spectrum shown in Fig. 2 features several strong Hydrogen emission lines – a prominent Balmer-series with H, H, H and somewhat weaker H, as well as Lyman- – along with a weak [O iii] Å-doublet and several faint metal lines. A full list of emission lines is given in Tab. 1. The emission lines securely confirm this object at .
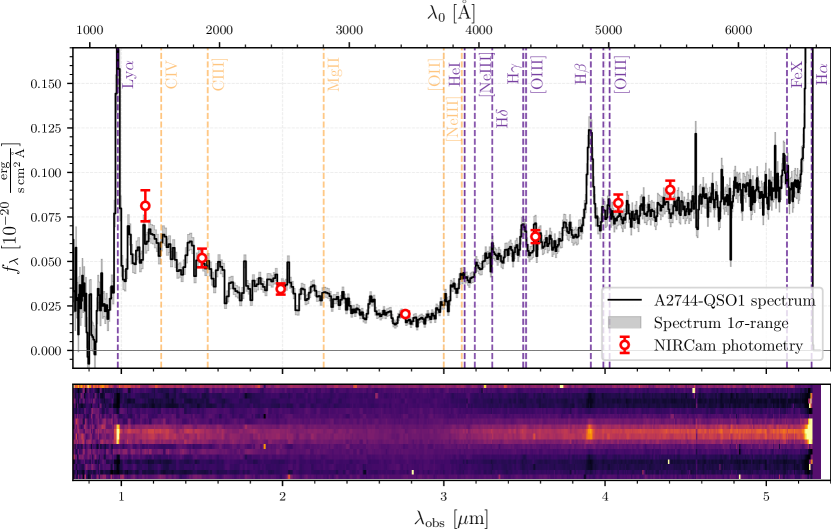
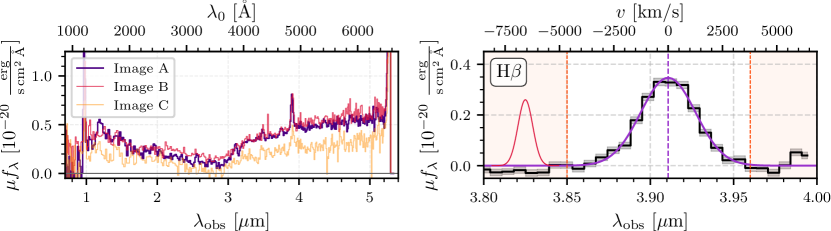
The spectrum provides unambiguous evidence that A2744-QSO1 is an AGN, showing broad emission lines. We measure the emission-line width by fitting a single-component Gaussian to H. Note that H is situated at the very edge of the detector and thus requires more sophisticated modeling (see Methods). For H, we find a line-width full-width at half-maximum (FWHM) of , well-resolved, even at the relatively low resolution of the prism (see Fig. 2). Such line widths are not seen in star-forming galaxies but routinely observed in the broad-line regions of AGN, where gas clouds orbit the supermassive black hole[24]. The Balmer emission line ratio (H to H) indicates a strong dust attenuation of , assuming an SMC extinction law[25]. Note that flatter attenuation curves yield higher . Atacama Large Millimeter/sub-millimeter Array (ALMA) 1.2 mm observations firmly rule out dusty star formation powering the Balmer lines. If caused by star formation, the emission lines would imply an on-going star-formation rate (SFR) of and a corresponding mJy ALMA 1.2 mm flux, whereas no emission is observed to mJy (at ) in the deep ALMA map.
From the width of the H line (see Fig. 2), we derive the black hole mass . Using standard scaling relations[26], we calculate a black hole mass of . Note that single-epoch black hole masses are prone to an additional systematic uncertainty of 0.5 dex[27]. Based on the emission line luminosity, we further derive a bolometric luminosity of (see Fig. 3). The black hole must accrete about a tenth of a solar mass per year to maintain this luminosity, which roughly corresponds to 30 % of the Eddington limit – set by the balance between gravity and radiation pressure assuming spherical accretion ().
We can also place a limit on the hidden stellar mass of the host galaxy based on the light profile. All three images appear as point-sources, despite different lensing magnifications by a factor 2, which suggests that the intrinsic size of the source is smaller than the point spread function (PSF) of the highest-magnification image. To derive formal upper limits on the size, we fit a Sérsic[28] model to the source in the (highest-resolution) F115W-band, finding the source to be unresolved with a size pc (95 % upper limit) after correcting for the lensing shear (equivalent to less than half the size of the PSF). Adopting an upper stellar density limit equal to that of the densest star clusters[29, 30] or the densest elliptical galaxy progenitors [31, 32] known to date, , we can then derive an upper limit for how much stellar mass may be contained within pc, thus obtaining . Our prior photometric fit including ALMA 1.1 mm constraints returns a stellar mass upper limit that is consistent with this estimate[3]. The implied -ratio of is extreme compared to local values () but similar to some other recently discovered high-redshift black holes [33, 34].
| Emission Line | [Å] | [m] | [Å] | |
|---|---|---|---|---|
| Ly | ||||
| Mg ii | , | |||
| He i | ||||
| [Ne iii] | ||||
| H | ||||
| H | ||||
| [O iii] | ||||
| H | ||||
| [O iii] | ||||
| [O iii] | ||||
| [Fe x] | ||||
| [N ii] | ||||
| H |
The spectrum of A2744-QSO1 (Fig. 2) exhibits some distinct characteristics compared to typical AGN[35] and other moderate-luminosity AGN discovered with JWST [1, 36]. The optical continuum is very red, and the metal or high-ionization lines (e.g. the C iv Å, C iii] Å and Mg ii Å-doublets in the rest-frame UV, and the [O iii]-doublet in the rest-frame optical) are weak compared to the Hydrogen lines (see Fig. 2 and Tab. 1). Furthermore, using the latest 1.25 Ms of X-ray imaging obtained by the Chandra X-ray Observatory, we find that all three source images are undetected in X-ray (see Methods). The combined upper limit on the X-ray luminosity for all three images is , at least weaker than expected based on the UV/optical. This combination of properties strongly suggests that A2744-QSO1 harbors a powerful dusty wind, as are seen in low-mass rapidly accreting black holes at low redshift[37], but such dusty wind-dominated sources are very rare at cosmic noon [38]. In fact, many black holes radiating at or above their Eddington limits display these unique properties[39, 40] perhaps because of changes in the structure of their accretion disk[41]. Our estimated Eddington ratio of three is consistent with these characteristics.
A2744-QSO1 represents one of the first examples of a heavily reddened broad-line AGN at such high redshift identified with JWST, although early hints existed also in prior work[42, 43]. These are too UV-faint, however, to have been discovered by past ground-based photometric searches [44], but many similar compact red objects have been detected in JWST surveys since[36, 2, 3], as well as other high-redshift AGN[1, 45, 46, 36, 47, 48], including behind A2744[49, 34]. In fact, another red AGN identified in UNCOVER[3] has a spectroscopic redshift of , consistent with A2744-QSO1, suggesting these objects may be clustered. Indeed, three out of seven similar objects found in a blank field study[2] were also at similar redshifts to each other. Nevertheless, A2744-QSO1, remains an important case. As the highest-redshift quasar-like object multiply imaged by a galaxy cluster known to date it affords exquisite signal-to-noise for such a low-luminosity object.
We derive the spatial number density of A2744-QSO1-type objects by taking the sample of “red dots” detected in UNCOVER[3] and verifying how many of them are confirmed at the same redshift and UV luminosity with the UNCOVER spectroscopy and updated SL model. This yields a number of two, A2744-QSO1 included, which translates to a number density of . Note that this number density is consistent with what we found based on photometry in UNCOVER[3] () and also with what has been found for reddened AGN identified in JWST blank fields[2]. While this represents only a few percent of galaxies at this epoch[50, 51], it is times more numerous than the faintest ground-based UV-selected AGN[44]. Because the UV-luminosity of A2744-QSO1 is only , finding this extremely red point source at high redshifts required the unprecedented infrared-sensitivity of JWST combined with gravitational lensing.
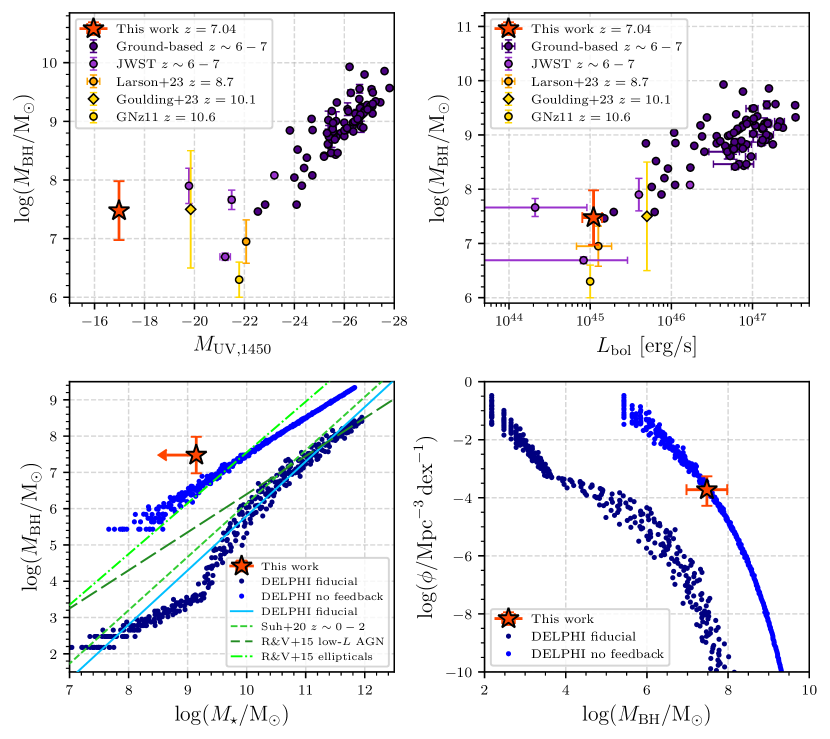
A2744-QSO1 is a significant outlier, both in terms of its -ratio (which is still just a lower limit as we do not detect the host galaxy) and the expected number density when compared to theoretical models[53, 54, 57]. We use the DELPHI semi-analytic model, that has been shown to reproduce star-forming galaxy luminosity functions at along with prior AGN luminosity functions. Assuming black hole seeds with a seed mass of originating from metal-free stars, the model predicts that black holes as massive as A2744-QSO1 should be hosted by galaxies with a stellar mass of about (Fig. 3). The model under-predicts the number density of A2744-QSO1-like objects, and also predicts much lower ratios. It is worth noting that hydrodynamic simulations make similar predictions at [57, 58], although typically starting with heavier seeds (). The models also do not predict the high number density associated with A2744-QSO1, which can only be reproduced by our extreme model without any feedback (see Fig. 3). This is in conflict with the hints of strong outflows in our source
The discovery of A2744-QSO1 shows that our understanding of black hole growth in the early Universe is still incomplete. The photometric samples suggest high number densities, such that a few percent of galaxies at harbor reddened and rapidly growing black holes. Deep spectroscopic follow-up with JWST will be needed to confirm these number densities and elucidate their properties. The hints of extreme black hole to galaxy ratios, of a few percent or more, will put strong new constraints on when black holes form relative to their galaxies. There are many outstanding puzzles about these objects remaining that JWST is only beginning to address.
0.1 JWST, ALMA, and Chandra observations
The UNCOVER observations used in this work comprise both ultra-deep JWST imaging and spectroscopy of the A2744-field with NIRCam and NIRSpec to -depths of magnitudes each[10, 59]. Since gravitational magnification on average adds magnitudes to the depth in the SL regime, UNCOVER reaches effective depths of AB once the magnification is factored-in. The NIRCam data cover a total area of in six broad- and one medium-band filter: F115W, F150W, F200W, F277W, F356W, F410M and F444W. The data were reduced and drizzled into mosaics with the Grism redshift and line analysis software for space-based slitless spectroscopy[60] (grizli; v1.6.0). The UNCOVER mosaics, which also include other public JWST imaging data (i.e. the JWST-GLASS imaging[61] and DDT program 2756; PI: W. Chen) and were made publicly available on the UNCOVER website111https://jwst-uncover.github.io/DR1.html#Mosaics. The photometry for all three images of A2744-QSO1 can be found in Table 1 of the discovery paper for A2744-QSO1[4].
The NIRSpec component of the UNCOVER survey consists of seven micro-shutter array (MSA) pointings on the A2744-field with various exposure times between h and h, totalling 24 h NIRSpec time and 680 targeted objects. The observations follow a 2-point dither pattern and a 3-shutter slit-let nod pattern at a position angle of . We use the NIRSpec-prism as dispersion element, thus achieving spectral resolutions of in wavelengths spanning . The prism data were reduced with MSAEXP[62] (v0.6.10). The code works on individual frames to correct for -noise, find and mask snowballs, and remove the bias. The pipeline first applies a WCS, and then identifies each slit and applies the flat-fielding and photometric corrections. The 2D-slits are then extracted and drizzled onto a common grid. The details of the observational setup and reduced data products, planned for public release before JWST Cycle 3, will be presented in Price et al. (in prep.). All three images of A2744-QSO1 were included in the MSA designs with cumulated exposure times h, h and h for images A, B and C respectively.
In addition, A2744 is part of the ALMA Frontier Fields survey[63], which obtained first deep 1.1 mm imaging of the cluster core. These data have now recently been complemented with additional observations covering the entire UNCOVER footprint (Program ID: 2022.1.00073.S; PI: S. Fujimoto), achieving 1 depths down to 32.7 Jy/beam over an area of 24 arcmin2. The UNCOVER ALMA data will also be publicly released shortly in Fujimoto et al. (in prep).
A2744 has also been the subject of sensitive X-ray follow-up observations using the Chandra X-ray observatory (PI: A. Bogdan). The 1.25 Ms of Chandra ACIS data used here was previously reduced, analyzed and presented in the supplementary materials section of Bogdan et al.[49]. We use these data products to perform forced photometry at the locations of the three images of A2744-QSO1. Images A and B are heavily contaminated by the foreground X-ray gas associated with A2744 itself. Image C provides the cleanest (lowest-background) region to perform an X-ray analysis of A2744-QSO1, however, we find no significant detection of an X-ray point source. We place a upper limit of photons in the keV energy band, i.e. a flux limit of assuming a typical AGN X-ray power-law slope of , equivalent to a de-magnified X-ray luminosity of at the redshift of A2744-QSO1. Stacking and de-magnifying all three images produces a marginal increase in sensitivity, owing to the increased magnification but higher backgrounds of images A and B of .
0.2 Gravitational lensing
Throughout this work we use the most recent SL model of A2744 by Furtak et al.[19], which is based on UNCOVER data and publicly available222Version v1.1 of the UNCOVER lens model: https://jwst-uncover.github.io/DR1.html#LensingMaps.. The model is slightly updated here with one new multiple image system and an additional spectroscopic redshift[18]. The model was constructed using a new implementation of the Zitrin-parametric code[64, 65, 19] , which is not coupled to a fixed grid resolution and thus capable of high resolution results. For the model, the cluster galaxies are modeled each as a double Pseudo Isothermal Ellipsoid[66] (dPIE), scaled according to its luminosity using common scaling relations motivated by the fundamental plane. Three of the brightest cluster galaxies (BCGs), as well as several other galaxies situated close to multiple images, are modeled independently. We use 421 cluster galaxies throughout the UNCOVER field-of-view, more than half of which are spectroscopically confirmed[17]. The rest were chosen based on the cluster’s red-sequence, identified in a color-magnitude diagram based on the HST/ACS F606W- and F814W-bands bracketing their 4000 Å-break. Five cluster-scale dark matter (DM) halos are employed, each modeled as a pseudo isothermal elliptical mass distribution[67, 68] (PIEMD). These DM halos are centered on the five BCGs but for three of them, the central position can be iterated for in the minimization process within a couple of arc-seconds around their respective BCG’s position. As constraints, 141 multiple images (belonging to 48 sources) are used, 96 of which have spectroscopic redshifts. The vast majority of these is situated in the main cluster core just like A2744-QSO1. The minimization is performed in the source plane using a -step MCMC process. For the minimization and uncertainty estimation, we use a positional uncertainty of for each multiple image. The resulting model has a very good image reproduction RMS of in the lens plane. We infer magnifications and 95% confidence intervals of , and for images A, B and C respectively. These are only very slightly different from the magnifications presented in Furtak et al.[4] and are in generally good agreement with the photometric flux ratios.
0.3 Spectroscopic analysis
We use the image multiplicity of A2744-QSO1 to achieve maximum signal-to-noise by stacking the weighted, local-background subtracted and co-added spectra of the three images. The spectrum is then extracted with MSAEXP using an optimal extraction[69] and collapsed to a 1D-spectrum. Taking the magnification into account, the effective exposure time of this stacked spectrum is of about 1700 h. The flux-calibration is then performed by bootstrapping to the total photometry of image A, which has the cleanest photometric measurement[4]. Wavelength-dependent corrections are modeled with a first-order polynomial.
The final stacked spectrum of A2744-QSO1 displays numerous emission lines and is shown in Fig. 2. For the most robust emission line in our spectrum, the Balmer line H, we use specutils[70] (v1.10.0) to fit a Gaussian profile to the continuum-subtracted emission line and estimate the uncertainties with an MCMC-analysis using emcee[71] (v3.1.4). Our line-fit explicitly includes the NIRSpec line-spread-function (LSF) into the model at the wavelength of H. The used in the following is therefore intrinsic, i.e. corrected for instrumental effects. H is more challenging to model as the red wing of the spectrum falls off the detector and it is blended with [N ii] Å. In addition, the line profile appears to shows a narrow component on top of the broad wing, which is not well described by a single Gaussian. For completeness, we therefore proceed to model H, [N ii] , H, and [O iii] jointly, fixing the metal lines to FWHM, restricting the narrow-to-broad line ratio to be the same for H and H, but allowing for different line widths between H, and H. Encouragingly, the fit parameters are well constrained and reproduce the single-Gaussian broad line width of H, while finding a smaller FWHM for the broad component of H as is commonly seen in low redshift AGN[26]. Other spectral lines are identified and modeled with single Gaussians and presented in Tab. 1.
We derive a Balmer decrement of from the Balmer line measurements in Tab. 1. Assuming an reddening law based on fits to the Small Magellanic Cloud[25] (SMC) and for [72, 73] we find , ), and . The line fluxes are corrected for this high level of attenuation before black hole mass and Eddington ratio calculations are made. We note that if we assumed a flatter reddening law [74], the reddening corrections would be larger as would the bolometric luminosity[75]. While the Balmer decrement in the broad-line region arises in part within the broad-line region itself[76], we note that we derive very comparable from the photometric modeling[4, 3].
To investigate a possible SFR origin of the Balmer lines, we convert the dust-corrected H luminosity to an SFR[77], resulting in an on-going SFR and predict the infrared fluxes using the Flexible Stellar Population Synthesis code[78], which implements the Draine & Li[draine01] dust model. The predicted ALMA 1.2 mm fluxes are mJy in contrast with a upper limit of mJy based on the deep ALMA map.
We use the H and H line widths and attenuation-corrected line fluxes to estimate the single-epoch black hole mass. Because we do not measure the intrinsic continuum, we use the de-reddened Balmer line luminosity to calculate [26]. We find a black hole mass of , taking the average of H and H, which are consistent with each. The errors reflect both line width uncertainty and differences between H and H that may result from systematic effects like reddening corrections. The additional systematic uncertainty term on single-epoch black hole masses is estimated to be dex[27]. We find a bolometric luminosity of erg s-1, assuming a bolometric correction of [79]. The continuum luminosity estimated in [4] is higher than this estimate by nearly a factor of ten, resulting from uncertainties in quantities like the redshift and the reddening. We thus infer an Eddington ratio of .
0.4 Size measurement
Furtak et al.[4] used galfit[80] measurements to the individual images of A2744-QSO1, in all available broad bands from F115W to F444W, together with the fact that all three images appear as point sources despite suffering different amounts of shear and magnification, to conclude that the object was indeed point-like and from the PSF size to obtain a source size estimate of pc[4].
Here we revisit this size estimate with the most up-to-date PSF models and data reduction. Using pysersic[81], we fit a single Sérsic model to the F150W image. We find a firm upper limit on the size of milli-arcseconds, which translates to a upper limit of pc for the lensed image. Applying a lensing correction of – the tangential shear in the most magnified image – we then confirm a firm upper limit of 30 pc on the source radius, in agreement with the Furtak et al. measurement[4].
0.5 Number density
In order to derive the number density of objects like A2744-QSO1, it is needed to compute the corresponding effective co-moving volume which folds-in the lensing distortion and possible selection effects. This is done following a forward-modeling approach[51], the detailed procedure of which will be published in Chemerynska et al. (in prep.): We use the (de-magnified) SED of A2744-QSO1 to populate the UNCOVER source plane of A2744[19] with 10000 similar mock sources. These are then deflected into the lens plane and injected in the UNCOVER mosaics on which we re-run the source detection and selection methods used for the catalogs[59, 82]. The ratio of recovered to injected sources allows us to determine the selection-function for objects such as A2744-QSO1. This selection-function is multiplied with the co-moving volume element which is then integrated over the source-plane area of sufficient magnification that allows us to detect the source at in each NIRCam band, given the UNCOVER mosaic depths[59]. The thus obtained effective volume for A2744-QSO1 is .
0.6 Theoretical expectation
We compare our results to the Dark matter and the Emergence of gaLaxies in the ePocH of reIonization[53, 54] (DELPHI) semi-analytic model. This is suited to jointly track the assembly of the dark matter, baryonic and black hole components of high-redshift () galaxies up to . Starting at , we build analytic (binary) merger trees for 700 galaxies equally spaced in log-space in the halo mass range using a constant time-step of 30 Myr. Each of these halos is assigned a number density according to the Sheth-Tormen halo mass function[83] at and the number density propagated throughout the merger tree.
In this work, we only consider seeding by stellar black hole seeds formed from metal-free (Pop. III) stars. The first halos (starting leaves) of any halo are seeded with a stellar black hole (of 150 ) at assuming that halos collapsing from high ()- fluctuations in the primordial density field are most likely to host such seeds. At any time-step, the initial gas mass is the sum of that brought-in by mergers and smooth accretion. A fraction of this gas can form stars with an efficiency that is the minimum between the Supernovae (SN II) energy required to unbind the rest of the gas and an upper threshold . In terms of black holes, in our fiducial model, these grow both through (instantaneous) mergers and accretion. A fraction of the gas mass left in the halo after star formation and its associated feedback can be accreted onto the black hole with the accretion rate depending on a critical halo mass (which at corresponds to ). While black holes in lower mass halos are assumed to have puffed-up disks, only allowing for low accretion rates ( Eddington), black holes in halos above this critical mass can accrete a fixed fraction of the gas mass up to the Eddington limit; a fraction of the black hole energy (0.3 %) is allowed to couple to the gas content. The maximal (no feedback) model presents an upper limit where every black hole is always allowed to accrete the gas mass available, up to the Eddington limit and we ignore gas mass lost in outflows, both due to SN II and black hole feedback.
The model has been tuned to reproduce all the key observables for both star-forming galaxies at (including the evolving UV luminosity and stellar mass functions) and AGN at (including the AGN UV luminosity and black hole mass functions).
References
- [1] Kocevski, D. D. et al. Hidden Little Monsters: Spectroscopic Identification of Low-Mass, Broad-Line AGN at with CEERS. arXiv e-prints arXiv:2302.00012 (2023).
- [2] Matthee, J. et al. Little Red Dots: an abundant population of faint AGN at revealed by the EIGER and FRESCO JWST surveys. arXiv e-prints arXiv:2306.05448 (2023).
- [3] Labbe, I. et al. UNCOVER: Candidate Red Active Galactic Nuclei at with JWST and ALMA. arXiv e-prints arXiv:2306.07320 (2023).
- [4] Furtak, L. J. et al. JWST UNCOVER: Extremely Red and Compact Object at z phot 7.6 Triply Imaged by A2744. ApJ 952, 142 (2023).
- [5] Inayoshi, K., Visbal, E. & Haiman, Z. The Assembly of the First Massive Black Holes. ARA&A 58, 27–97 (2020).
- [6] Greene, J. E., Strader, J. & Ho, L. C. Intermediate-Mass Black Holes. ARA&A 58, 257–312 (2020).
- [7] Volonteri, M., Habouzit, M. & Colpi, M. The origins of massive black holes. Nature Reviews Physics 3, 732–743 (2021).
- [8] Fan, X., Banados, E. & Simcoe, R. A. Quasars and the Intergalactic Medium at Cosmic Dawn. arXiv e-prints arXiv:2212.06907 (2022).
- [9] Rieke, M. J. et al. Performance of NIRCam on JWST in Flight. PASP 135, 028001 (2023).
- [10] Bezanson, R. et al. The JWST UNCOVER Treasury survey: Ultradeep NIRSpec and NIRCam ObserVations before the Epoch of Reionization. arXiv e-prints arXiv:2212.04026 (2022).
- [11] Lotz, J. M. et al. The Frontier Fields: Survey Design and Initial Results. ApJ 837, 97 (2017).
- [12] Abell, G. O., Corwin, H. G., Jr. & Olowin, R. P. A catalog of rich clusters of galaxies. ApJS 70, 1–138 (1989).
- [13] Allen, S. W. Resolving the discrepancy between X-ray and gravitational lensing mass measurements for clusters of galaxies. MNRAS 296, 392–406 (1998).
- [14] Ebeling, H. et al. The X-ray brightest clusters of galaxies from the Massive Cluster Survey. MNRAS 407, 83–93 (2010).
- [15] Merten, J. et al. Creation of cosmic structure in the complex galaxy cluster merger Abell 2744. MNRAS 417, 333–347 (2011).
- [16] Mahler, G. et al. Strong-lensing analysis of A2744 with MUSE and Hubble Frontier Fields images. MNRAS 473, 663–692 (2018).
- [17] Bergamini, P. et al. New high-precision strong lensing modeling of Abell 2744. Preparing for JWST observations. A&A 670, A60 (2023).
- [18] Bergamini, P. et al. The GLASS-JWST Early Release Science Program. III. Strong-lensing Model of Abell 2744 and Its Infalling Regions. ApJ 952, 84 (2023).
- [19] Furtak, L. J. et al. UNCOVERing the extended strong lensing structures of Abell 2744 with the deepest JWST imaging. MNRAS 523, 4568–4582 (2023).
- [20] Atek, H. et al. Probing the Universe with the First Hubble Frontier Fields Cluster A2744. ApJ 786, 60 (2014).
- [21] Jakobsen, P. et al. The Near-Infrared Spectrograph (NIRSpec) on the James Webb Space Telescope. I. Overview of the instrument and its capabilities. A&A 661, A80 (2022).
- [22] Böker, T. et al. In-orbit Performance of the Near-infrared Spectrograph NIRSpec on the James Webb Space Telescope. PASP 135, 038001 (2023).
- [23] Ferruit, P. et al. The Near-Infrared Spectrograph (NIRSpec) on the James Webb Space Telescope. II. Multi-object spectroscopy (MOS). A&A 661, A81 (2022).
- [24] Hao, L. et al. Active Galactic Nuclei in the Sloan Digital Sky Survey. II. Emission-Line Luminosity Function. AJ 129, 1795–1808 (2005).
- [25] Gordon, K. D., Clayton, G. C., Misselt, K. A., Landolt, A. U. & Wolff, M. J. A Quantitative Comparison of the Small Magellanic Cloud, Large Magellanic Cloud, and Milky Way Ultraviolet to Near-Infrared Extinction Curves. ApJ 594, 279–293 (2003).
- [26] Greene, J. E. & Ho, L. C. Estimating Black Hole Masses in Active Galaxies Using the H Emission Line. ApJ 630, 122–129 (2005).
- [27] Shen, Y. The mass of quasars. Bulletin of the Astronomical Society of India 41, 61–115 (2013).
- [28] Sérsic, J. L. Influence of the atmospheric and instrumental dispersion on the brightness distribution in a galaxy. Boletin de la Asociacion Argentina de Astronomia La Plata Argentina 6, 41–43 (1963).
- [29] Norris, M. A. et al. The AIMSS Project - I. Bridging the star cluster-galaxy divide⋆†‡§¶. MNRAS 443, 1151–1172 (2014).
- [30] Vanzella, E. et al. JWST/NIRCam Probes Young Star Clusters in the Reionization Era Sunrise Arc. ApJ 945, 53 (2023).
- [31] Bezanson, R. et al. The Relation Between Compact, Quiescent High-redshift Galaxies and Massive Nearby Elliptical Galaxies: Evidence for Hierarchical, Inside-Out Growth. ApJ 697, 1290–1298 (2009).
- [32] Baggen, J. F. W. et al. Sizes and mass profiles of candidate massive galaxies discovered by JWST at 7¡z¡9: evidence for very early formation of the central ~100 pc of present-day ellipticals. arXiv e-prints arXiv:2305.17162 (2023).
- [33] Izumi, T. et al. Subaru High-z Exploration of Low-luminosity Quasars (SHELLQs). XIII. Large-scale Feedback and Star Formation in a Low-luminosity Quasar at z = 7.07 on the Local Black Hole to Host Mass Relation. ApJ 914, 36 (2021).
- [34] Goulding, A. D. et al. UNCOVER: The growth of the first massive black holes from JWST/NIRSpec – spectroscopic confirmation of an X-ray luminous AGN at z=10.1. arXiv e-prints arXiv:2308.02750 (2023).
- [35] Vanden Berk, D. E. et al. Composite Quasar Spectra from the Sloan Digital Sky Survey. AJ 122, 549–564 (2001).
- [36] Harikane, Y. et al. JWST/NIRSpec First Census of Broad-Line AGNs at z=4-7: Detection of 10 Faint AGNs with and Their Host Galaxy Properties. arXiv e-prints arXiv:2303.11946 (2023).
- [37] Veilleux, S., Meléndez, M., Tripp, T. M., Hamann, F. & Rupke, D. S. N. The Complete Ultraviolet Spectrum of the Archetypal “Wind-dominated” Quasar Mrk 231: Absorption and Emission from a High-speed Dusty Nuclear Outflow. ApJ 825, 42 (2016).
- [38] Zakamska, N. L. et al. Discovery of extreme [O III] 5007 Å outflows in high-redshift red quasars. MNRAS 459, 3144–3160 (2016).
- [39] Osterbrock, D. E. & Pogge, R. W. The spectra of narrow-line Seyfert 1 galaxies. ApJ 297, 166–176 (1985).
- [40] Leighly, K. M., Halpern, J. P., Jenkins, E. B. & Casebeer, D. The Intrinsically X-Ray-weak Quasar PHL 1811. II. Optical and UV Spectra and Analysis. ApJS 173, 1–36 (2007).
- [41] Abramowicz, M. A., Czerny, B., Lasota, J. P. & Szuszkiewicz, E. Slim Accretion Disks. ApJ 332, 646 (1988).
- [42] Fujimoto, S. et al. A dusty compact object bridging galaxies and quasars at cosmic dawn. Nature 604, 261–265 (2022).
- [43] Endsley, R. et al. ALMA confirmation of an obscured hyperluminous radio-loud AGN at z = 6.853 associated with a dusty starburst in the 1.5 deg2 COSMOS field. MNRAS 520, 4609–4620 (2023).
- [44] Matsuoka, Y. et al. Quasar Luminosity Function at z = 7. ApJ 949, L42 (2023).
- [45] Larson, R. L. et al. A CEERS Discovery of an Accreting Supermassive Black Hole 570 Myr after the Big Bang: Identifying a Progenitor of Massive Quasars. arXiv e-prints arXiv:2303.08918 (2023).
- [46] Barro, G. et al. Extremely red galaxies at with MIRI and NIRSpec: dusty galaxies or obscured AGNs? arXiv e-prints arXiv:2305.14418 (2023).
- [47] Maiolino, R. et al. A small and vigorous black hole in the early Universe. arXiv e-prints arXiv:2305.12492 (2023).
- [48] Maiolino, R. et al. JADES. The diverse population of infant Black Holes at : merging, tiny, poor, but mighty. arXiv e-prints arXiv:2308.01230 (2023).
- [49] Bogdan, A. et al. Detection of an X-ray quasar in a gravitationally-lensed z=10.3 galaxy suggests that early supermassive black holes originate from heavy seeds. arXiv e-prints arXiv:2305.15458 (2023).
- [50] Bouwens, R. J., Oesch, P. A., Illingworth, G. D., Ellis, R. S. & Stefanon, M. The Luminosity Function Fainter than -15 mag from the Hubble Frontier Fields: The Impact of Magnification Uncertainties. ApJ 843, 129 (2017).
- [51] Atek, H., Richard, J., Kneib, J.-P. & Schaerer, D. The extreme faint end of the UV luminosity function at through gravitational telescopes: a comprehensive assessment of strong lensing uncertainties. MNRAS 479, 5184–5195 (2018).
- [52] Yang, J. et al. Probing early supermassive black hole growth and quasar evolution with near-infrared spectroscopy of 37 reionization-era quasars at 6.3 z 7.64. The Astrophysical Journal 923, 262 (2021). URL https://dx.doi.org/10.3847/1538-4357/ac2b32.
- [53] Dayal, P. et al. The hierarchical assembly of galaxies and black holes in the first billion years: predictions for the era of gravitational wave astronomy. MNRAS 486, 2336–2350 (2019).
- [54] Piana, O., Dayal, P., Volonteri, M. & Choudhury, T. R. The mass assembly of high-redshift black holes. MNRAS 500, 2146–2158 (2021).
- [55] Reines, A. E. & Volonteri, M. Relations between Central Black Hole Mass and Total Galaxy Stellar Mass in the Local Universe. ApJ 813, 82 (2015).
- [56] Suh, H. et al. No Significant Evolution of Relations between Black Hole Mass and Galaxy Total Stellar Mass Up to z 2.5. ApJ 889, 32 (2020).
- [57] Habouzit, M. et al. Co-evolution of massive black holes and their host galaxies at high redshift: discrepancies from six cosmological simulations and the key role of JWST. MNRAS 511, 3751–3767 (2022).
- [58] Çatmabacak, O. et al. Black hole-galaxy scaling relations in FIRE: the importance of black hole location and mergers. MNRAS 511, 506–535 (2022).
- [59] Weaver, J. R. et al. The UNCOVER Survey: A first-look HST+JWST catalog of 50,000 galaxies near Abell 2744 and beyond. arXiv e-prints arXiv:2301.02671 (2023).
- [60] Brammer, G. grizli (2023). URL https://doi.org/10.5281/zenodo.8210732. Please cite this software using these metadata.
- [61] Treu, T. et al. The GLASS James Webb Space Telescope Early Release Science Program. I. Survey Design and Release Plans. arXiv e-prints arXiv:2206.07978 (2022).
- [62] Brammer, G. msaexp: Nirspec analyis tools (2022). URL https://doi.org/10.5281/zenodo.7313329. Please cite this software using these metadata.
- [63] González-López, J. et al. The ALMA Frontier Fields Survey. I. 1.1 mm continuum detections in Abell 2744, MACS J0416.1-2403 and MACS J1149.5+2223. A&A 597, A41 (2017).
- [64] Zitrin, A. et al. Hubble Space Telescope Combined Strong and Weak Lensing Analysis of the CLASH Sample: Mass and Magnification Models and Systematic Uncertainties. ApJ 801, 44 (2015).
- [65] Pascale, M. et al. Unscrambling the Lensed Galaxies in JWST Images behind SMACS 0723. ApJ 938, L6 (2022).
- [66] Elíasdóttir, Á. et al. Where is the matter in the Merging Cluster Abell 2218? ArXiv e-prints (2007).
- [67] Jaffe, W. A simple model for the distribution of light in spherical galaxies. MNRAS 202, 995–999 (1983).
- [68] Keeton, C. R. A Catalog of Mass Models for Gravitational Lensing. arXiv e-prints astro–ph/0102341 (2001).
- [69] Horne, K. An optimal extraction algorithm for CCD spectroscopy. PASP 98, 609–617 (1986).
- [70] Earl, N. et al. astropy/specutils: v1.10.0 (2023). URL https://doi.org/10.5281/zenodo.7803739.
- [71] Foreman-Mackey, D., Hogg, D. W., Lang, D. & Goodman, J. emcee: The MCMC Hammer. PASP 125, 306 (2013).
- [72] Prevot, M. L., Lequeux, J., Maurice, E., Prevot, L. & Rocca-Volmerange, B. The typical interstellar extinction in the Small Magellanic Cloud. A&A 132, 389–392 (1984).
- [73] Bouchet, P., Lequeux, J., Maurice, E., Prevot, L. & Prevot-Burnichon, M. L. The visible and infrared extinction law and the gas-to-dust ratio in the Small Magellanic Cloud. A&A 149, 330–336 (1985).
- [74] Calzetti, D. et al. The Dust Content and Opacity of Actively Star-forming Galaxies. ApJ 533, 682–695 (2000).
- [75] Salim, S. & Narayanan, D. The Dust Attenuation Law in Galaxies. ARA&A 58, 529–575 (2020).
- [76] Korista, K. T. & Goad, M. R. What the Optical Recombination Lines Can Tell Us about the Broad-Line Regions of Active Galactic Nuclei. ApJ 606, 749–762 (2004).
- [77] Kennicutt, J., Robert C. The Global Schmidt Law in Star-forming Galaxies. ApJ 498, 541–552 (1998).
- [78] Conroy, C., Gunn, J. E. & White, M. The Propagation of Uncertainties in Stellar Population Synthesis Modeling. I. The Relevance of Uncertain Aspects of Stellar Evolution and the Initial Mass Function to the Derived Physical Properties of Galaxies. ApJ 699, 486–506 (2009).
- [79] Richards, G. T. et al. Spectral Energy Distributions and Multiwavelength Selection of Type 1 Quasars. ApJS 166, 470–497 (2006).
- [80] Peng, C. Y., Ho, L. C., Impey, C. D. & Rix, H.-W. Detailed Decomposition of Galaxy Images. II. Beyond Axisymmetric Models. AJ 139, 2097–2129 (2010).
- [81] Pasha, I. & Miller, T. B. pysersic: A Python package for determining galaxy structural properties via Bayesian inference, accelerated with jax. arXiv e-prints arXiv:2306.05454 (2023).
- [82] Atek, H. et al. JWST UNCOVER: discovery of z ¿ 9 galaxy candidates behind the lensing cluster Abell 2744. MNRAS 524, 5486–5496 (2023).
- [83] Sheth, R. K. & Tormen, G. An excursion set model of hierarchical clustering: ellipsoidal collapse and the moving barrier. MNRAS 329, 61–75 (2002).
- [84] Astropy Collaboration et al. Astropy: A community Python package for astronomy. A&A 558, A33 (2013).
- [85] Price-Whelan, A. M. et al. The Astropy Project: Building an Open-science Project and Status of the v2.0 Core Package. AJ 156, 123 (2018).
- [86] van der Walt, S., Colbert, S. C. & Varoquaux, G. The numpy array: A structure for efficient numerical computation. Computing in Science Engineering 13, 22–30 (2011).
- [87] Virtanen, P. et al. SciPy 1.0: Fundamental Algorithms for Scientific Computing in Python. Nature Methods 17, 261–272 (2020).
- [88] Hunter, J. D. Matplotlib: A 2d graphics environment. Computing in Science & Engineering 9, 90–95 (2007).
- [89] Ofek, E. O. MAAT: MATLAB Astronomy and Astrophysics Toolbox. Astrophysics Source Code Library, record ascl:1407.005 (2014). 1407.005.
The raw JWST data used in this work are publicly available on the Barbara A. Mikulski Archive for Space Telescopes (MAST). These observations specifically are associated with the JWST GO program number 2561, JWST ERS program number 1324, and JWST DD program number 2756. The reduced UNCOVER mosaics, catalogs, lens models as well as spectra are part of the public data release by the UNCOVER team333https://jwst-uncover.github.io [10, 19, 59]. The public ALMA data can be found on the ESO Science Archive under IDs 2018.1.00035.L and 2013.1.00999.S.
A.Z. acknowledges support by grant 2020750 from the United States-Israel Binational Science Foundation (BSF) and grant 2109066 from the United States National Science Foundation (NSF), and by the Ministry of Science & Technology, Israel. H.A. and I.C. acknowledge support from CNES, focused on the JWST mission, and the Programme National Cosmology and Galaxies (PNCG) of CNRS/INSU with INP and IN2P3, co-funded by CEA and CNES. P.D. acknowledges support from the NWO grant 016.VIDI.189.162 (“ODIN”) and the European Commission’s and University of Groningen’s CO-FUND Rosalind Franklin program. The Cosmic Dawn Center (DAWN) is funded by the Danish National Research Foundation under grant No. 140. Support for the program JWST-GO-2561 was provided through a grant from the STScI under NASA contract NAS 5-03127. This work has received funding from the Swiss State Secretariat for Education, Research and Innovation (SERI) under contract number MB22.00072, as well as from the Swiss National Science Foundation (SNSF) through project grant 200020_207349. Cloud-based data processing and file storage for this work is provided by the AWS Cloud Credits for Research program.
This work is based on observations obtained with the NASA/ESA/CSA JWST, retrieved from the MAST at the Space Telescope Science Institute (STScI). STScI is operated by the Association of Universities for Research in Astronomy, Inc. under NASA contract NAS 5-26555. This work is also based on observations made with ESO Telescopes at the La Silla Paranal Observatory and the Atacama Large Millimeter/sub-millimeter Array (ALMA), obtained from the ESO Science Archive facility. ALMA is a partnership of ESO (representing its member states), NSF (USA) and NINS (Japan), together with NRC (Canada), MOST and ASIAA (Taiwan), and KASI (Republic of Korea), in cooperation with the Republic of Chile. The Joint ALMA Observatory is operated by ESO, AUI/NRAO and NAOJ. The National Radio Astronomy Observatory (NRAO) is a facility of the NSF operated under cooperative agreement by Associated Universities Inc.
This research made use of Astropy,444http://www.astropy.org a community-developed core Python package for Astronomy [84, 85] as well as the packages NumPy [86], SciPy [87], Matplotlib [88] and the MAAT Astronomy and Astrophysics tools for MATLAB [89].
A.Z., J.E.G., and L.J.F. wrote the manuscript. L.J.F. made the figures. L.J.F. and I.L. performed the line fits. I.L. designed the program and produced the deep spectrum. R.B. and I.L reduced the data. L.J.F. and A.Z. constructed the lens model. P.D. provided simulations to contextualise the observational results obtained. V.K. and I.L. measured emission line strengths. I.C. ran the completeness simulations. T.B.M., D.S. and E.N. measured the source size. I.L and R.B. are the PIs of the UNCOVER program. All authors contributed to the manuscript and aided the analysis and interpretation.
The authors declare no competing financial interests.
Reprints and permissions information is available at www.nature.com/reprints.