A Census of Photometrically Selected Little Red Dots at in JWST Blank Fields
Abstract
Observations with the James Webb Space Telescope (JWST) have uncovered numerous faint active galactic nuclei (AGN) at and beyond. These objects are key to our understanding of the formation of supermassive black holes (SMBHs), their co-evolution with host galaxies, as well as the role of AGN in cosmic reionization. Using photometric colors and size measurements, we perform a search for compact red objects in an array of blank deep JWST/NIRCam fields totaling arcmin2. Our careful selection yields 260 reddened AGN candidates at , dominated by a point-source like central component ( pc) and displaying a dichotomy in their rest-frame colors (blue UV and red optical slopes). Quasar model fitting reveals our objects to be moderately dust extincted (), which is reflected in their inferred bolometric luminosities of = 1044-47 erg/s, and fainter UV magnitudes to . Thanks to the large areas explored, we extend the existing dusty AGN luminosity functions to both fainter and brighter magnitudes, confirming their number densities to be higher than for UV-selected quasars of similar magnitudes. At the same time they constitute only a small fraction of all UV-selected galaxies at similar redshifts, but this percentage rises to 10% for at . Finally, assuming a conservative case of accretion at the Eddington rate, we place a lower limit on the SMBH mass function at , finding it to be consistent with both theory and previous observations.
1 Introduction
The remarkable sensitivity and angular resolution of the James Webb Space Telescope (JWST) at infrared wavelengths is enabling us to explore the distant Universe like never before. This allows for an exceptionally detailed examination of the characteristics of known high- sources (e.g. Bunker et al., 2023; Maiolino et al., 2023a) and, at the same time, reveals the presence of more and farther galaxies (e.g. Adams et al., 2023; Atek et al., 2023; Austin et al., 2023; Bradley et al., 2023; Casey et al., 2023; Finkelstein et al., 2023; Naidu et al., 2022; Robertson et al., 2023), some of them spectroscopically confirmed beyond (Curtis-Lake et al., 2023; Wang et al., 2023).
What truly tests our models and preconceived vision of galaxy evolution is not how early we can see these objects, but the questions they raise regarding the balance between their mass, UV luminosity and age. The excess of high- galaxies at the bright end () of the UV luminosity function is in tension with current theoretical frameworks (Behroozi & Silk, 2015; Dayal et al., 2017; Yung et al., 2019, 2020; Behroozi et al., 2019, 2020; Davé et al., 2019; Wilkins et al., 2022; Kannan et al., 2023; Mason et al., 2023; Mauerhofer & Dayal, 2023), which suggests exotic initial mass functions, little to no dust attenuation, or a higher than anticipated density of galaxies undergoing active galactic nuclei (AGN) phenomena (e.g. Finkelstein & Bagley, 2022; Pacucci et al., 2022; Boylan-Kolchin, 2023; Ferrara et al., 2023; Fujimoto et al., 2023a; Lovell et al., 2023; Steinhardt et al., 2023; Sun et al., 2023).
Although early hints also existed in prior works (Morishita et al., 2020; Fujimoto et al., 2022; Endsley et al., 2023), one of the most intriguing discoveries from early JWST imaging is that of compact red sources with a “v-shaped” spectral energy distribution (SED), namely a blue UV continuum and a steep red slope in the rest-frame optical (Labbé et al., 2023a, b; Furtak et al., 2023a). While the first photometric selections of these objects included spatially resolved targets that could be early massive compact galaxies (Barro et al., 2023), spectra revealed clear evidence for broad H and/or H emission indicative of actively accreting supermassive black holes (SMBH; Furtak et al., 2023b; Fujimoto et al., 2023a; Greene et al., 2023; Killi et al., 2023; Kocevski et al., 2023; Kokorev et al., 2023a; Matthee et al., 2023; Übler et al., 2023).
Dubbed “little red dots” (LRDs), these sources have SEDs characterized by a unique “v-shaped” continuum combined with their point source morphology (Labbé et al., 2023a, b; Furtak et al., 2023a). However, what truly makes the LRDs stand out is their high number densities. It appears that LRDs may account for a few percent of the galaxy population at , and are far more numerous than the lowest luminosity known UV-selected quasars. Likewise, they appear to account for of broad-line selected active galactic nuclei (AGN) at (Greene et al., 2023; Harikane et al., 2023; Labbé et al., 2023b; Maiolino et al., 2023b), which is higher than the fraction of dusty red quasars at (Banerji et al., 2015; Glikman et al., 2015). These red dots are generally observed at (Labbé et al., 2023b), but can potentially be found even at (Leung et al., 2023). However, these initial LRD studies were performed with limited spectroscopic samples and/or small areas of the sky, covering only – 40 arcmin2. The numbers of compact red objects could therefore be further affected by cosmic variance, which makes it quite difficult to assess their real importance and diversity.
Extending the selection of this compact red population of low-luminosity broad-line AGN candidates to larger areas would thus be necessary to study their complete demographics, limiting the effects of cosmic variance. In addition, this would provide us with a sufficient level of detail toward a better understanding of the total number densities of obscured AGN at high- as well as the potential role that these sources play in cosmic reionization (e.g. see Grazian et al., 2018; Mitra et al., 2018; Dayal et al., 2020; Trebitsch et al., 2023; Dayal et al., 2024).
In this work we present a carefully selected sample of 260 reddened AGN candidates in the arcmin2 area covering some of the deepest blank extragalactic JWST fields. Examining such a large area will ensure that we are reducing the effects of cosmic variance to a minimum, while our focus on blank fields lessens the selection biases and avoids volume uncertainties arising from lensing magnification.
Throughout this work we assume a flat CDM cosmology (e.g. Planck Collaboration et al., 2020) with , and H km s-1 Mpc-1, and a Chabrier (2003) initial mass function (IMF) between . All magnitudes are expressed in the AB system (Oke, 1974).
2 Observations and Data
In this work we use JWST data from the following programs/fields - CEERS (# 1345, PI: S. Finkelstein, Bagley et al. 2022) in the EGS, PRIMER (# 1837, PI: J. Dunlop) in COSMOS and UDS. For the GOODS-S we combine the available data from multiple broad and medium band programs - FRESCO (# 1895, PI: P. Oesch, Oesch et al. 2023), JADES (# 1180, 1210, 1286, 1287 PIs: D. Eisenstein, N. Luetzgendorf, Eisenstein et al. 2023a, b) and JEMS (# 1963, PI: C. Williams, Williams et al. 2023b). We provide a general overview of these 4 fields in Table 1. More detailed information, including specific filters, depths and survey designs can be found in overview papers for each data release.
2.1 Imaging Data Reduction
We homogeneously processed all the publicly available JWST imaging obtained with the NIRCam and MIRI in a variety of public JWST fields, presented in Table 1. The images have all been reduced with the grizli pipeline (Brammer, 2023), using the jwst_1084.pmap, and follow the same methodology of (multiple) previous studies (e.g., Jin et al., 2023; Kokorev et al., 2023b; Valentino et al., 2023). Compared to the standard pipeline, we incorporate additional corrections to account for cosmic rays and stray light (see e.g., Bradley et al., 2023), 1/f noise, detector level artifacts (“wisps” and “snowballs”) and bias in individual exposures (see e.g., Rigby et al., 2023). For the PRIMER data, we introduce an additional procedure that alleviates the detrimental effects of the diagonal striping seen in some exposures as was done in Valentino et al. (2023). Finally, our mosaics include the updated sky flats for all NIRCam filters. These reductions are publicly available as a part of the DAWN JWST Archive (DJA111dawn-cph.github.io/dja/).
These data-sets are further complemented by including all available optical and near-infrared data from the Complete Hubble Archive for Galaxy Evolution (CHArGE, Kokorev et al., 2022). Individual JWST and HST exposures were aligned to the same astrometric reference frame by using the Gaia DR3 (Gaia Collaboration et al., 2021), then co-added and drizzled (Fruchter & Hook, 2002) to a pixel scale for all the JWST and HST filters.
Some of the fields we examine in this work have also been observed with MIRI, in one or more filters, sampling mostly the rest-frame near-infrared (NIR) at . These data are, however, not uniform in the wavelength coverage, depth and area. In fact, only about a third of the objects in areas we examine have public MIRI data and even fewer are actually detected. While the inclusion of the MIRI photometry can assist in further identifying the presence (or absence) of dusty, power law-like AGN component in galaxies (e.g. see Yang et al., 2023; Williams et al., 2023a), doing so appropriately within a context of a population study requires a degree of uniformity which the current MIRI data do not possess. Therefore, we have opted to exclude MIRI photometry from our current analysis to maintain consistency across various fields.
2.2 Source Extraction
The initial JWST catalog was constructed by utilizing a detection image combined from all noise weighted “wide” (W) NIRCam Long Wavelength (LW) filters available, which includes F277W, F356W and F444W. A similar detection method was already successfully employed in several works (see e.g. Jin et al. 2022; Kokorev et al. 2023b; Valentino et al. 2023; Weaver et al. 2023a). To extract the sources and produce a segmentation map, we used sep (Barbary, 2016), a Python version of SExtractor (Bertin & Arnouts, 1996). Photometry was extracted in circular apertures of increasing size. Correction from the aperture to the “total” values was performed by using the flux_auto column output by sep, which is equivalent to the MAG_AUTO from SExtractor, ensuring that for each source only flux belonging to its segment is taken into account. This method was shown to apply to both point-like and extended objects (Weaver et al., 2022, 2023b), so we believe it to be adequate for our sources.
Additionally, we introduce a correction to account for the missing flux outside the Kron aperture (Kron, 1980), by utilizing a method similar to the one used in Whitaker et al. (2011) and Weaver et al. (2023a). In short, this procedure involves computing the fraction of the missing light outside the circularized Kron radius by analyzing curves of growth of the point spread functions (PSF), which were obtained empirically, by stacking stars in these various fields. This correction is then applied to the flux_auto values for each source. However, since our work focuses on compact (sub NIRCam PSF size) AGN candidates this additional correction does not strongly influence the derived flux densities. For the same reason, we use the total fluxes, computed from =036 apertures, unless specified otherwise.
| Field | R.A. [deg] | Dec. [deg] | Science Area [arcmin2] | NIRCam depths [mag] |
|---|---|---|---|---|
| CEERS | 214.920 | 52.870 | 51.9 | |
| PRIMER-COSMOS | 150.119 | 2.325 | 104.2 | |
| PRIMER-UDS | 34.372 | -5.210 | 142.4 | |
| GOODS-S | 53.142 | -27.798 | 38.3 |
Note. — NIRCam depths: expressed as within the apertures used for the photometric extraction in the area covered by F115W/F150W/F200W/F277W/ F356W/F444W.
3 Identifying Compact Red Objects
The data from CEERS, PRIMER and various programs covering GOODS-S are well-suited for a photometric search for compact obscured AGN candidates. The available photometry covers a complete wavelength range from 1 – 5 m, in at least broad and medium bands, reaching a median 5 depth of 28.3 AB mag in F444W filter (Table 1). In our search, we explore blank fields covering a large area of arcmin2, which are also completely independent. In return this will significantly limit the impact of cosmic variance and enable us to avoid dealing with the cosmic volume uncertainties introduced by the lensing magnification.
3.1 Color and Morphology Selection
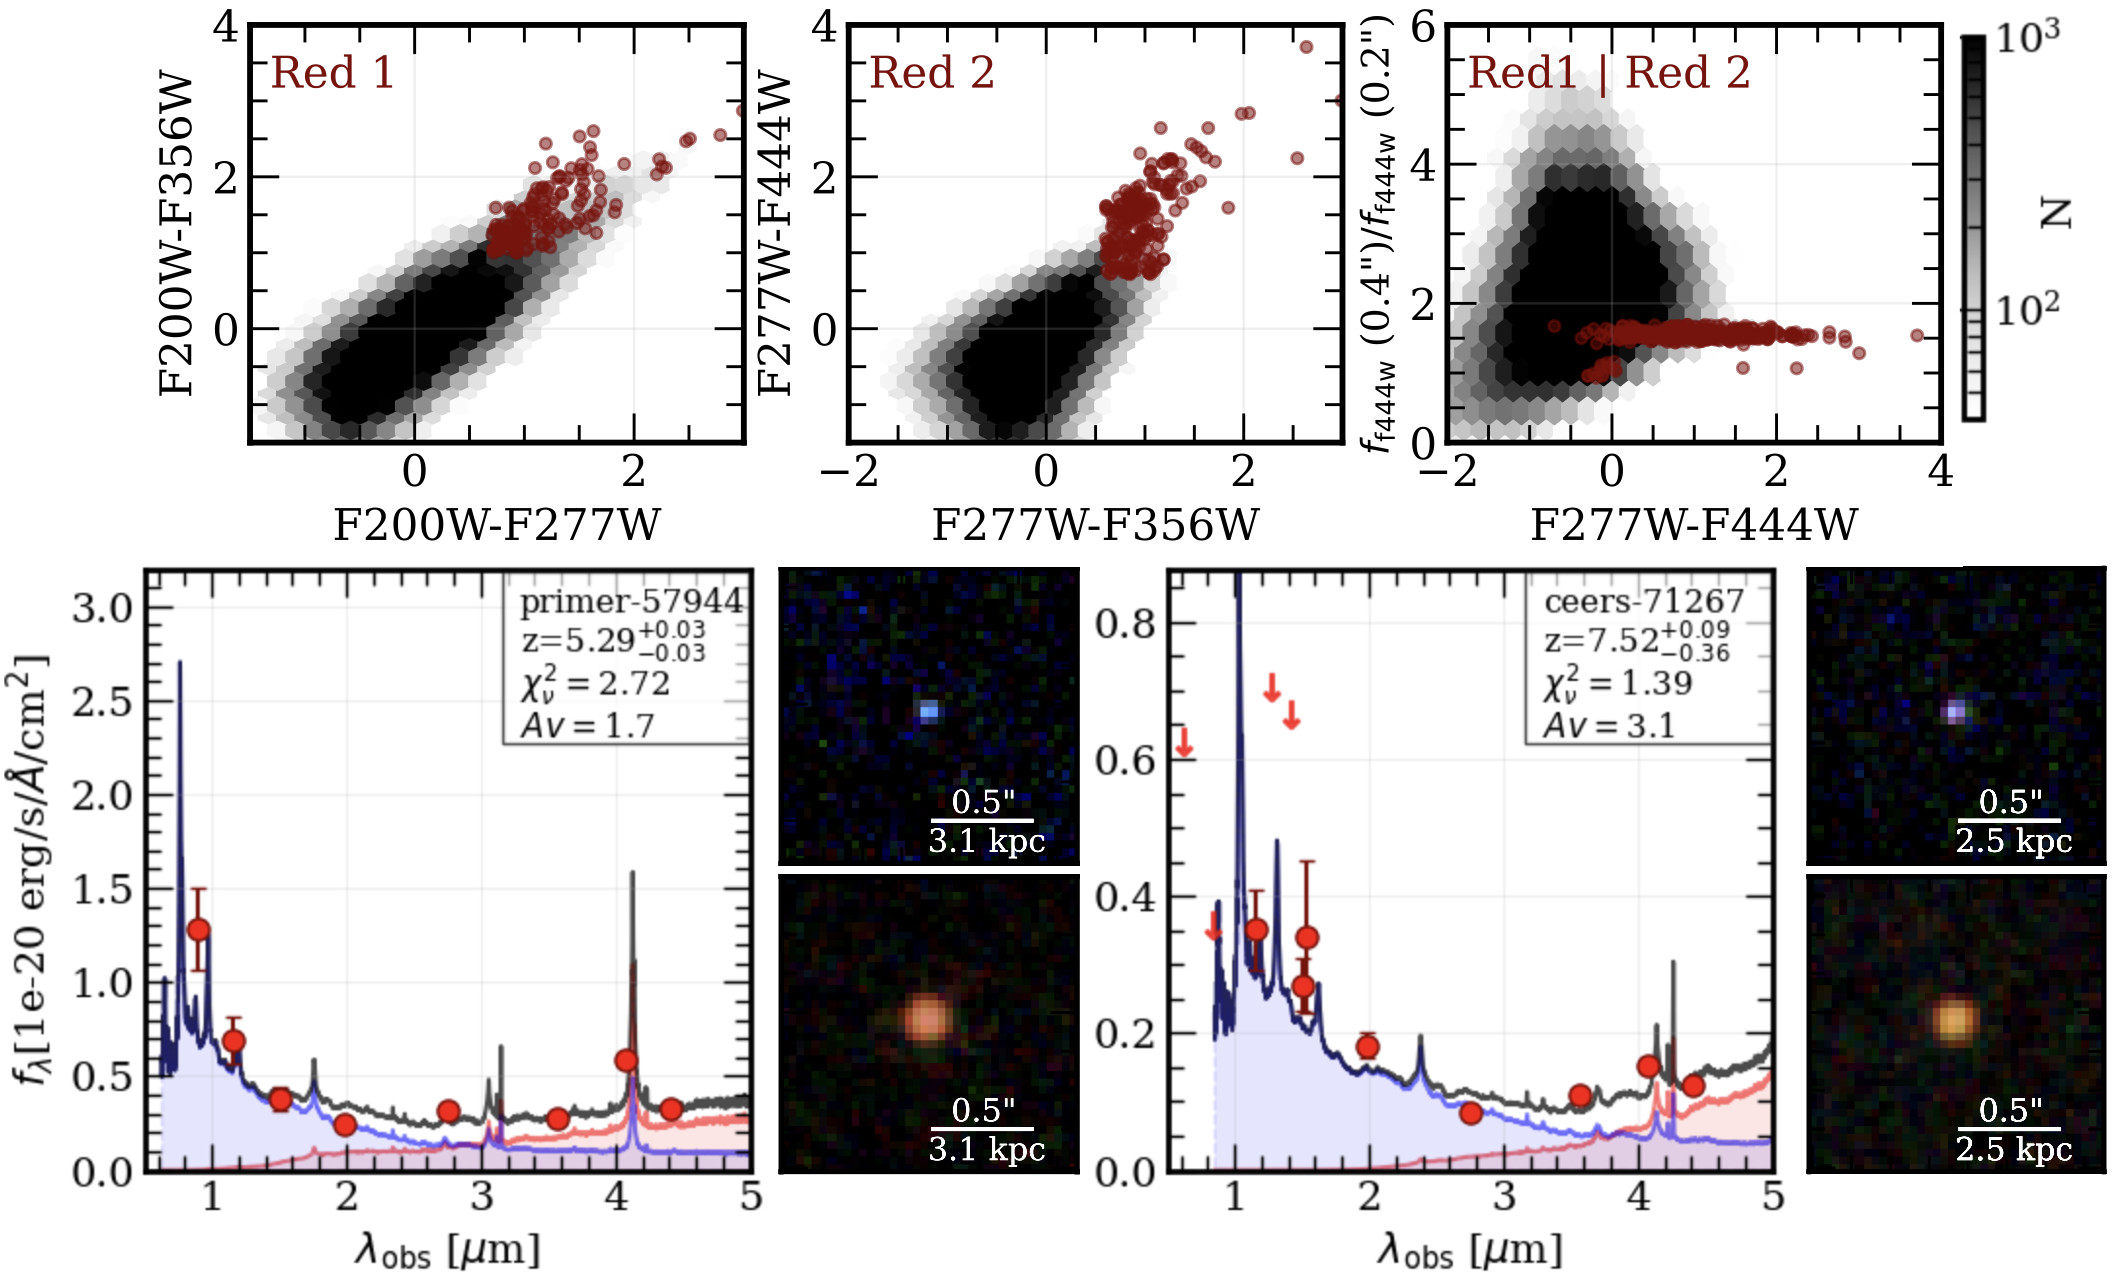
Recently, Labbé et al. (2023b) published a large sample of photometrically identified compact red sources from the Cycle 1 JWST UNCOVER program (PIs: I. Labbé, R. Bezanson; Bezanson et al., 2022). Subsequent follow-up of 17 such objects with NIRSPec/MSA PRISM has resulted in a remarkable success rate of 83 %, with 14/17 photometrically selected targets confirmed as broad-line (BL) AGN at (Greene et al., 2023), and 3/17 as brown dwarfs (Burgasser et al., 2023). In brief, the color cuts introduced in Labbé et al. (2023b) are designed to catch the break between the red continuum slope in rest-frame optical, and the blue rest-UV emission ( Å ). This color selection requires that the red continuum slope is rising in more than one adjacent filter pair, to avoid selecting galaxies with strong emission lines. Indeed, currently available spectra of LRDs (e.g. Fujimoto et al., 2023a; Furtak et al., 2023b; Kocevski et al., 2023; Kokorev et al., 2023a; Greene et al., 2023; Matthee et al., 2023) display a remarkable dichotomy in their observed spectral shapes. In particular the SEDs at m (1000 - 2000 Å rest) are blue () and red () at m (3100 - 5200 Å rest). As such we keep the Labbé et al. color criteria largely unchanged, only introducing some further adjustments based on the UNCOVER spectra of LRDs, namely to limit the contamination of our sample by brown dwarfs as was suggested in Greene et al. (2023).
Colors alone would end up selecting both LRDs and extended red galaxies (see e.g. Labbé et al., 2023b; Williams et al., 2023a, b), so we introduce a further “compactness” cut to only select sources with high central flux concentration. To do that we use the ratio between the total flux in F444W between 04 and 02 apertures. Since roughly 17% of the LRD candidates followed up with NIRSpec turned out to be brown dwarfs (Burgasser et al., 2023), we would also like to minimize the incidence of these objects in our sample. To do that we adopt the brown dwarf removal criterion from Greene et al. (2023), based on the LRD spectra from NIRSPec/MSA. Finally, we also require our sources to be significantly () detected in F444W, and be brighter than 27.7 AB mags, to be consistent with the UNCOVER selection. The imposed color cuts are then:
| red 1 | |||
or
| red 2 | |||
which are effectively selecting our low () and high () redshift samples, respectively. The compactness is given by:
To limit the number of brown dwarfs in the sample we also adopt:
The final selection then becomes () & compact & bd_removal. Applying the color criteria also means that every object has to be detected () in at least one band per color to make the selection meaningful. In case of a non-detection we use the upper limits, but only if the “brighter” band in the color is detected. Out of 408 000 objects covering 4 fields of interest, we end up selecting 334. Most importantly, we note that no information about photometric redshifts and underlying galaxy/AGN SEDs is used at this stage to avoid being biased by models. We discuss our photometric redshift estimate and its agreement with spec- for sub-samples in the next sub section.
3.2 Size Measurements
While the compactness cut alone already successfully manages to select PSF-dominated point sources, we would like to provide a further fine-tuning to provide a fully quantitative rather than qualitative assessment. To do that we fit our sources with pysersic (Pasha & Miller, 2023) in the F444W band. The primary goal of this is to ensure that the source is dominated by the PSF component in the reddest, least dust obscured, band as was done in Labbé et al. (2023b). We focus on the F444W band for this analysis, as the galactic origin of the rest-UV can not be ruled out with current photometric (or even spectroscopic) observations. Moreover, if an object is dominated by a single star-forming region, it could appear compact in rest-UV bands, but still be extended in the redder filters, making the F444W band the most physically constraining for our type of study.
Taking the PSF into account is imperative when measuring sizes of unresolved objects. We generate our F444W PSFs empirically for each field by following the methodology described in Skelton et al. (2014), Whitaker et al. (2019) and Weaver et al. (2023a). In brief, we identify non-saturated stars in every field by considering objects on the stellar locus, that are brighter than 24 AB mags and extract these candidates in stamps. These stamps are then centered and normalized to unity. The final PSFs are derived by averaging the weighted stamps, and are then normalized to the expected JWST calibration levels. For more detail see the Appendix in Weaver et al. (2023a).
The light is modeled with a single Sérsic (Sérsic, 1963) profile with the center, brightness, effective radius, Sérsic index, and axis ratio as free parameters. The prior for the index is uniform between and the effective radius uniform between pixels (001 – 02 ). For each source we create a 3” square cutout (75 pixels by 75 pixels) and mask any additional sources within the stamp. Parameter values and uncertainties are calculated using the Laplace approximation, assuming that the posterior is Gaussian. We exclude fits where the resulting per pixel is greater than 2 or the best fit flux differs from the catalog value by more than 2 AB magnitudes. This excludes 15 sources from our sample which by visual inspection we find are untrustworthy due to contamination of bright nearby objects.
A source can be considered to be point-like if its effective radius in F444W band is lower than the empirical PSF FWHM ( 015). It appears that our compact criterion is extremely effective at identifying PSF-like objects as none of the 319/334 sources with reliable fits exceed a diameter of 008, corroborating the effectiveness of the compactness criterion described in Section 3. After carefully considering both colors and morphology when selecting our sample of AGN candidates, we are now able to proceed directly to the SED fitting.
3.3 Photometric Redshifts
To calculate photometric redshifts () for our objects, we use the Python version of EAZY (Brammer et al., 2008). We choose the blue_sfhz_13 model subset that contains redshift-dependent SFHs, and dust attenuation values. This template set is further complemented by a blue galaxy template, derived from a JWST spectrum of a galaxy with extreme line equivalent widths (ID4590; Carnall et al., 2022).
While it might seem counter-intuitive to use galaxy templates for what we believe to be AGN candidates, similar efforts presented in Labbé et al. (2023b) report a good agreement between deriving with stellar templates alone, as opposed to stellar+AGN models, finding a very good agreement between the two. This is not surprising, as when it comes to photometric redshift fitting, the key deciding factors are the positions of the Lyman ( Å) and Balmer ( Å) breaks.
For the LRDs, a general absence of significant stellar contribution in the rest-frame optical (e.g. Greene et al., 2023) would result in a lack of a noticeable Balmer break, however the trough of the “v-shape” in the rest-frame SEDs of observed LRDs is also located at roughly 4000 Å (e.g. Furtak et al., 2023b; Kokorev et al., 2023a). Indeed the existence of such a feature in LRDs has resulted in their misidentification as dusty star-forming galaxies, leading to stellar mass estimates which are in tension with CDM, if all the light is attributed to star-formation alone (e.g. see discussion in Boylan-Kolchin, 2023; Kocevski et al., 2023; Labbé et al., 2023a; Steinhardt et al., 2023).
Spectroscopic follow-up of red compact objects hosting AGN BL emission has in fact shown a remarkable agreement between the derived with EAZY (or similar routines) and . For example, in GOODS-S, Matthee et al. (2023) report an average , and UNCOVER LRDs presented in Greene et al. (2023) have shown . Similar consistency was also found between the initial photometric source selection and final spectra in JADES and CEERS fields (Maiolino et al., 2023b; Kocevski et al., 2023; Andika et al., 2024). As such we consider that utilizing EAZY to derive redshifts is adequate for our sample.
We fit all the available photometry for our sample of 319 LRDs, limiting the redshift grid between . From the best fit EAZY SEDs we only derive photometric redshifts, delegating the estimation of physical parameters to a different template set discussed in the next section. The uncertainties on the photometric redshift are computed from the 16th and 84th percentiles of the redshift probability distributions - . Since our sample is only identified photometrically, appropriately taking into account uncertainties is crucial when deriving the physical parameters and luminosity functions in the upcoming sections.
3.4 Quasar Template Fitting
While the origin of the rest-frame UV light in LRDs remains elusive, growing samples of JWST spectra consistently show either a complete absence or a lack of a significant contribution from the host galaxy to the total flux in the rest-frame optical ( m) (Furtak et al., 2023b; Greene et al., 2023; Kokorev et al., 2023a). This is generally evidenced by comparing the expected from broad Balmer series lines (generally H and/or H) to the observed values. For example Greene et al. (2023) find that H-derived and observed agree within a factor of two for the objects which have H PRISM coverage. Supporting this, Furtak et al. (2023b) and Kokorev et al. (2023a) also find that black holes masses () derived via broad H lines and continuum are identical, given the scatter of the relations derived from AGN reverberation mapping (see e.g. Kaspi et al., 2000; Greene & Ho, 2005), hinting at negligible stellar components. Furthermore none of the currently known spectroscopically confirmed LRDs in Abell 2744 are detected in ALMA at 1.2 mm down to Jy (2), which strongly limits the contribution of obscured star formation (see e.g. Labbé et al., 2013, 2023b), unless the dust is either very cold, very hot or diffuse. Indeed, when both JWST data and ALMA upper limits (Fujimoto et al., 2023b, c) are considered in a joint AGN+galaxy template fitting for the objects described in Furtak et al. and Kokorev et al. the contribution of the galaxy model to the total rest-frame optical light is negligible. Finally, robust measurements of effective radii for all UNCOVER LRDs, while also taking into account the empirically derived PSFs (see Weaver et al., 2023a), find no strong evidence for extended emission associated with the host galaxy in the F444W band.
Unfortunately, a lack of deep and uniform ALMA coverage for our objects prevents us from carrying out joint AGN+galaxy template fitting to ascertain the amount of AGN contribution to the optical SED. While it is possible to do it with only JWST photometry, such a fit would be too degenerate given the available number of bands and the number of models required. However, objects in our work were specifically selected with the color and compactness criteria largely mirroring those used to identify broad-line AGN in UNCOVER. It is reasonable therefore to assume that given similarly red ( at 3100 – 5200 Å rest) slopes, the rest optical continuum in our sources is also dominated by AGN light.
In terms of luminosity, the dust-obscured component is dominating the light from LRDs, and must be substantially attenuated () in order to fit the observed red slope. Given that, the rest-UV light should not be visible at all (). From our photometry, however, we see that while the blue component is weak (only a few percent of red component), it is not reddened. This emission can be interpreted as either scattered light from the AGN itself, or the host galaxy (see discussion in Labbé et al., 2023b; Greene et al., 2023). However, even when spectra are available (Greene et al., 2023), given the similarities between the UV slopes of quasars and young star-forming galaxies, these two models are equally good representations of the observed light. Our available data also do not allow us to make a clear distinction between these two possibilities, therefore to avoid over-interpreting the origins of the rest-UV emission, we will assume the scattered light (unreddened) only template in our modeling. We caution the reader that as a result of the unknown origin of the blue light, the rest-UV properties derived in this paper do not necessarily represent physical conditions of the potential AGN our LRDs might host. Due to the aforementioned similarity between UV slopes in quasars and SFGs, the values derived from both galaxy and quasar fits are thus nearly identical.
Following galaxy-only fits presented in Section 3.3 and keeping the above considerations in mind, we now would like to explore an AGN-only scenario where we model the observed light with a two component AGN model. The first one is the empirical model based on a composite of 2200 SDSS quasar spectra (Vanden Berk et al., 2001), and the second is derived from 27 near-infrared quasar spectra by Glikman et al. (2006). We then combine and renormalize both templates, allowing us to cover the full range from rest-UV to the near-infrared.
The same approach was already successfully employed in Labbé et al. (2023b) for a photometrically selected sample of red dots, and then later for PRISM spectra of 14 such objects in Greene et al. (2023) and Kokorev et al. (2023a). We fit the unreddened AGN component together with the Small Magellanic Cloud (SMC) law (Gordon et al., 2003) attenuated (= 0.1 – 4) version of the same composite template. With the photometric redshift being fixed, we are fitting for a total of three free parameters.
We find the AGN-only fits to be a marginally better representation of the observed photometry, when compared to galaxy-only \textsscEAZY fits, with for the former and for the latter, with a difference of approximately . Similar findings were also presented in Labbé et al. (2023b), even without ALMA photometry, and Barro et al. (2023), where no significant difference exists between dusty star-formation and reddened AGN models.
3.5 Final Sample of Little Red Dots
Following the initial object selection and SED fitting we are now in a position to define our final sample of “little red dots”. The primary goal of this work is to explore the photometrically selected dusty AGN candidates in the high- Universe, compare these results to robust samples of spectroscopically identified BL AGN, and potentially extend these examinations to fainter UV magnitudes and bolometric luminosities. The accurate determination of these parameters is contingent upon good coverage of the spectral break between the blue and red components at Å. This is crucial to confirm that the selected objects indeed exhibit the characteristic features of LRDs. Furthermore, a thorough sampling of the rest-frame UV around Å is essential to accurately derive , and the Å rest-frame optical continuum is needed for determining the bolometric luminosity - . With the exception of CEERS, all of our fields benefit from full NIRCam filter coverage, spanning from F090W to F444W, which will cover the rest-frame UV at . On the other hand CEERS has extremely deep ( mag at ) HST/ACS F814W coverage instead, which will also allow us to adequately compute at 1450 Å in the same redshift range. We thus limit our exploration only to objects which have . To do that we take into account the and ensure that the 16th percentile, rather than just the median of the lies above our redshift threshold (e.g. see Valentino et al., 2023). This final selection leaves us with a total of 260 red dots.
3.6 Physical Parameters
The physical sizes of objects in our final sample are extremely compact, with a median effective radius of pc (68 % confidence interval). This is much smaller when compared to the typical rest-optical sizes of star-forming galaxies measured at (e.g. see Kartaltepe et al., 2023; Ormerod et al., 2024), but is similar to the extremely compact red objects presented in Labbé et al. (2023a, b); Baggen et al. (2023) and LRDs spectroscopically confirmed as BL AGN (Furtak et al., 2023b; Kokorev et al., 2023a). Curiously, dusty galaxies at explored in Akins et al. (2023) also show a lack of extended bright component ( pc), similar to LRDs. Although not as faint or centrally concentrated as our objects or other LRDs at these redshifts, some of these similarities might imply that these dusty objects can act as potential AGN hosts.
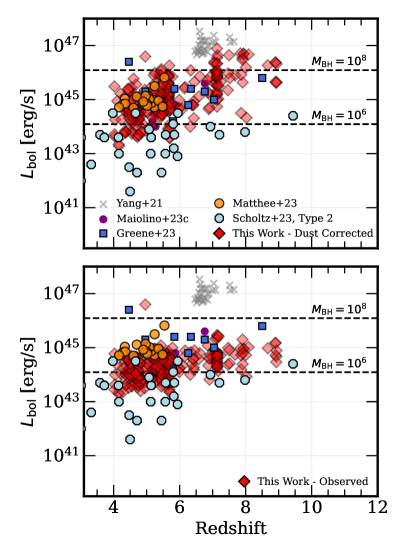
Using the standard relations, with the scatter, presented in Greene & Ho (2005) and taking into account our best-fit ( 0.6 – 3.7 mags), we derive the from the 5100 Å continuum, measured directly from best-fit SEDs. While this is not ideal, and assumes that the red continuum is AGN dominated, the SED model-dependent values represent our best guess for the intrinsic AGN luminosities. The inferred bolometric luminosities for the compact red objects from our sample thus range from erg/s. This range is slightly brighter than that derived in Labbé et al. (2023b) as we are not including any lensed fields, and thus likely fail to detect intrinsically fainter LRDs. We show the dust-corrected and observed values in Figure 2.
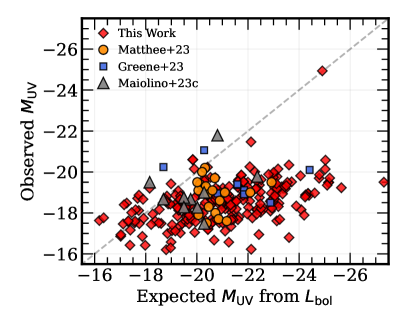
In Figure 3 we explore how the observed values of our LRDs compare to the expectations derived from the dust corrected bolometric luminosity (Shen et al., 2020). Given our median , we expect the UV extinction to be large with , however what we find is (similar to e.g. Greene et al., 2023; Maiolino et al., 2023b; Matthee et al., 2023), more than six magnitudes difference. Adding to this, the shape of the rest-UV spectrum, while faint, does not hint at any dust extinction. This suggests that a second component, different from a reddened AGN spectrum is present in LRDs, however with our current data its origin can not be determined.
The final table which contains photometry, sizes and the physical parameters we derive for our sample is available online 222https://github.com/VasilyKokorev/lrd_phot.
4 The Number Density of Compact Red Sources
4.1 Estimating Effective Volumes
One of the key motivations for our work is to conduct an unbiased search for LRDs in some of the deepest blank fields observed with JWST. Our goal is to extend the existing luminosity functions that have been deduced from spectroscopic samples, for a larger sample covering a wider area. By applying the color and size criteria that have been adopted in recent LRD studies, such as those discussed in Greene et al. (2023) and Labbé et al. (2023b), we aim to exploit the large area in our blank fields to get better statistics, particularly at the bright and faint ends. This approach should allow us to examine how much these objects contribute to the observed and number densities. However, as we are working with a photometrically selected sample our analysis will be focused on the aggregate characteristics of the LRDs, rather than on detailed examinations of individual objects.
Focusing only on the blank fields allows us to estimate the effective volumes for our objects in a rather simple way. In order to measure the observed number densities of our sample, we follow the standard method (Schmidt, 1968). The estimator has the advantage of simplicity and does not require prior assumptions on the functional form for the luminosity distribution, ideal for LRDs since their intrinsic luminosity/mass distributions are unknown. To compute the number density for some property - , we can then say:
where is the width of the bin and is the maximum volume over which a source can be detected. In return, depends on the effective survey area - , lower redshift bin boundary - and maximum observable redshift - . The latter is computed empirically from the detection limits of the survey, given the selection criteria, and cannot exceed the maximum redshift of the bin.
We obtain the total survey areas by adding up all the non-masked pixels in our detection images, as presented in Table 1. Given how bright we require our objects to be (F444W mags at SN) it might seem that would always exceed the maximum redshift of the bin, however this does not take into account the fact that our objects have to be detected in at least four bands (at ) to make color selection robust. We choose to remain conservative with our volume corrections, by only requiring one band per color combination to be detected. The values for each object are then estimated by considering our color selection laid out in Section 3. Uncertainties on our number densities are then derived in the following way. We consider the standard errors arising from Poisson statistics and compute them as prescribed in Gehrels (1986). Given that we only consider a photometric sample in our work, the uncertainty on the photometric redshift has to be taken into account appropriately in order to derive realistic errors on the physical parameters and number densities. To do that we follow the approach described in Marchesini et al. (2009). Briefly, for each object we use Monte Carlo simulations to determine whether the objects fall into the redshift bin by considering their . The final uncertainties are then a quadrature sum of the Poisson and errors.
Accounting for magnitude incompleteness effects as it is normally done for galaxy luminosity functions is not possible in our case, since it relies on making assumptions regarding the intrinsic source distributions. However, as Labbé et al. (2023b) already note, the requirement for objects to be bright in the detection band should lessen the effect of magnitude incompleteness. Given that our sources are compact, we also expect that all of them will be detected above the brightness limit, diminishing the need to consider the incompleteness as a function of surface brightness.
4.2 UV Luminosity Function
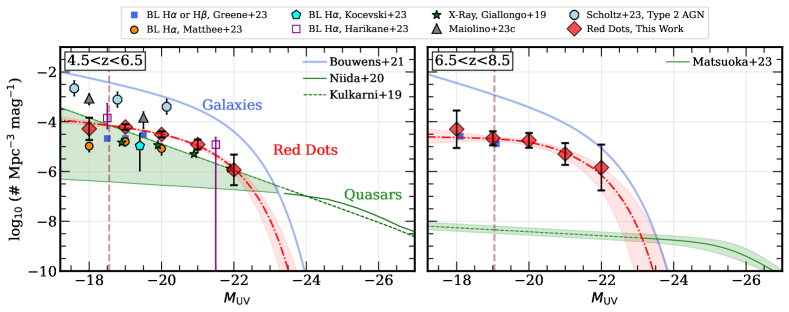
In Figure 4 we present the UV luminosity functions in two redshift bins, at and , derived from the continuum luminosity at rest frame Å as normally done for blue quasars. We list the number counts alongside the uncertainties in Table 2. The widths of our redshift bins were chosen to best align with the current literature results, for ease of comparison, as well as to ensure that photometric redshift uncertainties have a minimal impact on the luminosity functions.
At , we find that the number densities of our red color selected AGN are dex higher compared to the UV-selected quasars at similar magnitudes, depending on the extrapolation (Niida et al., 2020). As an upper limit on number density of quasars at , we also compare to the results presented in Kulkarni et al. (2019), which combine both UV-bright quasars () and UV-faint X-ray detected AGN (Giallongo et al., 2019) in their UVLF.
Before comparing to current observational results (Kocevski et al., 2023; Greene et al., 2023; Matthee et al., 2023), we note that it is difficult to accurately define the selection function for spectroscopically observed samples, and therefore derive the corrections. As such the number densities computed in these works should be treated as lower-limits. In our case the sample is selected via photometry and we derive our correction based on the selection criteria alone. This is done to avoid significantly over-estimating the number counts, thus misrepresenting the true abundance of red dots. It is also unlikely that this difference is a result of brown dwarfs contaminating our sample here, since we introduce an additional color cut from Greene et al. (2023) based on the spectra from Burgasser et al. (2023).
Taking the uncertainties into account, we find that our UV number counts are consistent with JWST-selected red BL AGN samples (Greene et al., 2023; Labbé et al., 2023b; Matthee et al., 2023), at least at and brighter. Confirming the initial findings for the UNCOVER red-dots presented in Greene et al. (2023) and Labbé et al. (2023b), we also find that our sample accounts for – 30 % of total BL AGN populations at high- (Harikane et al., 2023; Maiolino et al., 2023b) and is largely comparable to the X-ray selected quasars from Giallongo et al. (2019), although in the case of the latter we infer higher number densities at fainter UV magnitudes. However it is worth noting that differences between the resolution of Chandra X-ray data and optical light from HST can lead to uncertainties when associating X-ray emission to the galaxies being present in the same patch of the sky. Curiously enough, the recovered scarcity of compact red sources compared to galaxies is in stark contrast to the density of Type 2 AGN hosts inferred from the recent JADES spectra (Scholtz et al., 2023) which report as much as a contribution to the galaxy luminosity functions at .
When moving to the bin, the results for the UVLF at both bright and faint luminosities are inconclusive, due to the limited number of objects and the uncertainty on the photometric redshifts. However, we are again consistent with the number densities of UNCOVER BL AGN from Greene et al.. Comparing to the luminosity functions of UV selected quasars from Matsuoka et al. (2023) at , and extrapolating to fainter magnitudes, we find a 2-3 dex offset between the number densities at , roughly a factor of ten larger than in the lower redshift bin. Alongside our UVLF we also highlight the median completeness limits, which we derive from the observed depths of our fields in F814W/F090W bands, covering rest frame Å . As such we should be complete down to at , and at .
Following Bouwens et al. (2015), we fit our observed UV number densities with a Schechter (Schechter, 1976) function, allowing all parameters to be free. We only fit data brighter than as our number densities indicate that we are likely becoming incomplete at such faint magnitudes. The best-fit is shown in Figure 4 and the parameters are listed in Table 3. In both redshift bins we find that our red compact objects constitute roughly of the total star-forming galaxy populations (Bouwens et al., 2021), consistent with the spectroscopic samples of red-dots (Greene et al., 2023). We also report shallower faint-end slopes compared to SF galaxies, however it is possible that the observed flattening of the UVLF for LRDs is induced by the incompleteness of our sample at fainter UV magnitudes. It appears that the LRD luminosities start to become comparable or even outshine galaxies at brighter () magnitudes, which is particularly prominent in the bin. This might be an expected consequence of the assembly of increasingly massive black holes with cosmic time (e.g. see Piana et al., 2022), or selection effects (see Volonteri et al., 2017), however we note that our number counts for the brightest objects are uncertain due to a limited amount of detections available.
Provided that our color and morphology selection is comparably successful at identifying reddened AGN as was previously shown (Labbé et al., 2023b; Greene et al., 2023), it appears that the compact red sources identified in blank JWST fields are dex more numerous compared to the pre-JWST studies of known UV-selected faint quasars (). While this trend has been consistently re-emerging in the new JWST results (e.g. Furtak et al., 2023b; Kokorev et al., 2023a; Maiolino et al., 2023b; Pacucci et al., 2023), it is worth noting that earlier works have already hinted that the number density of UV faint, dusty active black holes could have been much higher than previously thought (Laporte et al., 2017; Morishita et al., 2020; Fujimoto et al., 2022). For example, both Fujimoto et al. (2022) and Morishita et al. (2020) find that the less-luminous red quasar population could be anywhere from 10 to 100 times more common at , compared to quasars luminosity functions at , constructed from ground-based datasets (e.g. Matsuoka et al., 2018; Kato et al., 2020; Niida et al., 2020). The results of this work, together with the recent efforts to study compact red sources, therefore imply that these faint quasar populations, missed by previous surveys, are now being uncovered by the deep and rich multi-wavelength photometry and spectra from JWST. It is also important to highlight that if we extrapolate our UVLF to brighter magnitudes, the number density of LRDs becomes comparable to and then drops below the density of UV-selected quasars. Currently, however, it not possible to speculate whether this is a real physical effect, or simply a consequence of insufficient volumes sampled.
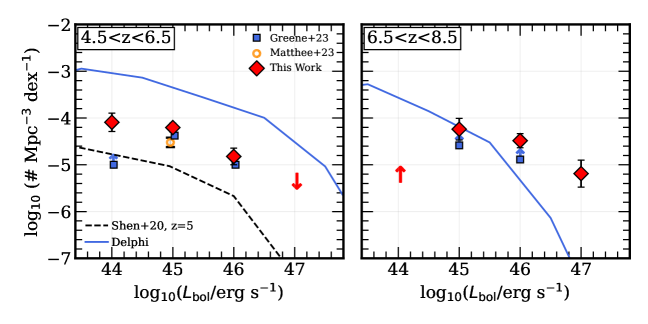
4.3 Bolometric Luminosity Function
Our SED fitting results show that the fraction of the UV light contributing to the total luminosity is small as a result of significant dust reddening (–2.7) in these objects. Even with spectra in hand (e.g. Greene et al., 2023), it is not easy to establish the origins of the rest UV light, which could be AGN light, either scattered or transmitted through patchy dust clouds, or unobscured light from star-formation in the host galaxy. As such, while we put our LRDs in the context of their observed UV luminosities, this does not explicitly describe the physics of potential AGN these compact objects host. Due to that, and also to carry out a comparison with existing spectroscopic bolometric luminosity functions of dusty BL AGN, we also present bolometric luminosity functions in Figure 5 and Table 2. While dust attenuation, estimated from SED fitting, can be an important source of uncertainty, we note that even if all our values were grossly overestimated, this would only change the number densities by on average, which is insignificant when compared to the Poisson and errors.
Understanding where the bolometric luminosity functions start to become incomplete is less straightforward compared to the observed quantities like , as the former also relies on dust correction derived via SED modeling. Here we again rely on the fact that our sample was chosen to be very bright in the detection band as well as it appears to be mostly complete in the UV luminosities. For each bin of bolometric luminosity with a width of 1 dex, we also compute the correction as was described in Section 4.1. Our number densities again confirm that the red-compact AGN candidates are roughly 100 times more abundant compared to the UV-selected AGN at similar intrinsic luminosities (Shen et al., 2020) at . The number densities which we recover are comparable to the previous results for these objects derived in Greene et al. (2023), Labbé et al. (2023b) and Matthee et al. (2023) for erg/s. Curiously however, we find a factor of ten more LRDs compared to Greene et al. (2023) at erg/s. Nominally, the median NIRSpec depth at 4 m of the UNCOVER follow-up of Abell 2744 is shallower compared to the fields we examine, as such it is perhaps unsurprising that we can recover a large fraction of intrinsically faint objects. However since the is not an observed quantity and depends on SED modeling to calculate the dust correction it is difficult to ascertain whether the higher number densities we recover are indeed caused by the depth difference, or simply the bias caused by the spectroscopic-only sample selection and lensed volumes in UNCOVER.
We additionally compare our bolometric luminosity function to the semi-analytic Delphi model (Dayal et al., 2019). Briefly, these models grow black holes from a mixture of light and heavy seeds, aiming to reproduce the latest galaxy and AGN observables at (see also Dayal et al., 2022; Mauerhofer & Dayal, 2023). We find that while our observations are comparable to Delphi results at erg/s at , these models fail to reproduce the high number density of bright objects we report. At on the other hand, our densities consistently fall 1 dex below Delphi predictions. This in return could suggest that the fraction of dusty AGN is diminishing toward later times, as they potentially transition to unobscured quasars (Fu et al., 2017; Fujimoto et al., 2022).
Finally, we also see a higher prevalence of intrinsically brighter objects at , which is likely consequence of larger volumes sampled in our analysis. As already mentioned in Greene et al. (2023) however, it is worth noting that the uncertainties on the relation, dust correction and assuming that these objects are dominated by AGN light at rest-frame optical could cause objects to scatter upwards into the high luminosity bins. We only recover a single object above erg/s at and below erg/s at , respectively. As this is insufficient to properly compute luminosity functions, these are shown as upper (lower) limits in Figure 5 derived by combining the Poisson (Gehrels, 1986) and photo- (Marchesini et al., 2009) uncertainties.
| UV Luminosity | ||
|---|---|---|
| [ABmag] | N | / [cMpc-3 mag-1] |
| -18.0 | 19 | |
| -19.0 | 68 | |
| -20.0 | 53 | |
| -21.0 | 21 | |
| -22.0 | 2 | |
| -18.0 | 5 | |
| -19.0 | 23 | |
| -20.0 | 29 | |
| -21.0 | 9 | |
| -22.0 | 2 | |
| Bolometric Luminosity | ||
| log10(/erg s-1) | N | / [cMpc-3 dex-1] |
| 44.0 | 46 | |
| 45.0 | 93 | |
| 46.0 | 26 | |
| 47.0 | 1 | |
| 44.0 | 1 | |
| 45.0 | 14 | |
| 46.0 | 33 | |
| 47.0 | 9 | |
| Black Hole Mass () | ||
| log10(/) | N | / [cMpc-3 dex-1] |
| 6.0 | 39 | |
| 6.5 | 44 | |
| 7.0 | 40 | |
| 7.5 | 21 | |
| 8.0 | 2 | |
| 8.5 | 1 | |
4.4 The SMBH Mass Function
With the data we have obtained, we will now derive and describe the measurement for the supermassive BH mass function which our compact objects potentially host. Computing the mass of the central black hole generally requires knowledge of the width of the broad lines (e.g. H, H in rest-optical or Mg II in rest-UV) coupled with the luminosity of their broad components or the luminosity derived from the AGN continuum at Å (see e.g. Kaspi et al., 2000; Greene & Ho, 2005).
While secure determination of the black hole mass in our compact objects is not possible due the photometric nature of the sample, we can still place a lower limit on black hole masses (), by making a set of conservative assumptions. To do that, we adopt a scenario where all our AGN candidates accrete at Eddington rate (the physical limit at which outward radiation pressure balances inward gravitational force), such that , where is directly proportional to . While in the literature the Eddington rate () for confirmed AGN in LRDs was found to vary between % (Furtak et al., 2023b; Greene et al., 2023; Kokorev et al., 2023a), we would like to remain conservative and compute a lower limit on the . It is also worth noting that, given the median in the range of 30 %, this is still small compared to other sources of uncertainty.
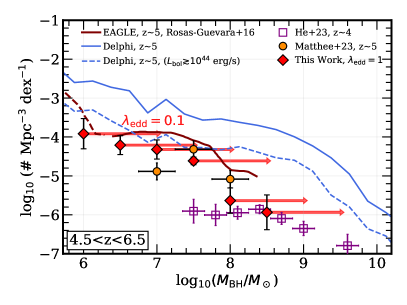
We calculate the directly from the dust-corrected and compute the SMBH mass function as described in the previous sections. We present our SMBH mass function in Figure 6 and Table 2, binned into 0.5 dex intervals to allow a direct comparison with the existing observational and theoretical results in this redshift range. We limit this investigation to the range only. As before, we note that the effect of the uncertainty on our number densities is expected to be at most , largely overshadowed by the Poisson and redshift errors.
We are now in a position to compare our mass function to the existing samples of both bright and faint quasars at . We start with the latest ground based examination of the quasar mass function at from He et al. (2023). The authors focus on a sample of faint broad-line AGN, from a combined Hyper Suprime Cam (HSC) and SDSS dataset, allowing them to extend their examination to a low mass range we are most interested in ( ). We find that, while our result is consistent with the ground based mass function in the high mass regime , our number densities diverge below that mass and continue to rise up to cMpc-3 at . Barring the color selection, it is possible that this effect is purely observational, as the SDSS/HSC detection limits in the rest-UV are much shallower compared to the JWST fields we explore.
Furthermore, we contrast our result to the BH mass function at based on a sample of LRDs from the slitless JWST derived in Matthee et al. (2023). Given the uncertainties, we find our results to be consistent within , although we do not find a sharp drop-off in number densities at , likely driven by low mass incompleteness of grism data as mentioned in Matthee et al..
Naturally, the fact that both our result and Matthee et al. (2023) find more low mass black holes compared to He et al. (2023) is unsurprising, given the depth and wavelength coverage of JWST data. Quite curiously however, it appears that the mass function derived from dusty compact LRDs seems to nicely continue the rising trend of ground-based data, and extend the SMBH mass functions toward . In this redshift range, the maximum volume sampled by our multi-field investigation is roughly equal to cMpc3. Therefore, taking into account the results of He et al. (2023), we should expect only one object with in our images, which indeed is the case. Detection of AGN hosting black hole with masses larger than that, would, however, require survey sizes ten to twenty times larger.
Before drawing conclusions, we would like to conduct a final sanity check, and compare our result to the hydro-dynamical simulation EAGLE (Rosas-Guevara et al., 2016) and semi-analytic Delphi (Dayal et al., 2014, 2019, 2020) simulations describing masses of SMBHs in the same redshift range. We limit our examination of the Delphi models to the bright ( erg/s) regime to match the same luminosity range covered by our objects. In the intermediate, to low mass end ( ) our results are in remarkable agreement with both EAGLE and Delphi, however in both cases we start to see a significant difference in number densities as we move to higher masses. Perhaps a worthwhile question to ask in this case, is whether more of these high-mass BHs would be found in larger areas, we will discuss this in the later section.
Examining both the UV and bolometric luminosity functions we note that LRDs only represent % of the total type I (broad-line) AGN population as inferred by Harikane et al. (2023); Maiolino et al. (2023b), even less so compared to the most recent examination of type II AGN hosts from JADES (Scholtz et al., 2023), where LRDs are 30-40 times less numerous. Taking this into account, we can conclude that, at least at , LRDs appear to represent at most 1 % of the total accreting BH population over the erg/s range. The fact that LRDs are truly a distinct population of dusty broad-line AGN can therefore explain the observed dex disparity between our results and simulations. Finally we would like to reiterate that our investigation of the BH mass function relies on assuming the most conservative case of accretion at exactly the Eddington rate, as we do not want to erroneously overestimate the number of high-mass black holes. Keeping that in mind, in Figure 6 we also show how our mass functions would change if we were to assume an Eddington ratio of 10 % instead. In this case we find that while our number densities compared to UV samples are still high, we now more closely match the abundance of high mass SMBHs predicted by Delphi. However, until broad emission line observations for all our sources are available, the value of will remain uncertain.
| [ABmag] | Mpc-3] | ||
|---|---|---|---|
| 5 | |||
| 7 |
5 Discussion and Summary
5.1 Abundance of bright compact sources
Previously limited to UVselected samples at (Kashikawa et al., 2015; Bañados et al., 2018; Matsuoka et al., 2018; Inayoshi et al., 2020; Wang et al., 2021; Fan et al., 2022) we are now able to use JWST to reveal the presence of AGN during (e.g. Kocevski et al., 2023; Matthee et al., 2023; Übler et al., 2023) and even beyond the epoch of reionization, (e.g. Bogdan et al., 2023; Furtak et al., 2023c; Goulding et al., 2023; Kokorev et al., 2023a; Larson et al., 2023; Lambrides et al., 2023; Maiolino et al., 2023a) only hundreds of millions of years after the Big Bang. Standing out among these early studies of active black holes, is the population of reddened type I AGN, the so called “little red dots” (Greene et al., 2023; Labbé et al., 2023b; Matthee et al., 2023).
While the study of this unique population has been mostly limited to small spectroscopic samples, most recent efforts focused on the expansive Abell 2744 JWST data-set (Labbé et al., 2023b) have shown great promise at using a combination of NIRCam colors and morphology to identify reddened AGN. This initial photometric selection was shown to be remarkably successful with % of targets indeed confirmed as dusty broad-line AGN (Fujimoto et al., 2023a; Furtak et al., 2023c; Greene et al., 2023; Kokorev et al., 2023a). It is clear that these objects play an important role in the story of black hole growth at early times, however so far a systematic review of these enigmatic AGN across multiple fields has not been undertaken.
Motivated by the success of this photometric selection, we present a sample of 260 reddened BL AGN candidates in the redshift range, covering 4 separate blank JWST fields with a total area of arcmin2. We uniformly reduce the NIRCam JWST data from a variety of public programs, complementing our photometric coverage with archival HST observations. We perform a color and morphology selection to identify the most promising compact objects which display a dichotomy in their observed SED shapes, namely a blue rest-UV continuum, and a red power law-like rest-optical.
Using model fitting, we derive photometric redshifts as well as a range of physical parameters including , and dust corrected . We split our objects into two redshifts bins at and and explore their contribution to the UV and bolometric luminosity functions of star-forming galaxies, as well as UV-selected quasars. Consistent with the previous works (Greene et al., 2023; Matthee et al., 2023; Maiolino et al., 2023b) exploring high- BL AGN, we find that number densities of these objects at are surprisingly high, in excess of compared to faint UV selected quasars (e.g. Niida et al., 2020; He et al., 2023), while also accounting for of the total BL AGN population (Harikane et al., 2023; Maiolino et al., 2023b), and % of UV-selected star forming galaxies (e.g. Bouwens et al., 2021). Moreover, while some of these objects were potentially pinned down as potential sources of reionization in their local environment (Fujimoto et al., 2023a), it appears that their UV luminosities are still insufficient to contribute to reionization in a significant way (Dayal et al., 2024).
Assuming accretion at the Eddington rate, we also place a lower limit on the of our objects, finding that some of these can already be very massive ( ) only a few hundred of years after the Big Bang. Using these masses we were also able to construct our prediction for the SMBH mass function, and for the first time, extend it to the low-mass ( ) regime. We find that our mass function results are completely consistent with the number densities derived for faint dusty AGN from Matthee et al. (2023) at intermediate masses, as well as those from UV-selected samples at high mass (He et al., 2023). We find that both hydro-dynamical and semi-analytic predictions for the number of black holes at this redshift match our observations below , however start to disagree by almost 2 dex at higher masses. These massive and bright black holes are likely to be heavily obscured in the rest-frame UV, and thus are not selected as LRDs due to a lack of a clear blue component.
5.2 Final Remarks
Using observed NIR colors to pick out active black holes in extragalactic fields is by no means a novel endeavor and has already been successfully done with the IRAC instrument, onboard the Spitzer Space Telescope (Lacy et al., 2004; Stern et al., 2005; Donley et al., 2012). This method, however, is still in its infancy when it comes to JWST (Labbé et al., 2023b; Andika et al., 2024). As already pointed out by Matthee et al. (2023), very few JWST programs that detect dusty AGN, were actually designed with AGN in mind, implying that there is still more that we can to address a growing number of questions about this population.
Firstly, the physical mechanisms that govern BH formation and growth in these systems are still poorly understood, however there exists already a growing body of works which try to decipher this enigmatic population (Greene et al., 2023; Silk et al., 2024). One such puzzle, is the origin of the blue light found in LRDs. The similarity between blue slopes of low-metallicity star-forming galaxies and quasars does not allow us to make a clear assessment of whether the rest-UV light originates from the AGN itself or the compact host galaxy surrounding it from the continuum alone. One way to solve this is to target the Mg II doublet ( Å), and confirm whether the lines are broadened or not. This however would require longer integration times with NIRSpec as medium or even high resolution gratings would be required to achieve the necessary spectral fidelity.
Secondly, there are no models as of yet, which can adequately describe the light we see emerging from these objects. So far, we mainly have had to rely on combinations of dust-free and dust attenuated empirical models of local quasars, which might be adequately describing AGN at high-. Moreover, the lingering uncertainty on the correction can introduce some biases in our estimates of and the . One solution to alleviate this is to stack spectra of known LRDs, to define sets of reliable models describing these populations and aiding with further photometric selection.
Thirdly, it is crucial to note that a substantial proportion of massive SMBHs (with ) at high redshifts (high-) can be heavily obscured, as implied by Delphi. Similar conclusions were already reached from the X-ray luminosity functions at , both from simulations (Ni et al., 2020), and observations (Aird et al., 2015; Vito et al., 2018). In addition Trebitsch et al. (2019) have shown that accreting SMBHs in Lyman break galaxies are rarely UV-bright. With this in mind, selecting these massive AGN as LRDs would thus not be possible, as a combination of very deep rest-UV imaging and large areas are required. Despite that, these objects should still appear bright in near-infrared, which opens up the possibility of effectively identifying them through large or parallel surveys using MIRI.
Finally, as was already shown recently by Williams et al. (2023a) and Pérez-González et al. (2024), MIRI can also assist with clarifying true numbers of AGN among LRDs as some of these could be dusty progenitors of compact ellipticals.
Early results from JWST have already provided us with quite unexpected and remarkable results regarding number densities of early AGN, leading to a shift in our understanding of their formation and growth in the early Universe. Our results highlight the potential of using NIRCam alone to select reddened AGN at high- in an effort to better understand their properties and abundance. While some limitations to this technique exist, as we already discuss in our work, this provides a crucial set of next steps in order to bridge the gap between UV bright quasars and faint SMBHs. What is clear already, however, is the role of faint reddened AGN at early times can not be overlooked.
References
- Adams et al. (2023) Adams, N. J., Conselice, C. J., Ferreira, L., et al. 2023, MNRAS, 518, 4755, doi: 10.1093/mnras/stac3347
- Aird et al. (2015) Aird, J., Coil, A. L., Georgakakis, A., et al. 2015, MNRAS, 451, 1892, doi: 10.1093/mnras/stv1062
- Akins et al. (2023) Akins, H. B., Casey, C. M., Allen, N., et al. 2023, ApJ, 956, 61, doi: 10.3847/1538-4357/acef21
- Andika et al. (2024) Andika, I. T., Jahnke, K., Onoue, M., et al. 2024, arXiv e-prints, arXiv:2401.11826. https://arxiv.org/abs/2401.11826
- Atek et al. (2023) Atek, H., Chemerynska, I., Wang, B., et al. 2023, MNRAS, 524, 5486, doi: 10.1093/mnras/stad1998
- Austin et al. (2023) Austin, D., Adams, N., Conselice, C. J., et al. 2023, ApJ, 952, L7, doi: 10.3847/2041-8213/ace18d
- Bañados et al. (2018) Bañados, E., Carilli, C., Walter, F., et al. 2018, ApJ, 861, L14, doi: 10.3847/2041-8213/aac511
- Baggen et al. (2023) Baggen, J. F. W., van Dokkum, P., Labbé, I., et al. 2023, ApJ, 955, L12, doi: 10.3847/2041-8213/acf5ef
- Bagley et al. (2022) Bagley, M. B., Finkelstein, S. L., Koekemoer, A. M., et al. 2022, arXiv e-prints, arXiv:2211.02495. https://arxiv.org/abs/2211.02495
- Banerji et al. (2015) Banerji, M., Alaghband-Zadeh, S., Hewett, P. C., & McMahon, R. G. 2015, MNRAS, 447, 3368, doi: 10.1093/mnras/stu2649
- Barbary (2016) Barbary, K. 2016, Journal of Open Source Software, 1, 58, doi: 10.21105/joss.00058
- Barro et al. (2023) Barro, G., Perez-Gonzalez, P. G., Kocevski, D. D., et al. 2023, arXiv e-prints, arXiv:2305.14418, doi: 10.48550/arXiv.2305.14418
- Behroozi et al. (2019) Behroozi, P., Wechsler, R. H., Hearin, A. P., & Conroy, C. 2019, MNRAS, 488, 3143, doi: 10.1093/mnras/stz1182
- Behroozi et al. (2020) Behroozi, P., Conroy, C., Wechsler, R. H., et al. 2020, MNRAS, 499, 5702, doi: 10.1093/mnras/staa3164
- Behroozi & Silk (2015) Behroozi, P. S., & Silk, J. 2015, ApJ, 799, 32, doi: 10.1088/0004-637X/799/1/32
- Bertin & Arnouts (1996) Bertin, E., & Arnouts, S. 1996, A&AS, 117, 393, doi: 10.1051/aas:1996164
- Bezanson et al. (2022) Bezanson, R., Labbe, I., Whitaker, K. E., et al. 2022, arXiv e-prints, arXiv:2212.04026. https://arxiv.org/abs/2212.04026
- Bogdan et al. (2023) Bogdan, A., Goulding, A., Natarajan, P., et al. 2023, arXiv e-prints, arXiv:2305.15458, doi: 10.48550/arXiv.2305.15458
- Bouwens et al. (2015) Bouwens, R. J., Illingworth, G. D., Oesch, P. A., et al. 2015, ApJ, 803, 34, doi: 10.1088/0004-637X/803/1/34
- Bouwens et al. (2021) Bouwens, R. J., Oesch, P. A., Stefanon, M., et al. 2021, AJ, 162, 47, doi: 10.3847/1538-3881/abf83e
- Boylan-Kolchin (2023) Boylan-Kolchin, M. 2023, Nature Astronomy, 7, 731, doi: 10.1038/s41550-023-01937-7
- Bradley et al. (2023) Bradley, L. D., Coe, D., Brammer, G., et al. 2023, ApJ, 955, 13, doi: 10.3847/1538-4357/acecfe
- Brammer (2022) Brammer, G. 2022, msaexp: NIRSpec analyis tools, 0.3, doi: 10.5281/zenodo.7299500
- Brammer (2023) Brammer, G. 2023, grizli, 1.8.2, Zenodo, Zenodo, doi: 10.5281/zenodo.7712834
- Brammer et al. (2008) Brammer, G. B., van Dokkum, P. G., & Coppi, P. 2008, ApJ, 686, 1503, doi: 10.1086/591786
- Bunker et al. (2023) Bunker, A. J., Saxena, A., Cameron, A. J., et al. 2023, A&A, 677, A88, doi: 10.1051/0004-6361/202346159
- Burgasser et al. (2023) Burgasser, A. J., Gerasimov, R., Bezanson, R., et al. 2023, arXiv e-prints, arXiv:2308.12107, doi: 10.48550/arXiv.2308.12107
- Carnall et al. (2022) Carnall, A. C., Begley, R., McLeod, D. J., et al. 2022, arXiv e-prints, arXiv:2207.08778. https://arxiv.org/abs/2207.08778
- Casey et al. (2023) Casey, C. M., Akins, H. B., Shuntov, M., et al. 2023, arXiv e-prints, arXiv:2308.10932, doi: 10.48550/arXiv.2308.10932
- Chabrier (2003) Chabrier, G. 2003, PASP, 115, 763, doi: 10.1086/376392
- Conroy et al. (2009) Conroy, C., Gunn, J. E., & White, M. 2009, ApJ, 699, 486, doi: 10.1088/0004-637X/699/1/486
- Curtis-Lake et al. (2023) Curtis-Lake, E., Carniani, S., Cameron, A., et al. 2023, Nature Astronomy, 7, 622, doi: 10.1038/s41550-023-01918-w
- Davé et al. (2019) Davé, R., Anglés-Alcázar, D., Narayanan, D., et al. 2019, MNRAS, 486, 2827, doi: 10.1093/mnras/stz937
- Dayal et al. (2017) Dayal, P., Choudhury, T. R., Bromm, V., & Pacucci, F. 2017, ApJ, 836, 16, doi: 10.3847/1538-4357/836/1/16
- Dayal et al. (2014) Dayal, P., Ferrara, A., Dunlop, J. S., & Pacucci, F. 2014, MNRAS, 445, 2545, doi: 10.1093/mnras/stu1848
- Dayal et al. (2019) Dayal, P., Rossi, E. M., Shiralilou, B., et al. 2019, MNRAS, 486, 2336, doi: 10.1093/mnras/stz897
- Dayal et al. (2020) Dayal, P., Volonteri, M., Choudhury, T. R., et al. 2020, MNRAS, 495, 3065, doi: 10.1093/mnras/staa1138
- Dayal et al. (2022) Dayal, P., Ferrara, A., Sommovigo, L., et al. 2022, MNRAS, 512, 989, doi: 10.1093/mnras/stac537
- Dayal et al. (2024) Dayal, P., Volonteri, M., Greene, J. E., et al. 2024, arXiv e-prints, arXiv:2401.11242. https://arxiv.org/abs/2401.11242
- Donley et al. (2012) Donley, J. L., Koekemoer, A. M., Brusa, M., et al. 2012, ApJ, 748, 142, doi: 10.1088/0004-637X/748/2/142
- Eisenstein et al. (2023a) Eisenstein, D. J., Willott, C., Alberts, S., et al. 2023a, arXiv e-prints, arXiv:2306.02465, doi: 10.48550/arXiv.2306.02465
- Eisenstein et al. (2023b) Eisenstein, D. J., Johnson, B. D., Robertson, B., et al. 2023b, arXiv e-prints, arXiv:2310.12340, doi: 10.48550/arXiv.2310.12340
- Endsley et al. (2023) Endsley, R., Stark, D. P., Lyu, J., et al. 2023, MNRAS, 520, 4609, doi: 10.1093/mnras/stad266
- Fan et al. (2022) Fan, X., Banados, E., & Simcoe, R. A. 2022, arXiv e-prints, arXiv:2212.06907, doi: 10.48550/arXiv.2212.06907
- Ferrara et al. (2023) Ferrara, A., Pallottini, A., & Dayal, P. 2023, MNRAS, 522, 3986, doi: 10.1093/mnras/stad1095
- Finkelstein & Bagley (2022) Finkelstein, S. L., & Bagley, M. B. 2022, ApJ, 938, 25, doi: 10.3847/1538-4357/ac89eb
- Finkelstein et al. (2023) Finkelstein, S. L., Leung, G. C. K., Bagley, M. B., et al. 2023, arXiv e-prints, arXiv:2311.04279, doi: 10.48550/arXiv.2311.04279
- Fruchter & Hook (2002) Fruchter, A. S., & Hook, R. N. 2002, PASP, 114, 144, doi: 10.1086/338393
- Fu et al. (2017) Fu, H., Isbell, J., Casey, C. M., et al. 2017, ApJ, 844, 123, doi: 10.3847/1538-4357/aa7c63
- Fujimoto et al. (2022) Fujimoto, S., Brammer, G. B., Watson, D., et al. 2022, Nature, 604, 261, doi: 10.1038/s41586-022-04454-1
- Fujimoto et al. (2023a) Fujimoto, S., Wang, B., Weaver, J., et al. 2023a, arXiv e-prints, arXiv:2308.11609, doi: 10.48550/arXiv.2308.11609
- Fujimoto et al. (2023b) Fujimoto, S., Kohno, K., Ouchi, M., et al. 2023b, arXiv e-prints, arXiv:2303.01658, doi: 10.48550/arXiv.2303.01658
- Fujimoto et al. (2023c) Fujimoto, S., Bezanson, R., Labbe, I., et al. 2023c, arXiv e-prints, arXiv:2309.07834, doi: 10.48550/arXiv.2309.07834
- Furtak et al. (2023a) Furtak, L. J., Zitrin, A., Plat, A., et al. 2023a, ApJ, 952, 142, doi: 10.3847/1538-4357/acdc9d
- Furtak et al. (2023b) Furtak, L. J., Labbé, I., Zitrin, A., et al. 2023b, arXiv e-prints, arXiv:2308.05735. https://arxiv.org/abs/2308.05735
- Furtak et al. (2023c) Furtak, L. J., Zitrin, A., Weaver, J. R., et al. 2023c, MNRAS, 523, 4568, doi: 10.1093/mnras/stad1627
- Gaia Collaboration et al. (2021) Gaia Collaboration, Brown, A. G. A., Vallenari, A., et al. 2021, A&A, 649, A1, doi: 10.1051/0004-6361/202039657
- Gehrels (1986) Gehrels, N. 1986, ApJ, 303, 336, doi: 10.1086/164079
- Giallongo et al. (2019) Giallongo, E., Grazian, A., Fiore, F., et al. 2019, ApJ, 884, 19, doi: 10.3847/1538-4357/ab39e1
- Glikman et al. (2006) Glikman, E., Helfand, D. J., & White, R. L. 2006, ApJ, 640, 579, doi: 10.1086/500098
- Glikman et al. (2015) Glikman, E., Simmons, B., Mailly, M., et al. 2015, ApJ, 806, 218, doi: 10.1088/0004-637X/806/2/218
- Gordon et al. (2003) Gordon, K. D., Clayton, G. C., Misselt, K. A., Landolt, A. U., & Wolff, M. J. 2003, ApJ, 594, 279, doi: 10.1086/376774
- Goulding et al. (2023) Goulding, A. D., Greene, J. E., Setton, D. J., et al. 2023, arXiv e-prints, arXiv:2308.02750, doi: 10.48550/arXiv.2308.02750
- Grazian et al. (2018) Grazian, A., Giallongo, E., Boutsia, K., et al. 2018, A&A, 613, A44, doi: 10.1051/0004-6361/201732385
- Greene & Ho (2005) Greene, J. E., & Ho, L. C. 2005, ApJ, 630, 122, doi: 10.1086/431897
- Greene et al. (2023) Greene, J. E., Labbe, I., Goulding, A. D., et al. 2023, arXiv e-prints, arXiv:2309.05714, doi: 10.48550/arXiv.2309.05714
- Harikane et al. (2023) Harikane, Y., Zhang, Y., Nakajima, K., et al. 2023, arXiv e-prints, arXiv:2303.11946, doi: 10.48550/arXiv.2303.11946
- He et al. (2023) He, W., Akiyama, M., Enoki, M., et al. 2023, arXiv e-prints, arXiv:2311.08922, doi: 10.48550/arXiv.2311.08922
- Inayoshi et al. (2020) Inayoshi, K., Visbal, E., & Haiman, Z. 2020, ARA&A, 58, 27, doi: 10.1146/annurev-astro-120419-014455
- Jin et al. (2022) Jin, S., Sillassen, N. B., Magdis, G. E., et al. 2022, arXiv e-prints, arXiv:2212.09372. https://arxiv.org/abs/2212.09372
- Jin et al. (2023) —. 2023, A&A, 670, L11, doi: 10.1051/0004-6361/202245724
- Kannan et al. (2023) Kannan, R., Springel, V., Hernquist, L., et al. 2023, MNRAS, 524, 2594, doi: 10.1093/mnras/stac3743
- Kartaltepe et al. (2023) Kartaltepe, J. S., Rose, C., Vanderhoof, B. N., et al. 2023, ApJ, 946, L15, doi: 10.3847/2041-8213/acad01
- Kashikawa et al. (2015) Kashikawa, N., Ishizaki, Y., Willott, C. J., et al. 2015, ApJ, 798, 28, doi: 10.1088/0004-637X/798/1/28
- Kaspi et al. (2000) Kaspi, S., Smith, P. S., Netzer, H., et al. 2000, ApJ, 533, 631, doi: 10.1086/308704
- Kato et al. (2020) Kato, N., Matsuoka, Y., Onoue, M., et al. 2020, PASJ, 72, 84, doi: 10.1093/pasj/psaa074
- Killi et al. (2023) Killi, M., Watson, D., Brammer, G., et al. 2023, arXiv e-prints, arXiv:2312.03065, doi: 10.48550/arXiv.2312.03065
- Kocevski et al. (2023) Kocevski, D. D., Onoue, M., Inayoshi, K., et al. 2023, arXiv e-prints, arXiv:2302.00012, doi: 10.48550/arXiv.2302.00012
- Kokorev et al. (2022) Kokorev, V., Brammer, G., Fujimoto, S., et al. 2022, ApJS, 263, 38, doi: 10.3847/1538-4365/ac9909
- Kokorev et al. (2023a) Kokorev, V., Fujimoto, S., Labbe, I., et al. 2023a, ApJ, 957, L7, doi: 10.3847/2041-8213/ad037a
- Kokorev et al. (2023b) Kokorev, V., Jin, S., Magdis, G. E., et al. 2023b, ApJ, 945, L25, doi: 10.3847/2041-8213/acbd9d
- Kron (1980) Kron, R. G. 1980, ApJS, 43, 305, doi: 10.1086/190669
- Kulkarni et al. (2019) Kulkarni, G., Worseck, G., & Hennawi, J. F. 2019, MNRAS, 488, 1035, doi: 10.1093/mnras/stz1493
- Labbé et al. (2013) Labbé, I., Oesch, P. A., Bouwens, R. J., et al. 2013, ApJ, 777, L19, doi: 10.1088/2041-8205/777/2/L19
- Labbé et al. (2023a) Labbé, I., van Dokkum, P., Nelson, E., et al. 2023a, Nature, 616, 266, doi: 10.1038/s41586-023-05786-2
- Labbé et al. (2023b) Labbé, I., Greene, J. E., Bezanson, R., et al. 2023b, arXiv e-prints, arXiv:2306.07320, doi: 10.48550/arXiv.2306.07320
- Lacy et al. (2004) Lacy, M., Storrie-Lombardi, L. J., Sajina, A., et al. 2004, ApJS, 154, 166, doi: 10.1086/422816
- Lambrides et al. (2023) Lambrides, E., Chiaberge, M., Long, A., et al. 2023, arXiv e-prints, arXiv:2308.12823, doi: 10.48550/arXiv.2308.12823
- Laporte et al. (2017) Laporte, N., Bauer, F. E., Troncoso-Iribarren, P., et al. 2017, A&A, 604, A132, doi: 10.1051/0004-6361/201730628
- Larson et al. (2023) Larson, R. L., Finkelstein, S. L., Kocevski, D. D., et al. 2023, arXiv e-prints, arXiv:2303.08918, doi: 10.48550/arXiv.2303.08918
- Leung et al. (2023) Leung, G. C. K., Bagley, M. B., Finkelstein, S. L., et al. 2023, ApJ, 954, L46, doi: 10.3847/2041-8213/acf365
- Lovell et al. (2023) Lovell, C. C., Harrison, I., Harikane, Y., Tacchella, S., & Wilkins, S. M. 2023, MNRAS, 518, 2511, doi: 10.1093/mnras/stac3224
- Maiolino et al. (2023a) Maiolino, R., Scholtz, J., Witstok, J., et al. 2023a, arXiv e-prints, arXiv:2305.12492, doi: 10.48550/arXiv.2305.12492
- Maiolino et al. (2023b) Maiolino, R., Scholtz, J., Curtis-Lake, E., et al. 2023b, arXiv e-prints, arXiv:2308.01230, doi: 10.48550/arXiv.2308.01230
- Marchesini et al. (2009) Marchesini, D., van Dokkum, P. G., Förster Schreiber, N. M., et al. 2009, ApJ, 701, 1765, doi: 10.1088/0004-637X/701/2/1765
- Mason et al. (2023) Mason, C. A., Trenti, M., & Treu, T. 2023, MNRAS, 521, 497, doi: 10.1093/mnras/stad035
- Matsuoka et al. (2018) Matsuoka, Y., Strauss, M. A., Kashikawa, N., et al. 2018, ApJ, 869, 150, doi: 10.3847/1538-4357/aaee7a
- Matsuoka et al. (2023) Matsuoka, Y., Onoue, M., Iwasawa, K., et al. 2023, ApJ, 949, L42, doi: 10.3847/2041-8213/acd69f
- Matthee et al. (2023) Matthee, J., Naidu, R. P., Brammer, G., et al. 2023, arXiv e-prints, arXiv:2306.05448, doi: 10.48550/arXiv.2306.05448
- Mauerhofer & Dayal (2023) Mauerhofer, V., & Dayal, P. 2023, MNRAS, 526, 2196, doi: 10.1093/mnras/stad2734
- Mitra et al. (2018) Mitra, S., Choudhury, T. R., & Ferrara, A. 2018, MNRAS, 473, 1416, doi: 10.1093/mnras/stx2443
- Morishita et al. (2020) Morishita, T., Stiavelli, M., Trenti, M., et al. 2020, ApJ, 904, 50, doi: 10.3847/1538-4357/abba83
- Naidu et al. (2022) Naidu, R. P., Oesch, P. A., van Dokkum, P., et al. 2022, ApJ, 940, L14, doi: 10.3847/2041-8213/ac9b22
- Ni et al. (2020) Ni, Y., Di Matteo, T., Gilli, R., et al. 2020, MNRAS, 495, 2135, doi: 10.1093/mnras/staa1313
- Niida et al. (2020) Niida, M., Nagao, T., Ikeda, H., et al. 2020, ApJ, 904, 89, doi: 10.3847/1538-4357/abbe11
- Oesch et al. (2023) Oesch, P. A., Brammer, G., Naidu, R. P., et al. 2023, MNRAS, 525, 2864, doi: 10.1093/mnras/stad2411
- Oke (1974) Oke, J. B. 1974, ApJS, 27, 21, doi: 10.1086/190287
- Ormerod et al. (2024) Ormerod, K., Conselice, C. J., Adams, N. J., et al. 2024, MNRAS, 527, 6110, doi: 10.1093/mnras/stad3597
- Pacucci et al. (2022) Pacucci, F., Dayal, P., Harikane, Y., Inoue, A. K., & Loeb, A. 2022, MNRAS, 514, L6, doi: 10.1093/mnrasl/slac035
- Pacucci et al. (2023) Pacucci, F., Nguyen, B., Carniani, S., Maiolino, R., & Fan, X. 2023, arXiv e-prints, arXiv:2308.12331, doi: 10.48550/arXiv.2308.12331
- Pasha & Miller (2023) Pasha, I., & Miller, T. B. 2023, The Journal of Open Source Software, 8, 5703, doi: 10.21105/joss.05703
- Pérez-González et al. (2024) Pérez-González, P. G., Barro, G., Rieke, G. H., et al. 2024, arXiv e-prints, arXiv:2401.08782, doi: 10.48550/arXiv.2401.08782
- Piana et al. (2022) Piana, O., Dayal, P., & Choudhury, T. R. 2022, MNRAS, 510, 5661, doi: 10.1093/mnras/stab3757
- Planck Collaboration et al. (2020) Planck Collaboration, Aghanim, N., Akrami, Y., et al. 2020, A&A, 641, A6, doi: 10.1051/0004-6361/201833910
- Rigby et al. (2023) Rigby, J., Perrin, M., McElwain, M., et al. 2023, PASP, 135, 048001, doi: 10.1088/1538-3873/acb293
- Robertson et al. (2023) Robertson, B. E., Tacchella, S., Johnson, B. D., et al. 2023, Nature Astronomy, 7, 611, doi: 10.1038/s41550-023-01921-1
- Rosas-Guevara et al. (2016) Rosas-Guevara, Y., Bower, R. G., Schaye, J., et al. 2016, MNRAS, 462, 190, doi: 10.1093/mnras/stw1679
- Schechter (1976) Schechter, P. 1976, ApJ, 203, 297, doi: 10.1086/154079
- Schmidt (1968) Schmidt, M. 1968, ApJ, 151, 393, doi: 10.1086/149446
- Scholtz et al. (2023) Scholtz, J., Maiolino, R., D’Eugenio, F., et al. 2023, arXiv e-prints, arXiv:2311.18731, doi: 10.48550/arXiv.2311.18731
- Sérsic (1963) Sérsic, J. L. 1963, Boletin de la Asociacion Argentina de Astronomia La Plata Argentina, 6, 41
- Shen et al. (2020) Shen, X., Hopkins, P. F., Faucher-Giguère, C.-A., et al. 2020, MNRAS, 495, 3252, doi: 10.1093/mnras/staa1381
- Silk et al. (2024) Silk, J., Begelman, M., Norman, C., Nusser, A., & Wyse, R. 2024, arXiv e-prints, arXiv:2401.02482. https://arxiv.org/abs/2401.02482
- Skelton et al. (2014) Skelton, R. E., Whitaker, K. E., Momcheva, I. G., et al. 2014, ApJS, 214, 24, doi: 10.1088/0067-0049/214/2/24
- Steinhardt et al. (2023) Steinhardt, C. L., Kokorev, V., Rusakov, V., Garcia, E., & Sneppen, A. 2023, ApJ, 951, L40, doi: 10.3847/2041-8213/acdef6
- Stern et al. (2005) Stern, D., Eisenhardt, P., Gorjian, V., et al. 2005, ApJ, 631, 163, doi: 10.1086/432523
- Sun et al. (2023) Sun, G., Faucher-Giguère, C.-A., Hayward, C. C., & Shen, X. 2023, MNRAS, 526, 2665, doi: 10.1093/mnras/stad2902
- Trebitsch et al. (2023) Trebitsch, M., Hutter, A., Dayal, P., et al. 2023, MNRAS, 518, 3576, doi: 10.1093/mnras/stac2138
- Trebitsch et al. (2019) Trebitsch, M., Volonteri, M., & Dubois, Y. 2019, MNRAS, 487, 819, doi: 10.1093/mnras/stz1280
- Übler et al. (2023) Übler, H., Maiolino, R., Curtis-Lake, E., et al. 2023, arXiv e-prints, arXiv:2302.06647, doi: 10.48550/arXiv.2302.06647
- Valentino et al. (2023) Valentino, F., Brammer, G., Gould, K. M. L., et al. 2023, arXiv e-prints, arXiv:2302.10936, doi: 10.48550/arXiv.2302.10936
- Vanden Berk et al. (2001) Vanden Berk, D. E., Richards, G. T., Bauer, A., et al. 2001, AJ, 122, 549, doi: 10.1086/321167
- Vito et al. (2018) Vito, F., Brandt, W. N., Yang, G., et al. 2018, MNRAS, 473, 2378, doi: 10.1093/mnras/stx2486
- Volonteri et al. (2017) Volonteri, M., Reines, A. E., Atek, H., Stark, D. P., & Trebitsch, M. 2017, ApJ, 849, 155, doi: 10.3847/1538-4357/aa93f1
- Wang et al. (2023) Wang, B., Fujimoto, S., Labbe, I., et al. 2023, arXiv e-prints, arXiv:2308.03745, doi: 10.48550/arXiv.2308.03745
- Wang et al. (2021) Wang, L., Gao, F., Best, P. N., et al. 2021, A&A, 648, A8, doi: 10.1051/0004-6361/202038811
- Weaver et al. (2022) Weaver, J. R., Kauffmann, O. B., Ilbert, O., et al. 2022, ApJS, 258, 11, doi: 10.3847/1538-4365/ac3078
- Weaver et al. (2023a) Weaver, J. R., Cutler, S. E., Pan, R., et al. 2023a, arXiv e-prints, arXiv:2301.02671, doi: 10.48550/arXiv.2301.02671
- Weaver et al. (2023b) Weaver, J. R., Zalesky, L., Kokorev, V., et al. 2023b, ApJS, 269, 20, doi: 10.3847/1538-4365/acf850
- Whitaker et al. (2011) Whitaker, K. E., Labbé, I., van Dokkum, P. G., et al. 2011, ApJ, 735, 86, doi: 10.1088/0004-637X/735/2/86
- Whitaker et al. (2019) Whitaker, K. E., Ashas, M., Illingworth, G., et al. 2019, ApJS, 244, 16, doi: 10.3847/1538-4365/ab3853
- Wilkins et al. (2022) Wilkins, S. M., Vijayan, A. P., Lovell, C. C., et al. 2022, MNRAS, 517, 3227, doi: 10.1093/mnras/stac2548
- Williams et al. (2023a) Williams, C. C., Alberts, S., Ji, Z., et al. 2023a, arXiv e-prints, arXiv:2311.07483, doi: 10.48550/arXiv.2311.07483
- Williams et al. (2023b) Williams, H., Kelly, P. L., Chen, W., et al. 2023b, Science, 380, 416, doi: 10.1126/science.adf5307
- Yang et al. (2023) Yang, G., Caputi, K. I., Papovich, C., et al. 2023, ApJ, 950, L5, doi: 10.3847/2041-8213/acd639
- Yang et al. (2021) Yang, J., Wang, F., Fan, X., et al. 2021, ApJ, 923, 262, doi: 10.3847/1538-4357/ac2b32
- Yung et al. (2019) Yung, L. Y. A., Somerville, R. S., Finkelstein, S. L., Popping, G., & Davé, R. 2019, MNRAS, 483, 2983, doi: 10.1093/mnras/sty3241
- Yung et al. (2020) Yung, L. Y. A., Somerville, R. S., Finkelstein, S. L., et al. 2020, MNRAS, 496, 4574, doi: 10.1093/mnras/staa1800