Here There Be (Dusty) Monsters: High Redshift AGN are Dustier Than Their Hosts
Abstract
JWST spectroscopy has discovered a population of galaxies with broad Balmer emission lines, and narrow forbidden lines, that are consistent with hosting active galactic nuclei (AGN). Many of these systems, now known as “little red dots” (LRDs), are compact and have unique colors that are very red in the optical/near-infrared and blue in the ultraviolet. The relative contribution of galaxy starlight and AGN to these systems remains uncertain, especially for the galaxies with unusual blue+red spectral energy distributions. In this work, we use Balmer decrements to measure the independent dust attenuation of the broad and narrow emission-line components of a sample of 29 broad-line AGN identified from three public JWST spectroscopy surveys: CEERS, JADES, and RUBIES. Stacking the narrow components from the spectra of 25 sources with broad H and no broad H results in a median narrow H/H = (consistent with ) and broad H/H (). The narrow and broad Balmer decrements imply little-to-no attenuation of the narrow emission lines, which are consistent with being powered by star formation and located on larger physical scales. Meanwhile, the lower limit in broad H/H decrement, with broad H undetected in the stacked spectrum of 25 broad-H AGN, implies significant dust attenuation of the broad-line emitting region that is presumably associated with the central AGN. Our results indicate that these systems, on average, are consistent with heavily dust-attenuated AGN powering the red parts of their SED while their blue UV emission is powered by unattenuated star formation in the host galaxy.
1 Introduction
JWST observations of extragalactic deep fields have unveiled a new regime of black hole (BH) science; faint, high-redshift () active galactic nuclei (AGN) are being detected in abundance through broad Balmer line emission and are consistent with being powered by BHs with inferred masses (Kocevski et al., 2023; Larson et al., 2023; Harikane et al., 2023a; Maiolino et al., 2023; Übler et al., 2023; Killi et al., 2023; Kokorev et al., 2023; Greene et al., 2024a; Kocevski et al., 2024; Taylor et al., 2024). This sample of AGN allows us to probe the low-mass distribution of BHs at high-redshifts, providing insight into the first black holes, i.e., the population of black hole seeds (e.g., Volonteri et al., 2003; Bromm & Loeb, 2003; Lodato & Natarajan, 2006; Inayoshi et al., 2020; Pacucci et al., 2023).
A fraction () of broad-line (BL) identified AGN are compact sources that appear heavily obscured and are characterized by a “V-shaped” spectral energy distribution (SED) with a steep red continuum in the rest-frame optical and elevated blue colors in the UV (Matthee et al., 2024a; Greene et al., 2024a; Kocevski et al., 2024; Barro et al., 2024). The emission mechanisms that power the red+blue colors in these sources, now colloquially known as “little red dots” (LRDs) (Matthee et al., 2024a), have been heavily debated in the literature. The excess of UV light can be explained by light scattered from a central AGN or from an unobscured host galaxy, while the optical colors could be a dust-reddened AGN or emission from starburst galaxies (Kocevski et al., 2023; Labbe et al., 2023; Barro et al., 2024; Li et al., 2024; Akins et al., 2024). JWST-detected broad-line AGN are more abundant (Harikane et al., 2023b, a; Kokorev et al., 2023; Greene et al., 2024b), about 1-2 dex higher in number density, than what is expected from local quasar studies (Vestergaard & Osmer, 2009; Kelly & Shen, 2013; Matsuoka et al., 2018) and provide a unique population to further explore the relation in the early Universe (Pacucci et al., 2023; Durodola et al., 2024).
Notably, X-ray emission studies of LRDs have reported non-detections (Lyu et al., 2024; Matthee et al., 2024b; Ananna et al., 2024), and even stacking techniques still fail to produce an X-ray detection (Yue et al., 2024; Maiolino et al., 2024) of these high redshift sources. The failure to detect BLAGN and/or LRDs in X-ray observations could be explained by X-ray absorption by gas in the BL region with large covering factors (Maiolino et al., 2024) and/or super-Eddington accretion onto slowly spinning BHs, a combination that leads to intrinsically-weak SEDs in the X-rays (Juodžbalis et al., 2024; Pacucci & Narayan, 2024; Lambrides et al., 2024). Analysis of two X-ray confirmed AGN, at and in Wang et al. (2024) and Kocevski et al. (2024), find that their X-ray emission is consistent with a dust-reddened AGN and that they could be lower redshift analogs of the LRD population.
In this paper, we investigate the optical dust attenuation of high-redshift () BLAGN identified in the JWST deep fields. Our sample consists of 29 spectroscopically confirmed BLAGN detected through broad H emission and is gathered from three large public spectroscopy surveys: CEERS, JADES, and RUBIES. We derive narrow-line and broad-line Balmer decrements, using H and H, for this sample of BLAGN to explore different physical scenarios that can contribute to the “V-shaped” SEDs associated with LRDs. We stack sources that show no broad H emission (25/29) to further constrain the dust attenuation seen in the narrow and broad line emission.
This paper is presented as follows. In §2 we describe our AGN sample, in §3 we describe our line fitting technique and Balmer decrement measurements, and in §4 we describe our results and their implications for BLAGN. For this work, we assume a flat CDM cosmology with = 67.4 km s -1 Mpc-1 and (Planck Collaboration et al., 2020) .
2 Observational Dataset
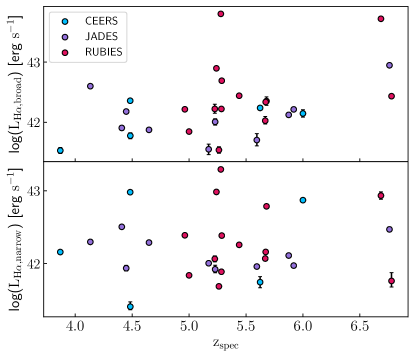
We select AGN in the JWST deep fields which exhibit broad H emission and have both H and H spectral coverage (Harikane et al., 2023a; Kocevski et al., 2023; Maiolino et al., 2023; Taylor et al., 2024). We analyzed data from the CEERS (Finkelstein et al. (2023), JADES (D’Eugenio et al., 2024), and RUBIES (de Graaff et al., 2024) surveys. Our sample consists of galaxies observed with NIRSpec medium resolution ( 1000) spectra. For this study, we do not use PRISM spectra; PRISM spectra have strongly varying wavelength-dependent spectral resolutions that can make it challenging to resolve emission (broad+narrow) on the bluer end of the spectrum, like H. The complete sample studied in this paper spans the redshift range of . This redshift range is chosen to ensure coverage of both H and H in the medium-grating observations. In total the sample contains 29 sources: 5 observed through CEERS, 10 through JADES, and 14 through RUBIES. A brief description of the observation programs used in this study follows and our sample selection is described in §2.4. Our complete sample of BLAGN is shown in Table 1 and the distribution of H luminosities is shown in Figure 1.
2.1 CEERS
The Cosmic Evolution Early Release Science Survey (CEERS) covered 100 of the Extended Groth Strip (EGS). Six NIRSpec pointings were observed with the G140M/F100LP, G235M/F170LP, and G395M/F290LP grating/filter pairs resulting in a complete wavelength coverage from m. Each NIRSpec pointing was observed for 0.86 hr in each grating. For this study, we use only the G235M/170LP and G395M/F290LP grating/filter pairs. These two configurations have coverage of both H and H over a redshift range of . The spectroscopic data were processed with the STScI JWST Calibration Pipeline version v1.8.5. We refer to Arrabal Haro et al. (2023) for a full description of the NIRSpec data reduction for CEERS.
2.2 JADES
The JWST Advanced Deep Extragalactic Survey (JADES) covered 175 in the GOODS-S and GOODS-N fields. We use NIRSpec data publicly released as part of JADES DR3 (D’Eugenio et al., 2024) and focus only on the G235M/170LP and G395M/F290LP grating/filter pairs. The JADES spectroscopic data was processed with a custom pipeline described in Ferruit et al. (2022). JADES observations were split into three visits, with individual objects being observed with one, two, or three visits at 2.3 hr exposure time per visit. Objects observed in each visit reached up to 7 hr of exposure time. We refer to Eisenstein et al. (2023), Bunker et al. (2023), and D’Eugenio et al. (2024) for a full description of the JADES survey and NIRSpec data reduction.
2.3 RUBIES
RUBIES observed 6 pointings in the CEERS (EGS) field and 6 pointings in the PRIMER-UDS Field (de Graaff et al., 2024). The spectroscopic data was processed with the STScI JWST Calibration Pipeline version 1.13.4. RUBIES observed with the G395M/F290LP grating/filter pair, giving us our highest redshift sources. Sources observed only with the G395M grating that cover both the H and H wavelength range will fall within redshifts . Each pointing in this survey had an exposure time of 0.80 hrs. We refer to Taylor et al. (2024) for a full description of the RUBIES NIRSpec data reduction used here.
2.4 BLAGN Sample
Our sample consists of AGN identified from broad H emission and is collected from Harikane et al. (2023b); Kocevski et al. (2023); Maiolino et al. (2023) and Taylor et al. (2024). We note that the full BLAGN sample in the respective papers might not be represented in this sample. We select sources with significantly detected () broad H emission and sufficient () spectral coverage around the H emission line. We now briefly describe the detection method used by each study but we refer to the respective papers for a full description.
2.4.1 CEERS BLAGN
The sources in CEERS are described in detail in Kocevski et al. (2023), Harikane et al. (2023a), and Taylor et al. (2024). The two BLAGN identified in Kocevski et al. (2023) are also identified in Harikane et al. (2023a). Harikane et al. (2023a) selects sources that have a broad () for either H or H and narrow () forbidden [Oiii] and [Nii] emission lines. Taylor et al. (2024) selects sources with broad H that have a , the broad component is detected with S/N , and the redshift of the object is determined by at least three strong emission lines.
2.4.2 JADES BLAGN
The sources in JADES are described in detail in Maiolino et al. (2023). Maiolino et al. (2023) selects sources that have a broad component in H or H without a broad component in the forbidden [Oiii]5007 line. Additionally, they require the broad component of the Balmer lines to be at least a factor of two broader than the narrow component and have a significance of at least . The difference in the Bayesian Information Criterion between a model with only a narrow line and one with both narrow and broad limes must be greater than 6, i.e.,
2.4.3 RUBIES BLAGN
The sources in RUBIES are described in detail in Taylor et al. (2024). Taylor et al. (2024) selects sources with broad H that have a , the broad component is detected with S/N , and the redshift of the object is determined by at least three strong emission lines.
| Name | R.A. | DEC | |
|---|---|---|---|
| [deg] | [deg] | ||
| CEERS-11728 | 215.084870 | 52.970738 | 3.869 |
| JADES-GN-73488 | 189.197396 | 62.177233 | 4.133 |
| JADES-GN-11836 | 189.220587 | 62.263675 | 4.409 |
| JADES-GN-53757 | 189.269778 | 62.194208 | 4.448 |
| CEERS-1665 | 215.178197 | 53.059349 | 4.483 |
| CEERS-1236 | 215.145291 | 52.967291 | 4.484 |
| JADES-GS-8083 | 53.132846 | -27.801860 | 4.648 |
| RUBIES-EGS-46985 | 214.805654 | 52.809497 | 4.963 |
| RUBIES-EGS-17416 | 214.949482 | 52.845415 | 5.000 |
| JADES-GN-62309 | 189.248977 | 62.218350 | 5.172 |
| RUBIES-EGS-17301 | 214.987485 | 52.873115 | 5.226 |
| JADES-GN-77652 | 189.293228 | 62.199003 | 5.229 |
| RUBIES-EGS-50052* | 214.823454 | 52.830277 | 5.240 |
| RUBIES-EGS-13872 | 215.132933 | 52.970705 | 5.262 |
| RUBIES-EGS-42046 | 214.795368 | 52.788847 | 5.279 |
| RUBIES-EGS-60935 | 214.923373 | 52.925593 | 5.287 |
| RUBIES-EGS-926125 | 215.137081 | 52.988554 | 5.284 |
| CEERS-746 | 214.809145 | 52.868483 | 5.624 |
| JADES-GN-1093 | 189.179742 | 62.224628 | 5.595 |
| RUBIES-UDS-29813 | 34.453355 | -5.270717 | 5.440 |
| RUBIES-UDS-19521 | 34.383672 | -5.287732 | 5.669 |
| RUBIES-UDS-47509 | 34.264602 | -5.232586 | 5.673 |
| RUBIES-EGS-27915 | 214.844229 | 52.789595 | 5.680 |
| JADES-GN-61888 | 189.168016 | 62.217013 | 5.875 |
| JADES-GS-10013704 | 53.126535 | -27.818092 | 5.919 |
| CEERS-397 | 214.836183 | 52.882678 | 6.000 |
| RUBIES-EGS-49140 | 214.892248 | 52.877410 | 6.685 |
| JADES-GN-954 | 189.151966 | 62.259635 | 6.760 |
| RUBIES-UDS-807469 | 34.376139 | -5.310366 | 6.778 |
3 Emission Line Fitting
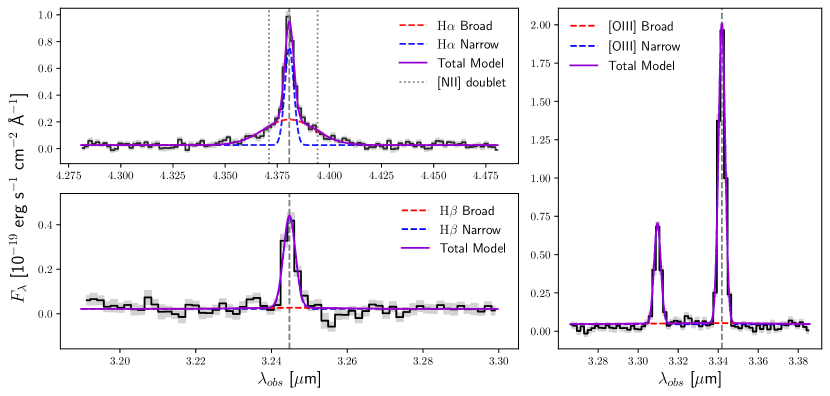
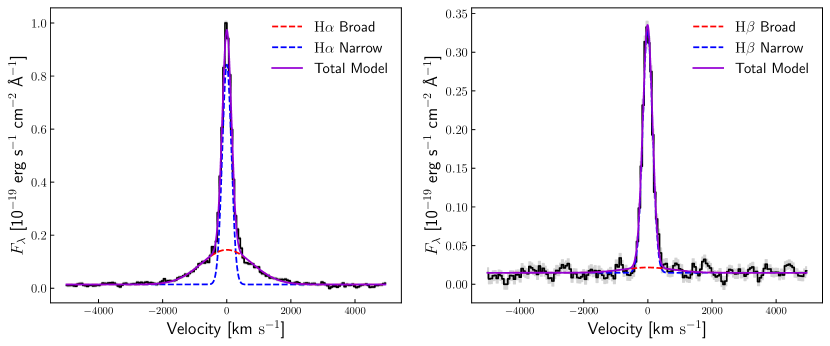
We fit the H and H Balmer lines in each spectrum with a dual-component, narrow+broad, Gaussian model using the Markov Chain Monte Carlo (MCMC) routine from the Python emcee package Foreman-Mackey et al. (2013). The dual component Gaussian model, adapting the methodology used in Larson et al. (2023) is:
| (1) |
where is the continuum flux, which is assumed to be constant, and are the narrow and broad line amplitudes, and and are the individual line widths. Both Gaussians share a common line center .
In the H line model, we include additional Gaussian components for the [Nii]6550, 6585 doublet around the H line. The intrinsic ratio of the line fluxes of the [Nii] lines are fixed to 1:2.94 (Osterbrock & Ferland, 2006), while their linewidths and line centers are constrained to the narrow H line.
To fit the H emission lines, we run emcee using 16 walkers and 25,000 steps and implement a “burn-in” of 10,000 steps, which are discarded from our final chains. We visually inspect the walker chains to confirm that these parameters are sufficient for robust and converged MCMC fits. In our fits, we use flat priors for each model parameter. Additionally, we implement the following constraints on the fitted parameters:
-
1.
and
-
2.
-
3.
and is allowed to vary within of the reported literature redshift values. We confirmed that our best-fit broad and narrow line widths are statistically consistent with the values reported by Harikane et al. (2023a); Maiolino et al. (2023); Kocevski et al. (2023) and Taylor et al. (2024).
The above methodology is used to fit H and we discuss our H fitting procedure as follows. For the first run of our H fits, we allow the line width to explore the parameter space indicated above. If the broad component of H is not detected (), we constrain to within the measured bounds of the H , and rerun the fit. Even after this iterative fitting process, broad H is significantly detected () in only 4/29 sources. The majority of our sample (25/29) exhibits weak broad H emission despite being selected for significantly broad H emission.
Additionally, if H is not detected, we constrain to within of H . Narrow H is detected in 24/29 sources. We report upper limits of broad H emission and, when necessary, upper limits of narrow H emission. Line fluxes for our sample are reported in Table 2.
3.1 Outflows
Large-scale outflows from the interstellar medium (ISM) can be observed as broad emission in the forbidden [Oiii] lines. To confirm that our sample exhibits broad H emission from an AGN and not from an outflow scenario, the [Oiii] doublet is checked for a broad component following the same fitting procedure described in §3. The ratio of the [OIII] lines is fixed to 2.985:1 (Storey & Zeippen, 2000).
The vast majority of sources (25/29) with spectral coverage of the [Oiii] region do not have a significant broad [Oiii] component. Broad [Oiii] emission is observed in RUBIES-EGS-50052, also noted in Taylor et al. (2024). We find a broad H component with a and an [Oiii] broad component with a . The [Oiii] broad component exhibits a significantly different velocity profile than the H line, indicative that the origin is a galactic outflow and the system still hosts an AGN. We also detect weak () [Oiii] broad emission in RUBIES-EGS-17416 with a . Visual inspection of this spectrum indicates that it appears consistent with noise associated with continuum emission.
Spectra for the [Oiii] doublet region is not available for JADES-GS 8083 and JADES-GN 53757; Maiolino et al. (2023) rules out the outflow scenario for these two sources due to the symmetric nature of the broad H emission line.
3.2 Stacked Spectra
We produce median-stacked spectra, on both the H and H lines, with the sources that show no detection of the broad H component. In total, this is 22/29 of the sources in our sample. We have confirmed with mock spectra, implementing the same narrow+broad Gaussian model as our fitting routine, that the mean broad-line flux is recovered in the stacked spectrum. Median-stacked spectra let us further explore the differences in the narrow and broad H/H ratio for BLAGN by increasing our signal-to-noise ratio. To stack our broad H non-detections, we interpolate our spectra to a common velocity grid of 60 km s-1 per pixel and spanning around the H and H lines, that matches the lowest resolution spectrum in our sample (CEERS-11728, ). Each spectrum is normalized by the peak of the H line flux. We then combine the spectra by taking the median of the fluxes at each velocity pixel position in the velocity grid. Our median-stacked spectra result is shown in Figure 3.
To estimate the errors for our stack, we follow the same stacking procedure as for the flux but median-stack the error spectrum for each source, and divide each error pixel by , where N is the number of sources in the stack. We then compare the normalized absolute median deviation (NMAD) of the continuum region around H and H to the median of the flux error over the spectral range around the emission lines. We found in both the H and H region that the errors are slightly overestimated, with NMAD()/median() and NMAD()/median() respectively. We elected to use the larger median-stacked errors as a conservative approach.
4 Results
The key result of this work is that even after median-stacking the majority of our sources (25/29), broad H emission still remains undetected ().
The narrow and broad H and H emission line fluxes and corresponding for the individual sources in our sample are reported in Table 2 and upper limits on H are reported when necessary. The vast majority of our sources (25/29) do not have detected broad H line emission despite having significantly (5) detected broad H emission. Additionally, 5 of the 29 sources have no (3) detected H emission at all (broad or narrow).
To estimate dust attenuation from the measured Balmer decrement, we follow the prescription provided by Momcheva et al. (2013). We assume a Calzetti (1997) attenuation curve and an intrinsic Balmer line ratio of , the latter of which is appropriate for AGN BLR and NLR gas conditions (Osterbrock & Ferland, 2006). When broad H or narrow+broad H is undetected, we determine the and lower limit on the H/H ratio. The full list of narrow and broad Balmer decrements (including both detections and limits) is found in Table 3. Emission lines associated with star-forming regions instead have an intrinsic line ratio of (for cm-3, K, case B recombination), which would lead to slightly larger dust attenuation estimates than our assumption of for AGN-ionized gas. This choice in intrinsic ratio does not affect the general conclusions of this study.
Figure 4 shows the measured Balmer decrements and inferred V-band dust attenuation for the 29 AGN in our sample. The majority (26/29) of our sources have narrow-line H/H ratios that are consistent with the intrinsic value and little-to-no attenuation. The lower limits in broad H are consistent with a wide range of broad-line attenuation; these sources are shown as open symbols in Figure 4.
Three sources, JADES-GN-73488, RUBIES-EGS-42046, and RUBIES-EGS-60935, show significant narrow line and broad line attenuation. Our most extremely attenuated source has a broad-line . This suggests an intrinsically high emission-line strength and we interpret the dustiest sources as unusual systems that are not representative of the bulk of the BLAGN sample (Davis et al., 2023). Specific narrow-line and broad-line Balmer ratios are given in Table 3.
JADES-GN-954 exhibits both broad H and H emission and has greater dust attenuation in the BL region. Additionally, RUBIES-EGS-60935 has detected, but not strong () broad H emission and shows similar attenuation in the narrow and broad region. 9 individual sources show broad H/H narrow H/H; Killi et al. (2023) also finds much higher attenuation in the BLR for a single source (). Sources in our sample with H/H narrow H/H falling left of the one-to-one line in Figure 4, generally have lower signal-to-noise ratios than sources right of the line. We expect deeper observations of these objects to show the result shown by the stack, broad H/H narrow H/H.
In addition to the individual sources, we measure the narrow and broad Balmer decrement for our stacked spectra. We find narrow H/H = and broad H/H . The narrow-line measurement is consistent with no attenuation and the broad-line ratio implies for a Calzetti (1997) attenuation curve. The median-stacked spectra is shown as a pink star in Figure 4. For an SMC attenuation curve (Prevot et al., 1984; Bouchet et al., 1985), we find a broad-line .
| Name | ||||||
|---|---|---|---|---|---|---|
| CEERS-11728 | ||||||
| JADES-GN-73488 | ||||||
| JADES-GN-11836 | ||||||
| JADES-GN-53757 | ||||||
| CEERS-1665 | ||||||
| CEERS-1236 | ||||||
| JADES-GS-8083 | ||||||
| RUBIES-EGS-46985 | ||||||
| RUBIES-EGS-17416 | ||||||
| JADES-GN-62309 | ||||||
| RUBIES-EGS-17301 | ||||||
| JADES-GN-77652 | ||||||
| RUBIES-EGS-50052 | ||||||
| RUBIES-EGS-13872 | ||||||
| RUBIES-EGS-42046 | ||||||
| RUBIES-EGS-60935 | ||||||
| RUBIES-EGS-926125 | ||||||
| CEERS-746 | ||||||
| JADES-GN-1093 | ||||||
| RUBIES-UDS-29813 | ||||||
| RUBIES-UDS-19521 | ||||||
| RUBIES-UDS-47509 | ||||||
| RUBIES-EGS-27915 | ||||||
| JADES-GN 61888 | ||||||
| JADES-GS 10013704 | ||||||
| CEERS 00397 | ||||||
| RUBIES-EGS-49140 | ||||||
| JADES-GN 954 | ||||||
| RUBIES-UDS-807469 | ||||||
Note. — We do not report broad H FWHMs for the sources with non-detections, these are denoted with a “”.
5 Discussion and Conclusions
In this work, we present dust attenuation measurements for 29 broad-line identified AGN in the JWST deep fields. We also further investigate the optical dust attenuation of these sources using a stacking analysis of sources that have no significantly detected broad H emission. The non-detection of H and significantly detected H (15) after stacking indicates that these sources are, on average, heavily dust-attenuated in the rest-frame optical. Narrow H/H = (consistent with zero dust attenuation111The stacked narrow H/H is significantly lower than the fiducial value of . This likely implies higher electron temperature for the gas (for example, K results in for case B recombination), consistent with previous work studying the ISM conditions of high-redshift galaxies (e.g., Trump et al., 2023; Backhaus et al., 2024; Sanders et al., 2024)) and broad H/H () for the stack suggests that the origin of the narrow and broad components of the emission lines originate from different regions in the galaxy. The broad emission lines are emitted from near the AGN and their high attenuation implies that the red optical colors of LRDs are driven by dust-attenuated emission from the central AGN. Meanwhile, the narrow lines are presumably emitted from extended scales, and the low attenuation of the narrow lines implies that the blue/UV colors of LRDs are dominated by star formation processes in the host galaxy.
The narrow Balmer lines in the majority of our sources (26/29) are consistent with little to no dust attenuation. Our distribution of narrow-line Balmer decrements is consistent with Shapley et al. (2023) measurements for a population of non-BL AGN. Sandles et al. (2023) also finds consistently low Balmer decrements, where the median is for a sample of 51 galaxies. The narrow line Balmer decrement of the stacked spectra also shows no dust attenuation. The central AGN in these sources are consistently much more reddened than what is seen on the galactic scale, further suggesting that the blue UV colors seen in the SEDs is from star-formation in the galaxy.
The source of attenuation around the central AGN could be explained by a dusty torus of obscuring gas near the AGN (Krolik & Begelman, 1988). However, mid-infrared observations of LRDs are inconsistent with the dusty torus model (Williams et al., 2024; Pérez-González et al., 2024). Rather than a canonical torus, the AGN may be attenuated by larger-scale dust in the galaxy nucleus that is somewhat cooler than a torus but is still much more compact than the host galaxy starlight (Buchner & Bauer, 2017). The observed dust attenuation may also be described by a polar dust model (Yang et al., 2020; Buat et al., 2021) that is more compact than the narrow-line region but colder than the torus.
Higher attenuation around the AGN is also consistent with the lack of X-ray detections for these sources (Maiolino et al., 2024). Two of our sources, RUBIES-EGS-42046 and RUBIES-EGS-49140, show strong Balmer absorption lines, which requires extremely high densities of neutral hydrogen gas (Hall, 2007; Inayoshi & Maiolino, 2024). High-density absorbing material around the AGN may dampen X-ray emission and explain the non-detections of the LRDs in deep X-ray fields, even after a stacking analysis. Additionally, our results show a dramatic bimodality of the broad and narrow-line attenuation for high-redshift AGN, which suggests that these regions in the galaxy are physically distinct. The dramatically different attenuation of the broad and narrow lines disfavors non-AGN models (Kokubo & Harikane, 2024; Baggen et al., 2024) due to gas that is more likely to have continuous velocity and attenuation distributions.
The large population of broad-line AGN and LRDs at high-redshifts is one of the biggest surprised revealed by JWST. This work shows, on average, high-redshift broad-line AGN have highly attenuated nuclei but little-to-no attenuation affecting the extended host galaxy. However, currently available JWST spectroscopy is insufficient to resolve the nature of the dust in individual sources and to study the distribution of dust attenuation as attenuation as a function of galaxy and AGN properties. This population represents a look into obscured black hole formation growth in early epochs and is important to fully understanding black hole-galaxy coevolution. Deeper and/or NIRSpec IFU spectroscopy is needed to further disentangle the obscured nature of AGN and host galaxy emission and growth at cosmic dawn.
We thank the JADES and RUBIES team for their effort designing and executing their programs and for making the data publicly available. We acknowledge the work of our colleagues in the CEERS collaboration and everyone involved in the JWST mission. MB, JRT, and KD acknowledge support from NASA grants JWST-ERS-01345, JWST-AR-01721, and NSF grant CAREER-1945546.
| Name | Narrow H/H | Narrow | Broad H/H | Broad |
|---|---|---|---|---|
| CEERS-11728 | 0 | 0 | ||
| JADES-GN-73488 | ||||
| JADES-GN-11836 | 0 | |||
| JADES-GN-53757 | 0 | 0 | ||
| CEERS-1665 | 0 | |||
| CEERS-1236 | 0 | 0 | ||
| JADES-GS-8083 | ||||
| RUBIES-EGS-46985 | 0 | |||
| RUBIES-EGS-17416 | 0 | 0 | ||
| JADES-GN-62309 | 0 | |||
| RUBIES-EGS-17301 | 0 | 0 | ||
| JADES-GN-77652 | 0 | 0 | ||
| RUBIES-EGS-50052 | ||||
| RUBIES-EGS-13872 | 0 | 0 | ||
| RUBIES-EGS-42046 | ||||
| RUBIES-EGS-60935 | ||||
| RUBIES-EGS-926125 | 0 | |||
| CEERS-746 | 0 | |||
| JADES-GN 1093 | 0 | 0 | ||
| RUBIES-UDS-29813 | 0 | |||
| RUBIES-UDS-19521 | 0 | 0 | ||
| RUBIES-UDS-47509 | 0 | |||
| RUBIES-EGS-27915 | 0 | 0 | ||
| JADES-GN-61888 | ||||
| JADES-GS-10013704 | 0 | 0 | ||
| CEERS-397 | 0 | 0 | ||
| RUBIES-EGS-49140 | 0 | |||
| JADES-GN-954 | ||||
| RUBIES-UDS-807469 | 0 |
Note. — Here we are reporting the lower limit on the Balmer decrement measurements when necessary. The limit is additionally given in the parentheses.
References
- Akins et al. (2024) Akins, H. B., Casey, C. M., Lambrides, E., et al. 2024, arXiv e-prints, arXiv:2406.10341, doi: 10.48550/arXiv.2406.10341
- Ananna et al. (2024) Ananna, T. T., Bogdán, Á., Kovács, O. E., Natarajan, P., & Hickox, R. C. 2024, ApJ, 969, L18, doi: 10.3847/2041-8213/ad5669
- Arrabal Haro et al. (2023) Arrabal Haro, P., Dickinson, M., Finkelstein, S. L., et al. 2023, ApJ, 951, L22, doi: 10.3847/2041-8213/acdd54
- Astropy Collaboration et al. (2013) Astropy Collaboration, Robitaille, T. P., Tollerud, E. J., et al. 2013, A&A, 558, A33, doi: 10.1051/0004-6361/201322068
- Astropy Collaboration et al. (2018) Astropy Collaboration, Price-Whelan, A. M., Sipőcz, B. M., et al. 2018, AJ, 156, 123, doi: 10.3847/1538-3881/aabc4f
- Astropy Collaboration et al. (2022) Astropy Collaboration, Price-Whelan, A. M., Lim, P. L., et al. 2022, ApJ, 935, 167, doi: 10.3847/1538-4357/ac7c74
- Backhaus et al. (2024) Backhaus, B. E., Trump, J. R., Pirzkal, N., et al. 2024, ApJ, 962, 195, doi: 10.3847/1538-4357/ad1520
- Baggen et al. (2024) Baggen, J. F. W., van Dokkum, P., Brammer, G., et al. 2024, arXiv e-prints, arXiv:2408.07745, doi: 10.48550/arXiv.2408.07745
- Barro et al. (2024) Barro, G., Pérez-González, P. G., Kocevski, D. D., et al. 2024, ApJ, 963, 128, doi: 10.3847/1538-4357/ad167e
- Bouchet et al. (1985) Bouchet, P., Lequeux, J., Maurice, E., Prevot, L., & Prevot-Burnichon, M. L. 1985, A&A, 149, 330
- Bromm & Loeb (2003) Bromm, V., & Loeb, A. 2003, ApJ, 596, 34, doi: 10.1086/377529
- Buat et al. (2021) Buat, V., Mountrichas, G., Yang, G., et al. 2021, A&A, 654, A93, doi: 10.1051/0004-6361/202141797
- Buchner & Bauer (2017) Buchner, J., & Bauer, F. E. 2017, MNRAS, 465, 4348, doi: 10.1093/mnras/stw2955
- Bunker et al. (2023) Bunker, A. J., Cameron, A. J., Curtis-Lake, E., et al. 2023, arXiv e-prints, arXiv:2306.02467, doi: 10.48550/arXiv.2306.02467
- Calzetti (1997) Calzetti, D. 1997, AJ, 113, 162, doi: 10.1086/118242
- Davis et al. (2023) Davis, K., Trump, J. R., Simons, R. C., et al. 2023, arXiv e-prints, arXiv:2312.07799, doi: 10.48550/arXiv.2312.07799
- de Graaff et al. (2024) de Graaff, A., Brammer, G., Weibel, A., et al. 2024, arXiv e-prints, arXiv:2409.05948, doi: 10.48550/arXiv.2409.05948
- D’Eugenio et al. (2024) D’Eugenio, F., Cameron, A. J., Scholtz, J., et al. 2024, arXiv e-prints, arXiv:2404.06531, doi: 10.48550/arXiv.2404.06531
- Durodola et al. (2024) Durodola, E., Pacucci, F., & Hickox, R. C. 2024, arXiv e-prints, arXiv:2406.10329, doi: 10.48550/arXiv.2406.10329
- Eisenstein et al. (2023) Eisenstein, D. J., Willott, C., Alberts, S., et al. 2023, arXiv e-prints, arXiv:2306.02465, doi: 10.48550/arXiv.2306.02465
- Ferruit et al. (2022) Ferruit, P., Jakobsen, P., Giardino, G., et al. 2022, A&A, 661, A81, doi: 10.1051/0004-6361/202142673
- Finkelstein et al. (2023) Finkelstein, S. L., Bagley, M. B., Ferguson, H. C., et al. 2023, ApJ, 946, L13, doi: 10.3847/2041-8213/acade4
- Foreman-Mackey et al. (2013) Foreman-Mackey, D., Hogg, D. W., Lang, D., & Goodman, J. 2013, PASP, 125, 306, doi: 10.1086/670067
- Greene et al. (2024a) Greene, J. E., Labbe, I., Goulding, A. D., et al. 2024a, ApJ, 964, 39, doi: 10.3847/1538-4357/ad1e5f
- Greene et al. (2024b) —. 2024b, ApJ, 964, 39, doi: 10.3847/1538-4357/ad1e5f
- Hall (2007) Hall, P. B. 2007, AJ, 133, 1271, doi: 10.1086/511272
- Harikane et al. (2023a) Harikane, Y., Zhang, Y., Nakajima, K., et al. 2023a, ApJ, 959, 39, doi: 10.3847/1538-4357/ad029e
- Harikane et al. (2023b) Harikane, Y., Ouchi, M., Oguri, M., et al. 2023b, ApJS, 265, 5, doi: 10.3847/1538-4365/acaaa9
- Harris et al. (2020) Harris, C. R., Millman, K. J., van der Walt, S. J., et al. 2020, Nature, 585, 357, doi: 10.1038/s41586-020-2649-2
- Inayoshi & Maiolino (2024) Inayoshi, K., & Maiolino, R. 2024, arXiv e-prints, arXiv:2409.07805, doi: 10.48550/arXiv.2409.07805
- Inayoshi et al. (2020) Inayoshi, K., Visbal, E., & Haiman, Z. 2020, ARA&A, 58, 27, doi: 10.1146/annurev-astro-120419-014455
- Juodžbalis et al. (2024) Juodžbalis, I., Ji, X., Maiolino, R., et al. 2024, arXiv e-prints, arXiv:2407.08643, doi: 10.48550/arXiv.2407.08643
- Kelly & Shen (2013) Kelly, B. C., & Shen, Y. 2013, ApJ, 764, 45, doi: 10.1088/0004-637X/764/1/45
- Killi et al. (2023) Killi, M., Watson, D., Brammer, G., et al. 2023, arXiv e-prints, arXiv:2312.03065, doi: 10.48550/arXiv.2312.03065
- Kocevski et al. (2023) Kocevski, D. D., Onoue, M., Inayoshi, K., et al. 2023, ApJ, 954, L4, doi: 10.3847/2041-8213/ace5a0
- Kocevski et al. (2024) Kocevski, D. D., Finkelstein, S. L., Barro, G., et al. 2024, arXiv e-prints, arXiv:2404.03576, doi: 10.48550/arXiv.2404.03576
- Kokorev et al. (2023) Kokorev, V., Fujimoto, S., Labbe, I., et al. 2023, ApJ, 957, L7, doi: 10.3847/2041-8213/ad037a
- Kokubo & Harikane (2024) Kokubo, M., & Harikane, Y. 2024, arXiv e-prints, arXiv:2407.04777, doi: 10.48550/arXiv.2407.04777
- Krolik & Begelman (1988) Krolik, J. H., & Begelman, M. C. 1988, ApJ, 329, 702, doi: 10.1086/166414
- Labbe et al. (2023) Labbe, I., Greene, J. E., Bezanson, R., et al. 2023, arXiv e-prints, arXiv:2306.07320, doi: 10.48550/arXiv.2306.07320
- Lambrides et al. (2024) Lambrides, E., Garofali, K., Larson, R., et al. 2024, arXiv e-prints, arXiv:2409.13047, doi: 10.48550/arXiv.2409.13047
- Larson et al. (2023) Larson, R. L., Finkelstein, S. L., Kocevski, D. D., et al. 2023, ApJ, 953, L29, doi: 10.3847/2041-8213/ace619
- Li et al. (2024) Li, Z., Inayoshi, K., Chen, K., Ichikawa, K., & Ho, L. C. 2024, arXiv e-prints, arXiv:2407.10760, doi: 10.48550/arXiv.2407.10760
- Lodato & Natarajan (2006) Lodato, G., & Natarajan, P. 2006, MNRAS, 371, 1813, doi: 10.1111/j.1365-2966.2006.10801.x
- Lyu et al. (2024) Lyu, J., Alberts, S., Rieke, G. H., et al. 2024, ApJ, 966, 229, doi: 10.3847/1538-4357/ad3643
- Maiolino et al. (2023) Maiolino, R., Scholtz, J., Curtis-Lake, E., et al. 2023, arXiv e-prints, arXiv:2308.01230, doi: 10.48550/arXiv.2308.01230
- Maiolino et al. (2024) Maiolino, R., Risaliti, G., Signorini, M., et al. 2024, arXiv e-prints, arXiv:2405.00504, doi: 10.48550/arXiv.2405.00504
- Matsuoka et al. (2018) Matsuoka, Y., Strauss, M. A., Kashikawa, N., et al. 2018, ApJ, 869, 150, doi: 10.3847/1538-4357/aaee7a
- Matthee et al. (2024a) Matthee, J., Naidu, R. P., Brammer, G., et al. 2024a, ApJ, 963, 129, doi: 10.3847/1538-4357/ad2345
- Matthee et al. (2024b) —. 2024b, ApJ, 963, 129, doi: 10.3847/1538-4357/ad2345
- Momcheva et al. (2013) Momcheva, I. G., Lee, J. C., Ly, C., et al. 2013, AJ, 145, 47, doi: 10.1088/0004-6256/145/2/47
- Osterbrock & Ferland (2006) Osterbrock, D. E., & Ferland, G. J. 2006, Astrophysics of gaseous nebulae and active galactic nuclei
- Pacucci & Narayan (2024) Pacucci, F., & Narayan, R. 2024, arXiv e-prints, arXiv:2407.15915, doi: 10.48550/arXiv.2407.15915
- Pacucci et al. (2023) Pacucci, F., Nguyen, B., Carniani, S., Maiolino, R., & Fan, X. 2023, ApJ, 957, L3, doi: 10.3847/2041-8213/ad0158
- Pérez-González et al. (2024) Pérez-González, P. G., Barro, G., Rieke, G. H., et al. 2024, ApJ, 968, 4, doi: 10.3847/1538-4357/ad38bb
- Planck Collaboration et al. (2020) Planck Collaboration, Aghanim, N., Akrami, Y., et al. 2020, A&A, 641, A6, doi: 10.1051/0004-6361/201833910
- Prevot et al. (1984) Prevot, M. L., Lequeux, J., Maurice, E., Prevot, L., & Rocca-Volmerange, B. 1984, A&A, 132, 389
- Sanders et al. (2024) Sanders, R. L., Shapley, A. E., Topping, M. W., Reddy, N. A., & Brammer, G. B. 2024, ApJ, 962, 24, doi: 10.3847/1538-4357/ad15fc
- Sandles et al. (2023) Sandles, L., D’Eugenio, F., Maiolino, R., et al. 2023, arXiv e-prints, arXiv:2306.03931, doi: 10.48550/arXiv.2306.03931
- Shapley et al. (2023) Shapley, A. E., Sanders, R. L., Reddy, N. A., Topping, M. W., & Brammer, G. B. 2023, ApJ, 954, 157, doi: 10.3847/1538-4357/acea5a
- Storey & Zeippen (2000) Storey, P. J., & Zeippen, C. J. 2000, MNRAS, 312, 813, doi: 10.1046/j.1365-8711.2000.03184.x
- Taylor et al. (2024) Taylor, A. J., Finkelstein, S. L., Kocevski, D. D., et al. 2024, arXiv e-prints, arXiv:2409.06772, doi: 10.48550/arXiv.2409.06772
- Trump et al. (2023) Trump, J. R., Arrabal Haro, P., Simons, R. C., et al. 2023, ApJ, 945, 35, doi: 10.3847/1538-4357/acba8a
- Übler et al. (2023) Übler, H., Maiolino, R., Curtis-Lake, E., et al. 2023, A&A, 677, A145, doi: 10.1051/0004-6361/202346137
- Vestergaard & Osmer (2009) Vestergaard, M., & Osmer, P. S. 2009, ApJ, 699, 800, doi: 10.1088/0004-637X/699/1/800
- Virtanen et al. (2020) Virtanen, P., Gommers, R., Oliphant, T. E., et al. 2020, Nature Methods, 17, 261, doi: 10.1038/s41592-019-0686-2
- Volonteri et al. (2003) Volonteri, M., Haardt, F., & Madau, P. 2003, ApJ, 582, 559, doi: 10.1086/344675
- Wang et al. (2024) Wang, B., de Graaff, A., Davies, R. L., et al. 2024, arXiv e-prints, arXiv:2403.02304, doi: 10.48550/arXiv.2403.02304
- Williams et al. (2024) Williams, C. C., Alberts, S., Ji, Z., et al. 2024, ApJ, 968, 34, doi: 10.3847/1538-4357/ad3f17
- Yang et al. (2020) Yang, G., Boquien, M., Buat, V., et al. 2020, MNRAS, 491, 740, doi: 10.1093/mnras/stz3001
- Yue et al. (2024) Yue, M., Eilers, A.-C., Ananna, T. T., et al. 2024, arXiv e-prints, arXiv:2404.13290, doi: 10.48550/arXiv.2404.13290