The performance of the blue prime focus Large Binocular Camera at the Large Binocular Telescope
Abstract
Aims. We present the characteristics and some early scientific results of the first instrument at the Large Binocular Telescope (LBT), the Large Binocular Camera (LBC). Each LBT telescope unit will be equipped with similar prime focus cameras. The blue channel is optimized for imaging in the UV-B bands and the red channel for imaging in the VRIz bands. The corrected field-of-view of each camera is approximately 30 arcminutes in diameter, and the chip area is equivalent to a arcmin2 field. In this paper we also present the commissioning results of the blue channel.
Methods. The scientific and technical performance of the blue channel was assessed by measurement of the astrometric distortion, flat fielding, ghosts, and photometric calibrations. These measurements were then used as input to a data reduction pipeline applied to science commissioning data.
Results. The measurements completed during commissioning show that the technical performance of the blue channel is in agreement with original expectations. Since the red camera is very similar to the blue one we expect similar performance from the commissioning that will be performed in the following months in binocular configuration. Using deep UV image, acquired during the commissioning of the blue camera, we derived faint UV galaxy-counts in a sq. arcmin. sky area to U(Vega). These galaxy counts imply that the blue camera is the most powerful UV imager presently available and in the near future in terms of depth and extent of the field-of-view. We emphasize the potential of the blue camera to increase the robustness of the UGR multicolour selection of Lyman break galaxies at redshift .
Key Words.:
Instrumentation: detectors – Methods: data analysis – Techniques: image processing – Surveys – Galaxies: photometry1 Introduction
The sensitivity of an optical system depends on a combination of the aperture and field-of-view (FoV).
The imaging capabilities of existing or planned facilities are often limited by practical constraints. When the large collecting area of a telescope allows detection of faint sources, the field-of-view is typically less than square arcminutes, and the UV sensitivity is low. Alternatively, wide-field imaging cameras onboard smaller telescopes are optimized to target brighter sources over a larger field-of-view (i.e. MegaCam at CFHT, Boulade et al. (2003)), and are unable to detect sources of faint magnitudes () in particular in the UV.
For these reasons an imager with a large FoV at an 8m class telescope is of fundamental importance to address the presently still open problems in stellar and extragalactic astronomy. The best example is the prime focus camera at the 8m Subaru telescope, Suprimecam (Miyazaki et al. (2002)). This imager is fast and has a FoV of arcmin2. Common science projects that have utilized this imager to date are the search of very high redshift galaxies, the study of the formation and evolution of galaxies, the investigation of the structure of the Universe, and the search for Kuiper Belt objects in the Solar system. The optical corrector cannot, however, simultaneously correct radiation of all wavelengths from UV to I-band. Due to this practical limitation, and to its low sensitivity in the blue band, Suprimecam does not provide imaging in the UV.
At the end of the 1990s, it became clear that the binocular configuration of the Large Binocular Telescope (LBT) (Hill et al. (2000)), coupled with its mechanical design, provided a unique opportunity to justify a double prime focus camera capable of studying the widest-possible wavelength range from the UV down to the NIR H-band.
The Large Binocular Camera (LBC, Ragazzoni et al. (2000); Pedichini et al. (2003); Pedichini & Speziali (2004); Ragazzoni et al. (2006)) is a wide FoV instrument at the prime focus of the twin 8.4 meter Large Binocular Telescope (LBT). The LBT uses two 8.4-meter diameter honeycomb primary mirrors mounted side-by-side to produce a collecting area of 110 square meters equivalent to an 11.8-meter circular aperture. A unique feature of the LBT is that the light from the two primary mirrors can be combined optically in the center of the telescope to produce phased array imaging of an extended field. This requires minimal path length compensations, thus making interferometry easier than in completely independent telescopes.
The requirement for an instrument such as LBC has been identified by several high-profile scientific programs that call for an increase in FoV and high-UV/IR sensitivity for deep imaging.
These attributes are essential to programs studying a large FoV, to significant depth, over a wide spectral range, and can only be provided by an imager mounted at the prime focus of an 8m-class telescope.
In Section 2 we provide a description of the two LBC cameras, while in Section 3 we detail the technical performance of LBC-Blue during commissioning observations in 2006. In Section 4 we analyze in detail the case for an UV deep imaging survey in an extragalactic field, and compare results with those obtained using different instruments and telescopes. We present our conclusions in Section 5.
2 The LBC camera
The Large Binocular Camera (LBC) is a wide-field double imager at the prime foci of the LBT.
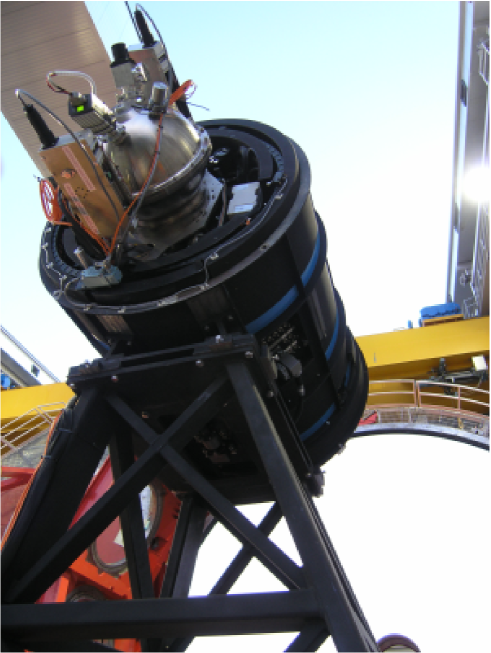
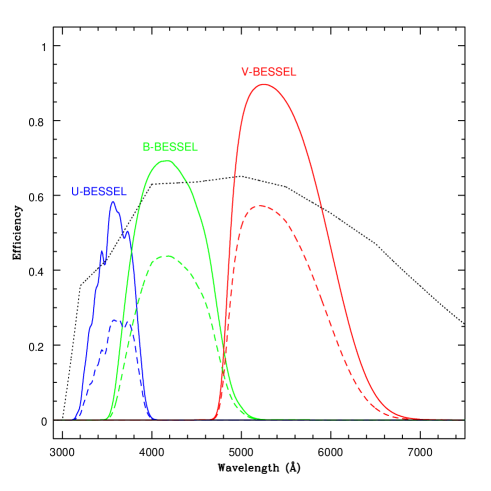
The two channels are optimized for different wavelength ranges: the blue channel (LBC-Blue) for the U, B, and V bands, and the red channel (LBC-Red) for the V, R, I, and Z bands. Fig.1 shows the LBC-Blue instrument installed at the LBT, while Fig.2 describes the efficiency of the filter set available for LBC-Blue. The fast focal ratio (F/1.45) allows efficient deep imaging over a FoV of approximately 30 arcmin in diameter. Because the mirrors of both channels are mounted on the same pointing system, a given target can be observed simultaneously over a wide wavelength range, improving the operation efficiency. The fast prime focus configuration requires an optical corrector to compensate the aberrations introduced by the primary mirror. The unique binocular configuration of LBT allowed the optimization of both correctors for different wavelength ranges. This simplifies the instrument design by relaxing the requirements on the achromaticity for each channel.
2.1 LBC-Blue
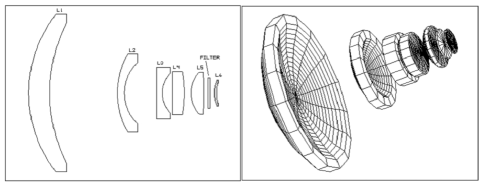
The focal ratio of the primary mirror (F/1.14), the large telescope diameter (8.4m), and parabolic shape of the mirror present particular difficulties for the design of a prime focus corrector for the LBT. The design of a prime focus corrector for the blue channel can be described as a development of the design of Wynne (1996), which consists of three lenses to correct spherical aberration, coma, and field curvature. In our design the second and third lenses are split into two elements, and with respect to Wynne’s design an additional lens is present that has a positive meniscus of almost no net power, which is the CCD cryostat window. Due to the size of the primary mirror the largest lens of the corrector has a considerable diameter (810 mm) and weight (104 Kg). All the lenses are in fused silica, which ensures high throughput in the targeted wavelength range. The optical surfaces are spherical or plane, except lens #3, featuring an aspherical surface on the concave side; this surface is actually ellipsoidal and presents a departure from the best fit sphere of 0.7mm at the edge (Fig.3). Geometric distortion is not considered as an aberration, since it may be corrected by post-processing. Two filter wheels are placed between the last two lenses. The focal length of the optical corrector is 12180mm and the final focal ratio is F/1.45. The total throughput is 84%. The throughput considers the internal transmission of the SILICA lenses and the coating efficiency; it is an average figure for the U and B bands and does not consider the filter transmission.
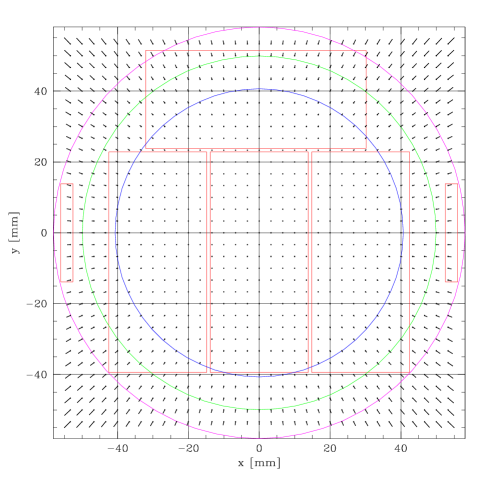
The energy concentration of the instrumental PSF is very good: 80% of the energy is enclosed in a single CCD pixel (13.5m in size or 0.2254 arcsec) both in the U and B bands which ensures good optical performance even in the best seeing conditions (FWHM arcsec). Although the blue channel has been optimized for the U and B bands, the performance is good also in the V and R bands, with 80% of the energy within 2x2 pixels. The geometric distortion, of pin-cushion type, is always below 1.75% even at the edge of the field (see Fig.4). The unvignetted FoV is 27 arcmin in diameter, as shown in Fig.5.
The mechanical design of the prime focus consists of two main parts, the hub that mounts the fixed lenses and the derotator that holds the filters wheels and the cryostat. Each one of the five fixed lenses is kinematically mounted into an INVAR frame, which is then connected to the steel hub through flexure elements to accommodate the differential thermal expansion of the two materials. For the same reason, the two main lenses, which are 810 mm and 400 mm in diameter, are mounted into their INVAR frames by means of special RTV pads, that are tailored to compensate for the differential thermal expansion of the glass and the INVAR.
The derotator decouples the imager from the corrector lenses and hosts two filter wheels, the shutter and the cryostat. The cryostat mount enables all instrumental electronics to be mounted onto the derotated structure. Concerning the servo controls of the instrument, each motor controller is addressed by the control PC as a network node by means of a TCP-IP protocol.
Both cryostats were designed to cool down to 170K the detector flange that holds the scientific array of each camera composed of four E2V 42-90 chips and two more E2V detectors for technical use. The cryostat is composed of three independent modules: a stainless steel interface flange, a nitrogen vessel and a housing made of aluminium. This configuration allows us to separate the electrical part (detector flange, cables, etc) from the cryogenic assembly, allowing an easy maintenance and upgrade independently of the two parts.
From a mechanical point of view, the novel component of the blue channel cryostat is the bimetallic and monolithic vessel. It was designed with a spherical shape both to minimize the radiative thermal inlet and to create a compact instrument. With this geometry we obtain both a smooth cooling of the CCD baseplate and a good temperature stability, the latter being independent of the position of the camera. With a 10-liter fill of liquid nitrogen, the hold time of the cryostat is approximately 48 hours.
Two types of E2V detectors have been mounted to ensure simultaneous monitoring of the scientific data acquisition and the control of the instrument: an array of four E2V 42-90 (46082048 pixels) chips cover the corrected field with a sampling of about 0.2254 arcsec/pixel providing a scientific image of , while two E2V 42-10 of 2562048 px are used to acquire short exposure images for guiding and wavefront control. The technical characteristics of the 42-90 are: QE% at the peak, charge transfer efficiency %, read-out-noise electrons at 1MHz, and surface roughness m peak to valley. The final constraint is imposed by the instrument’s fast focal ratio (F/1.46), and is necessary to ensure optimal image quality over the entire focal plane. The gaps between the vertical chips are 1mm, which corresponds to 74 pixels or equivalently 16.7 arcsec in the focal plane of LBC-Blue. The gap between the vertical chips and the horizontal chip is 1.03mm (76 pixels, 17.2 arcsec).
There is a 5% loss of energy in the blue channel at the edge of the corrected field, while in the red channel the percentage of vignetting is well below that for the corrected area. The four science chips are placed in an unconventional fashion, with the fourth chip rotated 90∘ with respect to the others, to optimally cover the corrected FoV (see Fig.4).
The CCD controller selected for the LBC camera was designed and produced by the Italian firm Skytech in collaboration with the LBC team. The core of the system is a programmable Xilinx FPGA used to accomplish several different tasks. The whole system is compact and uses only two half eurocard boards to be better hosted at the prime focus application of the LBC. A good noise performance of 11 at 500 Kpix/s/ch is achieved despite the lack of a video preamplifier. In this configuration, the total readout time of the CCDs is 27 seconds.
The LBC shutter adopts dual blade mechanics to ensure a uniform exposure on the overall field also at short exposure times (0.1 sec). The accuracy ( sec) has been measured by laboratory tests using a laser trap.
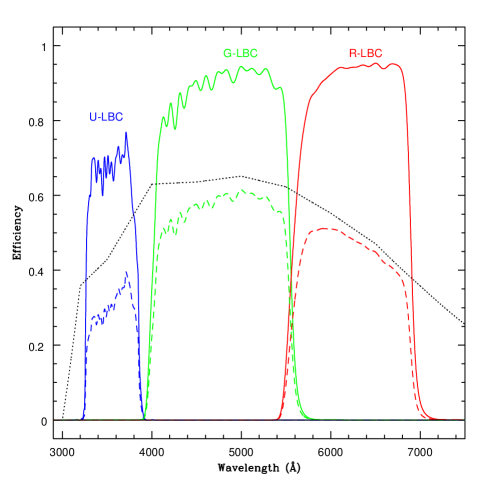
Two filter wheels with five holes are available for each channel. At present U, B, and V Bessel filters as well as custom U, G, and R filters are available for the blue channel. Their spectral shapes convolved with the LBC efficiency are shown in Fig.2. The G filter of LBC in practice is equivalent to a standard Gunn-g filter, while the U and R filters have been custom-made for the LBC-Blue instrument. The corresponding physical size of the filters is 155mm of diameter while the shutter used to cover the entire FoV of LBC-Blue is 470mm186mm (Speziali et al. (2004)).
The operation of the camera is handled by a graphical user interface and all the raw, calibration and telemetry data obtained so far are publicly available for the LBT partners in the LBC archive.
2.2 LBC-Red
The red channel corrector is optimized for the wavelength range including the V, R, I, and Z bands, with a possible extension to the near infrared, up to 1.8 m (J and H bands).
Although the wavelength range of interest is approximately two times larger than for the blue channel,
the design of the red channel corrector was easier because of a smaller change of refractive index with wavelength, toward the red part of the visible spectrum. Two different glass types were considered, silica and BK7. It should be stressed that neither silica nor BK7 ensure optimal transmission in the near infrared; on the other hand the main use of the instrument will be in the wavelength range from V to Z band and the extension to J and H should be intended as an additional facility. After a careful evaluation, BK7 was chosen, due to its better optical performance and lower cost. The instrumental sensitivity in the near infrared depends on the ability to change the final lens (L6) when replacing the detector for the infrared cryostat.
The red channel design is similar to that of the blue channel, with 6 lenses (5 spherical and 1 aspherical) and a plane filter. The focal length, and hence the plate scale, are almost equivalent to the the blue channel design. We have in addition tried to ensure that geometric distortion is similar for both channels to simplify the development of data reduction tools. The energy concentration at the wavelengths of interest is always well within the goal of 80% of the input energy to a single CCD pixel. The total throughput is 82%.
The red channel mechanical design is similar to that of the blue channel, considering the size of the lenses, their distances and especially the focal plane region and filter wheels. The only major disparity between the performance of the two channels is due to the different thermal behaviours of BK7 and SILICA.
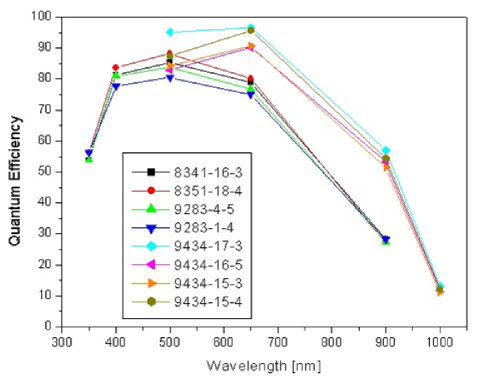
The red channel is equipped with 4 high-resistivity, deep-depletion 42-90 E2V detectors, which are optimized for high efficiency at longer wavelengths. The QEs of the four chips are shown in Fig.6 and the technical characteristics are similar to the chips selected for the blue channel.
The red camera was commissioned at the end of 2007 and the binocular configuration of LBT will be available at the beginning of 2008. Further details about the instrument are available on the LBC web site at http://lbc.oa-roma.inaf.it/.
3 The commissioning run of LBC-Blue
The LBC-Blue camera was the first instrument installed at the LBT, and for this reason was also used during the commissioning of the first LBT telescope.
During the commissioning phase completed in October-December 2006, a large number of astrometric and photometric fields were observed to be able to characterize the instrument. A detailed description of observations is provided in the next section. Some nights were dedicated to observing scientific targets to be able to test the performance of the instrument.
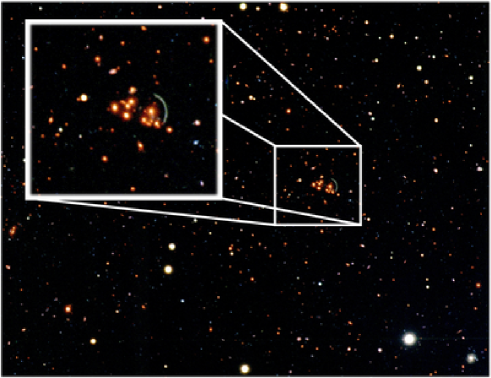
The scientific targets were selected to assess the ability of LBC to address a wide range of open science questions in the near future. We observed, for example, the nearby galaxy cluster CL2244-02, which acts on a distant galaxy producing a spectacular gravitational arc observed by LBC, during a night of 0.45 arcsec seeing in the U band (see Fig.7). Our imaging data demonstrates that the LBC can provide high-quality data to study strong, gravitational lensing, provided that an efficient service-observing program, to assess current seeing conditions, is in place. Several star clusters were observed, NGC7789, NGC2419, and M67, to analyze the technical performance related for example to the variation of the PSF profile across the overall LBC FoV, and to the analysis of astrometric distortions due to the complex optical correctors described in Section 2. Extragalactic targets, such as the galaxy cluster Abell576, the Subaru XMM Deep Survey (SXDS) and the quasar Q0933+28 field were observed to derive the magnitude limits in deep imaging surveys, and to add deep UV-B images to the multicolour information already available in these fields for the analysis of the evolutionary properties of faint, distant galaxies.
3.1 Technical performance of LBC-Blue
The presence of a pre-scan and an over-scan in each image allows a correct subtraction of the CCD bias signal which is stable in time. Dark current is negligible because exposure times of a single image are typically smaller than 15 minutes. The read-out noise and e-/ADU conversion factor (gain) have been measured by applying the “variance method” to flat field sequences and were found to be in agreement with our laboratory measurements. Chip to chip small variations were measured and are summarized in Table 1.
The camera provides a linearity residual error smaller than 1% over the whole 16-bit dynamic range (120000 e-). The detector full-well limit before blooming is greater than 150000 e-.
In most imagers based on CCD mosaics, electronics ghosts due to the video channel’s cross-talk are often present and are removed using software algorithms specifically developed for this purpose (see for example http://lbc.oa-roma.inaf.it/commissioning/xtalk.html) especially when bright saturated sources are present in the field of view. For LBC the cross talk coefficients are always of the order of .
| Parameter | Chip #1 | Chip #2 | Chip #3 | Chip #4 |
|---|---|---|---|---|
| R.O.N. e- | 11.4 | 11.6 | 11.6 | 11.2 |
| e-/ADU | 1.96 | 2.09 | 2.06 | 1.98 |
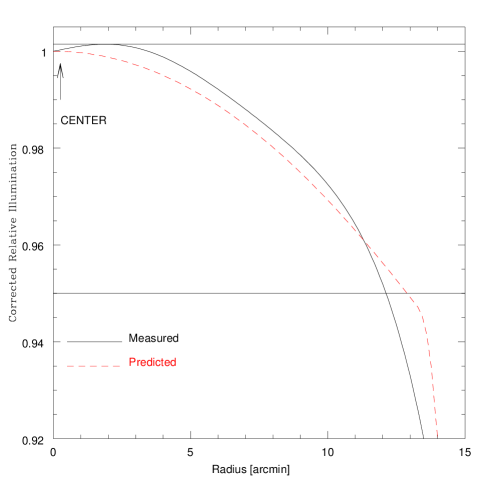
Flat-fielding was completed using a combination of twilight sky and night sky data. In Fig.5, we show our flat-field illumination correction as a function of radius from the center of the field-of-view, calculated using observations acquired in April 2007. The dome-shaped profile is the result of intrinsic illumination pattern, with residual scattered light affecting the central region of the FoV and vignetting affecting the outer regions of the FoV. All the curves are normalized to unity at the center. In the figure, the contribution of the sky ghost to the radial profile can be seen at a level of 0.15%, close to the geometrical FoV center (pixel x=1024 y=2919 of chip no. 2). The radial profile, predicted by our original design, is shown for comparison. Differences between the profiles are below a level of 1% out to 13 arcminutes from the center of FoV.
Being a prime focus camera, distortions are expected to be significant. The original design predicted that the effects of distortions would be fully-corrected out to about 10 arcmin from the FoV center. Distortions of light lead to two main problems, spatial variations in the pixel scale and deformations of the image PSF. The first problem has been computed from simulations and tested with images of moderately, crowded fields. It is corrected through an astrometric solution process estimated from the images. The second problem is partially recovered by resampling the images and using a variable PSF model, or using sufficiently large photometric apertures. We applied both methods, in each case by measuring the flux of standard stars, and found the results of both to be in close agreement.
The main optical distortion map is reproduced in Fig.4.
The astrometric solution was calculated in a three-step process, developed using the software package AstromC written by M. Radovich: this package is a porting to C++ of the Astrometrix software described e.g. in Radovich et al. (2004). The final astrometric solution is similar to the theoretical pre-solution derived from the original optical design. Second-order corrections vary from frame to frame because of different elevation, filter or position angle. These variations are however very small. Filter-to-filter variation is of the order of 0.01%, corresponding to about 1 pixel at the edge of the FoV. The pixel scale at the center is 0.2275 0.0001 and the median value is 0.2254 0.0001 with filter-to-filter variation affecting the fourth decimal digit. The corrected individual frames can be resampled to a constant pixel scale and stacked to a final image mosaic.
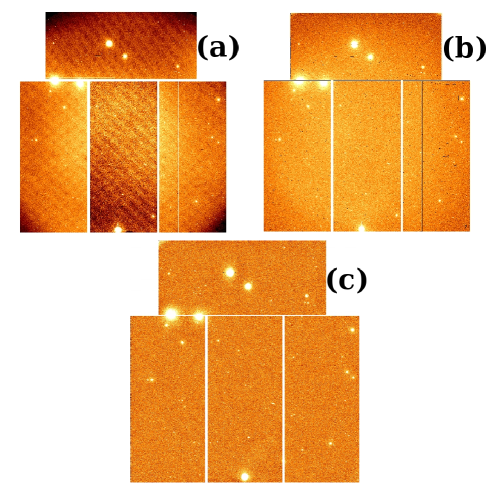
In Fig.8 we show an example of the mosaic LBC-Blue field of view in the U-Bessel filter, after applying various steps of the reduction procedure. The raw image in Fig.8 (a) shows both the effects due to vignetting and sky concentration caused by the geometrical distortion. In Fig.8 (b) the same mosaic image is shown after cross-talk correction, bias subtraction and flat-fielding, which removes the vignetting effect. In Fig.8 (c) the science mosaic is shown after removal of the geometrical distortion by re-sampling to a constant pixel scale. The quality of the PSF over the entire FoV of LBC-Blue does not depend on the radial distance from the optical center. This is also true for the ellipticity of stars in the field, which is always below 0.05 with a median value of 0.02. Thus, the uncertainties in telescope guiding and the optical distortion do not significantly affect the quality of the image at large distances from the center.
We have also analyzed images taken during the commissioning and science demonstration time (SDT), to quantitatively estimate the presence and magnitude of ghosts due to bright stars. The Bessel U, B, V, and custom G and R filters do not show measurable ghosts, in agreement with our expectations. Indeed, according to simulations, the ghost due to a bright star falls at the center of the bright star itself and it is twelve magnitudes fainter. In the interference U-LBC filter, the primary ghosts due to bright stars are more evident. The primary ghost of a UV bright star has the shape of a diffuse circle. To estimate the amount of flux in the primary ghost, we first built a model for the PSF using stars with peak intensity less than 20000 ADU and then used this model PSF to fit the non-saturated wings of bright stars. After PSF subtraction, two components remain: an intense circular ring centered on the bright star (diameter=75 pixels), and a diffuse large component (diameter=200 pixels) of smaller intensity, shifted with respect to the bright star, in radial direction from the center of the FoV. We have computed the total intensity of the inner bright component and of the diffuse, larger one finding a value of 2.80.7 per cent. We do not find evidence of dependence of the ghost intensity on the distance from the center field. The ghost intensity is independent of the position angle of the camera or elevation of the telescope. No secondary ghosts are measurable on the science data.
Calibration equations have been obtained for two photometric nights during the commissioning run of November 2006 in the Bessel U, B, and V filters. The equations adopted were of the kind:
| (1) |
where z.p. is the photometric zero point, c.t. is the colour term, is the atmospheric extinction coefficient in the -th band and , the airmass in the same band. We calibrated V and B versus the colour , while filter U has been calibrated versus . Photometric standards have been obtained from the Landolt et al. (1992) catalog, namely from the fields SA98 and SA113. These fields also contain a large number of additional standards measured by P.B. Stetson and available from the CADC web site. A supplementary catalog from Galadi-enriquez et al. (2000) has been used as well to increase the sample of U standards (Stetson standards have only B, V, R, and I band magnitudes) and to have a standard field close to the zenith for a better fit of the atmospheric extinction. The fits obtained are remarkably good and their internal errors very small. The photometric accuracy in the overall field is of the order of 0.01 mags. The values of the coefficients, and their uncertainties are reported in Table 2. For the G and R filters, only zero points have been obtained so far using SDSS secondary standard fields, while the U-LBC filter was not available during the commissioning phase in 2006.
| Filter | Zero Point | Colour Term | Extinction | corrAB |
|---|---|---|---|---|
| U-BESSEL | 26.23 0.03 | 0.036 0.009 (u-b) | -0.48 0.02 | 0.87 |
| B-BESSEL | 27.93 0.02 | -0.123 0.003 (b-v) | -0.22 0.01 | -0.07 |
| V-BESSEL | 28.13 0.01 | 0.021 0.005 (b-v) | -0.15 0.02 | 0.01 |
| G-LBC | 28.59 0.02 | -0.11 | ||
| R-LBC | 27.63 0.02 | 0.13 |
The zero points are in the Vega photometric system, and the AB magnitude can be derived using the relation . The U, B, and V filters are the Bessel ones, while G and R filters are peculiar of LBC-Blue. Only zero points are available for the G and R filters. The U-LBC filter was not available during the commissioning phase in 2006.
3.2 A test for deep imaging in the UV: the Q0933+28 field
To test the capabilities of the LBC-Blue channel in the field of deep extragalactic surveys over large areas of the sky, we observed a field centered on the bright QSO Q0933+28 at z=3.42 (Veron-Cetty & Veron (2006)). This field has been observed by Steidel et al. (2003) in the UGR filter set and was the target of an intensive spectroscopic campaign by Steidel and collaborators, which generated hundreds of galaxy spectra down to AB mag in the redshift interval . This field is therefore ideally-suited as a target to test the performance of LBC in extragalactic astronomy. In particular a deep U-BESSEL image has been obtained in this field. The details of the observations are provided in Table 3.
Raw LBC images were reduced using the LBC Pipeline, a collection of C and Python scripts optimized for LBC data analysis. The software performs cross-talk correction, bias subtraction (line by line, fitting the pre-scan and the over-scan), flat-field normalization. Then, we applied the astrometric solution given by AstromC to the provided frames and stacked them into a single mosaic using the Swarp package111http://terapix.iap.fr/. The astrometric procedure uses positions and fluxes from overlapping sources in different exposures to simultaneously optimize the internal astrometric accuracy and derive a relative photometric calibration of the stacking. Then absolute calibrations were obtained using photometric standard fields (Landolt and/or Stetson) observed in the same night. To calibrate the G and R filter zero points we used the photometry in the Stone fields (Stone (1997)). Part of the LBC field during commissioning was affected by scattered light, for this reason the total area of the Q0933+28 field was limited to 478.2 arcmin2.
3.3 Deep U band galaxy counts
To measure the efficiency of LBC-Blue for deep photometry in the UV bands over a large FoV, we acquired 3 hours of observations of the Q0933+28 field in average seeing conditions ( 1 arcsec). We then used SExtractor (Bertin & Arnouts (1996)) to derive a photometric catalog, and computed U-band galaxy number counts. For objects with area greater than that corresponding to a circular aperture of radius equal to the FWHM, we used the isophotal magnitudes provided by SExtractor. For smaller sources we computed magnitudes in circular apertures with diameter equal to 2 times the FWHM. This allows us to avoid the well-known underestimate of the flux of faint galaxies provided by the isophotal method. To isolate the few stars from the numerous faint galaxies in this field, we relied on the class_star classifier provided by SExtractor.
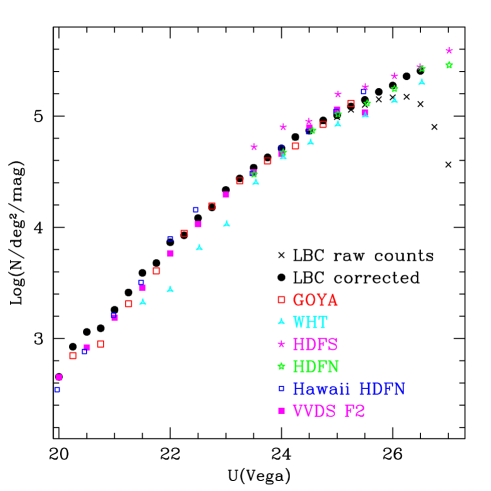
Raw counts are shown in Fig.9 where a clear decrease is apparent for . Thus an estimate of the completeness level should be performed in order to evaluate the amount of correction to the raw counts at the faint limits. This has been evaluated including in the real image 1000 simulated galaxies per magnitude bin in the magnitude interval using the standard ”artdata” package in IRAF. For simplicity disk galaxies are included with convolved sizes typical of real galaxies in the magnitude interval , i.e. with arcsec. The resulting 50% completeness level is measured at . The corrected counts are shown in the same Fig.9. Given the wide magnitude interval from to available in the present survey, the shape of the counts can be derived from a single survey in self-consistent way, possibly avoiding offsets due to systematics in the photometric analysis. A clear bending is apparent at . To quantify the effect we fitted the shape of the counts in the above magnitude interval with a double power-law. The slope changes from to for magnitudes fainter than . The uncertainty in the break magnitude is however large, .
In Fig.9 we compare our number counts with those derived by shallow surveys of similar area (GOYA by Eliche-Moral et al. (2006); Hawaii HDFN by Capak et al. (2004); VVDS-F2 by Radovich et al. (2004)), and with deeper pencil beam surveys (WHT, HDFN, and HDFS by Metcalfe et al. (2001)). In particular, the WHT galaxy counts (Metcalfe et al. (2001)) are based on a 34h exposure time image reaching but at the much lower 3 level in the photometric noise and in an area of 50 arcmin2, while the GOYA survey at the INT telescope is complete at 50% level at . These counts are shown together with the two pencil beam surveys in the Hubble Deep Fields (Metcalfe et al. 2001).
The agreement with the GOYA survey (900 sq. arcmin.) is remarkable, and suggests that once large areas of the sky are investigated, the effects of cosmic variance are slightly reduced. Deep pencil beam surveys (HDFN, HDFS) can go about 1 magnitude deeper than our present magnitude limit but require much longer exposure times. The present UV counts obtained during the commissioning of LBC-Blue are the deepest obtained so far from ground-based observations in large sky area that are not affected by cosmic variance. Deeper observations are expected with LBC-Blue in fields with larger exposure times and with more efficient UV filters.
It is interesting at this point to compare the LBC-Blue performance in particular with that of MegaCam at CFHT, because Suprimecam at Subaru is not efficient in the UV. LBC is of course 4-4.5 times faster than MegaCam at CFHT in the UV-B bands but the field of view is about 1/6 deg2. Thus LBC is optimized for very deep images on relatively smaller areas. We note however that the high LBC UV efficiency allows the use of UV filters centered at shorter wavelengths (355 nm) with respect to the MegaCam one (375 nm) providing UV magnitudes very similar to the standard Bessel system. Moreover, considering its final binocular configuration the LBC camera will double its global efficiency in multicolour imaging.
| Filter | maglim(10) | maglim(1) | seeing | texp |
|---|---|---|---|---|
| Vega mag | Vega mag | arcsec | hours | |
| U-BESSEL | 25.13 | 27.73 | 1.06 | 3.00 |
| G-LBC | 26.01 | 28.51 | 0.83 | 0.45 |
| R-LBC | 24.97 | 27.47 | 1.22 | 0.50 |
The magnitude limits are computed in a circular aperture two times the FWHM in each band.
3.4 UV dropout galaxies at high redshifts
The field we have selected for the commissioning test of the blue channel is one of Steidel’s fields used for the search of Lyman break galaxies at . For this field original U, G, and R images, a multicolour UGR catalog and spectroscopic information are made publicly available by Steidel and collaborators and are used for comparison with the LBC images.
It is well known that an efficient method to select unobscured or modestly obscured star forming galaxies at high redshifts is the Lyman break technique, that is effective in detecting high redshift Lyman break galaxies (LBGs) at . This selection, adopted by Steidel and collaborators (e.g. Steidel et al. (1999); Adelberger et al. (2004)) is based on the UGR filter set and exploits the strong absorption present in the UV band of these galaxies (UV dropout) caused by the redshifted Lyman continuum absorption produced by the interstellar neutral hydrogen of the same galaxies. Extensive spectroscopic follow up showed this multicolour selection to be highly effective (see e.g. Adelberger et al. (2004)).
We have applied the same method with our UGR filter set of the blue channel to test by means of a deep U band image the advantage of an efficient UV imager at an 8m class telescope.
We have used the R image of the Q0933+28 field to obtain a catalog of galaxies whose magnitude limits at different levels are reported in Table 3. We have used SExtractor (Bertin & Arnouts (1996)) in dual-image mode to derive the photometry in the other filters for sources detected in the R band, which was used as the detection image. We convolved images in each band with a Gaussian kernel so that the equivalent seeing of each image was identical and equal to that measured in the image taken in the worst seeing conditions, i.e. R-band observations. In this way the stellar FWHM of the images are the same and the colours can be computed in the same object area.
The U-BESSEL and G filters of LBC-Blue are similar to the U and G filters used by Steidel and collaborators. The R-LBC filter however has a significantly different throughput than the R-band filter used by Steidel et al. (2003), being peaked at shorter wavelength due to LBC-Blue throughput decline above wavelengths of 7000Å. Comparing our multiband photometry with the publicly-available catalog of the Q0933+28 field by Steidel et al. (2003) and on the basis of synthetic colours predictions by galaxy spectral synthesis models, we derived the colour equation to translate Steidel’s colours into the LBC photometric system, .
We have modified the colour selection criteria of Adelberger et al. (2004) taking into account the difference in the G-R colour and obtaining the following colour selections: and for Lyman break galaxies in the redshift interval .
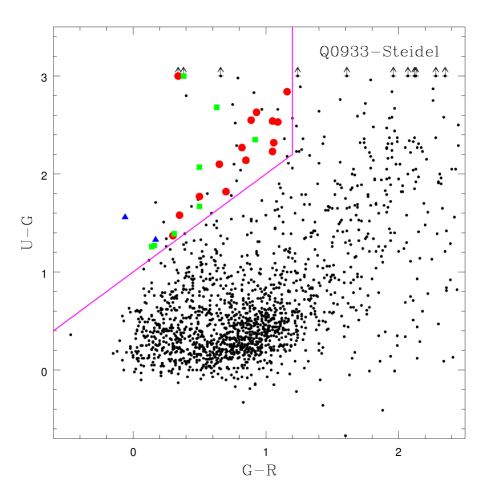
In Fig.10 (left panel) we plot the U-G versus G-R colour for all galaxies in the Q0933+28 field using the original photometry by Steidel and highlight the selection criteria for LBGs. We indicate the spectroscopically confirmed LBG galaxies by Steidel’s team, with 10 out of 24 galaxies being measured to be at lower redshifts () although being in the colour region expected for LBGs. Only two out of these ten galaxies are found at redshift .
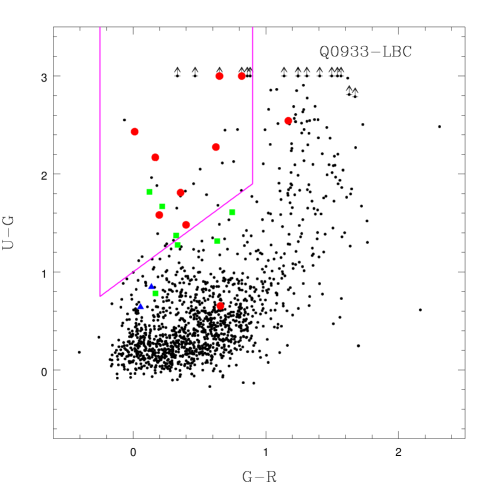
In Fig.10 (right panel) we show the same plot derived from the U, G, and R LBC images. In this comparison we restrict the analysis to the original Steidel’s area of arcmin2. We show with triangles, squares, and circles the galaxies in the redshift ranges analyzed by Steidel and collaborators: , and , respectively. In this case most of the LBGs candidates confirmed to be at lower spectroscopic redshifts are in general bluer, i.e. brighter in UV and in most cases lie consistently outside (or nearby, given the photometric noise) the LBGs colour region. Thus, even limiting the galaxy catalog to relatively bright objects with the robustness of the UV dropout colour selection technique of LBG galaxies at increases when very deep UV images as obtained by LBC are used.
An attempt in this direction was recently performed by Sawicki & Thompson (2005) who used very deep UGRI images obtained at Keck to produce a fainter sample of Lyman break galaxies at redshifts . However the greater UV sensitivity and larger field of view of LBC makes this instrument ideal to look for high redshift galaxies especially in the context of the study of the large scale structures at high redshift.
4 Conclusions
In this paper we have described the first instrument at the LBT telescope, the prime focus large binocular camera (LBC). The instrument has a binocular configuration with two channels, the blue channel with a good overall efficiency in the UV band and the red channel with good efficiency in the V-z bands.
We have also shown the technical characteristics of the blue channel derived from the commissioning data of LBC-Blue.
-
•
The corrected optical field is 30 arcmin of diameter with % loss of energy within arcmin. The total throughput of the optical corrector is 84%.
-
•
The optical distortion is always % even at the edge of the field and it is removed with a specific SW package.
-
•
The optical quality ensures an energy concentration of 80% within a pixel of arcsec in the overall corrected field. The active control of the optical quality can provide images as sharp as FWHM=0.5 arcsec even in the UV band.
-
•
Ghost images produced by the whole optical system are always negligible when glass filters are used (Bessel U,B,V). The total intensity of the primary brightest ghost is % when the wide interference UV filter is used. The primary ghost is centered on the original source position. Ghost images produced by the electronics cross-talk are as small as and can be easily removed during data reduction.
We have also described some scientific observations planned for the commissioning to assess the performance of LBC-Blue.
-
•
We have obtained very deep UV galaxy counts in a deep pointing with a total exposure time of 3h reaching U(Vega)=26.5, after correction for incompleteness. The wide magnitude interval () in our galaxy counts allowed a direct evaluation of the shape of the UV counts which shows a break in slope at about with a change in slope from 0.62 to 0.22 at the faint end.
-
•
The same LBC area includes a quasar field where extensive study of Lyman break galaxies at redshift is available. We have reproduced with our UGR filter set the well known multicolour selection of LBGs showing that the robustness of the UV dropout method for the selection of star-forming galaxies at increases when very deep UV images can be used as obtained by LBC at an 8m class telescope like LBT.
Acknowledgements.
Observations have been carried out using the Large Binocular Telescope at Mt. Graham, Arizona, under the Commissioning of the Large Binocular Blue Camera. The LBT is an international collaboration among institutions in the United States, Italy and Germany. LBT Corporation partners are: The University of Arizona on behalf of the Arizona university system; Istituto Nazionale di Astrofisica, Italy; LBT Beteiligungsgesellschaft, Germany, representing the Max-Planck Society, the Astrophysical Institute Potsdam, and Heidelberg University; The Ohio State University, and The Research Corporation, on behalf of The University of Notre Dame, University of Minnesota and University of Virginia. We thank C.C. Steidel and collaborators for the public availability of their images and spectroscopic redshifts of the Q0933+28 field. We thank the anonymous referee for useful comments which improve the clarity of the paper.References
- Adelberger et al. (2004) Adelberger, K. L., Steidel, C. C., Shapley, A. E., et al. 2004, ApJ, 607, 226
- Bertin & Arnouts (1996) Bertin, E. & Arnouts, S. 1996, A&AS, 117, 393
- Boulade et al. (2003) Boulade, O., Charlot, X., Abbon, P., et al. 2003, SPIE, 4841, 72
- Capak et al. (2004) Capak, P., Cowie, L. L., Hu, E. M., et al. 2004, AJ, 127, 180
- Eliche-Moral et al. (2006) Eliche-Moral, M. C., Balcells, M., Prieto, M., et al. 2006, ApJ, 639, 644
- Galadi-enriquez et al. (2000) Galadi-enriquez, D., Trullols, E., Jordi, C. 2000, A&AS, 146, 169
- Hill et al. (2000) Hill, J. M., et al. 2000, in Science with the Large Binocular Telescope, ed. T. Herbst (Heidelberg:Neumann Druck)
- Landolt et al. (1992) Landolt, A. U. 1992, AJ, 104, 372
- Metcalfe et al. (2001) Metcalfe, N., Shanks, T., Campos, A., McCracken, H. J. & Fong, R. 2001, MNRAS, 323, 795
- Miyazaki et al. (2002) Miyazaki, S., et al. 2002, PASJ, 54, 833
- Pedichini et al. (2003) Pedichini, F., Giallongo, E., Ragazzoni, R., et al. 2003, Proc. SPIE, 4841, 815
- Pedichini & Speziali (2004) Pedichini, F., Speziali, R. 2004, ASSL, 300, 349
- Radovich et al. (2004) Radovich, M., Arnaboldi, M., Ripepi, V. et al., 2004, A& A, 417, 51
- Ragazzoni et al. (2000) Ragazzoni, R., et al. 2000, Proc. SPIE, 4008, 439
- Ragazzoni et al. (2006) Ragazzoni, R., et al. 2006, Proc. SPIE, 6267, 33
- Sawicki & Thompson (2005) Sawicki & Thompson 2005, ApJ, 635, 100
- Speziali et al. (2004) Speziali, R., Pedichini, F., Di Paola, A., et al. 2004, SPIE, 5492, 900
- Steidel et al. (1999) Steidel, C. C., Adelberger, K. L., Giavalisco, M., Dickinson, M., Pettini, M., 1999, ApJ, 519, 1
- Steidel et al. (2003) Steidel, C. C., Adelberger, K. L., Shapley, A. E., et al. 2003, ApJ, 592, 728
- Stone (1997) Stone, R. C., 1997, AJ, 114, 2811
- Veron-Cetty & Veron (2006) Veron-Cetty M.P., Veron P., 2006, A&A, 455, 773
- Wynne (1996) Wynne, C. G., 1996, MNRAS, 280, 555