The Rise of Faint, Red AGN at :
A Sample of Little Red Dots in the JWST Extragalactic Legacy Fields
Abstract
We present a sample of 341 ”little red dots” (LRDs) spanning the redshift range using data from the CEERS, PRIMER, JADES, UNCOVER and NGDEEP surveys. These sources are likely heavily-reddened AGN that trace a previously-hidden phase of dust-obscured black hole growth in the early Universe. Unlike past use of color indices to identify LRDs, we employ continuum slope fitting using shifting bandpasses to sample the same rest-frame emission blueward and redward of the Balmer break. This approach allows us to identify LRDs over a wider redshift range and is less susceptible to contamination from galaxies with strong breaks that otherwise lack a rising red continuum. The redshift distribution of our sample increases sharply at and then undergoes a rapid decline at , which may tie the emergence, and obscuration, of these sources to the inside-out growth that galaxies experience during this epoch. We find that LRDs are 2-3 dex more numerous than bright quasars at , but their number density is only 0.6-1 dex higher than X-ray and UV selected AGN at these redshifts. Within our sample, we have identified the first X-ray detected LRDs at and . An X-ray spectral analysis confirms that these AGN are moderately obscured with ) of and . Our analysis of these X-ray sources reveals that reddened AGN emission dominates their rest-optical light, while the rest-UV originates from their host galaxies. We also present NIRSpec observations from the RUBIES survey of 17 LRDs that show broad emission lines consistent with AGN activity. The confirmed AGN fraction of our sample is for sources with F444W. In addition, we find three LRDs with narrow blue-shifted Balmer absorption features in their spectra, suggesting an outflow of high-density, low ionization gas from near the central engine of these faint, red AGN.
1 Introduction
One of the more surprising results to come from the first year of JWST observations is the detection of numerous faint, broad-line AGN at (Onoue et al., 2023; Kocevski et al., 2023; Harikane et al., 2023; Matthee et al., 2023; Maiolino et al., 2023; Larson et al., 2023; Greene et al., 2023). These sources have luminosities that are 2-3 dex below that of bright quasars identified by ground-based surveys at similar redshifts (e.g., Willott et al. 2010; Jiang et al. 2016; Mazzucchelli et al. 2017; Matsuoka et al. 2022; Yang et al. 2023b) and are powered by BHs with masses of , making them among the least-massive BHs known in the early Universe. These faint quasars are more representative of the underlying BH population at high redshifts and potentially the key to constraining models of BH seeding (Pacucci & Loeb, 2022; Li et al., 2023), the contribution of AGN to hydrogen reionization (Dayal et al., 2020; Yung et al., 2021; Giallongo et al., 2019; Finkelstein et al., 2019), and the early coevolution of galaxies and BHs (Habouzit et al., 2022; Inayoshi et al., 2022; Pacucci et al., 2023).
About 20% of the broad-line AGN identified with JWST appear to be heavily obscured, featuring a steep red continuum in the rest-frame optical, while also exhibiting relatively blue colors in the rest-frame UV (Kocevski et al., 2023; Harikane et al., 2023; Matthee et al., 2023; Greene et al., 2023; Killi et al., 2023). Sources with this “v-shaped”, red plus blue spectral energy distribution (SED) have come to be known as “little red dots” (LRDs) in the literature (Matthee et al., 2023)111While the definition of a ”little red dot” has varied in the literature,
in this study, the term is used to refer to compact sources with
red-optical and blue-UV colors.. Due to their unique colors and compact morphologies, LRDs have been identified photometrically and found to be quite ubiquitous, having number densities of Mpc-3 mag-1, which amounts to a few percent of the galaxy population at redshift (Barro et al., 2023; Labbe et al., 2023; Kokorev et al., 2024). Using follow-up spectroscopy, Greene et al. (2023) demonstrated that over 80% of photometrically-selected LRDs show broad-line emission when care is taken to exclude brown dwarf contaminants (e.g., Langeroodi & Hjorth 2023).
The origin of the red and blue emission in these sources has been heavily debated. Their steep rest-frame optical slopes are consistent with either a reddened AGN continuum or emission from dusty star-formation (Kocevski et al., 2023; Barro et al., 2023; Labbe et al., 2023; Akins et al., 2023), with lines of evidence supporting both scenarios. For example, if the continuum is dominated by stellar emission, then the implied H equivalent widths (EWs) would far exceed that of typical star-forming galaxies at lower redshift (i.e., Greene et al. 2023; Fumagalli et al. 2012; Whitaker et al. 2014). On the other hand, photometric constraints in the mid-infrared favor SED models consistent with a dusty, compact starburst and only mild contribution from an obscured AGN (Williams et al., 2023; Pérez-González et al., 2024a).
Several emission mechanisms have also been proposed to explain the UV excess observed in LRDs, including scattered light from the central AGN and stellar emission emerging from a relatively dust-free host or escaping unattenuated due to patchy dust (Kocevski et al., 2023; Barro et al., 2023; Labbe et al., 2023; Akins et al., 2023; Killi et al., 2023). While red sources with a UV excess have been found at lower redshifts (), they are rarer, making up only 1% of IR-bright, dust-obscured galaxies (Noboriguchi et al., 2019).
A substantial portion of black hole (BH) growth in the Universe is thought to be heavily obscured (Gilli et al., 2007; Ueda et al., 2014) and there are signs that the fraction of obscured AGN increases with redshift and decreasing luminosity (Hasinger, 2008; Merloni et al., 2014; Aird et al., 2015; Vito et al., 2018; Ni et al., 2020; Peca et al., 2023, although see Scholtz et al. 2023). If most LRDs are indeed powered by buried accretion, they would be an important population of previously-hidden AGN at high redshifts and provide a unique window into the early, obscured growth phase of today’s supermassive black holes.
| Survey | Field | Area | F444W |
|---|---|---|---|
| (armin2) | (AB mag) | ||
| NGDEEP | GDS | 11.4 | 30.65 |
| UNCOVER | Abell 2744 | 43.8 | 29.33 |
| JADES | GDS | 62.1 | 29.62 |
| CEERS | EGS | 88.6 | 28.97 |
| PRIMER | COS | 138.9 | 28.78 |
| PRIMER | UDS | 243.0 | 28.54 |
In this study, we construct the largest sample of photometrically-selected LRDs to date using publicly available JWST imaging in several extragalactic legacy fields. Our selection technique centers around measuring rest-frame UV and optical continuum slopes using shifting bandpasses in order to sample the same rest-frame emission blueward and redward of the Balmer break. This enables us to self-consistently search for compact sources with red optical and blue UV colors over a wide range of redshifts (). It also allows us to identify lower-redshift analogs to the LRDs found at , where the host galaxy may be more readily visible, helping us to understand the origin of their unusual SEDs.
Our analysis is presented as follows. In Section 2 we describe the JWST imaging used for this study, while Section 3 describes our target selection and the details of our SED modeling. We present our results in Section 4 and the implications of our findings are discussed in Section 5. When necessary the following cosmological parameters are used: .
2 Data Description & Reduction
2.1 NIRCam Imaging
In this study, we make use of JWST NIRCam imaging from the Cosmic Evolution Early Release Science Survey (CEERS; Finkelstein et al. (2022)), the Next Generation Deep Extragalactic Exploratory Public (NGDEEP) survey (Bagley et al., 2023), the JWST Advanced Deep Extragalactic Survey (JADES; Eisenstein et al. 2023), the Public Release IMaging for Extragalactic Research (PRIMER) survey (Dunlop et al., 2021), and the Ultradeep NIRSpec and NIRCam Observations Before the Epoch of Reionization (UNCOVER) survey (Bezanson et al., 2022). The fields and area covered with NIRCam by each survey are listed in Table 1.
For the JADES survey, we make use of the public NIRCam mosaics made available as part of the JADES second data release222https://archive.stsci.edu/hlsp/jades. For UNCOVER, we use the reductions made available by the GLASS-JWST data release333https://archive.stsci.edu/hlsp/glass-jwst. The CEERS, PRIMER, and NGDEEP NIRCam data were processed using the JWST Calibration Pipeline444http://jwst-pipeline.readthedocs.io/en/latest/ (versions 1.8.5, 1.10.2, and 1.9.2, respectively) with custom modifications described in Finkelstein et al. (2022) and Bagley et al. (2022). The resulting images were registered to the same World Coordinate System reference frame (based on Gaia DR1.2; Gaia Collaboration et al. (2016)) and combined into a single mosaic for each field using the drizzle algorithm with an inverse variance map weighting (Fruchter & Hook, 2002; Casertano et al., 2000) via the Resample step in the pipeline. The final mosaics in all fields have pixel scales of 003/pixel.
Source detection and photometry on the NIRCam mosaics were computed on PSF-matched images using SExtractor (Bertin & Arnouts, 1996) version 2.25.0 in two-image mode, with an inverse-variance weighted combination of the PSF-matched F277W and F356W images as the detection image. Photometry was measured in all of the available NIRCam bands in each field, as well as the F606W and F814W HST bands using public data from the CANDELS and 3D-HST surveys (Grogin et al., 2011; Koekemoer et al., 2011; Brammer et al., 2012; Momcheva et al., 2016). This process is similar to that described in Finkelstein et al. (2023), so we refer the reader there for additional details.
| Redshift | ||
|---|---|---|
| F606W, F814W, F115W | F150W, F200W, F277W | |
| F814W, F115W, F150W | F200W, F277W, F356W | |
| F115W, F150W, F200W | F277W, F356W, F444W | |
| F150W, F200W, F277W | F356W, F444W |
We compute photometric redshifts using the eazy (Brammer et al., 2008) software package for all sources in our photometric catalogs. eazy fits non-negative linear combinations of user-supplied templates to derive probability distribution functions (PDFs) for the redshift, based on the quality of fit of the various template combinations to the observed photometry for a given source. We use the default template set “tweak_fsps_QSF_12_v3”, which consists of 12 templates derived from the stellar population synthesis code FSPS (Conroy et al., 2010), as well as the six bluer templates created by Larson et al. (2022), as described in Finkelstein et al. (2023). A flat redshift prior with respect to luminosity was assumed and redshifts from to 20 were considered. We also perform a “low-redshift” run with the maximum redshift set to to allow for visualization of the best-fitting low-redshift model for sources found to be at .
2.2 NIRSpec Spectroscopy
The NIRSpec observations used in this study consist of three pointings in the UDS field taken on 16, 18, and 19 January 2024 and six pointings in the EGS field taken on 13 and 20 March 2024 as part of the RUBIES program (GO-4233; PI: A. de Graaff). The observations were taken with the G395M/F290LP grating/filter pair using a three-nod pattern. The coadded spectra have a total exposure time of 5689.7 s. The data were reduced using version 1.13.4 of the JWST Science Calibration Pipeline with the Calibration Reference Data System (CRDS) mapping 1215, starting from the Level 0 uncalibrated data products (“_uncal.fits” files) available on MAST. Custom parameters were used for the jump step at the detector-level calibration for a better treatment of the “snowballs”555https://jwst-docs.stsci.edu/data-artifacts-and-features/snowballs-and-shower-artifacts produced by high-energy cosmic ray events, and a nodded background subtraction was adopted.
The reduced two-dimensional (2D) spectra (“s2d”) have a rectified trace with a flat slope. To best optimize the extraction of one-dimensional (1D) spectra from the 2D spectra, we perform a weighted extraction based on the methodology of Horne (1986). Briefly, for a given spectrum, we take the median of the 2D spectrum along the spectral direction to produce a spatial profile for the source. We then identity the central peak of this profile, which corresponds to the source’s spectral trace. We then set all pixels in the spatial profile that are not a part of this central feature to zero and normalize the area under this masked spatial profile to one. We then use the normalized profile as the variable P in Table 1 of Horne (1986) and follow the prescription given therein to extract an optimized 1D spectrum.
3 Methodology
3.1 Sample Selection
Following the approach of Barro et al. (2023) and Labbe et al. (2023), we identify LRDs as sources with a compact morphology that are red at rest-frame optical wavelengths and blue in the rest-frame UV. While these previous studies used color indices measured in a single combination of bands (i.e., F277-F444W), in this study we perform our search using cuts on the UV and optical continuum slope measured by fitting photometry in multiple bands blueward and redward of the Balmer break at 3645Å.
To determine the continuum slope, (where is defined such that , for a source, we perform a minimization fit to the observed magnitudes using the linear relationship:
| (1) |
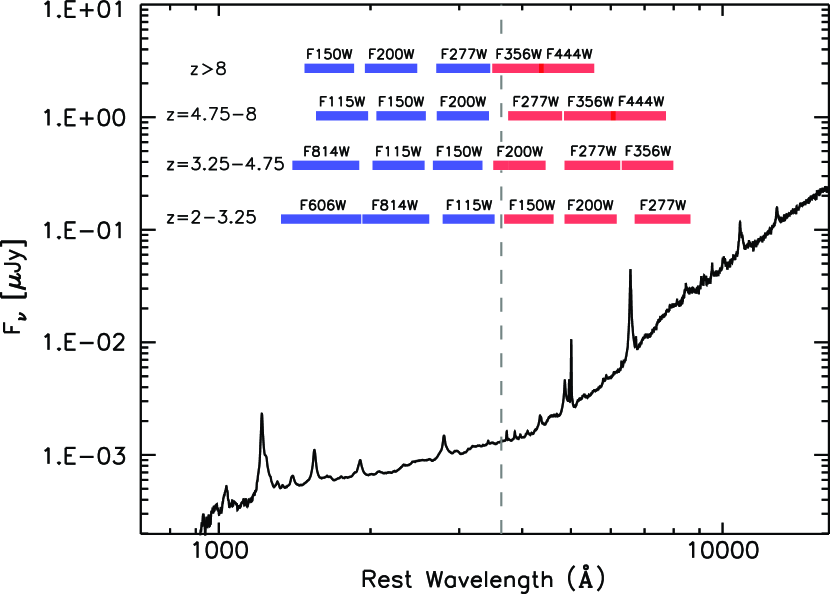
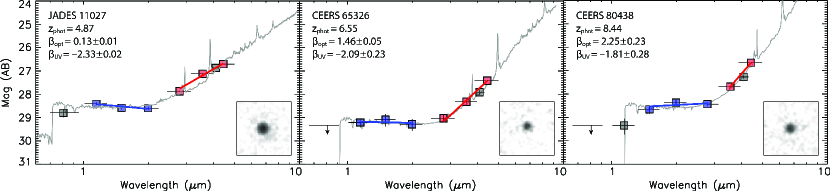
where is the AB magnitude measured in the th filter with an effective wavelength of . We perform this fit to determine both the rest-frame UV and optical spectral slopes, and , using fluxes measured in bands blueward and redward of 3645Å based on the redshift of each source. The filter combinations used for these fits as a function of source redshift are listed in Table 2 and shown in Figure 1. Three bands are used to measure the slope in all cases except for sources at , where only the F356W and F444W bands are used to determine the rest-frame optical slope. Examples of our slope fits for sources at a range of redshifts are shown in Figure 2.
Uncertainties on our measured slopes are calculated using a Monte Carlo approach. For each band, we perform 1000 random draws from a Gaussian whose mean is set to the measured flux in that band and whose standard deviation is set to the photometric error. Our continuum slope measurements are then repeated on all 1000 mock SEDs and standard deviations are calculated from the resulting distributions.
We can translate the color cuts used by previous studies to identify extremely red objects into continuum slopes using the relationship
| (2) |
For this study, we select red sources with a UV-excess using an optical continuum slope cut of and a UV slope cut of (which correspond to the color cuts F277W-F444W ¿ 1.0 mag and F150W-F200W ¡ 0.5 for sources at ). The bands used to measure the two slopes shift as a function of redshift as illustrated in Figure 1, ensuring that we fit the same portion of the spectral energy distribution of all sources from out to .
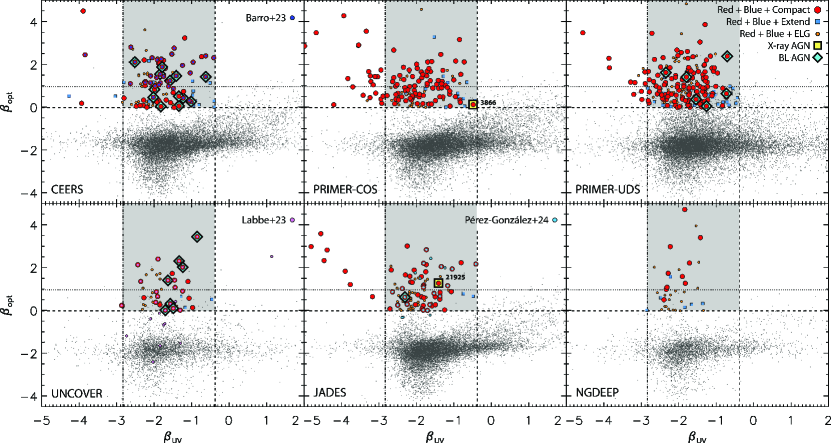
Figure 3 shows the resulting versus distribution for all galaxies at that are detected with a signal-to-noise ratio (SNR) greater than 12 in the F444W band. We find 791 sources with , , and SNR in the six fields we examined.
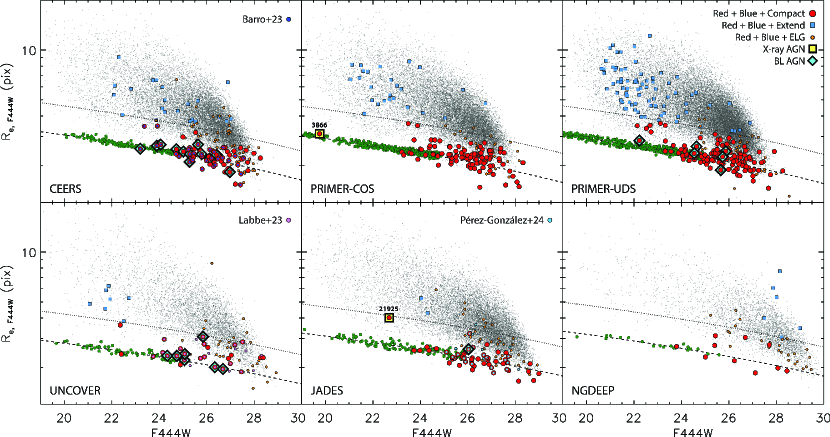
From this sample, we select sources with compact morphologies by applying an additional cut on half-light radius, , as measured by SExtractor in the F444W band. This cut is magnitude dependent and is designed to follow the tilt of the stellar locus apparent in the versus parameter space, which can be seen in Figure 4. To account for the increased scatter in size measurements at faint magnitudes, we select compact sources as those with within 1.5 times of the stellar locus (the dotted line in Figure 4). This size cut excludes 189 sources.
This amounts to 24% of the sample, which indicates that most objects selected to have red optical and blue UV colors also have compact morphologies. This agrees with the findings of Barro et al. (2023), whose sample of EROs is largely unresolved. Our size cut reduces our sample size from 791 to 602 sources.
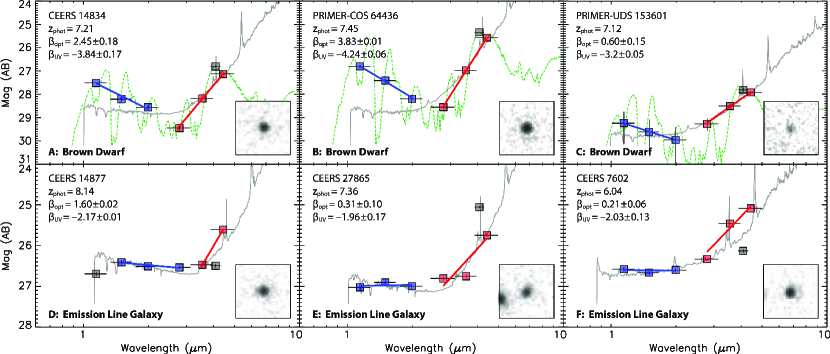
We apply two further selection criteria to remove potential contaminants. The first is an additional cut on to remove brown dwarfs, which have similar near-infrared colors as reddened AGN, but appear significantly bluer at shorter wavelengths (Langeroodi & Hjorth, 2023). To account for this, we exclude from our sample all sources with , which corresponds to the color cut employed by Greene et al. (2023). Examples of potential brown dwarfs removed from our sample based on its slope are shown in panels A, B, and C of Figure 5. Each panel shows both our best-fit galaxy plus AGN hybrid model and the best-fit LOWZ brown dwarf atmosphere model from Meisner et al. (2021). This color cut removes 63 objects and reduces the sample size to 539 sources.
The second refinement to our selection is meant to identify sources whose may be boosted due to strong line emission affecting one or more bands. The SEDs of three such sources are shown in Figure 5. Panel D and E show sources with a flat spectral slope between F277W and F356W, followed by an increase in flux at F444W that can be explained by contamination from strong [O iii]+H lines given the redshift of the two sources. The SED of the source in Panel F shows an elevated flux in F356W and F444W relative to F410M, which can be explained by [O iii]+H and H+[N ii] emission boosting the flux in each band. To remove such sources, we impose an additional requirement that and (when F410M photometry is available, which is true for all fields except NGDEEP). For sources at , only the second condition is imposed. This requirement ensures that sources have a rising continuum over the entire wavelength range in which the optical continuum slope is measured. The equivalent color cuts are and . This additional cut removes 198 sources, including all three sources shown in Figure 5, resulting in a final sample size of 341 sources.
In summary, our primary selection criteria are:
-
(i)
-
(ii)
-
(iii)
-
(iv)
To this, we add the following conditions aimed at removing sources whose optical continuum slope is likely boosted by strong line emission:
-
(v)
-
(vi)
| ID | RA | Dec | |||||||
|---|---|---|---|---|---|---|---|---|---|
| (J2000) | (J2000) | (AB mag) | (AB mag) | ||||||
| CEERS 260 | 214.805768 | 52.878048 | 7.93 | 1 | 26.13 | -19.57 | |||
| CEERS 941 | 214.757973 | 52.839706 | 7.42 | 1 | 25.69 | -19.70 | |||
| CEERS 965 | 214.912514 | 52.949437 | 5.95 | 1 | 26.86 | -18.11 | |||
| CEERS 1669 | 214.817697 | 52.877855 | 5.47 | 1 | 25.54 | -20.21 | |||
| CEERS 1914 | 214.998408 | 53.004619 | 6.49 | 1 | 24.83 | -19.02 | |||
| CEERS 1954 | 215.002842 | 53.007588 | 7.48 | 1 | 26.36 | -18.86 | |||
| CEERS 2285 | 214.956832 | 52.973153 | 5.86 | 1 | 25.80 | -18.64 | |||
| CEERS 2520 | 214.844768 | 52.892101 | 8.74 | 1 | 25.34 | -20.40 | |||
| CEERS 3153 | 214.925762 | 52.945661 | 5.23 | 1 | 25.99 | -17.24 | |||
| CEERS 4363 | 214.780370 | 52.834802 | 4.75 | 1 | 26.73 | -17.01 |
Note. — Field acronyms: EGS = Extended Groth Strip; GDS = Great Observatories Origins Deep Survey - South (GOODS-S); UDS = UKIDSS Ultra Deep Survey; COS: Cosmic Evolution Survey (COSMOS)
Note. — : 1 = phot redshift, 2 = spect redshift. This table is available in its entirety at https://github.com/dalekocevski/Kocevski24
3.2 Vetting of Candidates
We apply additional scrutiny to sources in our sample with photometric redshifts of that is meant to remove potential lower-redshift interlopers (e.g., Zavala et al., 2023). Our selection criteria for such sources are similar to those of Finkelstein et al. (2023) and are based on a combination of flux detection significances and the probability density function of the photometric redshift, . First, we require a SNR in all bands blueward of the Lyman break. This includes F814W for and F115W for . Here the SNRs are measured in diameter apertures in our non-PSF-matched images. Second, the integrated probability that the source lies at must exceed 95%, i.e. . Third, the difference between the of the best-fit low-redshift () and high-redshift models must exceed 4 (), corresponding to a significance (Bowler et al., 2020). Lastly, the (nonreduced) of the best-fit model must be to ensure a good fit to the photometry.
3.3 SED Fitting
We model the SEDs of our sources using a custom -minimization fit that employs multiple galaxy and AGN components in a manner similar to that described in Kocevski et al. (2023). We emphasize that these SED fits are not used for our sample selection and are instead only meant to visualize a possible SED consistent with all of our observed photometry in various figures throughout this paper. For the AGN component, we use the composite quasar spectrum of Vanden Berk et al. (2001) that is reddened by up to 4.5 magnitudes of visual extinction using a Calzetti et al. (2000) attenuation law. To this, we add dust-free, scattered AGN emission that ranges from 0 to 10% of pre-reddened AGN light. For the stellar population, we assume a Chabrier (2003) initial mass function, Bruzual & Charlot (2003) stellar population models, fixed solar metallicity, Calzetti et al. (2000) dust attenuation, and a “delayed-” star formation history with in the range of 0.1 Gyr to the age of the Universe at the source redshift (e.g., Maraston et al. 2010).
In §4.4, we examine the SED of an X-ray detected LRD in greater detail using CIGALE v2022.1 (Boquien et al., 2019; Yang et al., 2020, 2022). For this modeling, we adopt parameters similar to those used in Yang et al. (2023a). We use the standard delayed- module sfhdelayed for the star formation history, a Chabrier (2003) initial mass function with a solar metallicity (), and Bruzual & Charlot (2003) for the simple stellar population (SSP) module. We add nebular emission using the nebular model (Villa-Vélez et al., 2021) and use the dustatt_modified_starburst module for the dust attenuation. For the AGN component, we adopt the skirtor2016 module based on a clumpy torus model from Stalevski et al. (2012, 2016). The relative strength between the AGN and galaxy components, set by the fracAGN parameter, is allowed to vary from 0 to 0.99.
4 Results
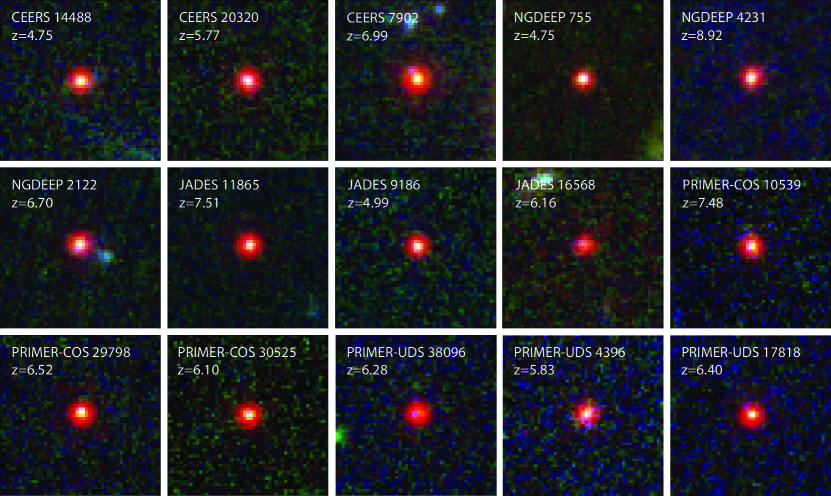
Using the continuum slope and size criteria outlined in §3.1, we have identified 341 candidate obscured quasars with compact morphologies and red optical and blue UV colors. These sources are split among the fields and datasets we examined as follows: 117 from PRIMER-UDS, 81 from PRIMER-COSMOS, 64 from CEERS, 46 from JADES, 23 from UNCOVER, and 10 from NGDEEP. The coordinates, redshifts, and best-fit continuum slopes are reported in Table 3. Color images of a subset of these sources, drawn from each dataset, are shown in Figure 6. In the following sections, we compare our sample to previous LRD compilations, examine the redshift distribution and number density of our sample in greater detail, present a case study of the first X-ray detected LRD, and discuss broad emission line detections among our sample.
4.1 Comparison to Previous Samples
In Figures 3 and 4, we highlight the sample of LRDs presented in three previous studies: Barro et al. (2023, hereafter B23) in the EGS field selected using CEERS data, Pérez-González et al. (2024b, hereafter PG24) in the GOODS-S field selected using JADES data, and Labbe et al. (2023, hereafter L23) in the Abell 2744 field using data from the UNCOVER survey. The B23 sample consists of 37 EROs selected to have NIRCam colors of and . We recover all 37 of these sources, however two (B23 ID 48777 and 72897) are excluded from our primary sample as potential brown dwarfs since they have UV spectral slopes of . Of the remaining 35 sources, all but four have , making them among the reddest in our CEERS sample.
The PG24 sample consists of 31 sources selected to have NIRCam colors of , and . Our primary sample includes 21 of these sources. Two were excluded for failing our SNR cut (i.e., ), three were excluded for having , and one source was excluded due to having a photometric redshift of . Of the remaining 25 sources, four were removed as their optical continuum slopes are potentially contaminated by strong line emission.
The L23 sample consists of 33 sources selected to have one of two possible red optical and blue UV color combinations (referred to as red1 and red2), as well as a compact morphology. The red1 criteria include & & , while the red2 criteria are & & . These color criteria are the same as those used in Kokorev et al. (2024).
Of these sources, two were excluded from our sample as they were spectroscopically confirmed to be brown dwarfs by Greene et al. (2023, L23 IDs 23778 and 29466) and another two were flagged as potential strong emission line galaxies (L23 IDs 8602 and 15798). Six sources were excluded for failing our optical slope cut (L23 IDs 2476, 6151, 37108, 46991, 49555 and 49567).
These six sources highlight a notable difference between our selection criteria and that of L23 and Kokorev et al. (2024). The SEDs of these sources exhibit a jump between F200W and F277W, consistent with the Balmer break falling between the two bands, but otherwise have flat SEDs blueward and redward of the break. Such SEDs will be selected by the two red color criteria in red1, namely & . However, when the continuum is fit using three bands (i.e., F200W, F277W, and F356W), the flat SED after the break reduces the inferred spectral slope and ultimately drops it below our selection threshold. Overall, 18% (6/33) of the L23 sample failed to make our selection for this reason. Our continuum slope fitting technique appears less susceptible to contamination from galaxies with strong breaks, especially at , where the Balmer break falls between the F200W and F277W bands. The SEDs of such sources are likely galaxy-dominated and not the AGN candidates with rising red continua that our LRD selection is intended to identify.
4.2 Redshift Distribution
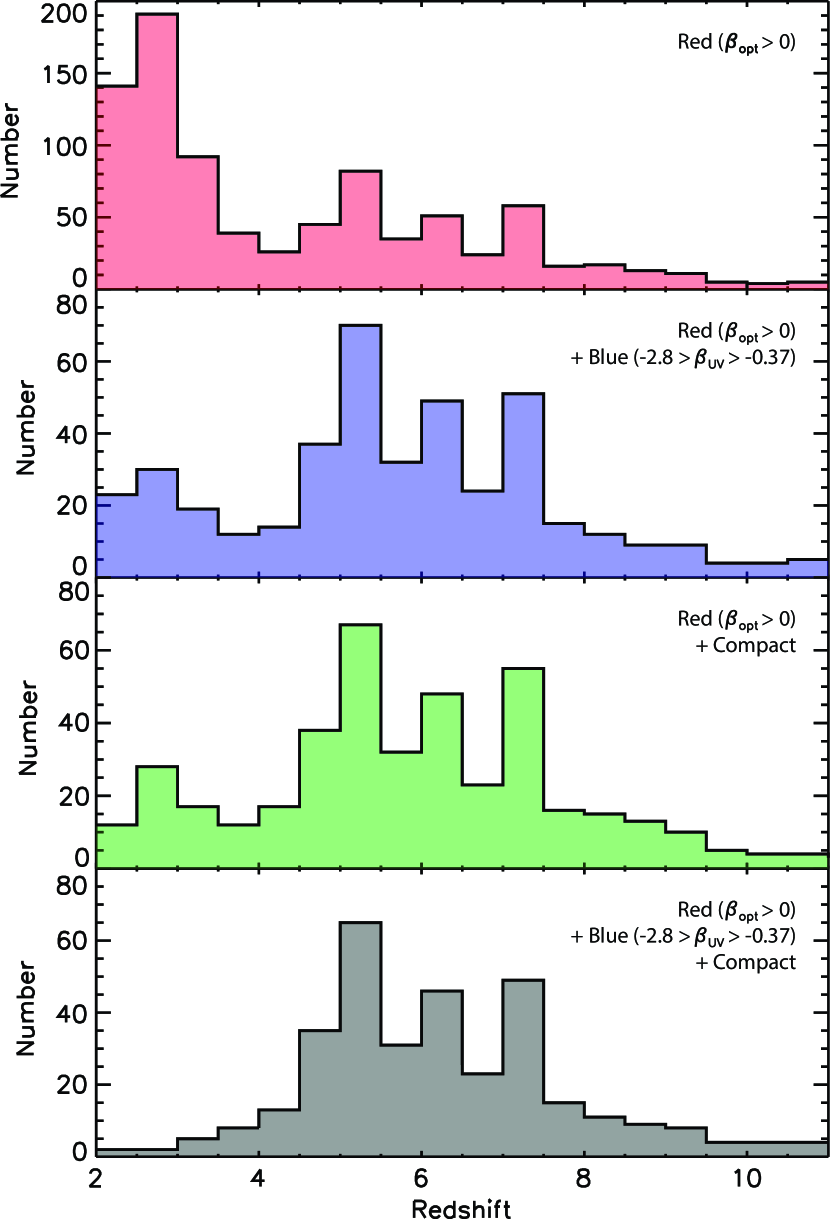
Our spectral slope fitting technique, which uses shifting bandpasses to sample the same rest-frame emission blueward and redward of 3645Å, allows us to self-consistently search for AGN candidates with red optical and blue UV colors over a wide range of redshifts. The bottom panel of Figure 7 shows the redshift distribution of our resulting sample. We find sources with this unique spectral shape and compact morphology emerge at and have a median redshift of . Their number density then undergoes a rapid decline at .
Our methodology of using shifting bandpasses was meant to help identify lower-redshift analogues of the LRDs previously identified in the literature. However, we identify very few unresolved sources with red optical and blue UV colors at : only 17 are found in our sample. This is not due to sources becoming more extended at lower redshifts. Even without our size cut, we find few sources with red optical and blue UV colors at the lowest redshifts we examined. This fact can be seen in the top and middle-top panels of Figure 7, which show the redshift distribution of all red sources () and red plus blue sources () regardless of their effective radii. While we find a growing number of optically red sources at , most () are removed from our sample based on our UV color cut. Only of the optically red and UV blue sources are cut based on their size. Our findings suggest the population of LRDs with a UV-excess emerge in large numbers for the first time at about . This may explain why such sources were not previously identified using imaging from HST and Spitzer/IRAC.
At the high-redshift end, our selection becomes increasingly incomplete as long-wavelength filters start to shift blueward of the Balmer break. For example, the F356W band probes fully blueward of 4000Å at . This will flatten the inferred spectral slope (i.e., lower ) for sources that are blue in the rest-frame UV and increase the likelihood that sources will fall below our continuum slope cut. This may help explain the rapid decline in the redshift distribution above .
4.3 Number Density
| (AB Mag) | (Mpc-3 mag-1) | |
|---|---|---|
| -17.0 | 22 | |
| -18.0 | 62 | |
| -19.0 | 56 | |
| -20.0 | 22 | |
| -21.0 | 3 | |
| -17.0 | 14 | |
| -18.0 | 33 | |
| -19.0 | 28 | |
| -20.0 | 13 | |
| -21.0 | 3 | |
| -22.0 | 1 | |
In this section, we present the rest-frame UV luminosity function (LF) of the LRDs in our sample. To determine the rest-UV magnitude of our sources, we extrapolate our best-fit to the blue continuum to rest-frame 1450Å. The resulting absolute magnitudes at this wavelength are listed in Table 3. To compute the number density of our sample, we employ the method (Schmidt, 1968):
| (3) |
where is the maximum comoving volume in which source with absolute magnitude is detectable. For a given survey area and a redshift range , the comoving volume is computed as:
| (4) |
For this calculation, we exclude sources selected from the UNCOVER dataset due to the variable magnification in the Abell 2744 field. We account for magnitude incompleteness effects by computing the total survey area () and maximum redshift () over which each source could have been detected. Given that our sources are substantially fainter in the rest-UV versus the rest-optical, the latter is largely driven by the requirement that sources have rest-UV flux measurements with which to measure a continuum slope.
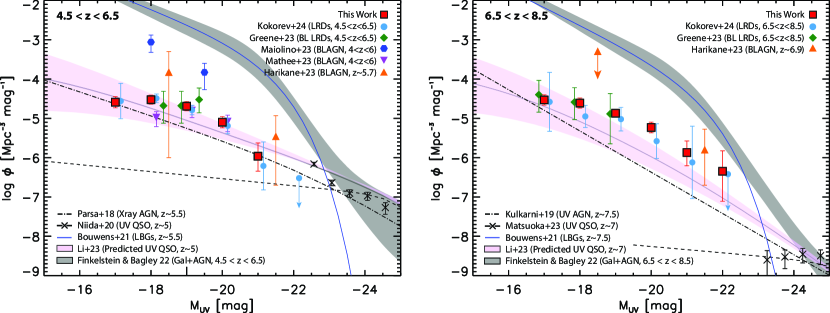
We calculate the LF using a bin size of 1.0 magnitude and over two redshift ranges: and . The uncertainty on the resulting number densities is estimated with Poisson statistics corrected for low number counts following Gehrels (1986). Our calculated number densities are listed in Table 4 and shown in Figure 8.
We find good agreement with the number densities reported by Kokorev et al. (2024) for their color-selected samples of LRDs, as well as those inferred by Matthee et al. (2023) and Greene et al. (2023) for their spectroscopically-confirmed samples of dust-reddened, broad-line AGN at both and . Comparing to the results Harikane et al. (2023) and Maiolino et al. (2023), we find that if LRDs are indeed powered by reddened AGN, they would make up 10-15% of the overall faint, broad-line AGN population detected by JWST.
In agreement with previous results (Kocevski et al., 2023; Matthee et al., 2023; Greene et al., 2023), we find that our candidate faint, red AGN are 2-3 dex more numerous than would be expected based on simple extrapolations of the quasar luminosity function measured from the ground at (Niida et al., 2020; Matsuoka et al., 2023). However, we find better agreement with the number densities measured for lower-luminosity AGN at these redshifts. The number density of LRDs at is higher than that of X-ray AGN reported in Parsa et al. (2018). This offset becomes more pronounced at , where we infer LRDs to be more common than color-selected AGN at this redshift (Kulkarni et al., 2019). We note that we do find fair agreement with the predicted quasar luminosity function at the faint regime by Li et al. (2023), which is the result of a semianalytical model for BH formation and growth that considers multiple accretion bursts with variable Eddington ratios and is primarily calibrated with the quasar abundance at the bright end of . Finally, At , we find that our sources constitute of the overall galaxy population at . This fraction rises to at , although this is based on a single bright source.
4.4 X-ray Detected Little Red Dots
We cross-matched our sample of 341 candidate red AGN with the publicly available X-ray source catalogs from the AEGIS-XD survey (Nandra et al., 2015), the X-UDS survey (Kocevski et al., 2018), the C-COSMOS survey (Elvis et al., 2009), and 7 Ms observations in GOODS-South (Luo et al., 2017). We find only two objects that are directly detected: PRIMER-COS 3866 and JADES 21925. These sources have redshifts of and , respectively and appear to be bright, lower-redshift analogs of the LRDs identified at . As such, they may provide unique insight into the nature of these objects. In this section, we examine the properties of both sources in greater detail.
4.4.1 PRIMER-COS 3866 at
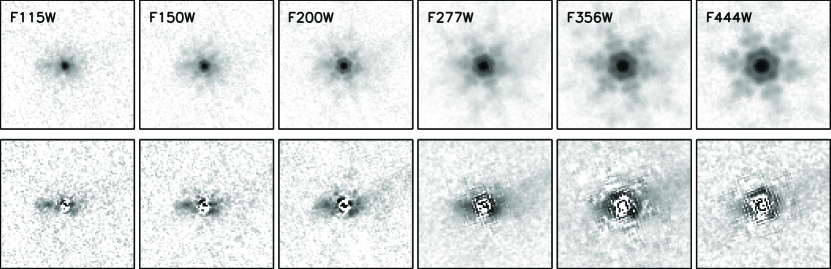
PRIMER-COS 3866 was first identified as an X-ray emitter by Elvis et al. (2009) as CXOC100024.2+022510 and later spectroscopically confirmed to be at by Civano et al. (2011). The source has a F444W magnitude of 19.75, making it the brightest object in our sample. Images of PRIMER-COS 3866 in multiple NIRCam bands are shown in Figure 9. In addition to its strong NIRCam detection, the source is also detected in the rest-frame UV with Hubble ACS imaging and in the near- and mid-infrared with Spitzer IRAC and MIPS imaging.
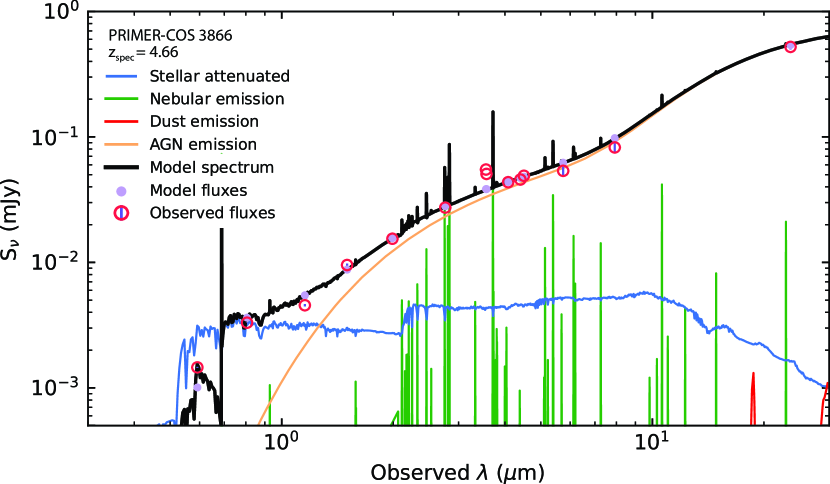
In Figure 10, we show the best-fit galaxy plus AGN SED model produced by fitting the available photometry with CIGALE v2022.1 using the parameters listed in §2.2. For this fit, we use Spitzer IRAC and MIPS fluxes from the ‘super-deblended’ infrared photometric catalogue of Jin et al. (2018). We find the emission of the source is well-fit, and dominated by, AGN emission that is moderately reddened by polar dust with an . The skirtor2016 model used for the AGN component is based on a clumpy torus model, which would suggest the observed extinction is due to torus-level obscuration as opposed to galaxy-wide obscuration. The CIGALE results suggest the relatively blue color of the source in the rest-frame UV is due to emission from the host galaxy at . CIGALE places the stellar mass of the underlying galaxy at .
Because there has been considerable debate as to the origin of the blue rest-frame UV emission from LRDs (e.g. Kocevski et al. 2023), we used the GALFIT software (Peng et al., 2002) to subtract off emission from the central point source in several NIRCam bands to search for signs of the underlying galaxy. For this modeling, we provide GALFIT with empirical PSFs constructed from the PRIMER-COS mosaic and noise images that account for both the intrinsic image noise (e.g., background and readout noise) and added Poisson noise due to the objects themselves. The results of the point source subtraction can be seen in the lower panels of Figure 9. We see clear signs of an elongated, potentially clumpy host galaxy emerging in the short-wavelength NIRCam images, in general agreement with our best-fit SED model.
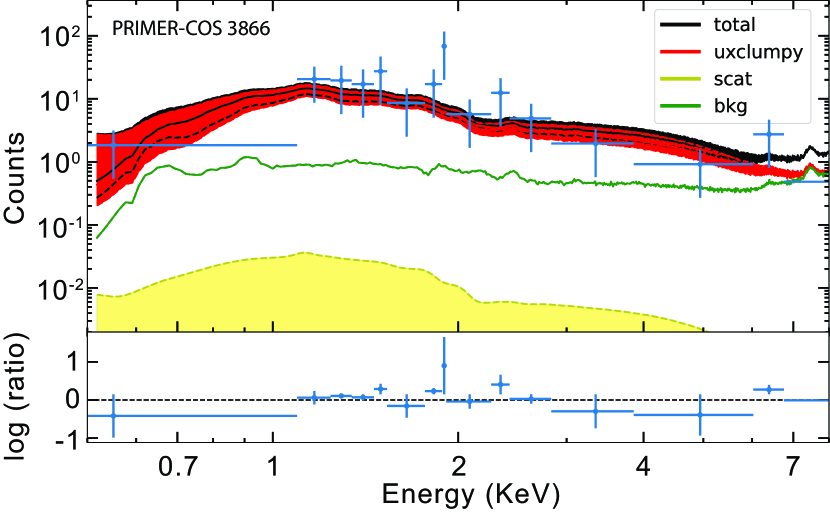
Lastly, the X-ray emission from PRIMER-COS 3866 affords us an independent way to assess the obscured nature of the source. The shape of an AGN’s X-ray spectrum can both reveal the presence of gas obscuring the central engine and provide a measure of its column density, . An X-ray spectral analysis of PRIMER-COS 3866 was recently carried out by Laloux et al. (2023), where the UXCLUMPY clumpy torus model of Buchner et al. (2019) was fit to the observed X-ray spectrum using the Bayesian X-ray Analysis (BXA) package (Buchner et al., 2014). The results of this analysis are shown in Figure 14. The best-fit column density is found to be , resulting in an obscuration-corrected X-ray luminosity of . The ratio of our measured extinction to our best-fit gas column density, , is a factor of below the Galactic standard value of mag cm-2 (Savage & Mathis, 1979), but in good agreement with the reduced ratios reported by Maiolino et al. (2001) for various classes of luminous ( erg s-1) AGN.
These results confirm that PRIMER-COS 3866 harbors a luminous, moderately obscured AGN, in agreement with our SED modeling of the source. The best-fit keV luminosity, combined with a bolometric correction (Duras et al., 2020) appropriate for this luminosity class, leads to an estimate of the black hole mass of , assuming it is accreting at the Eddington limit. Given the estimated stellar mass of the host, this black hole mass places the source above the standard local relation between the stellar mass and black hole mass, as seen in dozens of other galaxies discovered by JWST (see, e.g., Pacucci et al. 2023).
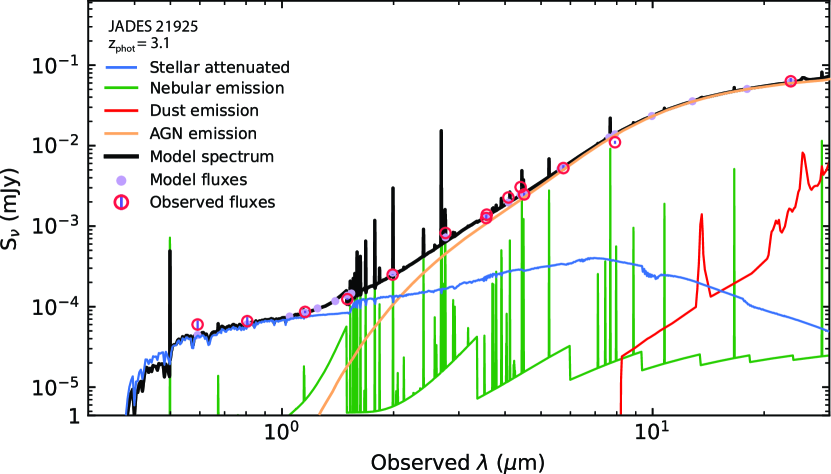
4.4.2 JADES 21925 at
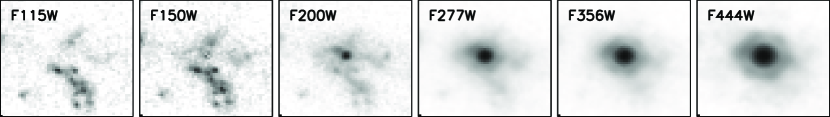
JADES 21925 was first identified as an X-ray emitter by Giacconi et al. (2002) as CXOCDFSJ033220.9-275223 in the 1 Msec Chandra Deep Field South observations and more recently detected in the 7 Ms observations of the field presented in Luo et al. (2017). Images of JADES 21925 in multiple NIRCam bands are shown in Figure 12. The source shows clear signs of an extended, blue structure surrounding a reddened point source that only becomes prominent at wavelengths longer than 2m. The photometric redshift of the source was reported as in the Luo et al. (2017) catalog, which we revise upward to with the inclusion of JWST photometry from JADES. Based on its X-ray detection, JADES 21925 is the lowest redshift LRD confirmed to host an AGN (a record it holds with RUBIES-BLAGN-1 (Wang et al., 2024), which is found to have the same redshift; see §4.5 below).
In Figure 13, we show the best-fit galaxy plus AGN SED model for JADES 21925 produced with CIGALE v2022.1 using the parameters listed in §2.2. For this fit, we use Spitzer IRAC and MIPS fluxes from the photometric catalogue of Guo et al. (2013). Like PRIMER-COS 3866, we find the emission of JADES 21925 is dominated by AGN emission, while the rest-frame UV emission is attributed to the host galaxy. We find the extinction of the AGN emission by polar dust to be and CIGALE’s estimate for the stellar mass of the underlying galaxy is .
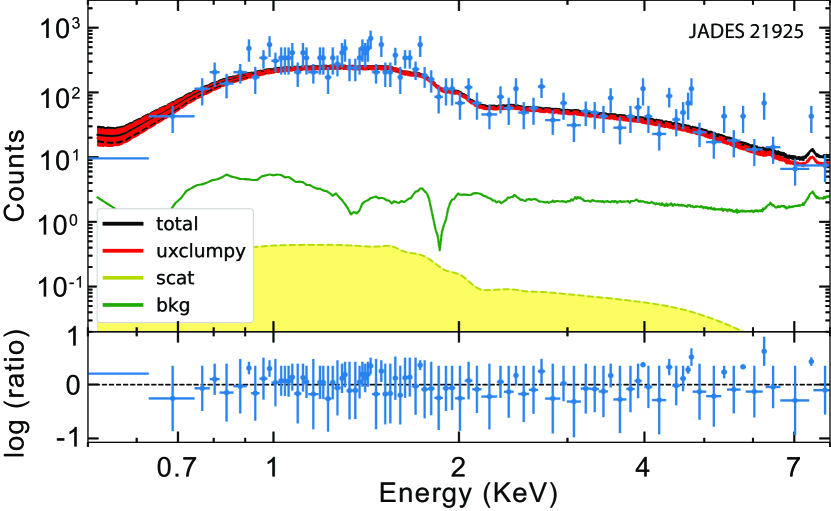
We also performed an X-ray spectral analysis of JADES 21925 using the BXA package and the UXCLUMPY torus model of Buchner et al. (2019). The model assumes a powerlaw with a photon index prior of reprocessed with a torus (including absorption, Compton scattering, and Fe fluorescence) and an additionally absorbed reflection component. The results of this analysis indicate JADES 21925 is moderately attenuated, with a best-fit column density of , resulting in an obscuration-corrected X-ray luminosity of . The ratio of our measured extinction and column density again favors a ratio below that of the Galactic standard value. Using the median of the ratios reported in Maiolino et al. (2001) and our measured extinction would predict a column density of , which agrees with our measured value, within the errors, better than the 21.6 cm-2 obtained using the Galactic standard ratio.
Our measured X-ray luminosity, coupled with the relatively low stellar mass that we infer for the host from our SED fit, indicates that JADES 21925, like PRIMER-COS 3866, may harbor an overmassive black hole. Using a bolometric correction of and assuming the system is accreting at its Eddington limit, results in a black hole mass of . This would imply this source lies significantly above the local black hole versus galaxy stellar mass relationship.
4.5 Broad-Line Detections
A high fraction of LRDs have been shown to exhibit broad line emission (e.g., Matthee et al., 2023; Greene et al., 2023), confirming the presence of an AGN in these sources. Among our sample, 11 sources were previously reported to have broad H emission. These are CEERS 82815 from Kocevski et al. (2023, their ID 746), CEERS 69459 from Harikane et al. (2023, their ID 672), JADES 12068 from Maiolino et al. (2023, their ID 10013704), UNCOVER 3989, 4535, 9358, 9497, 9904, 25119, and 29255 from Greene et al. (2023, L23 IDs 30782, 28343, 8798, 8296, 6430, 20080, and 13556), and PRIMER-UDS 33823 from Wang et al. (2024, their ID RUBIES-BLAGN-1). These sources are highlighted as cyan diamonds in Figures 3 and 4.
| ID | RUBIES ID | RA | Dec | Line | FWHMbroad | ||||
|---|---|---|---|---|---|---|---|---|---|
| (J2000) | (J2000) | (km s-1) | () | (Dust Corr.) | |||||
| CEERS 5760 | RUBIES-CEERS 61496 | 214.972445 | 52.962196 | 5.079 | H | 1.8 | |||
| CEERS 6126 | RUBIES-CEERS 60935 | 214.923377 | 52.925588 | 5.288 | H | 2.5 | |||
| CEERS 7902 | RUBIES-CEERS 55604 | 214.886801 | 52.855376 | 6.986 | H | 3.4 | |||
| CEERS 10444 | RUBIES-CEERS 49140 | 214.795367 | 52.788848 | 6.687 | H | 3.0 | |||
| CEERS 13135 | RUBIES-CEERS 42232 | 214.990983 | 52.916523 | 4.955 | H | 2.4 | |||
| CEERS 13318 | RUBIES-CEERS 42046 | 214.983037 | 52.956006 | 5.280 | H | 3.0 | |||
| CEERS 14949 | RUBIES-CEERS 37124 | 215.137064 | 52.988557 | 5.684 | H | 2.8 | |||
| CEERS 20496 | RUBIES-CEERS 927271 | 215.078257 | 52.948504 | 6.786 | H | 2.9 | |||
| CEERS 20777 | RUBIES-CEERS 926125 | 214.892248 | 52.877406 | 5.286 | H | 2.7 | |||
| PRIMER-UDS 29881 | RUBIES-UDS 50716 | 34.313132 | -5.226765 | 6.17 | H | 3.0 | |||
| PRIMER-UDS 31092 | RUBIES-UDS 47509 | 34.264581 | -5.232544 | 5.675 | H | 1.9 | |||
| PRIMER-UDS 32438 | RUBIES-UDS 44043 | 34.241809 | -5.239401 | 3.500 | H | 2.1 | |||
| PRIMER-UDS 33823 | RUBIES-UDS 40579 | 34.244190 | -5.245834 | 3.103 | Pa | 4.0 | |||
| PRIMER-UDS 116251 | RUBIES-UDS 59971 | 34.260537 | -5.209120 | 5.365 | H | 2.2 | |||
| PRIMER-UDS 119639 | RUBIES-UDS 63166 | 34.312143 | -5.202546 | 6.518 | H | 4.0 |
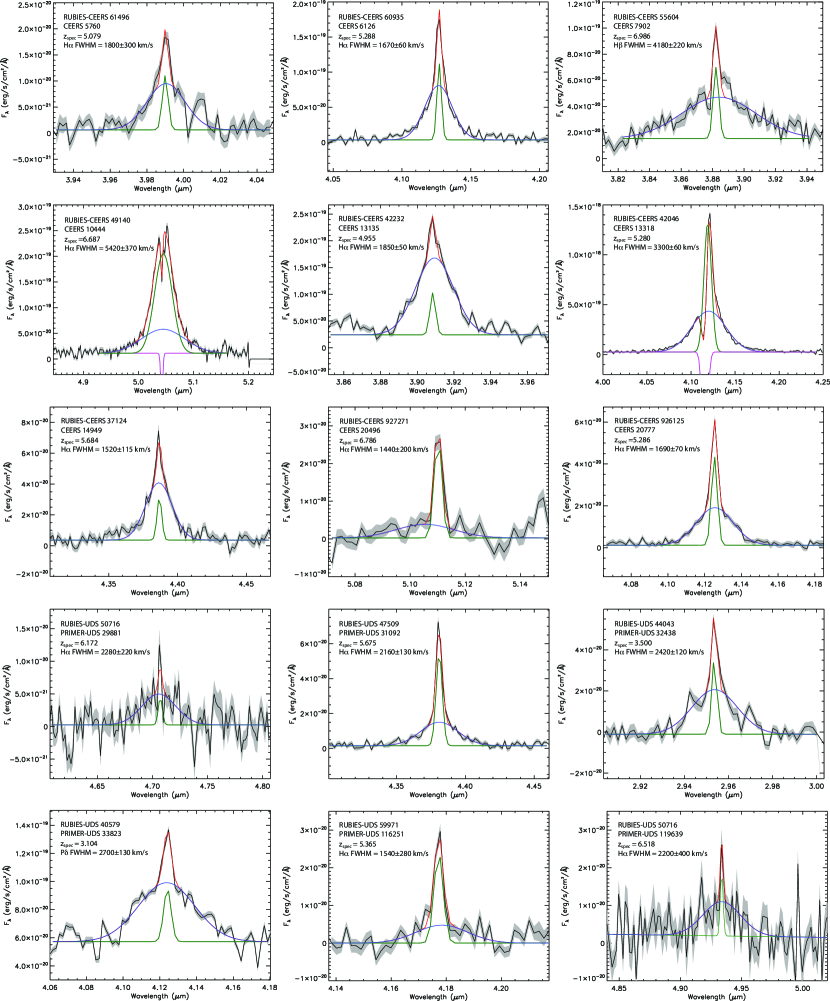
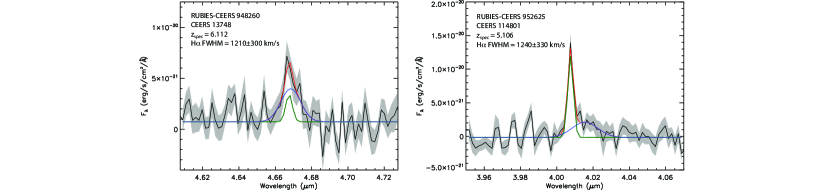
We cross-matched our primary sample with the publicly available NIRSpec data in our target fields and have identified 18 sources in the EGS field and six sources in the UDS field that were recently observed by the RUBIES program (GO-4233; PI: A. de Graaff). We find evidence for broad emission lines detected with a in nine CEERS sources (5760, 6126, 7902, 10444, 13135, 13318, 14949, 20496, 20777) and six PRIMER-UDS sources (31092, 32438, 33823, 116251, and 119639). We also detect tentative broad emission with in two additional CEERS sources (13748 and 114801). In addition, one source from the sample of B23 (ID 48777) that was removed from our primary sample for having a UV slope of was also observed and confirmed to be a brown dwarf.
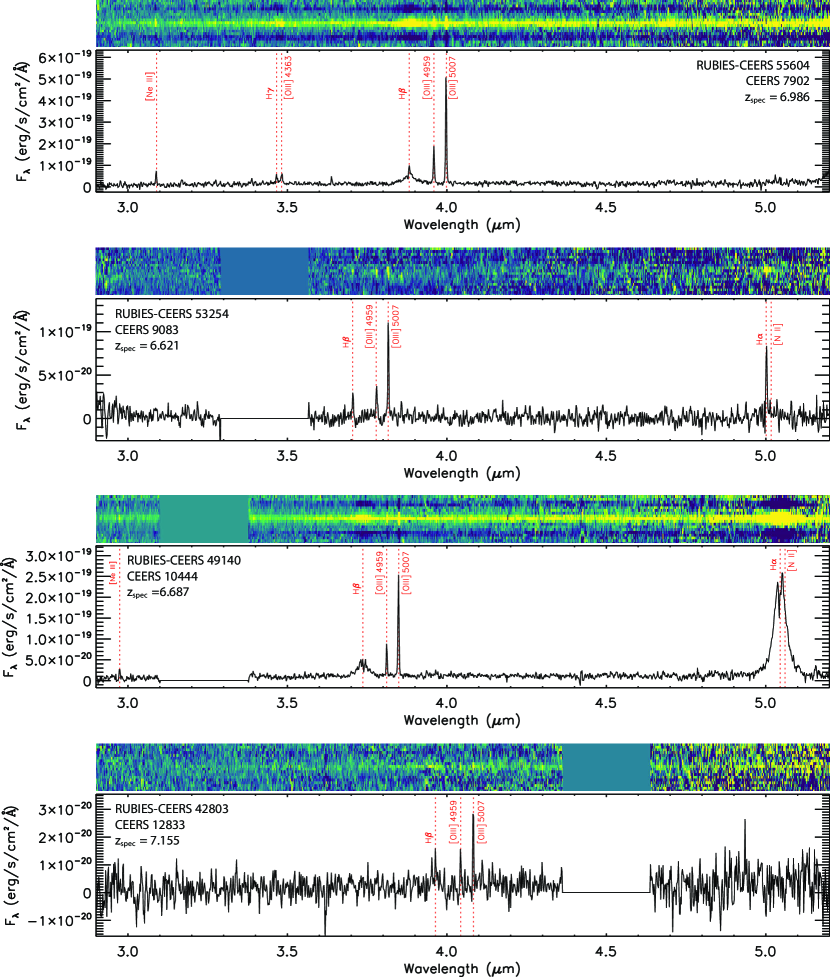
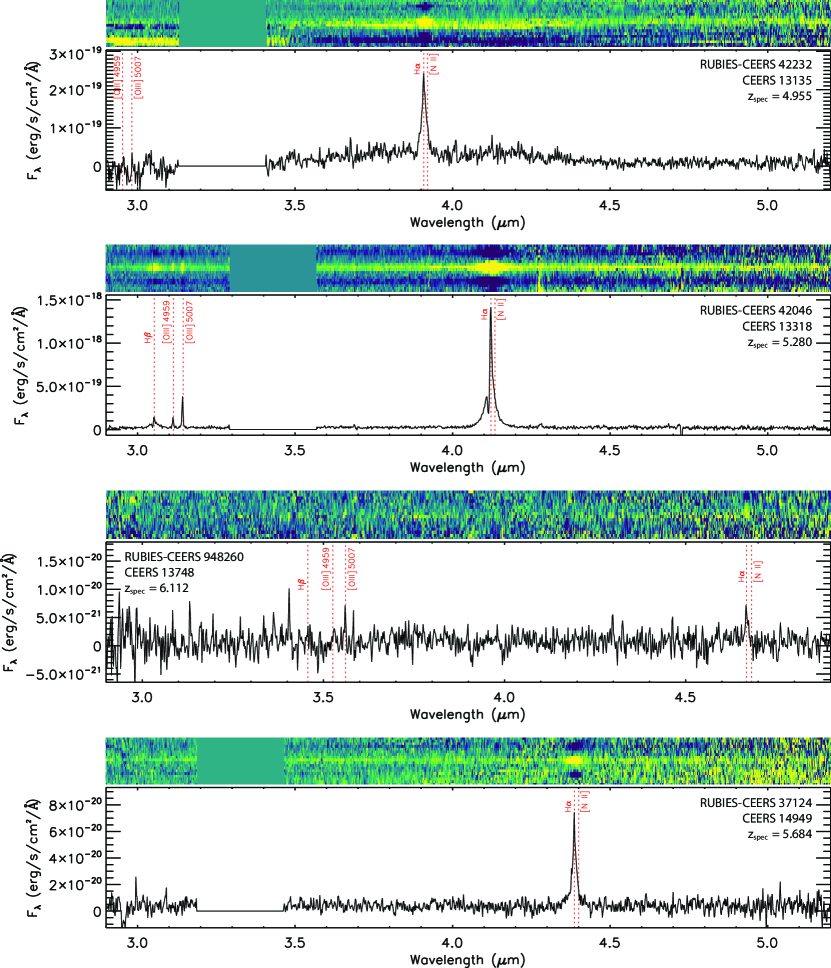
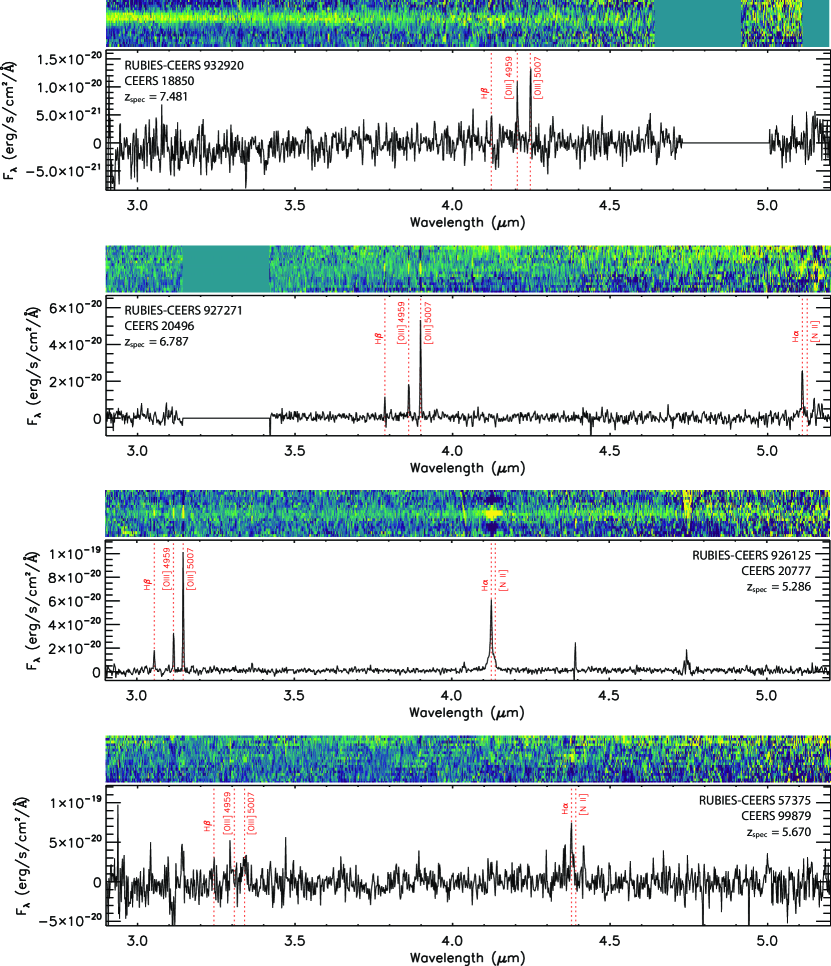
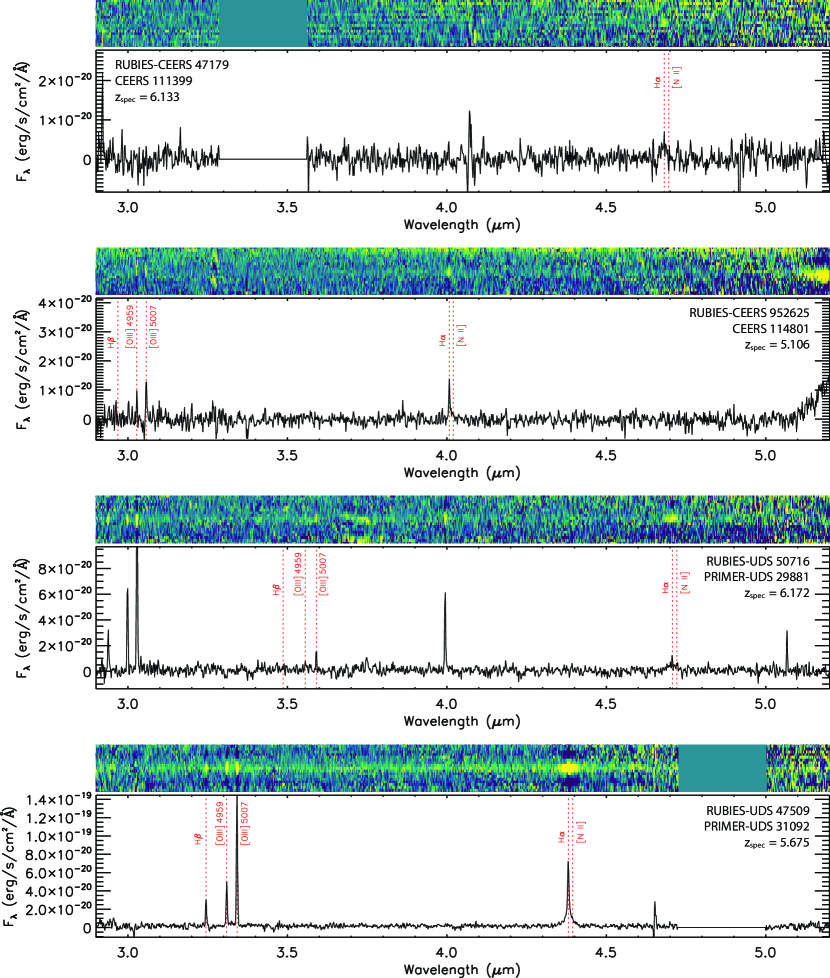
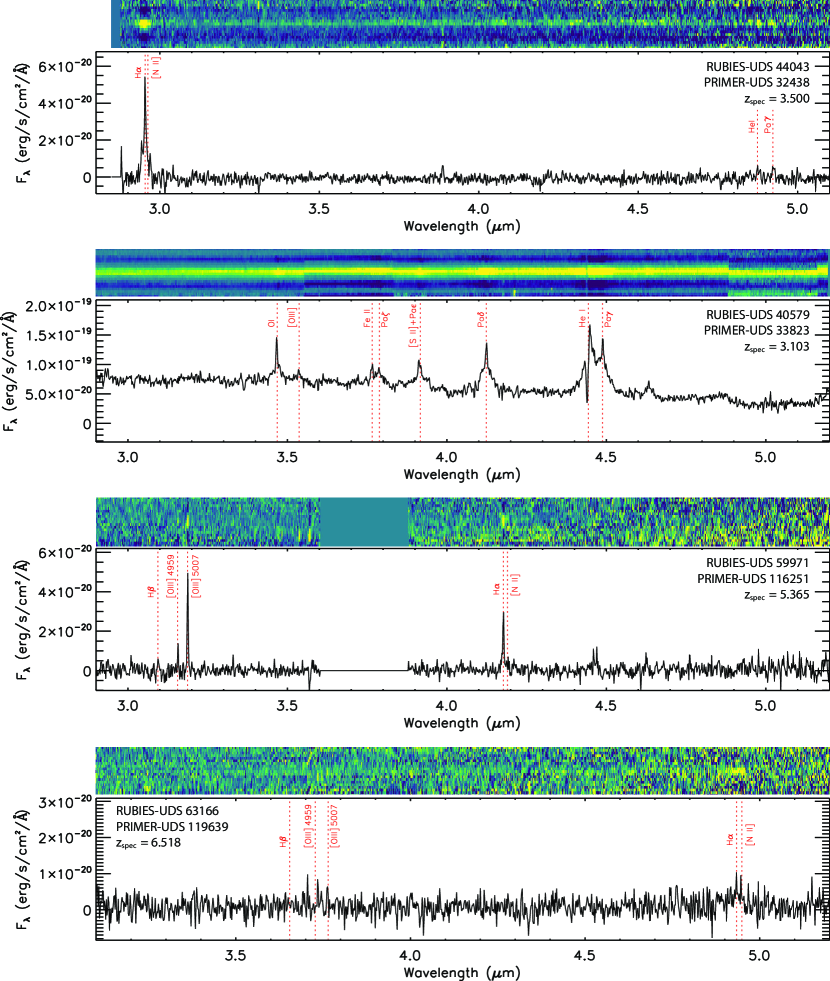
The G395M/F290LP spectra of the sources that show a broad emission feature, in regions near the broad component, is shown in Figures 15 and 16, along with our best-fit two component (narrow plus broad) emission line model for each line. For these fits, we employ a Levenberg-Marquardt least-squares method described in Kocevski et al. (2023), where each line is fit with two Gaussians: one narrow with width km s-1 and one broad with width km s-1. The line centers, widths, and fluxes are all free parameters. The broad-line widths we measure are listed in Table 5 and range from to 5400 km s-1. The continuum slopes and magnitude distribution of these sources can be seen in Figures 3 and 4.
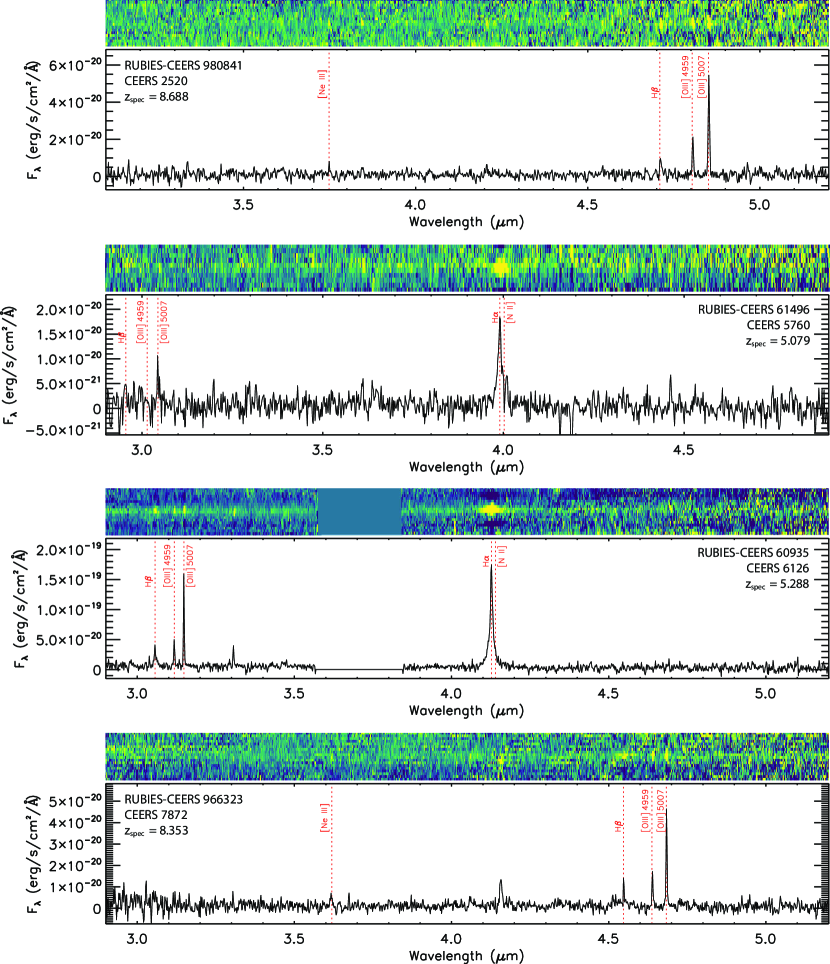
Of the remaining seven sources observed, we find the emission lines of four are best-fit using a narrow component only (CEERS 2520, 7872, 9083, and 12833), while three sources (CEERS 18850, 99879, and 111399) show only weak H or H emission in their G395M/F290LP spectra and it remains inconclusive whether they require a broad component. These three sources are the faintest of the 24 observed, all with F444W. The full G395M/F290LP spectra of the 24 LRDs observed by the RUBIES survey are shown in Appendix A.
In summary, 15 LRDs out of a sample of 24 observed show evidence of a broad emission component, or 63%. This fraction increases to 71% (17/24) if we include the two sources with broad lines detected at a lower SNR. If we only consider sources with F444W, where we could effectively measure line widths, the broad-line detection fraction is 71% (15/21) excluding the low SNR sources and 81% (17/21) with them included.
Interestingly, three sources in our sample show evidence of blue-shifted absorption in their Balmer lines (CEERS 7902, 10444, and 13318). Adding an absorption component to our fits, we find that these lines have a FWHM in the range 250-500 km s-1 and are blue-shifted by 200-300 km s-1 relative to the line center of our best-fit narrow component. Blue-shifted He i m absorption was also noted in PRIMER-UDS 33823 by Wang et al. (2024), meaning that 27% (4/15) of our sample of broad-line LRDs show such features. Matthee et al. (2023) previously reported the presence of H absorption lines in two LRDs with broad-line detections, raising the possibility that such features may be common in the spectra of these faint, red AGN.
While broad absorption line quasars (BAL QSOs) often show absorption in their rest-frame UV lines, only a handful of quasars are known to exhibit Balmer absorption; see Schulze et al. (2018) and references therein. The creation of these lines requires neutral hydrogen gas at such high column densities ( cm-2) that Ly trapping becomes important in replenishing electrons in the shell (Hall, 2007). This suggests the absorber is located close to the central engine and is exposed to the quasar’s ionizing continuum. Previous studies place the location beyond the broad-line region but within the dust sublimation radius (Hall, 2007; Zhang et al., 2015; Schulze et al., 2018). Therefore the detection of blueshifted Balmer absorption in these LRDs suggests the presence of high density, low ionization gas that is outflowing from near the central engine.
Finally, we conclude this section by estimating BH masses for the 15 LRDs with secure broad-line detections. For this calculation, we follow Kocevski et al. (2023) and make use of the scaling relationships presented in Greene & Ho (2005). For sources with H detections, we use the relationship:
| (5) |
For sources with only H detections (CEERS 7902), we use the corresponding relationship that employs the H line width and luminosity:
| (6) |
In Table 5, we list our measured BH masses, both with and without dust corrections to the observed line luminosities. For this correction we use the values derived from our best-fit galaxy plus AGN SED modeling described in §3.3. For PRIMER-UDS 33823, we make use of the P line width and luminosity, assuming a P-H line ratio of 46.7, consistent with Case B recombination. We find that our derived BH mass for this source () is in good agreement with the range of BH masses ( ) presented in Wang et al. (2024) based on their analysis of multiple broad lines.
4.6 The LRD Sample
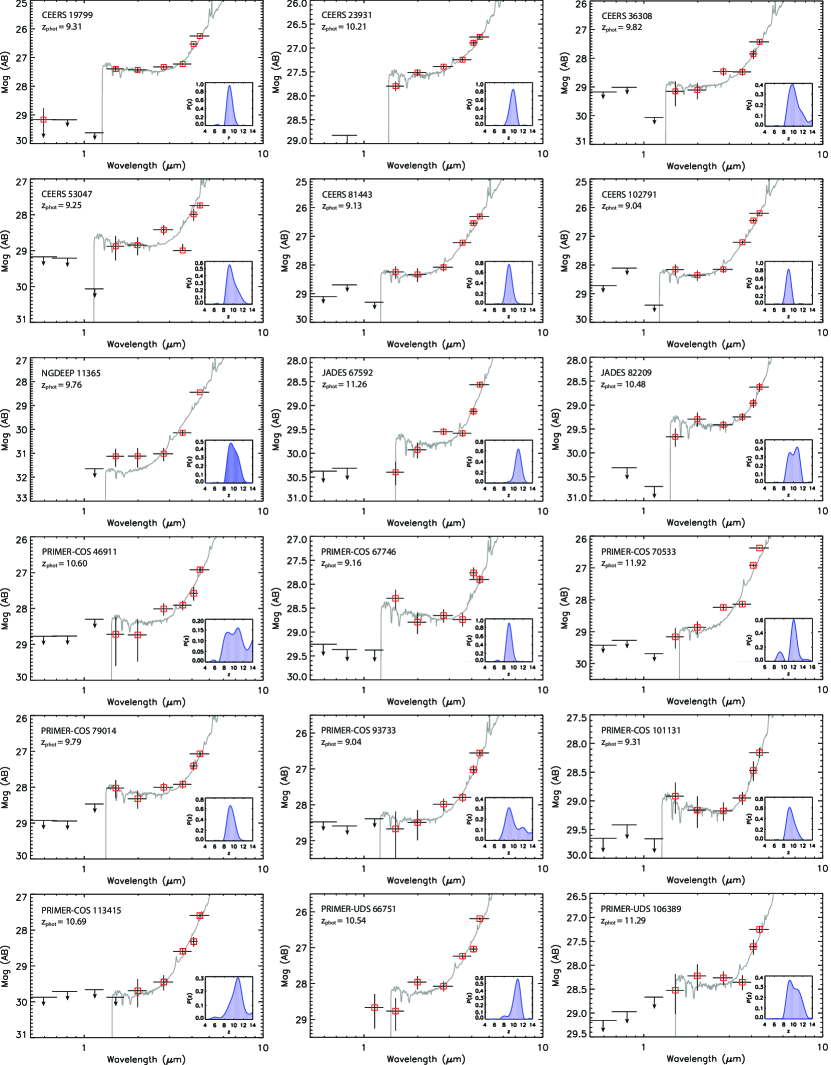
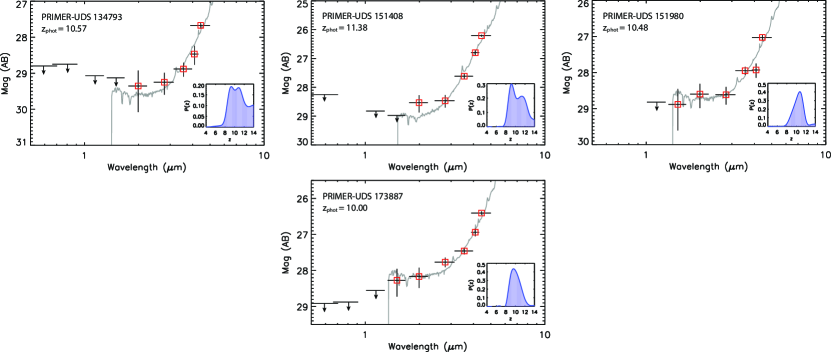
In this section, we highlight the highest redshift () LRDs in our sample. Despite the rapid decline in the redshift distribution above , we detect 22 LRD at . The SEDs of these sources and their photometric redshift distributions are shown in Figures 17.
Four of our LRDs at (CEERS 23931, 36308, 53047, and 80072) were previously identified as high-redshift sources in Finkelstein et al. (2023, their IDs 98518, 92463, 88331, and 1398). Four sources at (CEERS 2520, 7872, 80438, and 81443) were previously identified as potential high-redshift, massive galaxies in Labbé et al. (2023, their IDs 16624, 14924, 21834, and 35300).
The highest redshift source in our sample is PRIMER-COS 70533, which has a photometric redshift of 11.92. However, this source also has a secondary photometric redshift solution at . The other three sources with are JADES 67592 and PRIMER-UDS 106389 and 151408, the latter two of which have relatively broad distributions. If the redshifts and AGN nature of these sources is confirmed, they would be among the most distant AGN ever discovered, with redshift much higher than the highest-redshift AGN identified in the pre-JWST, which was found at (Wang et al., 2021). However, we note that because of the reduced number of filters available for our continuum fitting in the rest-optical at these extreme redshifts, these sources may suffer a greater likelihood of contamination from strong emission lines, which further motivates the need for future deep spectroscopic follow-up of these targets.
5 Discussion
One of our primary findings is that the red compact objects that have come to be known as little red dots appear in large numbers at . Our selection method is designed to pick up lower redshift LRDs that might be missed using a fixed color selection; however, we find few analogs of these sources at . This likely explains why this population was not previously identified using imaging from HST.
The redshift distribution that we observe for our sample of LRDs may provide insight into the nature of their obscuration and the mechanisms fueling their nuclear activity. The fact that they are largely limited to could be a natural consequence of inside-out growth (e.g., Carrasco et al., 2010; van Dokkum et al., 2014), where early galaxies experience more compact, centrally concentrated star formation. The dissipative gas collapse that fuels such activity (e.g., Dekel & Burkert, 2014; Tacchella et al., 2018) may also be responsible for triggering concurrent growth of the central SMBH (Kocevski et al., 2017; Aird et al., 2022). The rapid accumulation of metals in the proto-bulge then provides the reddening we observe. At later epochs, infalling gas will have higher angular momentum, which results in star formation moving to larger scales. As less dust is deposited near the AGN, we observe fewer heavily-reddened LRDs at lower redshifts.
In this scenario, the nuclear emission from the central AGN would be reddened by host obscuration as opposed to nuclear obscuration. Previous work on red quasars at lower redshifts () have found that they are indeed predominantly obscured by dust in their host galaxies, as opposed to, for example, a moderate viewing angle that passes through a dust torus (Kim & Im, 2018). In addition, Gilli et al. (2022) have used deep ALMA observations to show that the ISM column density toward the nucleus of galaxies at can reach Compton-thick levels of obscuration (Gilli et al., 2022). They conclude that 80-90% of SMBH growth at these early epochs is likely hidden from view due to the ISM of their host galaxies.
Obscuration from a compact host galaxy would be consistent with the reported high fraction of LRDs that are not detected using MIRI imaging out to (Williams et al., 2023; Pérez-González et al., 2024a) since galactic-scale dust would produce reprocessed emission that falls beyond the MIRI wavelength coverage. That said, the mid-infrared emission from the X-ray detected LRDs we have identified at is well explained using a clumpy torus model, which suggests a fraction of these sources may indeed be obscured by a dusty torus. It is likely that different scales of obscuration exist in these systems, as has been previously inferred from samples of infrared-selected red quasars (e.g., Yan et al., 2019). Better constraints on the fraction of LRDs that exhibit hot dust emission may help elucidate the scale of the obscuration in these systems and the prevalence of nuclear-scale dust. We plan to examine the mid-infrared properties of our sample in a forthcoming paper (Leung et al., in prep).
Another source of obscuration in these systems can be inferred from the presence of Balmer absorption lines in the spectra of several LRDs. These absorption features may help explain one of the more perplexing properties of LRDs: their lack of X-ray emission. While we have presented two X-ray bright LRDs, the vast majority of them (including all with broad-line detections) remain undetected even in the deepest Chandra observations. The fraction of LRDs that show Balmer absorption features provides information on the fraction of sight-lines to the central engine that are obscured by high-density, neutral hydrogen clouds, i.e. the covering factor. The higher fraction that we find relative to that observed in BAL QSOs, for example, suggests an increase in the covering factor among these fainter AGN. At the gas densities required to produce these Balmer absorption lines, soft x-ray photons will ionize neutral hydrogen and create Ly photons via recombination, which subsequently get trapped. Since most BAL QSOs are X-ray weak (Brandt et al., 2000; Gallagher et al., 2001), we may surmise that the presence of this high-density, absorbing material may also help attenuate the X-ray emission from LRDs. Coupled with potentially high column densities in the ISM of their host galaxies (e.g., Gilli et al., 2022), this may help explain the low fraction of LRDs that are X-ray detected.
While it remains to be determined what fraction of our full sample are reddened AGN, we find that 17 of 21 newly-observed LRDs where we could effectively measure emission line widths in the G395M/F290LP spectra show evidence for broad-line emission, which is consistent with the high fraction (80%) reported in Greene et al. (2023) when brown dwarf contaminants are excluded. Such a high AGN fraction would have important ramifications for the bright galaxy samples being reported at high redshift. For example, 11/13 of the massive galaxy candidates originally presented in Labbé et al. (2023) are identified as LRDs using our selection. If the rest-optical emission of these sources is dominated by AGN emission, as seen in other LRDs, then this may help explain the anomalously high stellar masses reported for these sources.
The discovery of a new population of AGNs at high redshift naturally begs the question of whether this population could significantly contribute to the reionization photon budget. While the declining abundance of UV-bright quasars implies that such objects are not contributors at z ¿ 6 (e.g., Hopkins et al., 2007), the uncertain abundance of UV-faint AGN leaves open the door for a modest contribution by such sources (e.g. Giallongo et al., 2015; Finkelstein et al., 2019). While the high bolometric luminosity inferred for LRDs ( erg/s; e.g., Labbe et al., 2023; Kokorev et al., 2024) implies the AGNs may be producing large quantities of ionizing photons, the high dust reddening measured in these sources (; Barro et al., 2023; Labbe et al., 2023) strongly limits the escape of ionizing photons. This is evidenced by the weak UV emission from these galaxies. While it remains unclear whether the UV emission is dominated by unobscured stellar light or scatted AGN light, the abundance of LRDs is lower than continuum-selected star-forming galaxies (see Figure 8). Thus even if the escaping UV light is AGN-dominated, it is insignificant compared to the known star-forming galaxy population at these redshifts.
6 Conclusions
We present the largest sample of little red dots compiled to date using JWST data from the CEERS, PRIMER, JADES, UNCOVER, and NGDEEP surveys. Our sample contains 341 sources spanning the redshift range in a total area covering 587.8 arcmin2. These sources are selected to have red colors in the rest-frame optical and blue colors in the rest-frame UV, coupled with a compact morphology. While previous studies used color indices measured in a single combination of bands (i.e., F277-F444W) to identify LRDs, we perform our search by fitting the UV and optical continuum slope of sources using multiple bands blueward and redward of the Balmer break. The bands used for these fits shift as a function of redshift to ensure the same rest-frame emission is sampled for each source. This allows us to identify LRDs over a wider redshift range than a fixed color selection and is less susceptible to contamination from galaxies with strong breaks that otherwise lack a rising red continuum.
Using our sample, we find:
-
•
LRDs emerge in large numbers at and then experience a rapid decline in their number density at . This redshift distribution may reflect that the fueling and obscuration of these sources is tied to the dissipative gas collapse that drives the inside-out growth of galaxies during this epoch. In this scenario, the decline in the number of LRDs at later times would be due to star formation moving to larger scales, resulting in less dust being deposited near the AGN and a possible drop in their duty cycle.
-
•
LRDs are 2-3 dex more numerous at than would be expected based on extrapolations of the quasar luminosity function measured from the ground. However, the number density of LRDs at is only 0.6 dex higher than that of lower-luminosity X-ray AGN identified at the same redshift. This offset increases to a full dex at relative to color-selected AGN. At this redshift, LRDs constitute of the overall galaxy population at .
-
•
We identify the first LRDs detected at X-ray wavelengths. An X-ray spectral analysis of these two sources confirms that they are moderately obscured, with equivalent neutral Hydrogen column densities of and . An analysis of their SEDs and morphologies suggests the rest-frame optical emission from both sources is dominated by light from the reddened AGN, while their rest-frame UV emission originates from their host galaxies.
-
•
We present follow-up spectroscopy of 17 LRDs in our sample that show broad emission features with line widths of to 5400 km s-1, consistent with AGN activity. We measure their black hole masses to be in the range M⊙, which is 1-2 dex below that of bright quasars at similar redshifts.
-
•
The confirmed AGN fraction of our sample is 71% among sources with F444W, where we could effectively measure emission line widths in the G395M/F290LP spectra. This fraction increases to 81% if we include sources whose broad emission lines are detected with a .
-
•
A relatively high fraction (24%) of LRDs in our sample with broad emission lines also show narrow, blue-shifted Balmer or He i absorption features in their spectra, suggesting a prevalence of outflows in these sources. We propose that a high covering factor of high-density, neutral hydrogen gas, coupled with potentially high column densities in the ISM of their host galaxies, may help explain the relatively weak X-ray emission from LRDs.
While much remains to be determined about the nature of LRDs, the prevalence of broad emission lines in their spectra suggests this population is shedding light on a phase of obscured black hole growth in the early universe that was largely undetected prior to the JWST era. Forthcoming mid-infrared imaging and spectroscopic follow-up of these sources will soon better constrain the number density of these faint AGN and shed light on the nature of the obscuring medium in these systems.
Appendix A NIRSpec Spectra of Newly Observed LRDs
In this appendix, we present the full G395M/F290LP spectra of the 24 LRDs from our sample in the EGS and UDS fields that were recently observed by the RUBIES program. These spectra are shown in Figures 18, 19, 20, 21, 22, and 23.
Appendix B Acknowledgments
We thank the RUBIES team for their work in designing and preparing the NIRSpec observations used in this study. This work is supported by NASA grants JWST-ERS-01345 and JWST-AR-02446 and based on observations made with the NASA/ESA/CSA James Webb Space Telescope. The data were obtained from the Mikulski Archive for Space Telescopes at the Space Telescope Science Institute, which is operated by the Association of Universities for Research in Astronomy, Inc., under NASA contract NAS 5-03127 for JWST.
References
- Aird et al. (2015) Aird, J., Coil, A. L., Georgakakis, A., et al. 2015, MNRAS, 451, 1892, doi: 10.1093/mnras/stv1062
- Aird et al. (2022) Aird, J., Coil, A. L., & Kocevski, D. D. 2022, MNRAS, 515, 4860, doi: 10.1093/mnras/stac2103
- Akins et al. (2023) Akins, H. B., Casey, C. M., Allen, N., et al. 2023, ApJ, 956, 61, doi: 10.3847/1538-4357/acef21
- Bagley et al. (2022) Bagley, M. B., Finkelstein, S. L., Koekemoer, A. M., et al. 2022, arXiv e-prints, arXiv:2211.02495. https://arxiv.org/abs/2211.02495
- Bagley et al. (2023) Bagley, M. B., Pirzkal, N., Finkelstein, S. L., et al. 2023, arXiv e-prints, arXiv:2302.05466, doi: 10.48550/arXiv.2302.05466
- Barro et al. (2023) Barro, G., Perez-Gonzalez, P. G., Kocevski, D. D., et al. 2023, arXiv e-prints, arXiv:2305.14418, doi: 10.48550/arXiv.2305.14418
- Bertin & Arnouts (1996) Bertin, E., & Arnouts, S. 1996, A&AS, 117, 393, doi: 10.1051/aas:1996164
- Bezanson et al. (2022) Bezanson, R., Labbe, I., Whitaker, K. E., et al. 2022, arXiv e-prints, arXiv:2212.04026, doi: 10.48550/arXiv.2212.04026
- Boquien et al. (2019) Boquien, M., Burgarella, D., Roehlly, Y., et al. 2019, A&A, 622, A103, doi: 10.1051/0004-6361/201834156
- Bowler et al. (2020) Bowler, R. A. A., Jarvis, M. J., Dunlop, J. S., et al. 2020, MNRAS, 493, 2059, doi: 10.1093/mnras/staa313
- Brammer et al. (2008) Brammer, G. B., van Dokkum, P. G., & Coppi, P. 2008, ApJ, 686, 1503, doi: 10.1086/591786
- Brammer et al. (2012) Brammer, G. B., van Dokkum, P. G., Franx, M., et al. 2012, ApJS, 200, 13, doi: 10.1088/0067-0049/200/2/13
- Brandt et al. (2000) Brandt, W. N., Laor, A., & Wills, B. J. 2000, ApJ, 528, 637, doi: 10.1086/308207
- Bruzual & Charlot (2003) Bruzual, G., & Charlot, S. 2003, MNRAS, 344, 1000, doi: 10.1046/j.1365-8711.2003.06897.x
- Buchner et al. (2019) Buchner, J., Brightman, M., Nandra, K., Nikutta, R., & Bauer, F. E. 2019, A&A, 629, A16, doi: 10.1051/0004-6361/201834771
- Buchner et al. (2014) Buchner, J., Georgakakis, A., Nandra, K., et al. 2014, A&A, 564, A125, doi: 10.1051/0004-6361/201322971
- Calzetti et al. (2000) Calzetti, D., Armus, L., Bohlin, R. C., et al. 2000, ApJ, 533, 682, doi: 10.1086/308692
- Carrasco et al. (2010) Carrasco, E. R., Conselice, C. J., & Trujillo, I. 2010, MNRAS, 405, 2253, doi: 10.1111/j.1365-2966.2010.16645.x
- Casertano et al. (2000) Casertano, S., de Mello, D., Dickinson, M., et al. 2000, AJ, 120, 2747, doi: 10.1086/316851
- Chabrier (2003) Chabrier, G. 2003, Publications of the Astronomical Society of the Pacific, 115, 763, doi: 10.1086/376392
- Civano et al. (2011) Civano, F., Brusa, M., Comastri, A., et al. 2011, ApJ, 741, 91, doi: 10.1088/0004-637X/741/2/91
- Conroy et al. (2010) Conroy, C., White, M., & Gunn, J. E. 2010, ApJ, 708, 58, doi: 10.1088/0004-637X/708/1/58
- Dayal et al. (2020) Dayal, P., Volonteri, M., Choudhury, T. R., et al. 2020, MNRAS, 495, 3065, doi: 10.1093/mnras/staa1138
- Dekel & Burkert (2014) Dekel, A., & Burkert, A. 2014, MNRAS, 438, 1870, doi: 10.1093/mnras/stt2331
- Dunlop et al. (2021) Dunlop, J. S., Abraham, R. G., Ashby, M. L. N., et al. 2021, PRIMER: Public Release IMaging for Extragalactic Research, JWST Proposal. Cycle 1, ID. #1837
- Duras et al. (2020) Duras, F., Bongiorno, A., Ricci, F., et al. 2020, A&A, 636, A73, doi: 10.1051/0004-6361/201936817
- Elvis et al. (2009) Elvis, M., Civano, F., Vignali, C., et al. 2009, ApJS, 184, 158, doi: 10.1088/0067-0049/184/1/158
- Finkelstein et al. (2019) Finkelstein, S. L., D’Aloisio, A., Paardekooper, J.-P., et al. 2019, ApJ, 879, 36, doi: 10.3847/1538-4357/ab1ea8
- Finkelstein et al. (2022) Finkelstein, S. L., Bagley, M. B., Arrabal Haro, P., et al. 2022, arXiv e-prints, arXiv:2207.12474. https://arxiv.org/abs/2207.12474
- Finkelstein et al. (2023) Finkelstein, S. L., Leung, G. C. K., Bagley, M. B., et al. 2023, arXiv e-prints, arXiv:2311.04279, doi: 10.48550/arXiv.2311.04279
- Fruchter & Hook (2002) Fruchter, A. S., & Hook, R. N. 2002, PASP, 114, 144, doi: 10.1086/338393
- Fumagalli et al. (2012) Fumagalli, M., Patel, S. G., Franx, M., et al. 2012, ApJ, 757, L22, doi: 10.1088/2041-8205/757/2/L22
- Gaia Collaboration et al. (2016) Gaia Collaboration, Prusti, T., de Bruijne, J. H. J., et al. 2016, A&A, 595, A1, doi: 10.1051/0004-6361/201629272
- Gallagher et al. (2001) Gallagher, S. C., Brandt, W. N., Laor, A., et al. 2001, ApJ, 546, 795, doi: 10.1086/318294
- Gehrels (1986) Gehrels, N. 1986, ApJ, 303, 336, doi: 10.1086/164079
- Giacconi et al. (2002) Giacconi, R., Zirm, A., Wang, J., et al. 2002, ApJS, 139, 369, doi: 10.1086/338927
- Giallongo et al. (2015) Giallongo, E., Grazian, A., Fiore, F., et al. 2015, A&A, 578, A83, doi: 10.1051/0004-6361/201425334
- Giallongo et al. (2019) —. 2019, ApJ, 884, 19, doi: 10.3847/1538-4357/ab39e1
- Gilli et al. (2007) Gilli, R., Comastri, A., & Hasinger, G. 2007, A&A, 463, 79, doi: 10.1051/0004-6361:20066334
- Gilli et al. (2022) Gilli, R., Norman, C., Calura, F., et al. 2022, A&A, 666, A17, doi: 10.1051/0004-6361/202243708
- Greene & Ho (2005) Greene, J. E., & Ho, L. C. 2005, ApJ, 630, 122, doi: 10.1086/431897
- Greene et al. (2023) Greene, J. E., Labbe, I., Goulding, A. D., et al. 2023, arXiv e-prints, arXiv:2309.05714, doi: 10.48550/arXiv.2309.05714
- Grogin et al. (2011) Grogin, N. A., Kocevski, D. D., Faber, S. M., et al. 2011, ApJS, 197, 35. https://arxiv.org/abs/1105.3753
- Guo et al. (2013) Guo, Y., Ferguson, H. C., Giavalisco, M., et al. 2013, ApJS, 207, 24, doi: 10.1088/0067-0049/207/2/24
- Habouzit et al. (2022) Habouzit, M., Onoue, M., Bañados, E., et al. 2022, MNRAS, 511, 3751, doi: 10.1093/mnras/stac225
- Hall (2007) Hall, P. B. 2007, AJ, 133, 1271, doi: 10.1086/511272
- Harikane et al. (2023) Harikane, Y., Zhang, Y., Nakajima, K., et al. 2023, ApJ, 959, 39, doi: 10.3847/1538-4357/ad029e
- Hasinger (2008) Hasinger, G. 2008, A&A, 490, 905, doi: 10.1051/0004-6361:200809839
- Hopkins et al. (2007) Hopkins, P. F., Richards, G. T., & Hernquist, L. 2007, ApJ, 654, 731, doi: 10.1086/509629
- Horne (1986) Horne, K. 1986, PASP, 98, 609, doi: 10.1086/131801
- Inayoshi et al. (2022) Inayoshi, K., Nakatani, R., Toyouchi, D., et al. 2022, ApJ, 927, 237, doi: 10.3847/1538-4357/ac4751
- Jiang et al. (2016) Jiang, L., McGreer, I. D., Fan, X., et al. 2016, ApJ, 833, 222, doi: 10.3847/1538-4357/833/2/222
- Jin et al. (2018) Jin, S., Daddi, E., Liu, D., et al. 2018, ApJ, 864, 56, doi: 10.3847/1538-4357/aad4af
- Killi et al. (2023) Killi, M., Watson, D., Brammer, G., et al. 2023, arXiv e-prints, arXiv:2312.03065, doi: 10.48550/arXiv.2312.03065
- Kim & Im (2018) Kim, D., & Im, M. 2018, A&A, 610, A31, doi: 10.1051/0004-6361/201731963
- Kocevski et al. (2017) Kocevski, D. D., Barro, G., Faber, S. M., et al. 2017, ApJ, 846, 112, doi: 10.3847/1538-4357/aa8566
- Kocevski et al. (2018) Kocevski, D. D., Hasinger, G., Brightman, M., et al. 2018, ApJS, 236, 48, doi: 10.3847/1538-4365/aab9b4
- Kocevski et al. (2023) Kocevski, D. D., Onoue, M., Inayoshi, K., et al. 2023, ApJ, 954, L4, doi: 10.3847/2041-8213/ace5a0
- Koekemoer et al. (2011) Koekemoer, A. M., Faber, S. M., Ferguson, H. C., et al. 2011, ApJS, 197, 36. https://arxiv.org/abs/1105.3754
- Kokorev et al. (2024) Kokorev, V., Caputi, K. I., Greene, J. E., et al. 2024, arXiv e-prints, arXiv:2401.09981, doi: 10.48550/arXiv.2401.09981
- Kulkarni et al. (2019) Kulkarni, G., Worseck, G., & Hennawi, J. F. 2019, MNRAS, 488, 1035, doi: 10.1093/mnras/stz1493
- Labbe et al. (2023) Labbe, I., Greene, J. E., Bezanson, R., et al. 2023, arXiv e-prints, arXiv:2306.07320, doi: 10.48550/arXiv.2306.07320
- Labbé et al. (2023) Labbé, I., van Dokkum, P., Nelson, E., et al. 2023, Nature, 616, 266, doi: 10.1038/s41586-023-05786-2
- Laloux et al. (2023) Laloux, B., Georgakakis, A., Andonie, C., et al. 2023, MNRAS, 518, 2546, doi: 10.1093/mnras/stac3255
- Langeroodi & Hjorth (2023) Langeroodi, D., & Hjorth, J. 2023, ApJ, 957, L27, doi: 10.3847/2041-8213/acfeec
- Larson et al. (2022) Larson, R. L., Finkelstein, S. L., Hutchison, T. A., et al. 2022, ApJ, 930, 104, doi: 10.3847/1538-4357/ac5dbd
- Larson et al. (2023) Larson, R. L., Finkelstein, S. L., Kocevski, D. D., et al. 2023, arXiv e-prints, arXiv:2303.08918, doi: 10.48550/arXiv.2303.08918
- Li et al. (2023) Li, W., Inayoshi, K., Onoue, M., et al. 2023, arXiv e-prints, arXiv:2306.06172, doi: 10.48550/arXiv.2306.06172
- Luo et al. (2017) Luo, B., Brandt, W. N., Xue, Y. Q., et al. 2017, ApJS, 228, 2, doi: 10.3847/1538-4365/228/1/2
- Maiolino et al. (2001) Maiolino, R., Marconi, A., Salvati, M., et al. 2001, A&A, 365, 28, doi: 10.1051/0004-6361:20000177
- Maiolino et al. (2023) Maiolino, R., Scholtz, J., Curtis-Lake, E., et al. 2023, arXiv e-prints, arXiv:2308.01230, doi: 10.48550/arXiv.2308.01230
- Maraston et al. (2010) Maraston, C., Pforr, J., Renzini, A., et al. 2010, MNRAS, 407, 830, doi: 10.1111/j.1365-2966.2010.16973.x
- Matsuoka et al. (2022) Matsuoka, Y., Iwasawa, K., Onoue, M., et al. 2022, ApJS, 259, 18, doi: 10.3847/1538-4365/ac3d31
- Matsuoka et al. (2023) Matsuoka, Y., Onoue, M., Iwasawa, K., et al. 2023, ApJ, 949, L42, doi: 10.3847/2041-8213/acd69f
- Matthee et al. (2023) Matthee, J., Naidu, R. P., Brammer, G., et al. 2023, arXiv e-prints, arXiv:2306.05448, doi: 10.48550/arXiv.2306.05448
- Mazzucchelli et al. (2017) Mazzucchelli, C., Bañados, E., Venemans, B. P., et al. 2017, ApJ, 849, 91, doi: 10.3847/1538-4357/aa918510.48550/arXiv.1710.01251
- Meisner et al. (2021) Meisner, A. M., Schneider, A. C., Burgasser, A. J., et al. 2021, ApJ, 915, 120, doi: 10.3847/1538-4357/ac013c
- Merloni et al. (2014) Merloni, A., Bongiorno, A., Brusa, M., et al. 2014, MNRAS, 437, 3550, doi: 10.1093/mnras/stt2149
- Momcheva et al. (2016) Momcheva, I. G., Brammer, G. B., van Dokkum, P. G., et al. 2016, ApJS, 225, 27, doi: 10.3847/0067-0049/225/2/27
- Nandra et al. (2015) Nandra, K., Laird, E. S., Aird, J. A., et al. 2015, ApJS, 220, 10, doi: 10.1088/0067-0049/220/1/10
- Ni et al. (2020) Ni, Y., Di Matteo, T., Gilli, R., et al. 2020, MNRAS, 495, 2135, doi: 10.1093/mnras/staa1313
- Niida et al. (2020) Niida, M., Nagao, T., Ikeda, H., et al. 2020, ApJ, 904, 89, doi: 10.3847/1538-4357/abbe11
- Noboriguchi et al. (2019) Noboriguchi, A., Nagao, T., Toba, Y., et al. 2019, ApJ, 876, 132, doi: 10.3847/1538-4357/ab1754
- Onoue et al. (2023) Onoue, M., Inayoshi, K., Ding, X., et al. 2023, ApJ, 942, L17, doi: 10.3847/2041-8213/aca9d3
- Pacucci & Loeb (2022) Pacucci, F., & Loeb, A. 2022, MNRAS, 509, 1885, doi: 10.1093/mnras/stab3071
- Pacucci et al. (2023) Pacucci, F., Nguyen, B., Carniani, S., Maiolino, R., & Fan, X. 2023, ApJ, 957, L3, doi: 10.3847/2041-8213/ad0158
- Parsa et al. (2018) Parsa, S., Dunlop, J. S., & McLure, R. J. 2018, MNRAS, 474, 2904, doi: 10.1093/mnras/stx2887
- Peca et al. (2023) Peca, A., Cappelluti, N., Urry, C. M., et al. 2023, ApJ, 943, 162, doi: 10.3847/1538-4357/acac28
- Peng et al. (2002) Peng, C. Y., Ho, L. C., Impey, C. D., & Rix, H.-W. 2002, AJ, 124, 266, doi: 10.1086/340952
- Pérez-González et al. (2024a) Pérez-González, P. G., Barro, G., Rieke, G. H., et al. 2024a, arXiv e-prints, arXiv:2401.08782, doi: 10.48550/arXiv.2401.08782
- Pérez-González et al. (2024b) —. 2024b, arXiv e-prints, arXiv:2401.08782, doi: 10.48550/arXiv.2401.08782
- Savage & Mathis (1979) Savage, B. D., & Mathis, J. S. 1979, ARA&A, 17, 73, doi: 10.1146/annurev.aa.17.090179.000445
- Schmidt (1968) Schmidt, M. 1968, ApJ, 151, 393, doi: 10.1086/149446
- Scholtz et al. (2023) Scholtz, J., Maiolino, R., D’Eugenio, F., et al. 2023, arXiv e-prints, arXiv:2311.18731, doi: 10.48550/arXiv.2311.18731
- Schulze et al. (2018) Schulze, A., Misawa, T., Zuo, W., & Wu, X.-B. 2018, ApJ, 853, 167, doi: 10.3847/1538-4357/aaa7f0
- Stalevski et al. (2012) Stalevski, M., Fritz, J., Baes, M., Nakos, T., & Popović, L. Č. 2012, MNRAS, 420, 2756, doi: 10.1111/j.1365-2966.2011.19775.x
- Stalevski et al. (2016) Stalevski, M., Ricci, C., Ueda, Y., et al. 2016, MNRAS, 458, 2288, doi: 10.1093/mnras/stw444
- Tacchella et al. (2018) Tacchella, S., Carollo, C. M., Förster Schreiber, N. M., et al. 2018, ApJ, 859, 56, doi: 10.3847/1538-4357/aabf8b
- Ueda et al. (2014) Ueda, Y., Akiyama, M., Hasinger, G., Miyaji, T., & Watson, M. G. 2014, ApJ, 786, 104, doi: 10.1088/0004-637X/786/2/104
- van Dokkum et al. (2014) van Dokkum, P. G., Bezanson, R., van der Wel, A., et al. 2014, ApJ, 791, 45, doi: 10.1088/0004-637X/791/1/45
- Vanden Berk et al. (2001) Vanden Berk, D. E., Richards, G. T., Bauer, A., et al. 2001, AJ, 122, 549, doi: 10.1086/321167
- Villa-Vélez et al. (2021) Villa-Vélez, J. A., Buat, V., Theulé, P., Boquien, M., & Burgarella, D. 2021, A&A, 654, A153, doi: 10.1051/0004-6361/202140890
- Vito et al. (2018) Vito, F., Brandt, W. N., Yang, G., et al. 2018, MNRAS, 473, 2378, doi: 10.1093/mnras/stx2486
- Wang et al. (2024) Wang, B., de Graaff, A., Davies, R. L., et al. 2024, arXiv e-prints, arXiv:2403.02304, doi: 10.48550/arXiv.2403.02304
- Wang et al. (2021) Wang, F., Yang, J., Fan, X., et al. 2021, ApJ, 907, L1, doi: 10.3847/2041-8213/abd8c6
- Whitaker et al. (2014) Whitaker, K. E., Franx, M., Leja, J., et al. 2014, ApJ, 795, 104, doi: 10.1088/0004-637X/795/2/104
- Williams et al. (2023) Williams, C. C., Alberts, S., Ji, Z., et al. 2023, arXiv e-prints, arXiv:2311.07483, doi: 10.48550/arXiv.2311.07483
- Willott et al. (2010) Willott, C. J., Delorme, P., Reylé, C., et al. 2010, AJ, 139, 906, doi: 10.1088/0004-6256/139/3/906
- Yan et al. (2019) Yan, W., Hickox, R. C., Hainline, K. N., et al. 2019, ApJ, 870, 33, doi: 10.3847/1538-4357/aaeed4
- Yang et al. (2020) Yang, G., Boquien, M., Buat, V., et al. 2020, MNRAS, 491, 740, doi: 10.1093/mnras/stz3001
- Yang et al. (2022) Yang, G., Boquien, M., Brandt, W. N., et al. 2022, ApJ, 927, 192, doi: 10.3847/1538-4357/ac4971
- Yang et al. (2023a) Yang, G., Caputi, K. I., Papovich, C., et al. 2023a, ApJ, 950, L5, doi: 10.3847/2041-8213/acd639
- Yang et al. (2023b) Yang, J., Fan, X., Gupta, A., et al. 2023b, arXiv e-prints, arXiv:2302.01777, doi: 10.48550/arXiv.2302.01777
- Yung et al. (2021) Yung, L. Y. A., Somerville, R. S., Finkelstein, S. L., et al. 2021, MNRAS, 508, 2706, doi: 10.1093/mnras/stab2761
- Zavala et al. (2023) Zavala, J. A., Buat, V., Casey, C. M., et al. 2023, ApJ, 943, L9, doi: 10.3847/2041-8213/acacfe
- Zhang et al. (2015) Zhang, S., Zhou, H., Shi, X., et al. 2015, ApJ, 815, 113, doi: 10.1088/0004-637X/815/2/113