A JWST/NIRSpec First Census of Broad-Line AGNs at :
Detection of 10 Faint AGNs with and Their Host Galaxy Properties
Abstract
We present a first statistical sample of faint type-1 AGNs at identified by JWST/NIRSpec deep spectroscopy. Among the 185 galaxies at confirmed with NIRSpec, our systematic search for broad-line emission reveals 10 type-1 AGNs at whose broad component is only seen in the permitted H line and not in the forbidden [Oiii]5007 line that is detected with greater significance than H. The broad H line widths of suggest that the AGNs have low-mass black holes with , remarkably lower than those of low-luminosity quasars previously identified at with ground-based telescopes. JWST and HST high-resolution images reveal that the majority of them show extended morphologies indicating significant contribution to the total lights from their host galaxies, except for three compact objects two of which show red SEDs, probably in a transition phase from faint AGNs to low luminosity quasars. Careful AGN-host decomposition analyses show that their host’s stellar masses are systematically lower than the local relation between the black hole mass and the stellar mass, implying a fast black hole growth consistent with predictions from theoretical simulations. A high fraction of the broad-line AGNs (), higher than , indicates that a number density of such faint AGNs is higher than an extrapolation of the quasar luminosity function, implying a large population of AGNs in the early universe. Such faint AGNs contribute to cosmic reionization, while the total contribution is not large, up to at , because of their faint nature.
1 Introduction
It has been known for over two decades that the mass of supermassive black holes (SMBHs) at are tightly correlated with the bulge properties of their host galaxies, such as velocity dispersion and bulge mass (e.g., Magorrian et al. 1998; Gebhardt et al. 2000; Kormendy & Ho 2013; Reines & Volonteri 2015). This tight correlation indicates the strong connection between the growth of central SMBHs and their host galaxies, known as the galaxy-SMBH coevolution. Although the underlying physical mechanisms are still under debate, theoretical models suggest that feedback of active galactic nuclei (AGNs) connected to galaxy’s merger histories play an important role (e.g., Granato et al. 2004; Di Matteo et al. 2005; Hopkins et al. 2006; Li et al. 2007). Since theoretical models usually make predictions for the time evolution of the systems (e.g., Anglés-Alcázar et al. 2017; Toyouchi et al. 2021; Valentini et al. 2021; Zhu et al. 2022; Habouzit et al. 2022; Trinca et al. 2022; Inayoshi et al. 2022; Hu et al. 2022; Zhang et al. 2023a, b), observations of both SMBHs and their host galaxies over cosmic time are essential to test and/or refine our current understandings of their build-up (e.g., Gallerani et al. 2017; Valiante et al. 2017).
Observations of AGNs at the high-redshift universe are thus crucial to understanding the evolution of the SMBH growth in cosmic history, but previous observations have been limited to bright quasars identified in surveys with ground-based telescopes (e.g., Bañados et al. 2016; Shen et al. 2019, see Inayoshi et al. 2020 for a review) including the most distant quasars at (Bañados et al. 2018; Yang et al. 2020; Wang et al. 2021). Recent surveys using 4-8 m-class telescopes including the Subaru/Hyper Suprime-Cam survey (Aihara et al. 2018) are finding low-luminosity quasars at (e.g., Willott et al. 2010b; Kashikawa et al. 2015; Matsuoka et al. 2016; Onoue et al. 2017; Akiyama et al. 2018; Niida et al. 2020), but these low-luminosity quasars have moderately massive black hole masses with compared to AGNs found in the local universe (e.g., Liu et al. 2019). Although intensive spectroscopic observations targeting high redshift galaxies at have identified high ionization emission lines indicative of AGN activity (e.g., Tilvi et al. 2016; Laporte et al. 2017; Mainali et al. 2018), the physical properties of their central SMBHs are unclear.
The James Webb Space Telescope (JWST) was launched at the end of 2021 and started its operation in early 2022. JWST observations are now beginning to improve our understanding of the connection between high redshift AGNs and their host galaxies, especially in the low-luminosity and low-mass regimes. JWST/NIRCam deep and high-resolution images allow us to detect stellar lights from host galaxies of low-luminosity quasars at (Ding et al. 2022), and to identify the least-massive black hole candidate at (Onoue et al. 2023) and a triply-lensed red-quasar candidate at (Furtak et al. 2022). JWST/NIRSpec deep-spectroscopic observations have confirmed the candidate in Onoue et al. (2023) at by detecting a broad H emission line that indicates a black hole mass of , with an additional finding of a red AGN at (Kocevski et al. 2023). NIRSpec spectroscopy has also identified a supermassive black hole in a quiescent galaxy at (Carnall et al. 2023). NIRSpec IFU observations have revealed broad H and H emission lines in a galaxy at (Übler et al. 2023), which is interpreted as a type 1.8 AGN with a black hole mass of . Very recently, Larson et al. (2023) have reported a broad H emission line in a galaxy at , suggesting a SMBH whose mass is 570 Myrs after the Big Bang (see also Bogdan et al. 2023; Goulding et al. 2023; Greene et al. 2023; Furtak et al. 2023; Fujimoto et al. 2023; Kokorev et al. 2023; Labbe et al. 2023; Maiolino et al. 2023; Matthee et al. 2023 for studies that appeared after our initial submission of this paper).
Motivated by these recent JWST findings of high redshift AGNs, we systematically search for broad-line AGNs at using the JWST/NIRSpec spectroscopic data presented in Nakajima et al. (2023). Our sample of low-luminosity AGNs with low-mass SMBHs allows us to obtain the first statistical view on the physical properties of faint AGNs and their host galaxies at such as black hole masses, Eddington ratios, number densities, host’s stellar mass, and morphologies, crucial to understand the galaxy-SMBH co-evolution in the early universe and implication for cosmic reionization. Moreover, the black hole masses of our low-luminosity AGNs can be directly compared with AGNs at , allowing us to understand the redshift evolution over cosmic time.
This paper is organized as follows. Section 2 presents the JWST and HST observational data sets used in this study. In Section 3 we explain our systematic sample selection and the final AGN sample. We show our main results in Section 4 and discuss the contribution to cosmic reionization and the nature of our AGNs in Section 5. Section 6 summarizes our findings. Throughout this paper, we use the Planck cosmological parameter sets of the TT, TE, EE+lowP+lensing+BAO result (Planck Collaboration et al. 2020): , , , , and . All magnitudes are in the AB system (Oke & Gunn 1983).
2 Observational Dataset
2.1 JWST/NIRSpec Spectra
We use JWST/NIRSpec datasets reduced in Nakajima et al. (2023). Here we briefly describe the observations and the data reduction. Please see Nakajima et al. (2023) for details.
The data sets used in this study were obtained in the Early Release Observations (EROs; Pontoppidan et al. 2022) targeting the SMACS 0723 lensing cluster field (ERO-2736) and the Early Release Science (ERS) observations of GLASS (ERS-1324, PI: T. Treu; Treu et al. 2022) and the Cosmic Evolution Early Release Science (CEERS; ERS-1345, PI: S. Finkelstein; Finkelstein et al. 2022b). The ERO data were taken in the medium resolution () filter-grating pairs F170LP-G235M and F290LP-G395M covering the wavelength ranges of and m, respectively. The total exposure time of the ERO data is 4.86 hours for each filter-grating pair. The GLASS data were taken with high resolution () filter-grating pairs of F100LP-G140H, F170LP-G235H, and F290LP-G395H covering the wavelength ranges of , and m, respectively. The total exposure time of the GLASS data is 4.9 hours for each filter-grating pair. CEERS data were taken with the Prism () that covers and medium-resolution filter-grating pairs of F100LP-G140M, F170LP-G235M, and F290LP-G395M covering the wavelength ranges of , and m, respectively. The total exposure time of the CEERS data is 0.86 hours for each filter-grating pair. These data were reduced in Nakajima et al. (2023) with the JWST pipeline version 1.8.5 with the Calibration Reference Data System (CRDS) context file of jwst_1028.pmap or jwst_1027.pmap with additional processes improving the flux calibration, noise estimate, and the composition. Reduced spectra are corrected for slit loss (see Nakajima et al. 2023 for details). Finally, we obtain NIRSpec spectra of a total of 185 galaxies at .
2.2 JWST/NIRCam and HST/ACS&WFC3 Images
For the GLASS field, we use the JWST/NIRCam and HST/ACS&WFC3 images produced by the Ultradeep NIRSpec and NIRCam ObserVations before the Epoch of Reionization (UNCOVER) team.111https://jwst-uncover.github.io In the GLASS NIRSpec field around the center of the Abell 2744 lensing cluster, the JWST/NIRCam images were taken in the F115W, F150W, F200W, F277W, F356W, and F444W bands in the UNCOVER program (GO-2561, PIs: I. Labbe and R. Bezanson; Bezanson et al. 2022), and the HST/ACS and WCS3 images were taken in the F435W, F606W, F814W, F105W, F125W, F140W, and F160W-bands in the Hubble Frontier Field program (PI: J. Lotz; Lotz et al. 2017) and the Beyond Ultra-deep Frontier Fields And Legacy Observations (BUFFALO) program (PI: C. Steinhardt; Steinhardt et al. 2020).
For the CEERS field, we use the JWST/NIRCam and HST/ACS&WFC3 official images produced by the CEERS team (version 0.5; Bagley et al. 2022).222https://ceers.github.io In the CEERS field, the JWST/NIRCam images were taken in the F115W, F150W, F200W, F277W, F356W, F410M, and F444W bands in the CEERS program, and the HST/ACS and WCS3 images were taken in the F606W, F814W, F105W, F125W, F140W, and F160W-bands in the Cosmic Assembly Near-infrared Deep Extragalactic Legacy Survey (CANDELS; Grogin et al. 2011; Koekemoer et al. 2011, see also Finkelstein et al. 2022a). For part of the CEERS field where the official images are not available (i.e., fields whose data were taken in December 2022), we reduced the NIRCam data in the same manner as Harikane et al. (2023) using the JWST pipeline version 1.8.5 with the CRDS context file of jwst_1027.pmap.
3 Broad-Line AGN Selection
3.1 Emission Line Fitting
From 185 galaxies at in Nakajima et al. (2023), we search for broad-line AGNs that show broad permitted lines such as H and H. We fit rest-frame optical emission lines such as H, [Oiii]4959,5007, H, and [Nii]6548,6584. We use the line spread functions made from spectra of a planetary nebula in Isobe et al. (2023) for spectra taken with medium and high-resolution gratings. For spectra taken with the Prism, we use the FWHM measured in Isobe et al. (2023) from the planetary nebula’s spectra assuming a Gaussian profile because Prism’s line spread function made from the spectra is severely contaminated by nearby lines due to its low resolution.
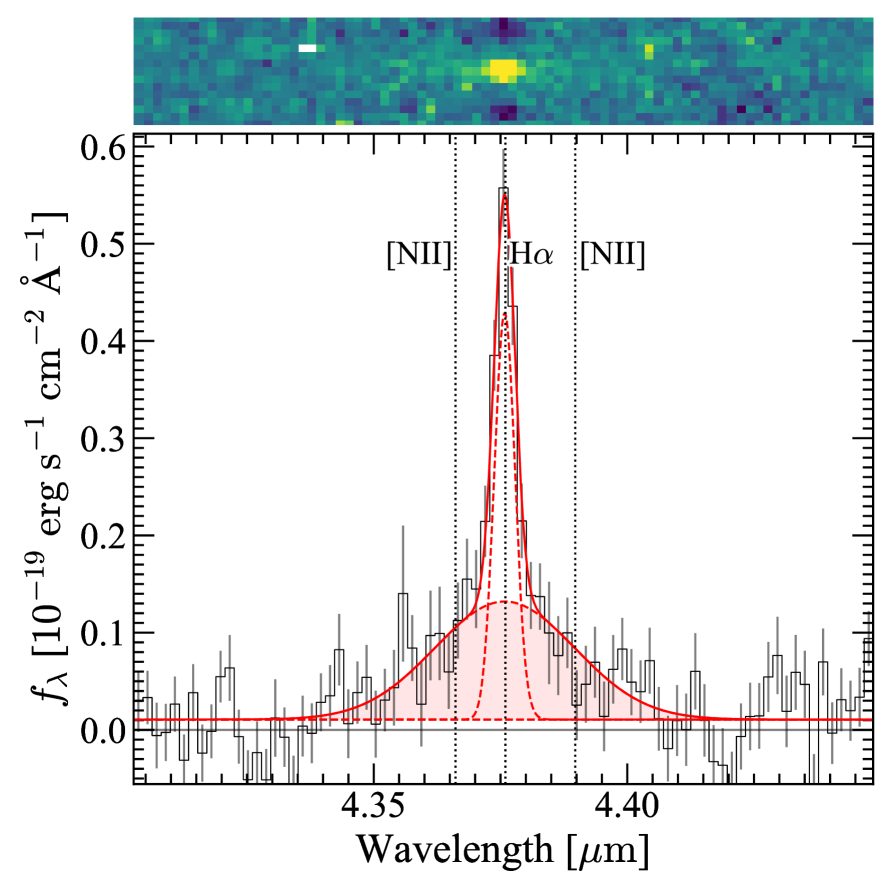
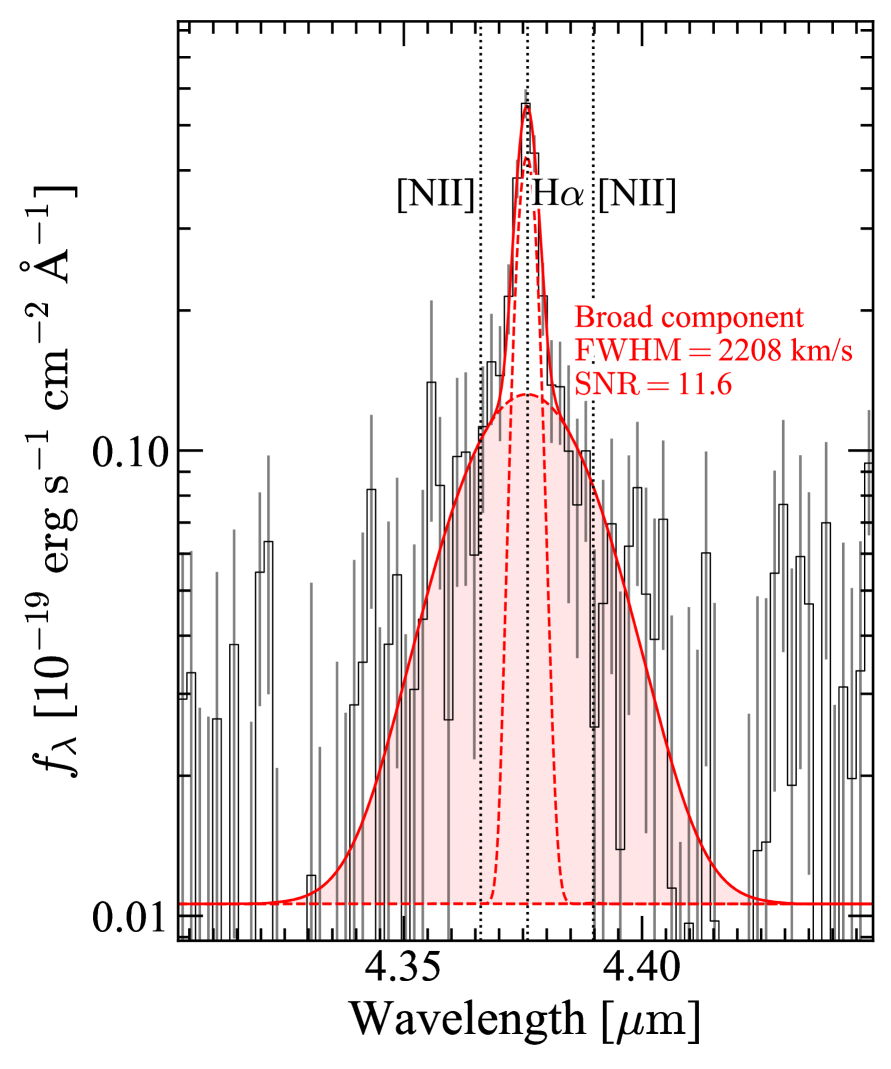
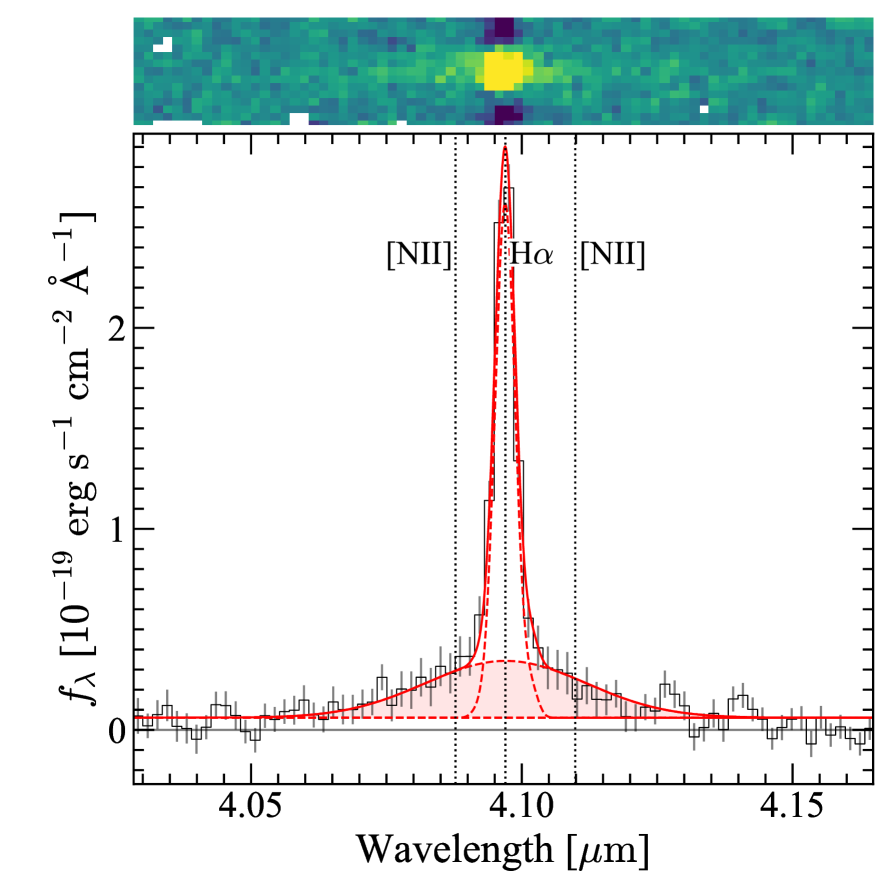
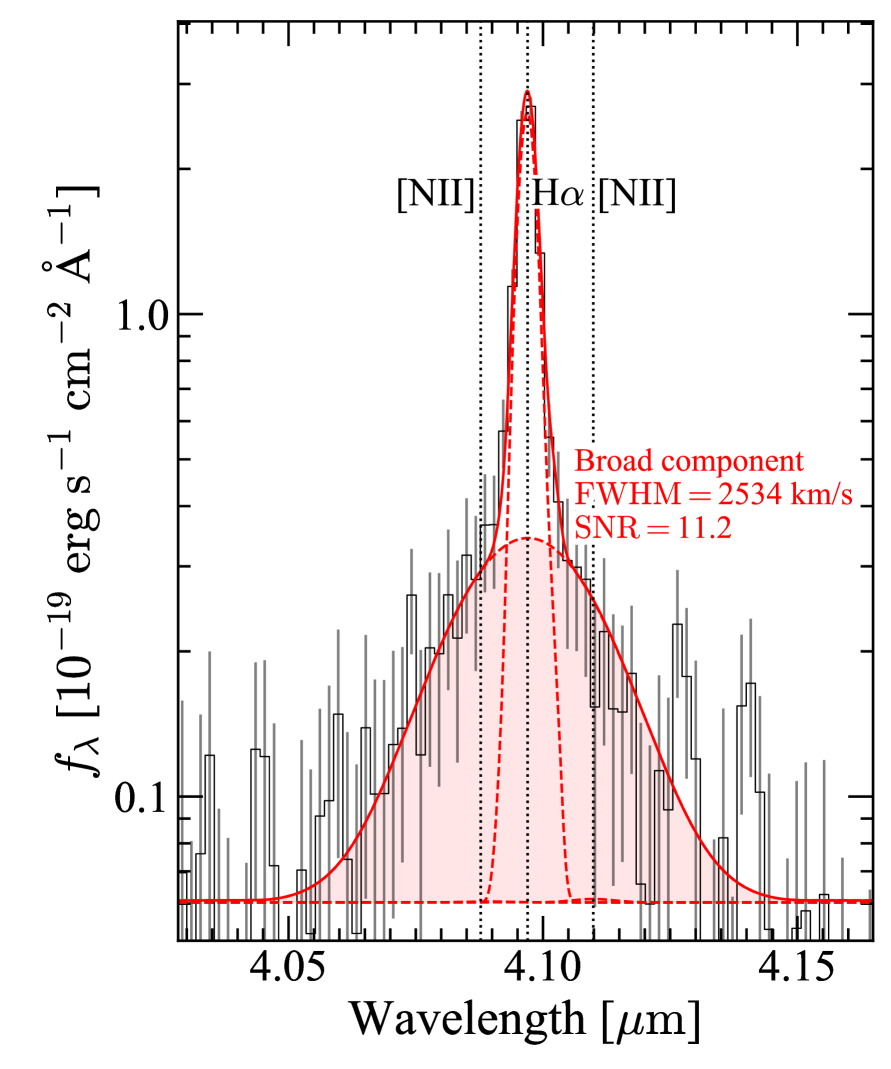
First, we fit the H and [OIII]4959,5007 lines with an assumed line ratio of that is taken from theoretical calculations (Storey & Zeippen 2000). Initially, we fit the emission lines with a single component. Most sources can be fitted with a single component whose line width is narrow (), but some sources show a weak moderately broad component in [Oiii]5007 that may be due to outflow based on visual inspection (see Zhang et al. 2023c for statistics). For such sources, we simultaneously fit the [OIII]4959,5007 with the narrow () and outflow () components. Then we fit the H and [Nii]6548,6584 emission line with an assume line ratio of . We find that the [Nii] and most of the H lines can be fitted with a single narrow component (), but some sources show a broad component in H. For such sources, we simultaneously fit the narrow () and broad () components for H, and the narrow components for [Nii]6548,6584. For sources showing the outflow components in the [Oiii] line, we add an outflow component () in H.
3.2 Selection Criteria
Based on these fitting results, we select type 1 AGNs showing broad emission only in a permitted line (i.e., H and/or H). We select sources that show
-
1.
broad () and significant () permitted H and/or H emission line, and
-
2.
narrow () forbidden [Oiii] and [Nii] emission lines, even if an outflow component is seen.
Here we evaluate the signal-to-noise ratio of the broad line using the ratio of the total broad-line flux to the error from our fitting results in Section 3.1. For galaxies at whose H line is detected, we select galaxies with the following criteria:
| (1) | |||
| (2) | |||
| (3) | |||
| (4) | |||
| (5) | |||
| (6) | |||
| (7) | |||
| (8) |
For galaxies at whose H line is not detected but H is detected, we select galaxies with the following criteria:
| (9) | |||
| (10) | |||
| (11) | |||
| (12) | |||
| (13) | |||
| (14) | |||
| (15) |
We choose the threshold value of for the definition of the broad line made by an AGN, because such a high-velocity component is seen in AGNs (e.g., Vanden Berk et al. 2001; Reines & Volonteri 2015) but not seen in star-forming galaxies (typically , e.g., Freeman et al. 2019; Swinbank et al. 2019; Xu et al. 2022). This threshold value is also used in Stern & Laor (2012), and is more stringent than those used in other studies at (e.g., Reines & Volonteri 2015; Liu et al. 2019).
| Name | R.A. | Decl. | AIC# | |||||
|---|---|---|---|---|---|---|---|---|
| (mag) | (mag) | |||||||
| Our Final Broad-Line AGN Sample | ||||||||
| CEERS_01244 | 14:20:57.76 | 53:02:09.8 | 0.00 | 37.3 | 789.8 | |||
| GLASS_160133 | 00:14:19.27 | 30:25:27.8 | 0.16 | 32.5 | 2022.4 | |||
| GLASS_150029 | 00:14:18.52 | 30:25:21.3 | 0.17 | 18.1 | 431.1 | |||
| CEERS_00746† | 14:19:14.19 | 52:52:06.5 | 1.38 | 17.3 | 210.5 | |||
| CEERS_01665 | 14:20:42.77 | 53:03:33.7 | 0.42 | 11.6 | 132.0 | |||
| CEERS_00672 | 14:19:33.52 | 52:49:58.7 | 0.80 | 11.6 | 51.9 | |||
| CEERS_02782† | 14:19:17.63 | 52:49:49.0 | 0.28 | 11.2 | 78.6 | |||
| CEERS_00397 | 14:19:20.69 | 52:52:57.7 | 0.19 | 6.2 | 51.2 | |||
| CEERS_00717 | 14:20:19.54 | 52:58:19.9 | 0.00 | 6.1 | 23.9 | |||
| CEERS_01236 | 14:20:34.87 | 52:58:02.2 | 0.00 | 5.9 | 23.3 | |||
| Other Possible Candidates with | ||||||||
| CEERS_01465 | 14:19:33.12 | 52:53:17.7 | 0.00 | 4.4 | ||||
| CEERS_01019∗ | 14:20:08.49 | 52:53:26.4 | 0.00 | 3.1(H)∗ | ||||
Note. — The name, spectroscopic redshift (), UV magnitude (), metallicity (), and extinction () are taken from Nakajima et al. (2023).
† CEERS_00746 and CEERS_02782 are reported as CEERS 3210 and CEERS 1670, respectively, in Kocevski et al. (2023).
∗ CEERS_01019 is reported as CEERS_1019 in Larson et al. (2023). The signal-to-noise ratio of the broad H line instead of H is presented.
# Difference between AIC values for the fittings without the broad component and with the broad component.
3.3 Our AGN Sample
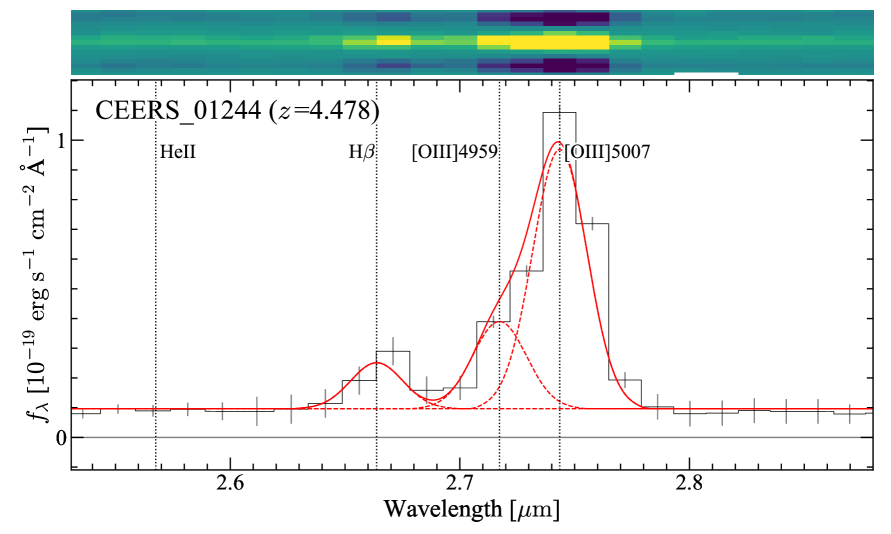
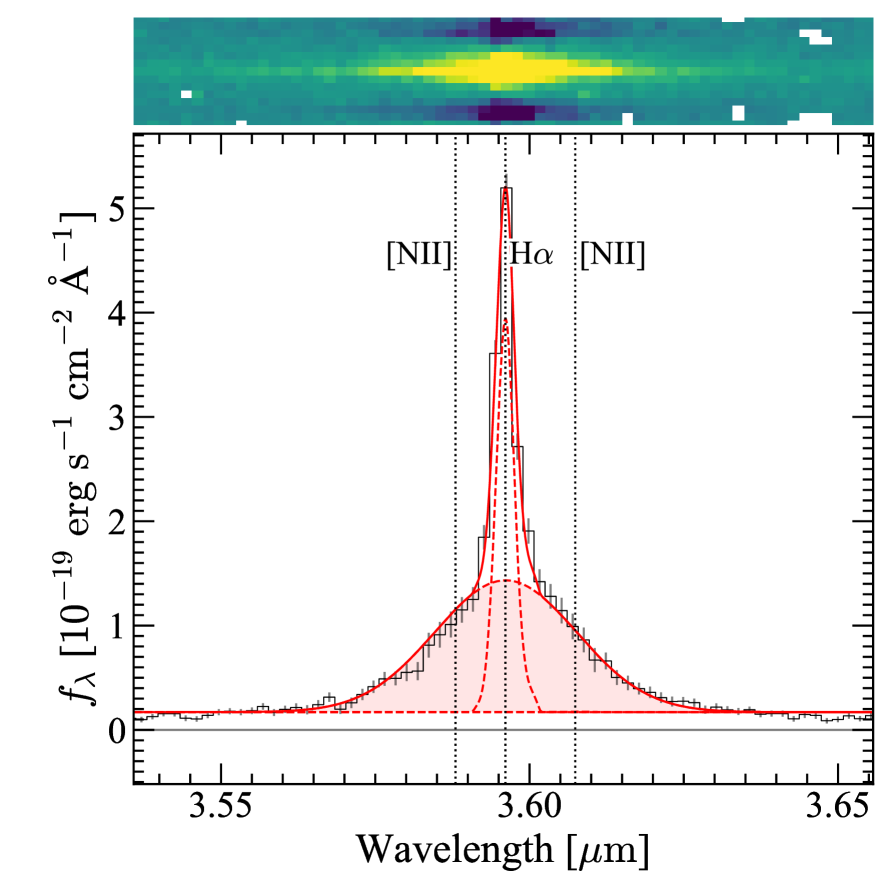
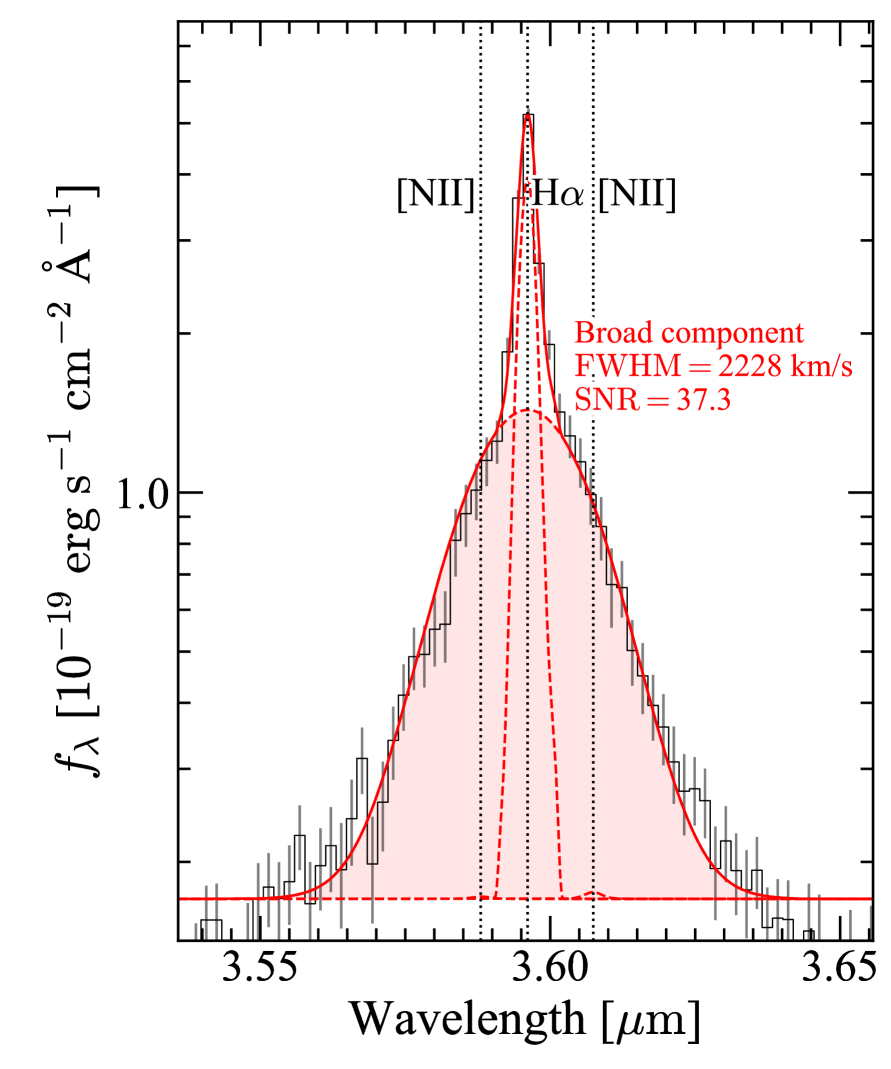
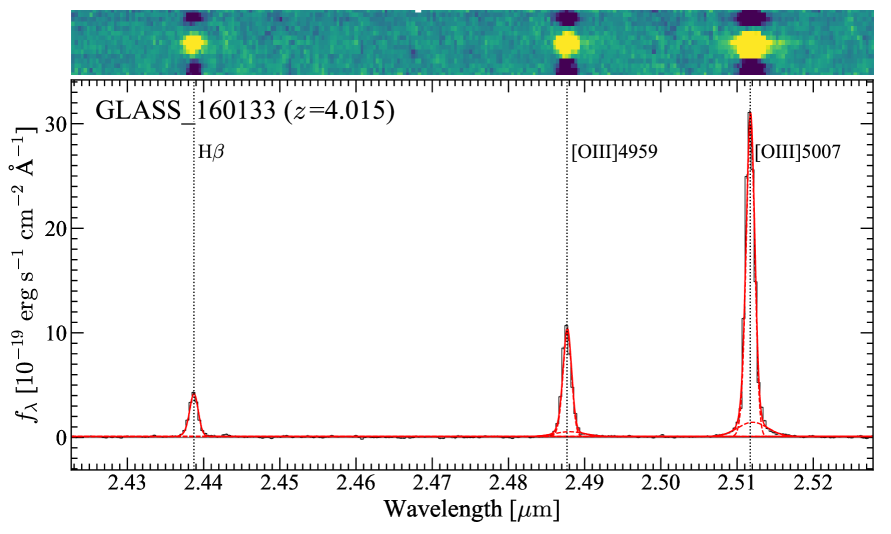
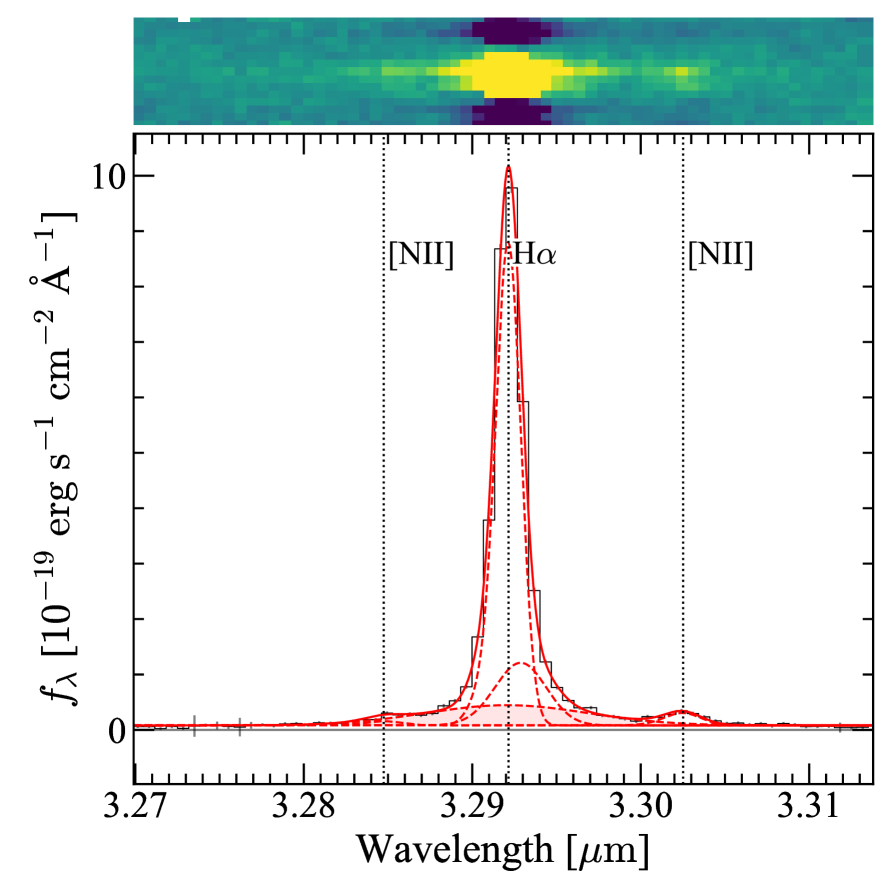
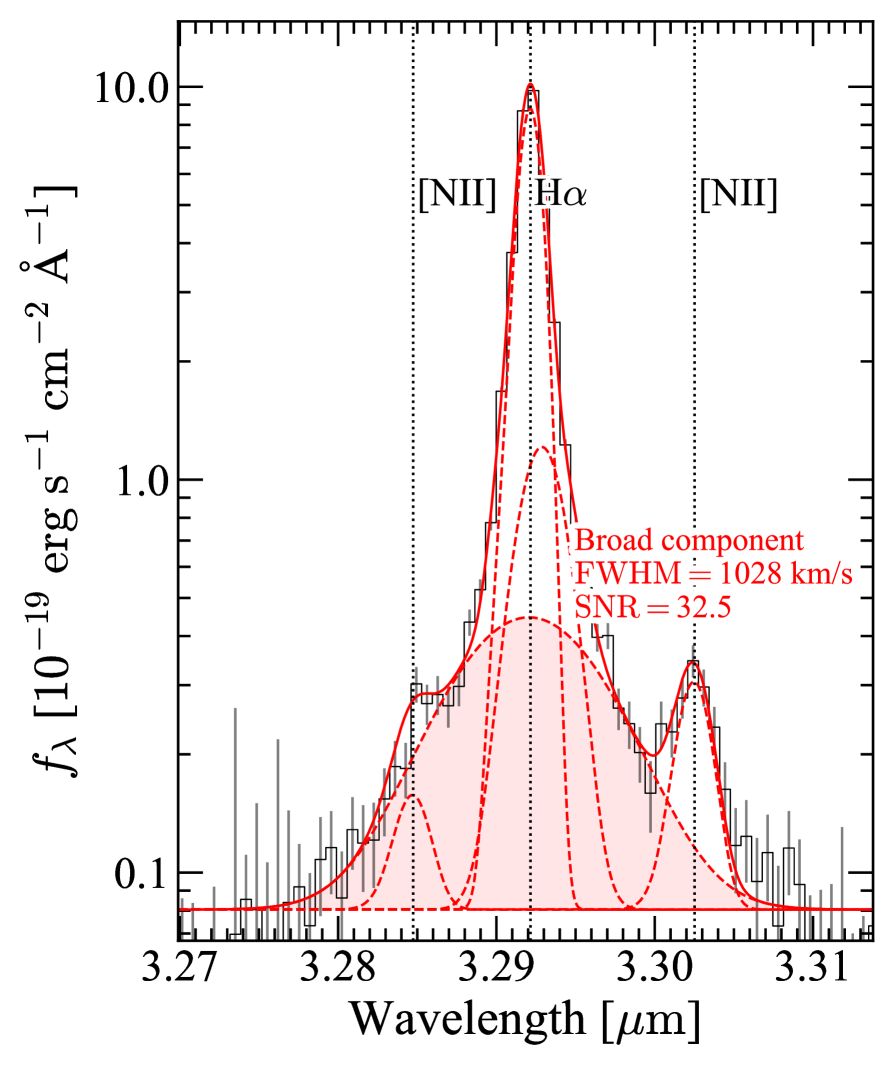
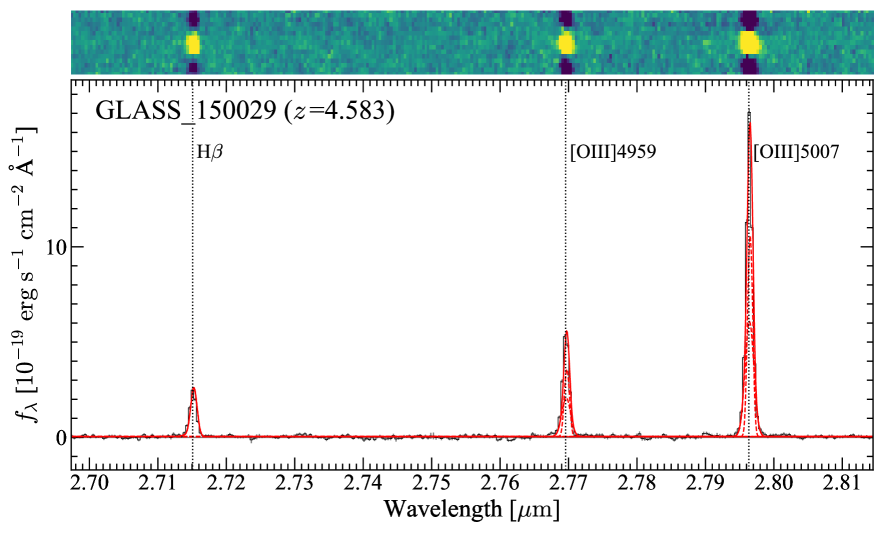
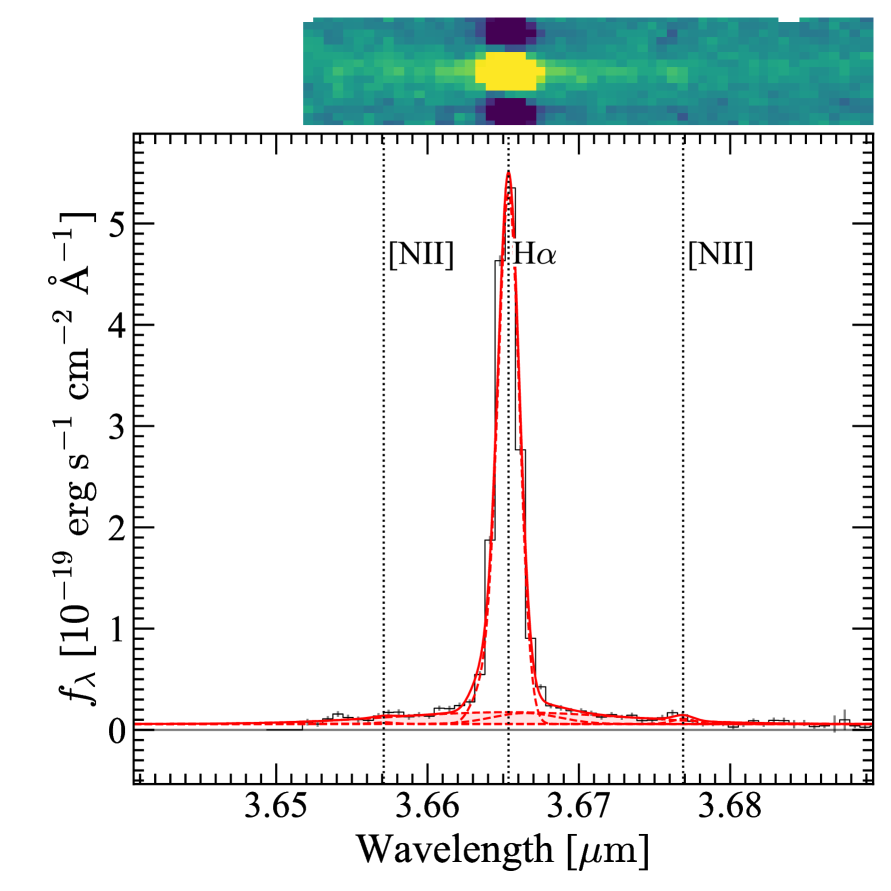
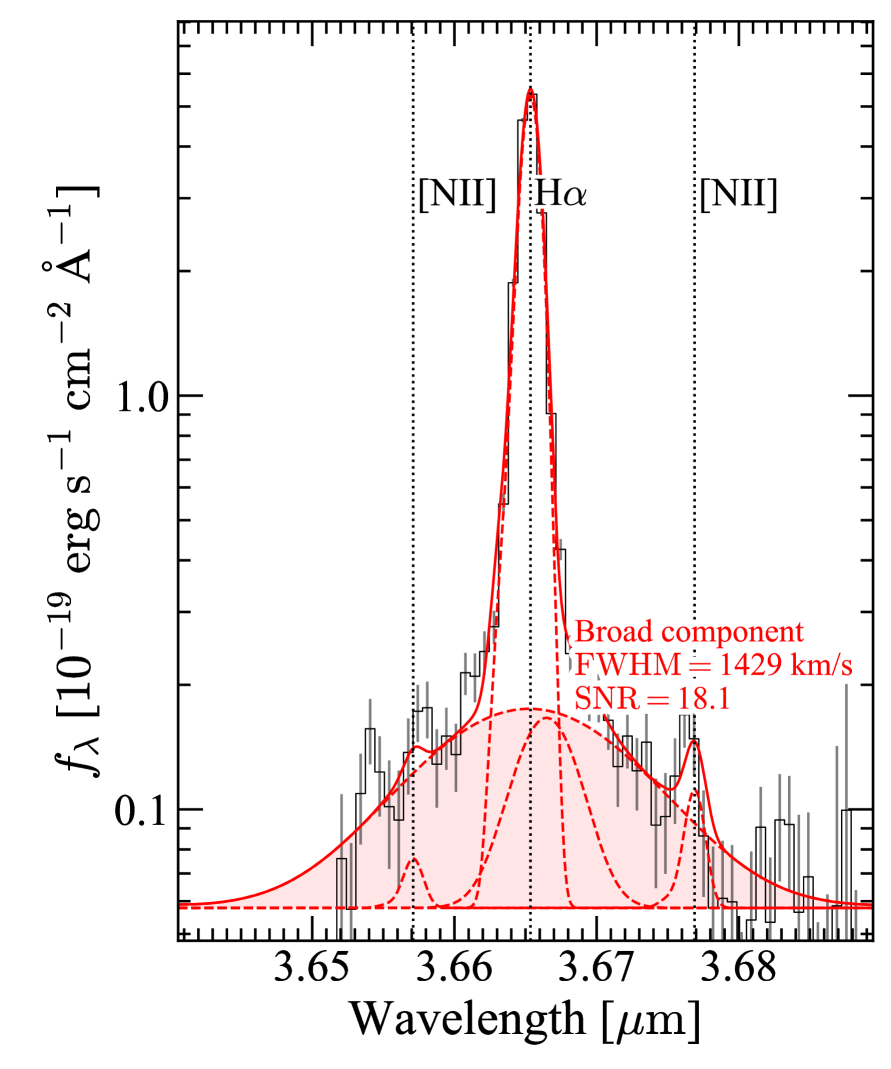
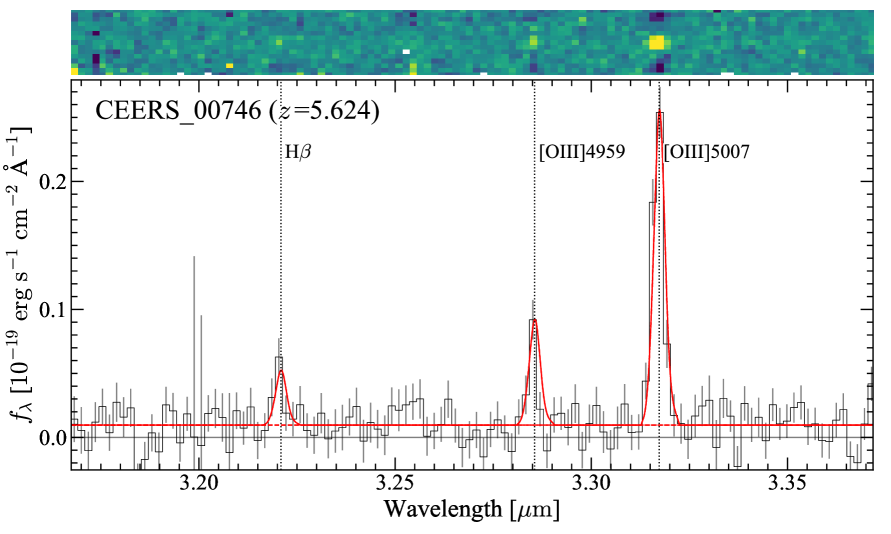
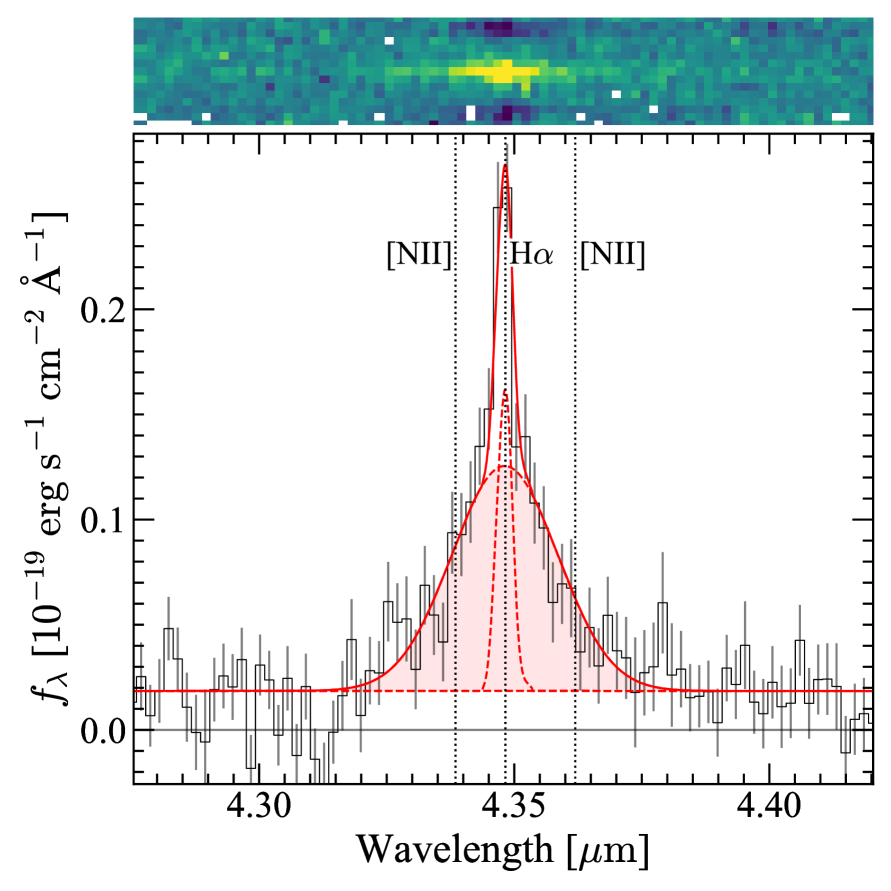
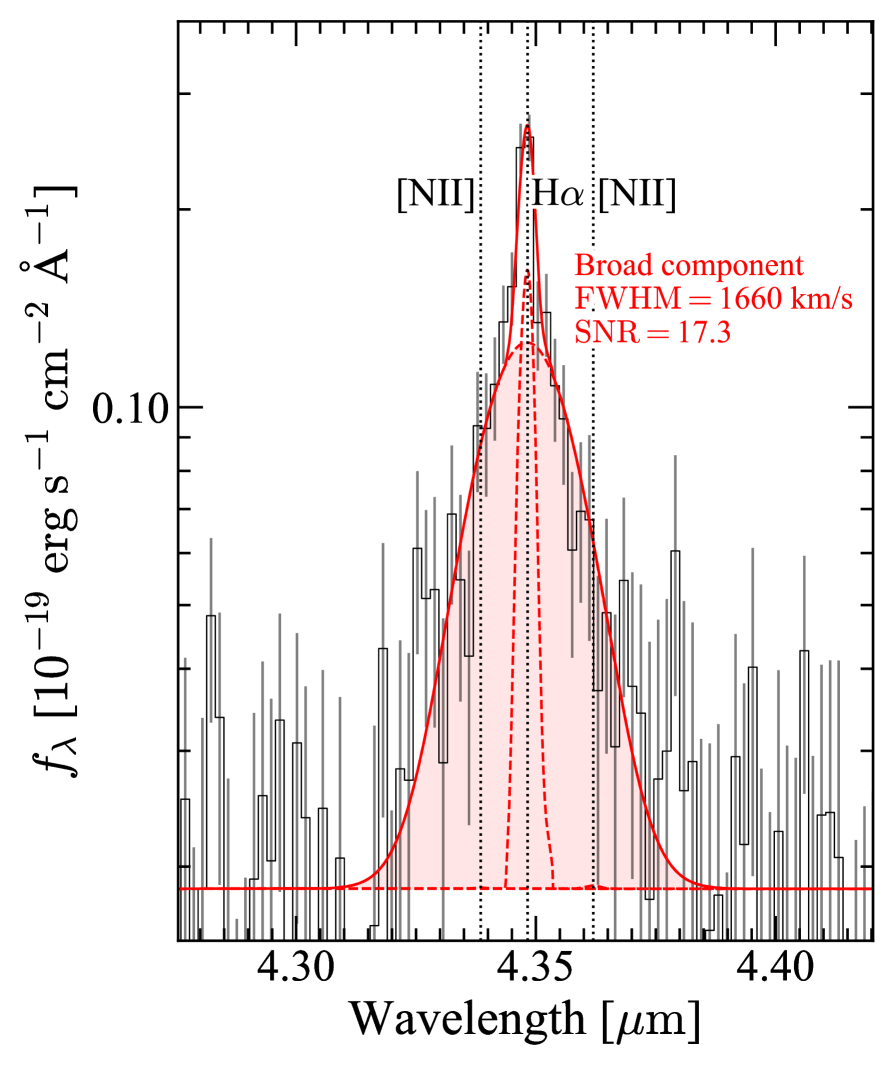
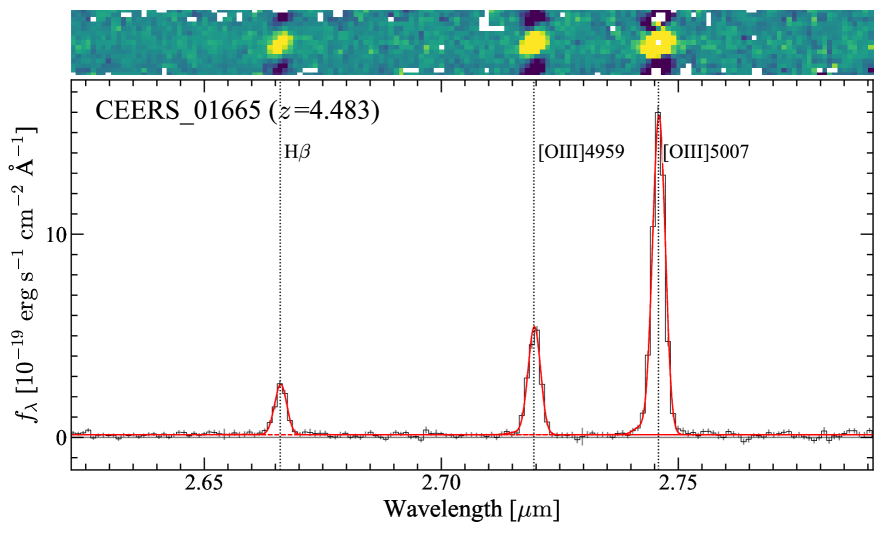
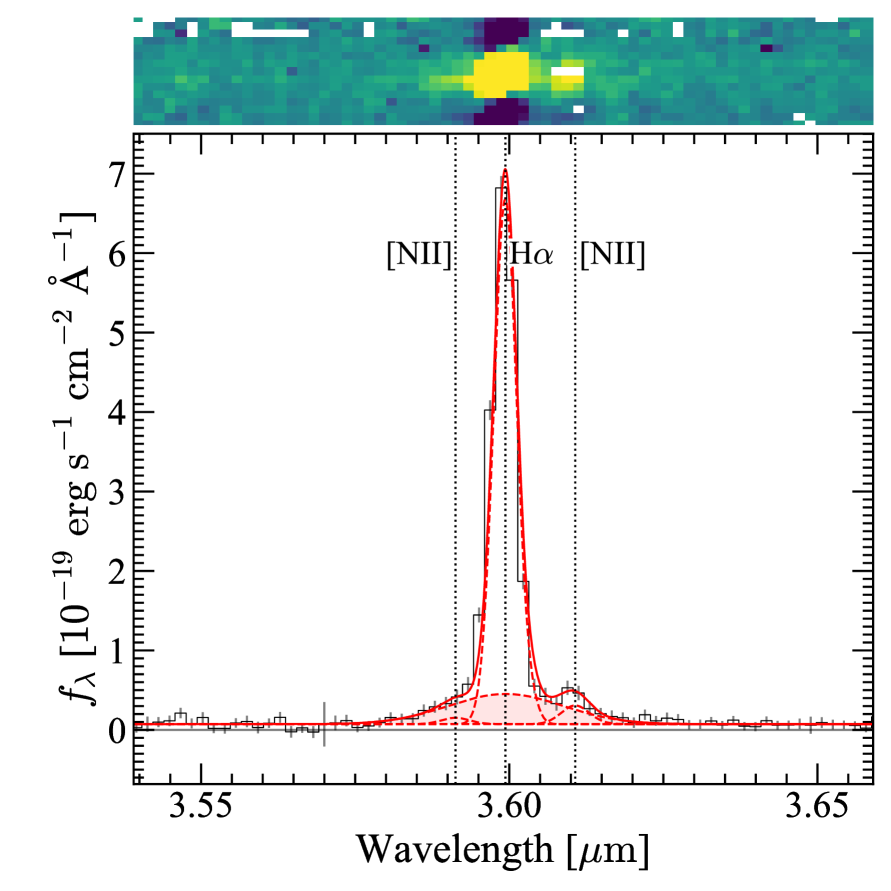
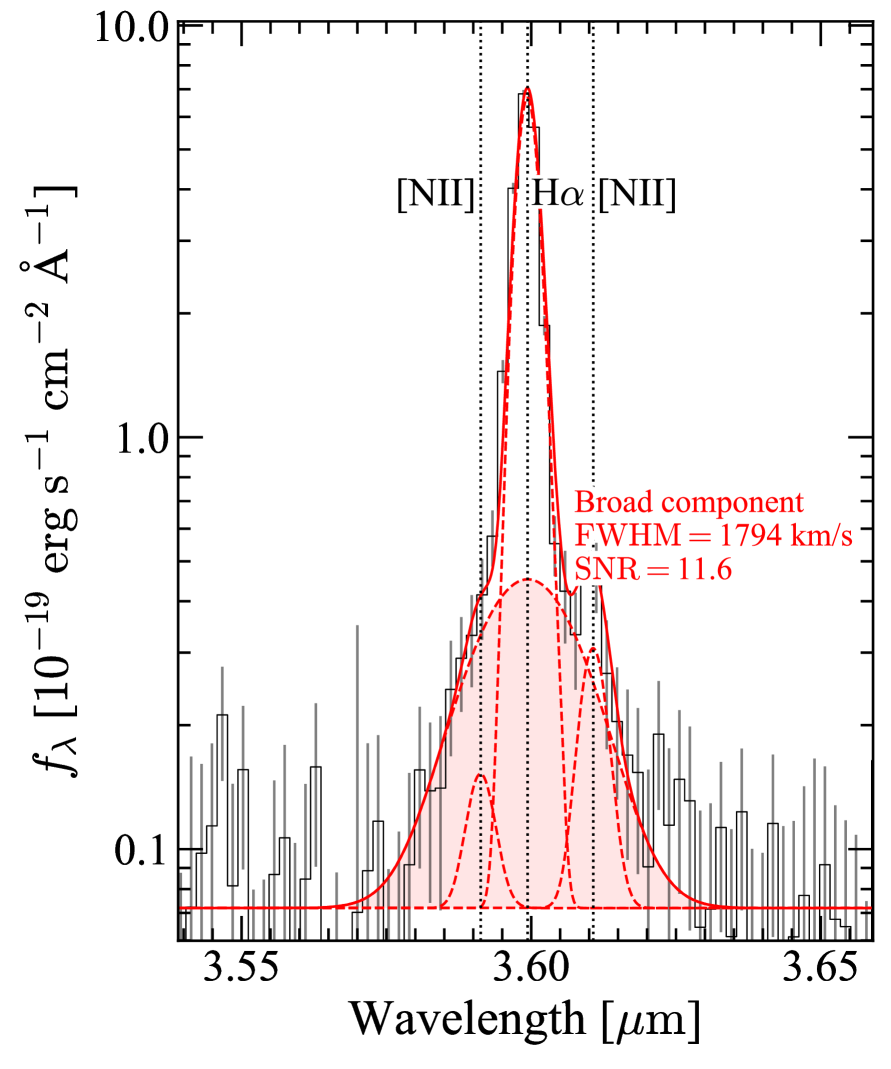
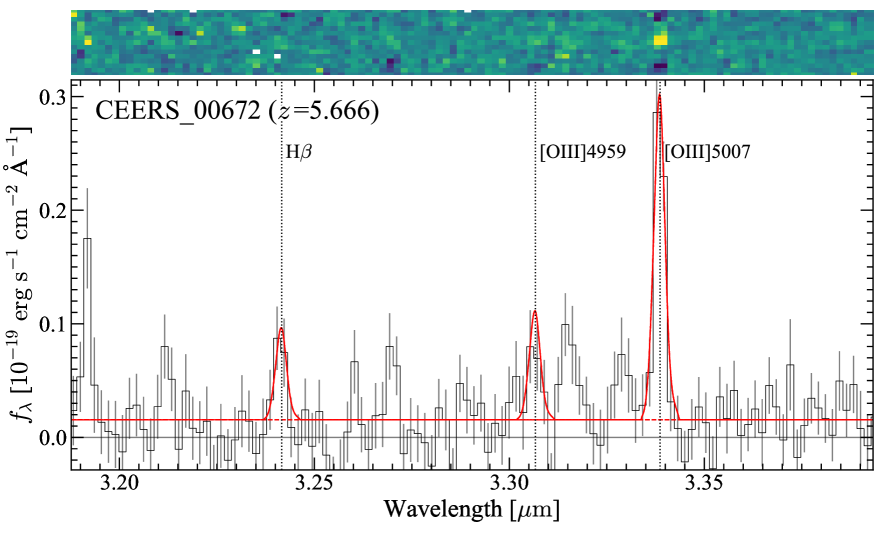
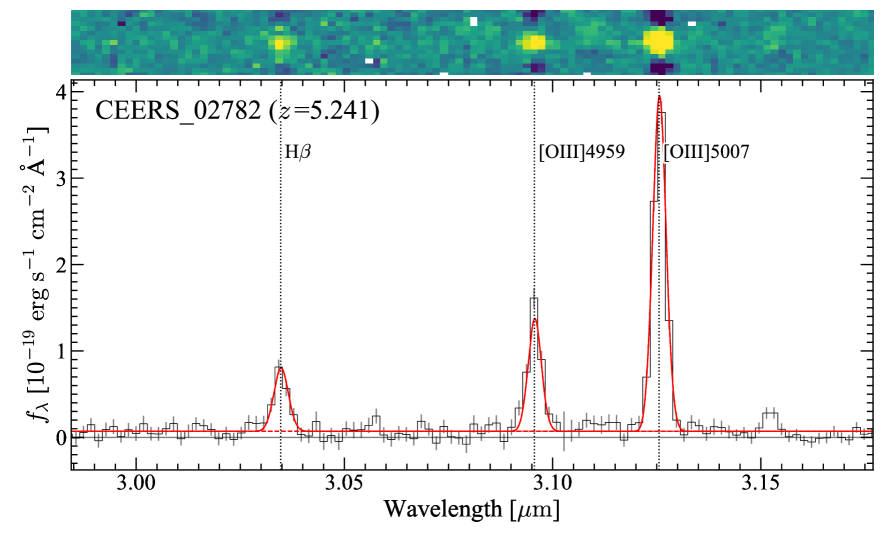
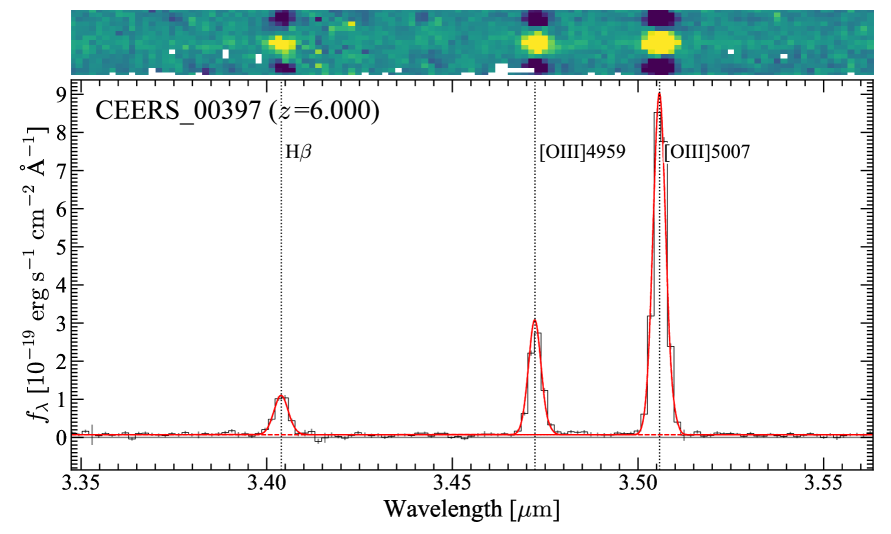
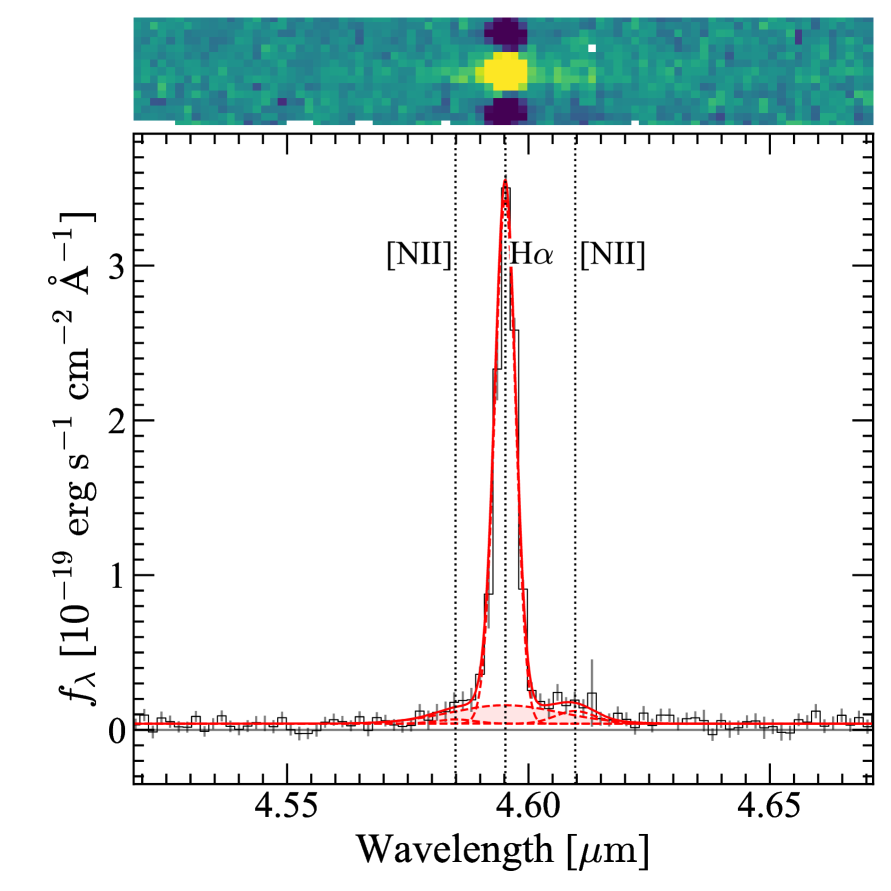
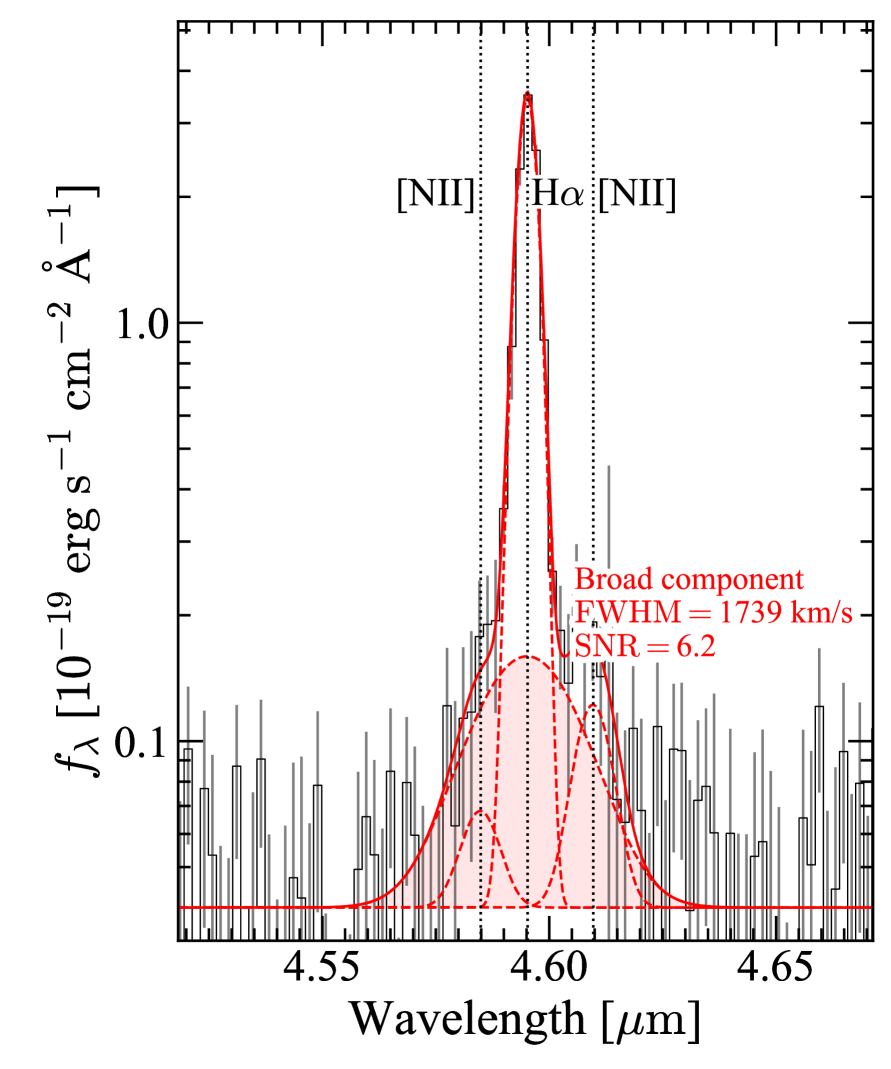
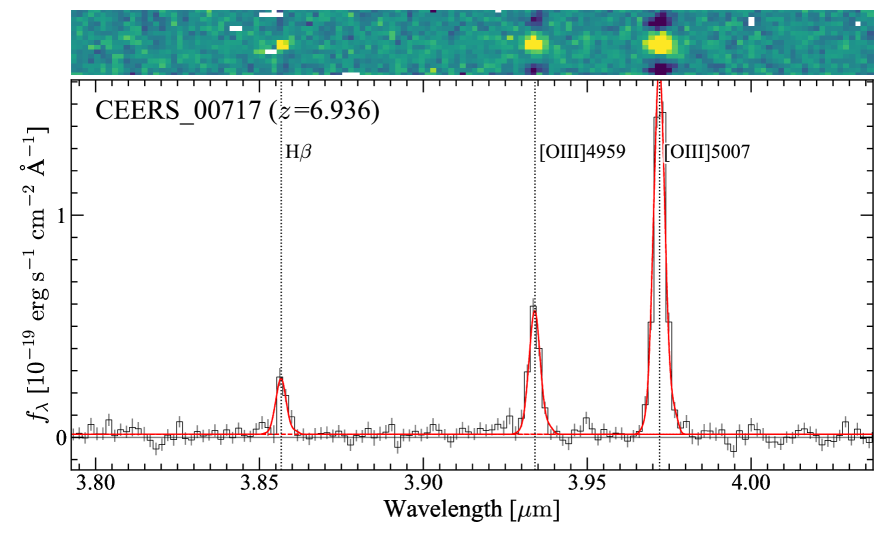
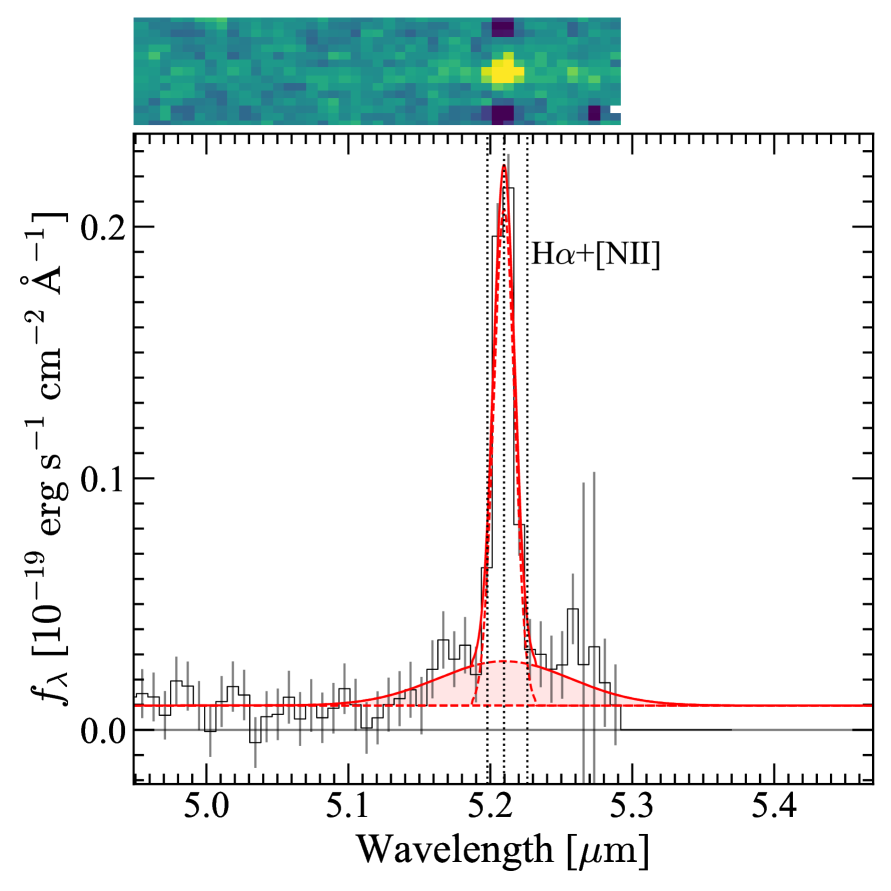
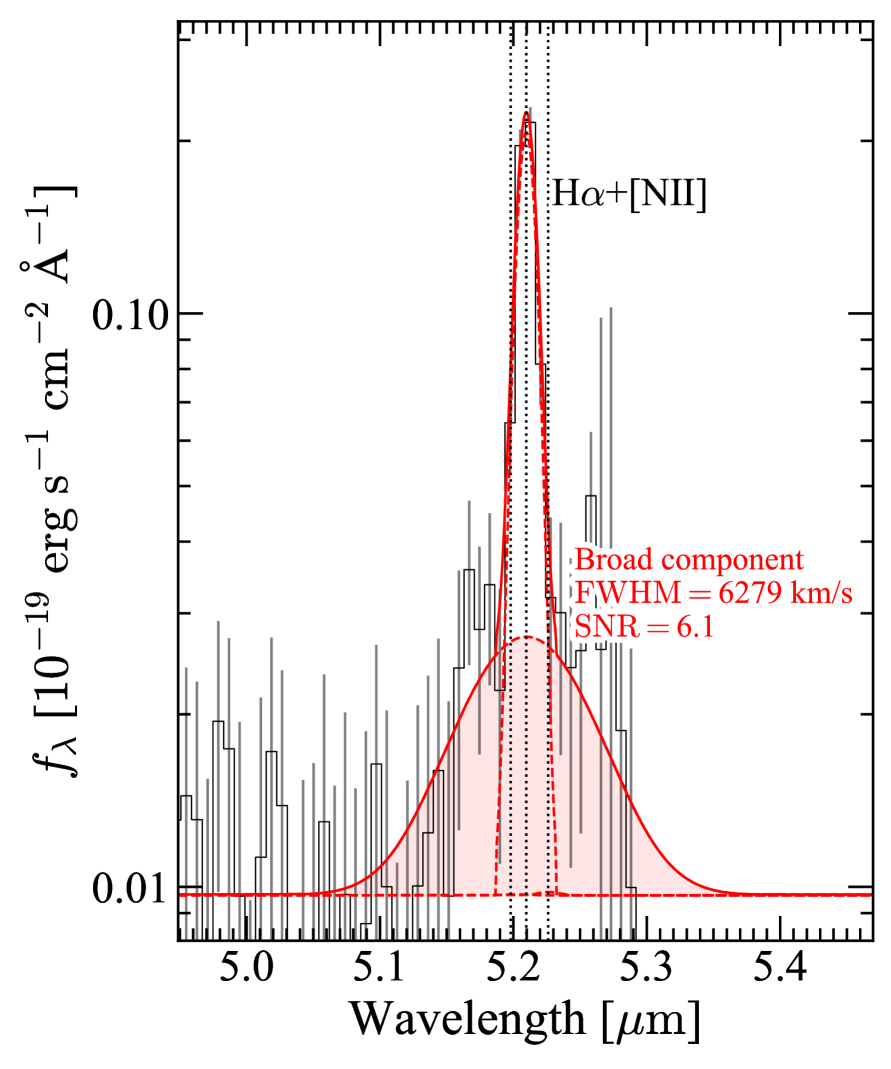
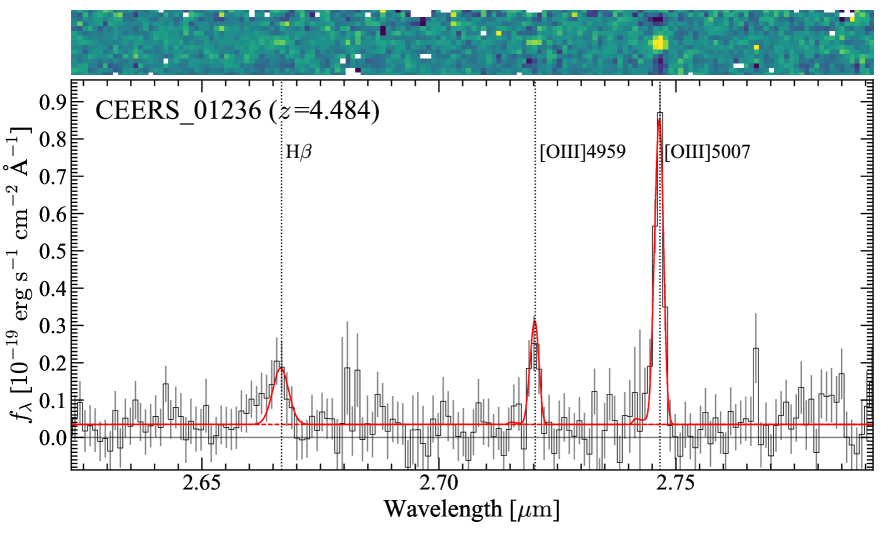
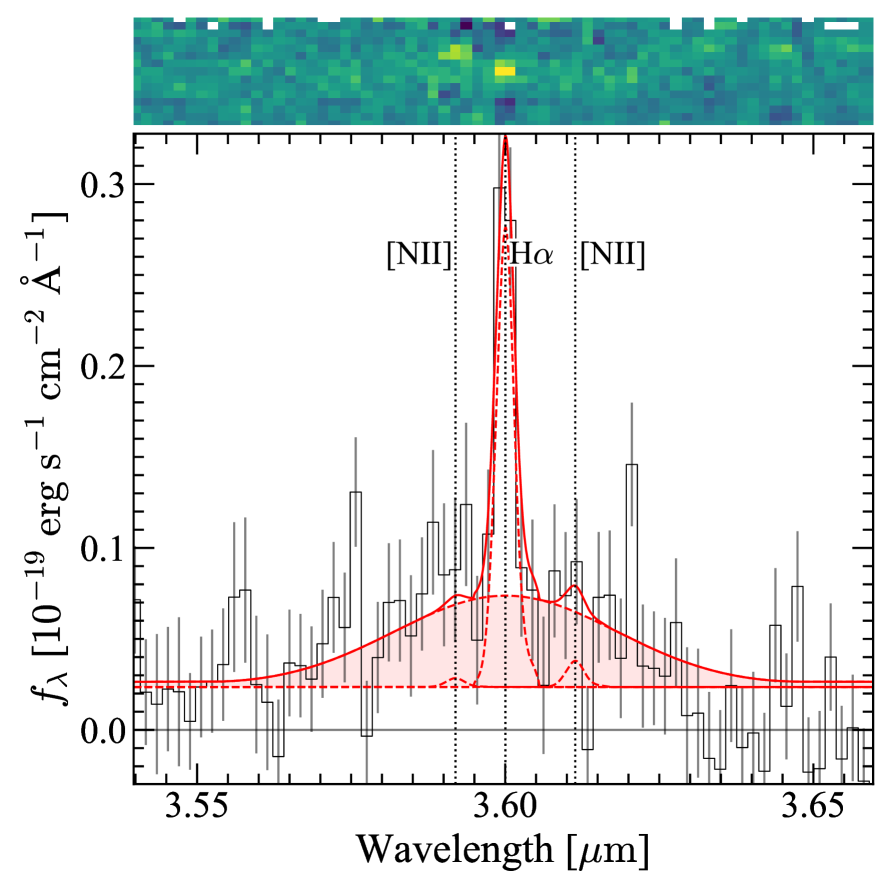
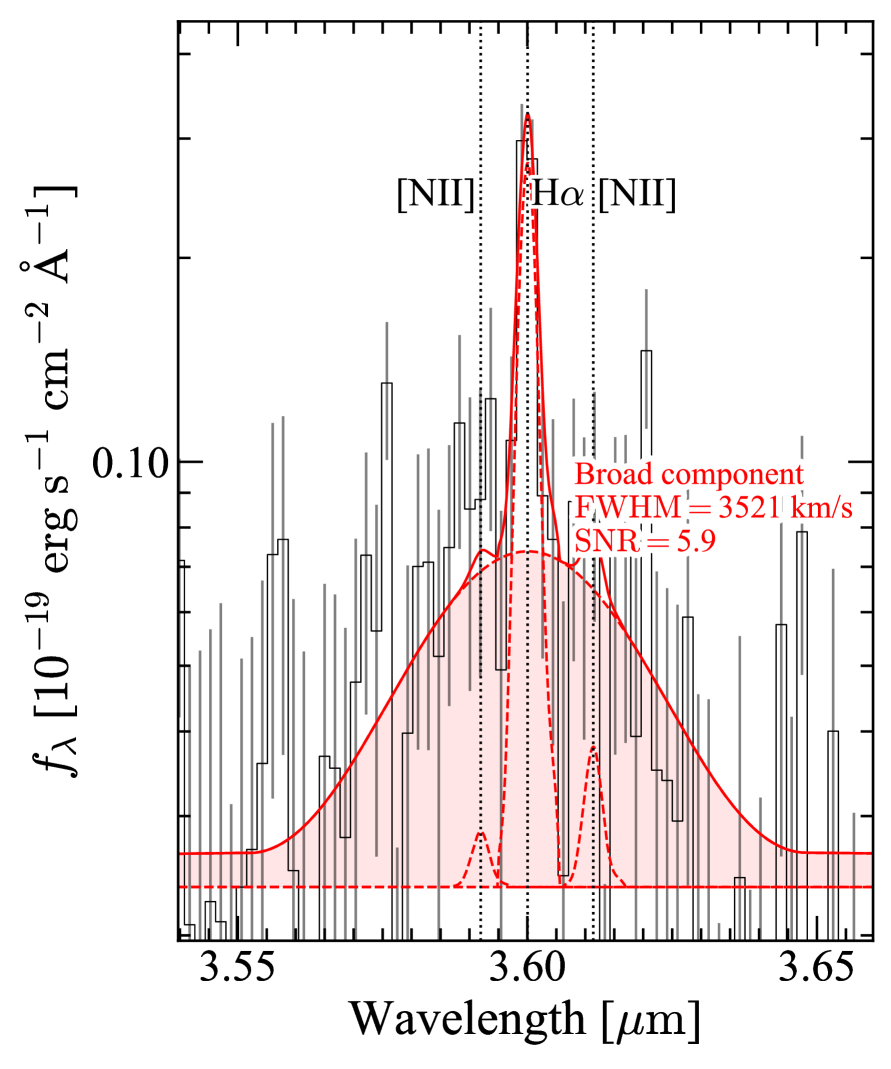
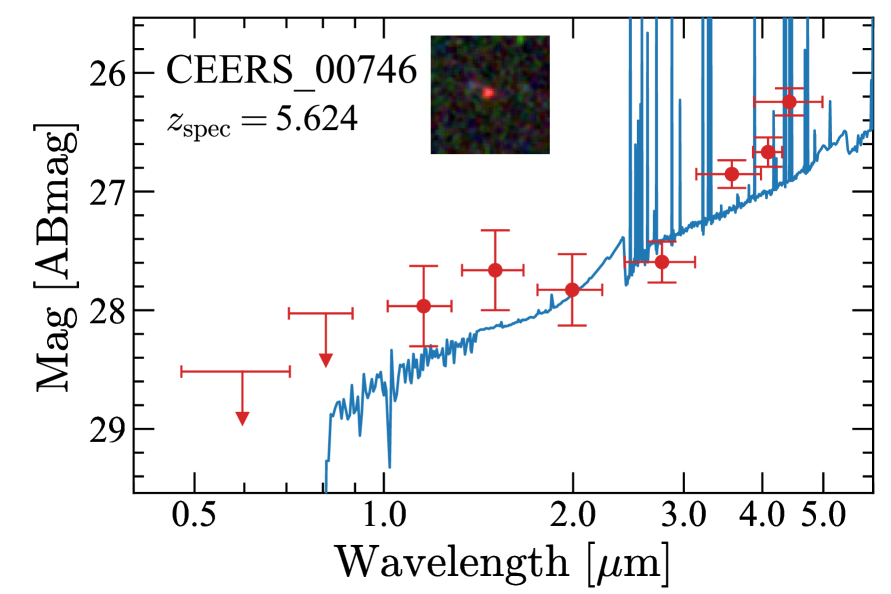
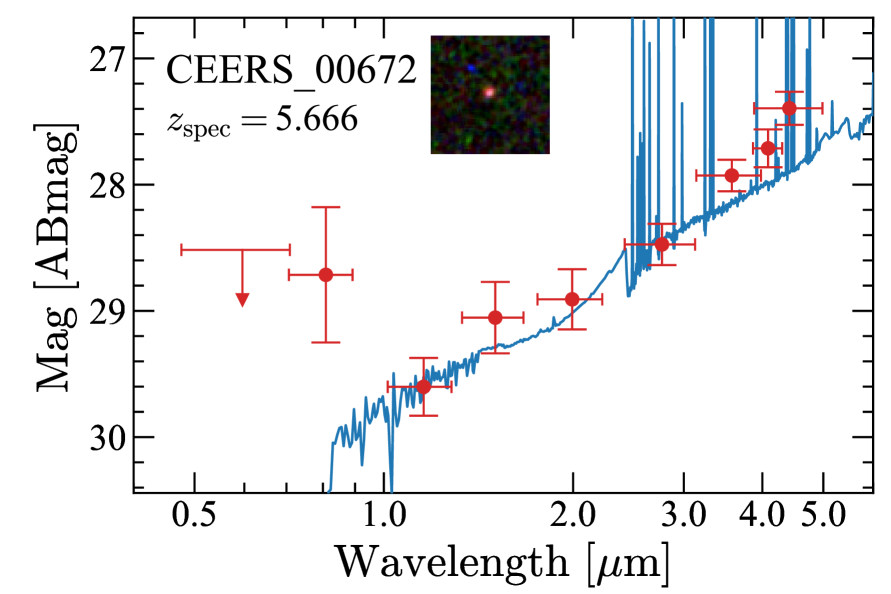
Using the selection criteria above, we select a total of 10 galaxies that show broad H emission lines. Figures 1-3 show NIRSpec spectra of the selected galaxies, and Table 1 summarizes the physical properties derived in Nakajima et al. (2023). CEERS_00746 and CEERS_02782 were already reported as broad-line AGNs in Kocevski et al. (2023) as CEERS 3210 and CEERS 1670, respectively, and our measured broad line widths are consistent with those of Kocevski et al. (2023) within . These 10 galaxies show significant broad-line emission only in a permitted line (H), and their forbidden lines, especially [Oiii]5007, which is detected with a signal-to-noise ratio higher than H, are well fitted with narrow () components. GLASS_160133 and GLASS_150029 show outflow component whose line width is and in [Oiii]5007, respectively. We evaluate the fittings using the Akaike Information Criterion (AIC; Akaike 1974), which is defined by , where is the maximum likefood and is the number of free parameters. As shown in Table 1, all of the selected objects are well fitted with the broad component rather than without the broad component with . These properties are consistent with the fact that they are broad-line type-1 AGNs.
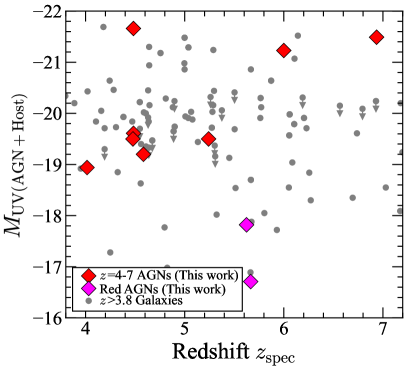
Figure 4 shows the UV magnitudes and redshifts of our selected AGNs. Our selected AGNs are typically faint with a UV magnitude of mag, much fainter than the low-luminosity quasars found in ground-based observations at similar redshifts (e.g., Akiyama et al. 2018; Niida et al. 2020; Matsuoka et al. 2018). None of our AGNs is selected as X-ray AGNs in Giallongo et al. (2019), probably because their X-ray emission is too faint to be detected with current X-ray observations. Our AGNs are widely distributed in the UV magnitude and redshift space and are not biased compared to the star-forming galaxy sample in Nakajima et al. (2023), except for a possible gap in probably due to the small sample size. Since we have found 10 AGNs in the sample of 185 galaxies at , about of the galaxies at with mag are broad-line type-1 AGNs, which is higher than galaxies, as discussed in Section 4.6. Note that this value, “5%”, should be taken with caution, because the observed AGN fraction depends on the sensitivity (see discussion in Section 4.6) and the selection function for the parent spectroscopic sample that could be very complex.
There are two other galaxies showing a broad permitted line but not selected due to their inefficient signal-to-noise ratio. CEERS_01465 at shows a possible broad H emission line with an FWHM of , but the signal-to-noise ratio of the broad line is , lower than the threshold value of our selection criteria. The other galaxy is CEERS_01019 at , which was first confirmed spectroscopically with Ly by Zitrin et al. (2015). This galaxy was reported to show a Nv1243 whose ionization potential is 77 eV (Mainali et al. 2018), and recently, Larson et al. (2023) report a broad H emission line with with (), indicating that this galaxy is an AGN. Our analysis also shows a similar broad H line with with , consistent with the results in Larson et al. (2023). Although these two galaxies are good candidates for broad-line AGNs, we do not include them in our final sample due to the moderate signal-to-noise ratio of the broad line.
Broad emission lines are sometimes interpreted as mergers or outflows, but the observed broad emission lines in our AGNs seen only in H are not likely made by mergers or outflows. Merging galaxies show broad emission lines both in the permitted and forbidden lines and the emission lines are decomposed with two or more narrow components, typically with (e.g., Hashimoto et al. 2019; Romano et al. 2021), different from the broad () single component only seen in H in our AGNs. Galaxies with strong outflows also show broad emission lines, but such broad lines are usually seen in both permitted and forbidden lines (e.g., Freeman et al. 2019; Xu et al. 2022). Moreover, the line width of the broad line in star-forming galaxies is typically , not larger than . Type-2 AGNs sometimes show broad emission lines due to outflows with , but this broad component is again seen in both [Oiii] and H lines (e.g., Förster Schreiber et al. 2014; Genzel et al. 2014). One remaining possibility is a strong low-metallicity outflow whose metallicity and ionization parameter are tuned to show a broad component only in H, but such outflow is not observed even in low-metallicity galaxies (Xu et al. 2022). Given these comparisons, it is reasonable to interpret that our selected galaxies harbor broad-line type-1 AGNs.
4 Physical Properties of Our AGNs
4.1 Morphology
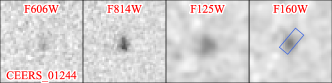
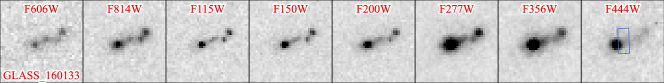
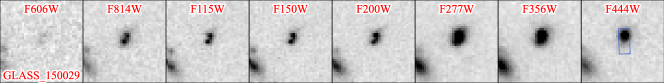
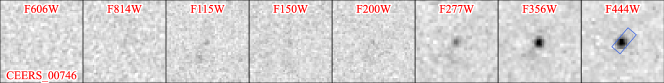
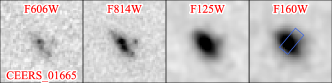
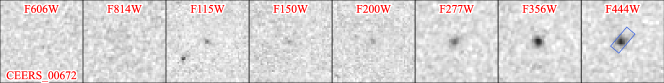
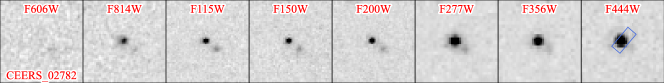
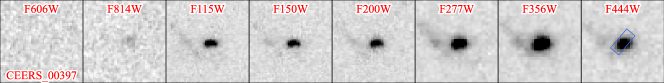
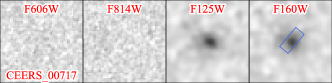
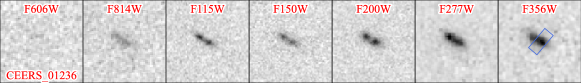
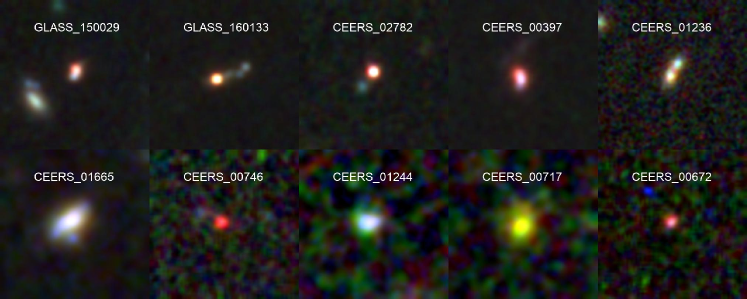
Figure 5 shows snapshots of our selected AGNs, and Figure 6 present their false color images. Remarkably, the selected AGNs have a variety of morphologies, including not only compact point sources but also extended sources. CEERS_00746, CEERS_00672, and CEERS_02782 show compact morphologies consistent with the point-spread function (PSF). Among these three sources, CEERS_00746 (CEERS 3210 in Kocevski et al. 2023) and CEERS_00672 show red spectral-energy distributions (SEDs) and large dust attenuation estimated from the Balmer decrement as presented in Section 4.2, indicating that these two sources are dusty red AGNs. The remaining seven AGNs show extended morphologies, different from the ones reported in Kocevski et al. (2023). Such a high fraction (70%) of extended morphologies indicates that the total lights of the faint AGNs with mag are partly dominated by their host galaxies like Seyfert galaxies, which is discussed in Section 5.2 (see also Bowler et al. 2021). Interestingly, many AGNs show clumpy morphologies that may indicate merger activity, which is consistent with a scenario in which a merger triggers the AGN activity (Hopkins et al. 2006).
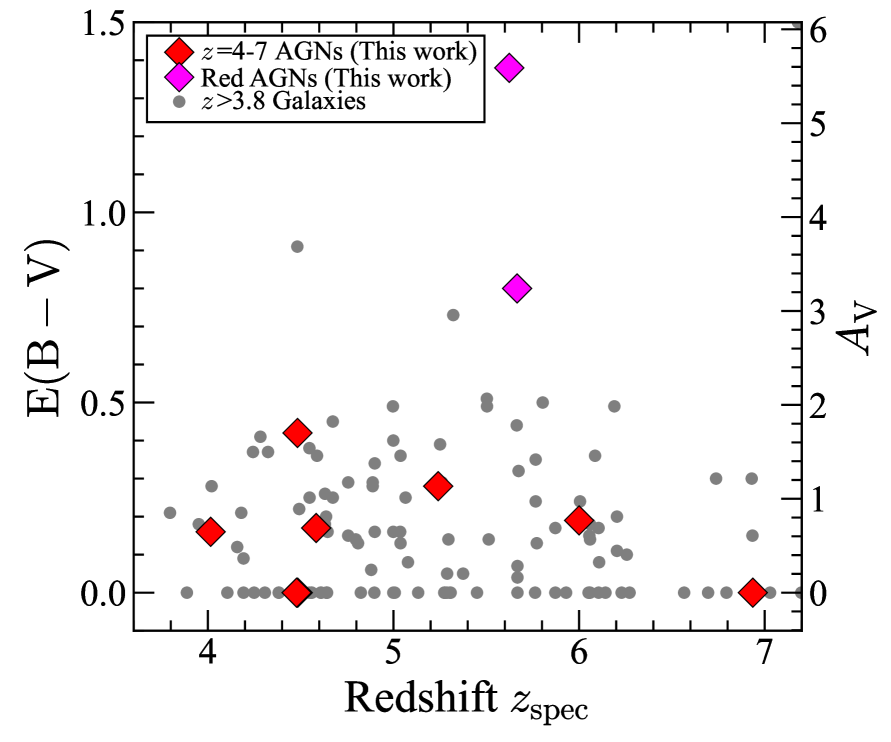
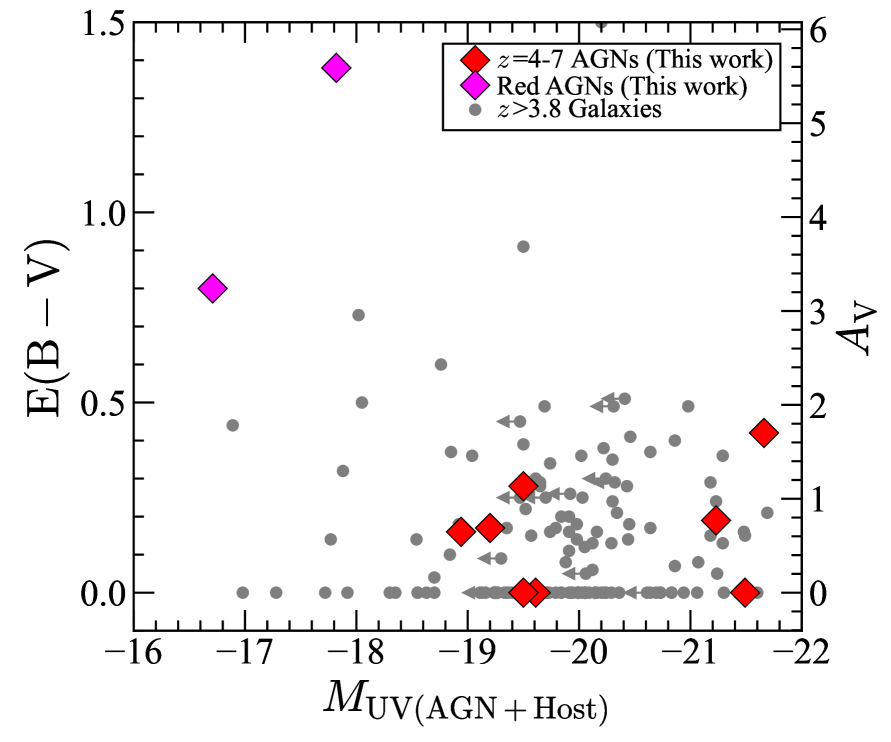
4.2 Dust Attenuation
We evaluate the dust attenuation of our selected AGNs using the color excess, , estimated from the Balmer decrement in Nakajima et al. (2023) assuming the Calzetti et al. (2000) dust extinction law. Figure 7 shows the dust attenuation of our AGNs as functions of the redshift and the UV magnitude. Most of our AGNs have negligible or moderate dust attenuation with , except for two sources, CEERS_00746 and CEERS_00672 with and , respectively. CEERS_00746 was previously reported as a red AGN in Kocevski et al. (2023), and we have newly found an additional red AGN, CEERS_00672, at . The two AGNs show red SEDs as shown in Figure 8, consistent with the high dust attenuation inferred from the Balmer decrement. These findings indicate that the NIRSpec-selected broad-line AGNs include both blue and red AGNs. The red AGNs are found only in a faint UV-magnitude range with (Figure 4).
4.3 Emission Lines
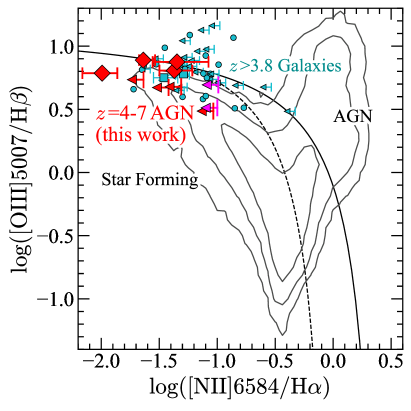
In Figure 9, we plot the narrow-line ratios of our AGNs in the BPT diagram (Baldwin et al. 1981) that is commonly used to classify galaxies as dominated by emission from AGN or star formation. Our AGNs are located in the region with high [Oiii]/H and low [Nii]/H, similar to other galaxies at without broad line emission (Nakajima et al. 2023; Sanders et al. 2023), and above the sequence of galaxies, as seen in star forming galaxies (e.g., Steidel et al. 2014; Shapley et al. 2015; Kashino et al. 2017). These results indicate that our galaxies harboring AGNs cannot be distinguished from normal star-forming galaxies at with the BPT diagram, as discussed in Kocevski et al. (2023), because of the low metallicities in these sources. Indeed, low-metallicity () AGNs with moderately weak [Nii] emission are found at in Kawasaki et al. (2017). As shown in Table 1, metallicities of our galaxies having AGNs are typically sub-solar, resulting in the weak [Nii] emission in contrast to typical AGNs showing strong [Nii] emission.
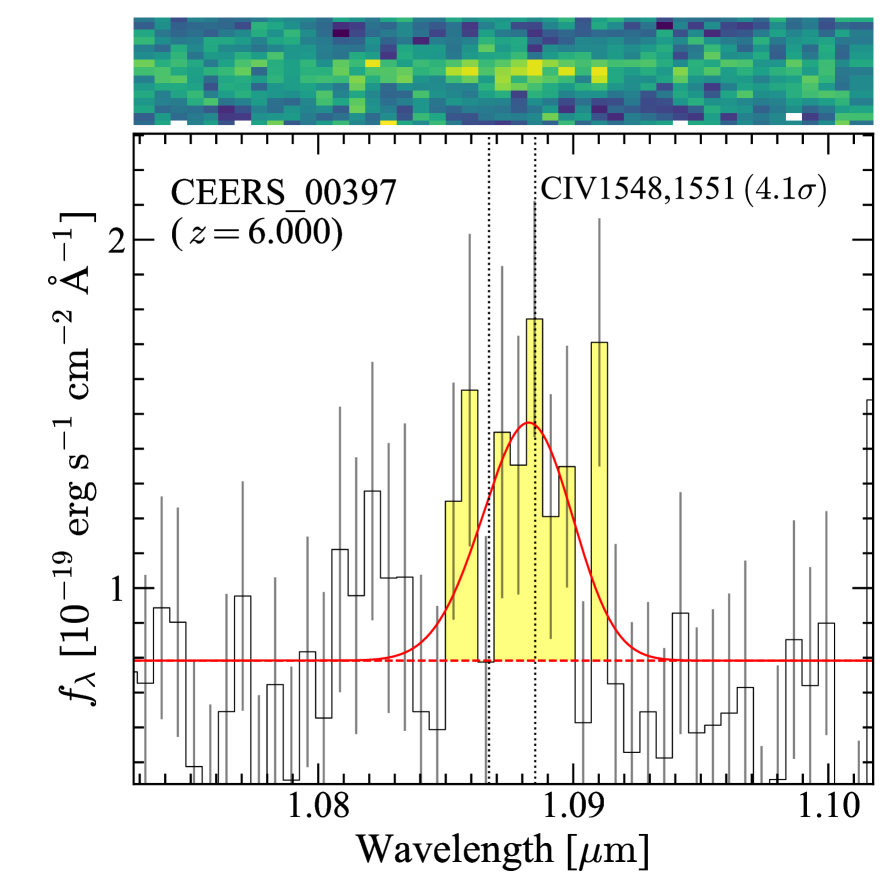
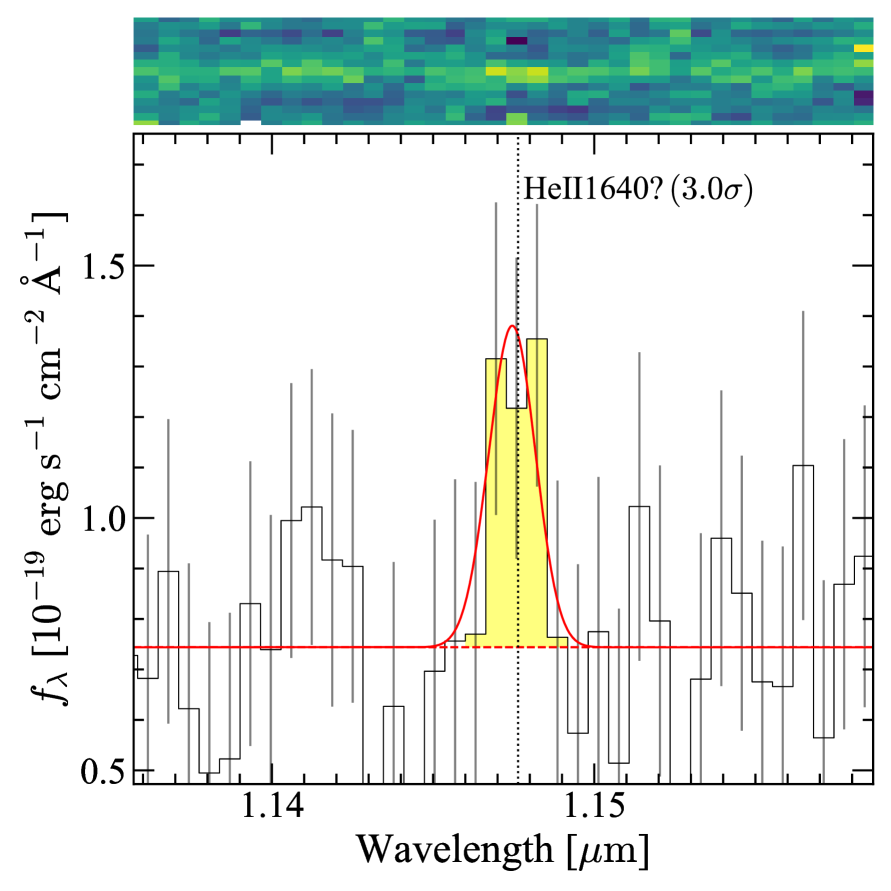
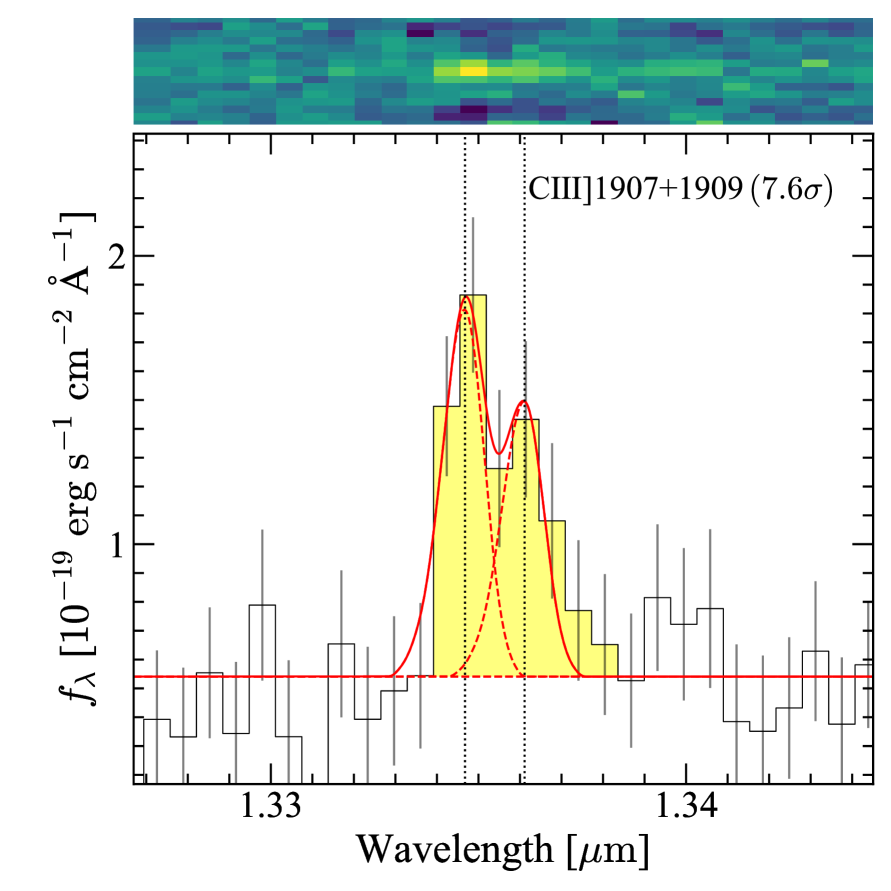
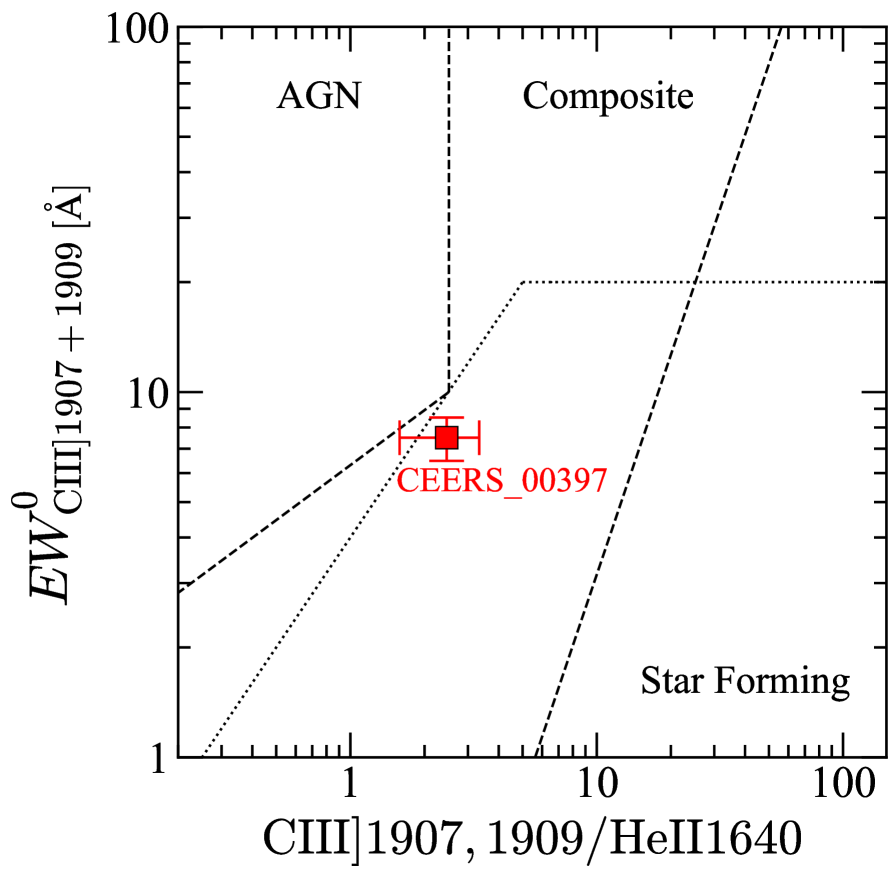
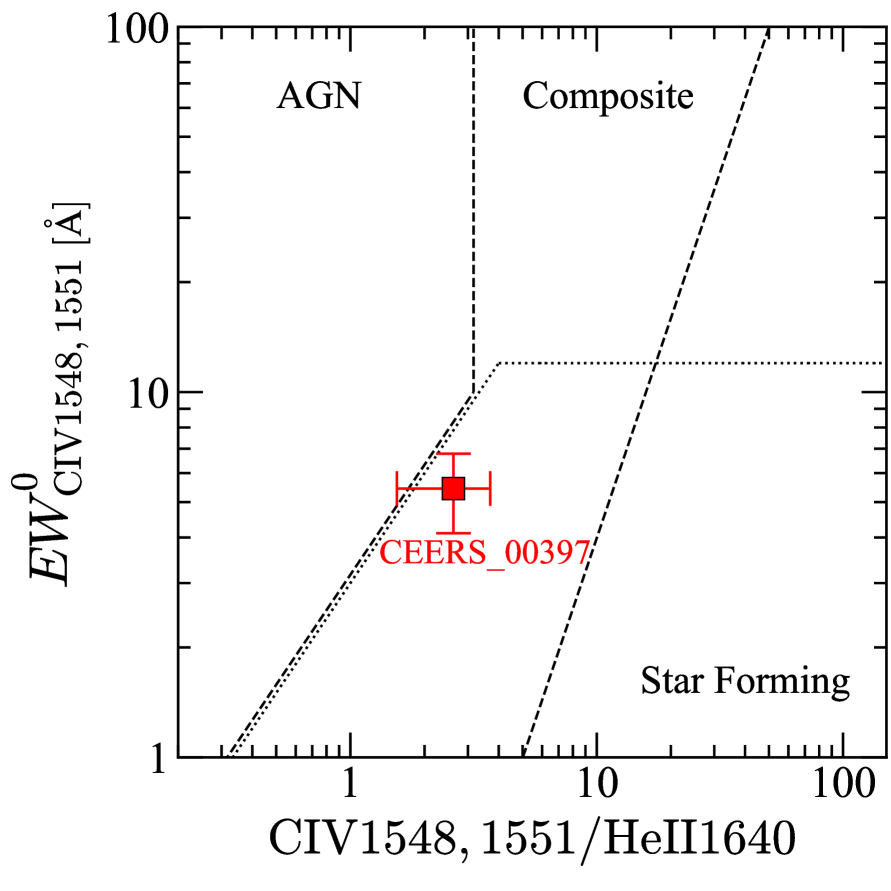
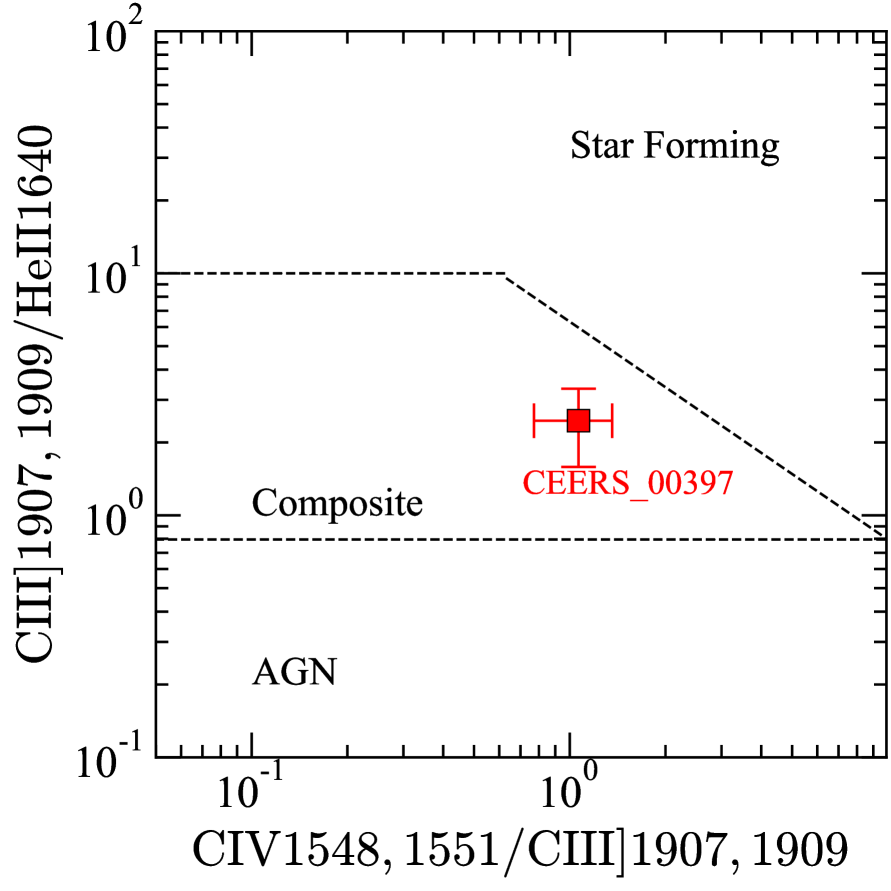
We have investigated the presence of rest-frame UV emission lines and rest-optical high-ionization lines in these galaxies having AGNs. We do not find significant high-ionization lines such as NeV3426 and Heii4686. Rest-frame UV Ciii]1907,1909 emission lines are seen in four objects, CEERS_01244, GLASS_150029, CEERS_01665, and CEERS_00397, with rest-frame equivalent widths (EW) of , comparable to both star-forming galaxies and AGNs (Nakajima et al. 2018). Among them, CEERS_00397 also shows broad () and redshifted () Civ1548,1551 and tentative Heii1640 lines (the top panels in Figure 10). As shown in the bottom panels in Figure 10, rest-UV diagnostics using Ciii], Civ, and Heii indicate that the AGN activity is partly contributing the these emission line fluxes but not dominating the total fluxes, which is consistent with its Seyfert-like nature.
| Name | ||||||
|---|---|---|---|---|---|---|
| () | () | () | () | |||
| CEERS_01244 | ||||||
| GLASS_160133 | ||||||
| GLASS_150029 | ||||||
| CEERS_00746 | ||||||
| CEERS_01665 | ||||||
| CEERS_00672 | ||||||
| CEERS_02782 | ||||||
| CEERS_00397 | ||||||
| CEERS_00717 | ||||||
| CEERS_01236 |
4.4 Relation
We estimate the black hole mass, , and bolometric luminosity, , of our AGNs. The black hole mass is estimated with the following equation calibrated at in Greene & Ho (2005):
| (16) |
where the is the extinction-correlated broad-line H luminosity, and is the FWHM of the broad H emission line. We use the broad-line luminosity as an input of Equation (4.4) following Kocevski et al. (2023), because it is not clear whether the narrow-line emission line seen in our AGNs originates from the AGN or Hii regions in its host galaxy. The estimated black hole masses are presented in Table 2. If we include the narrow line component in the H luminosity, the black hole mass increase by 0.1 dex on average (0.4 dex at the maximum).
Estimating the bolometric luminosity of our AGNs is not straightforward, because the continuum luminosities observed with the HST and JWST images are possibly significantly contributed by the lights from their host galaxies. Therefore, we instead estimate the bolometric luminosity from the H luminosity. Our best estimates of the bolometric luminosity, , comes from the following equation between the luminosity at the rest-frame , , and the H luminosity including both the broad and narrow components (Greene & Ho 2005):
| (17) |
and the relation between and with the bolometric correction in Richards et al. (2006), . Since it is not clear whether the narrow-line emission in our AGNs originates from the AGN or star formation in host galaxies, we set the lower limit of the bolometric luminosity using Equation (17) with the broad-line H luminosity as an input assuming that the narrow component comes from the host galaxy and the bolometric correction of in McLure & Dunlop (2004). As the upper limit, we use the following equation in Netzer (2009) calibrated with type-2 AGNs:
| (18) |
where the H luminosity is estimated from the extinction-corrected narrow-line H line assuming Case B recombination. The estimated bolometric luminosities are presented in Table 2.
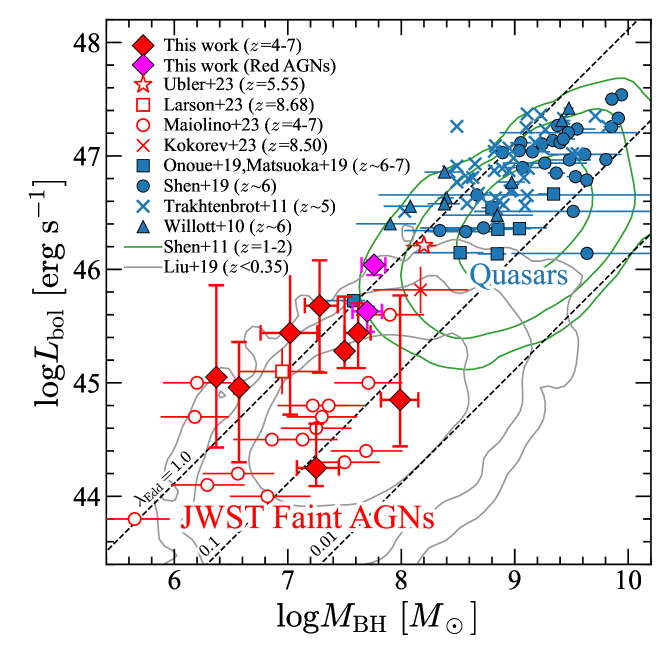
Figure 11 shows the estimated and of our AGNs. The black hole masses and bolometric luminosities of our AGNs are and , respectively, indicating that our AGNs have lower black hole masses and lower bolometric luminosities than quasars at identified in the ground-based observations (Trakhtenbrot et al. 2011; Matsuoka et al. 2019; Shen et al. 2019; Onoue et al. 2019). The two red AGNs show relatively higher and , indicating that these AGNs might be in the transition phase between the faint AGNs with low and low-luminosity quasars.
The black hole masses of our AGNs are comparable to those of AGNs in Liu et al. (2019), but our AGNs show bolometric luminosities higher than those of AGNs in Liu et al. (2019) on average, resulting in higher Eddington ratios (). This distribution of higher of our AGNs compared to those in may be due to selection bias, because AGNs with faint broad-line H emission may not be selected in our selection criteria with the signal-to-noise ratio threshold. Deeper NIRSpec spectroscopy is needed to investigate whether the AGNs at with have systematically higher than AGNs or not.
4.5 Relation
4.5.1 AGN-Host Decomposition
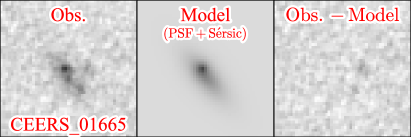
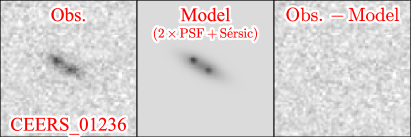
To estimate the stellar mass of AGN’s host galaxies, we conduct the AGN-host decomposition analysis using the high-resolution JWST and HST images, in the same manner as Zhang et al. (2023d). We conduct the two-dimensional decomposition by fitting the images of our AGNs in all bands with 1) a PSF profile only, 2) a PSF and a Sérsic profile, and 3) two PSFs and one Sérsic profile. For each band, we generate the PSF by selecting and stacking bright stars in the same fields. For the Sérsic profile, we restrict the Sérsic index to the range of . We find that CEERS_00746 and CEERS_00672 are well-fitted with a PSF only model, and their host galaxies are not seen. CEERS_02782 is also well fitted with a PSF, but a tentative residual is seen, possibly indicative of its host galaxy. The other sources are fitted with a PSF and a Sérsic profile, except for CEERS_01236, which is well fitted with a model of two PSFs and a Sérsic profile, indicating that this source could be a dual AGN. Examples of our results are shown in Figure 12, and fitted models are summarized in Table 3. For GLASS_160133, we cannot obtain a reasonable fitting solution with either PSF, PSFSérsic, or Sérsic models.
| Name | Fitting | |
|---|---|---|
| CEERS_01244 | PSFSérsic | |
| GLASS_160133† | ||
| GLASS_150029 | PSFSérsic | |
| CEERS_00746 | PSF | |
| CEERS_01665 | PSFSérsic | |
| CEERS_00672 | PSF | |
| CEERS_02782 | PSF | |
| CEERS_00397 | PSFSérsic | |
| CEERS_00717 | PSFSérsic | |
| CEERS_01236 | Sérsic |
† We cannot obtain a reasonable fitting solution for GLASS_160133. Thus we use the stellar mass estimated from the SED fitting to total lights as the upper limit for this object.
4.5.2 SED fitting
To estimate the stellar mass, we conduct SED fittings for host galaxy components using prospector (Johnson et al. 2021). The procedure of the SED fitting is the same as that of Harikane et al. (2023), except for the fixed redshifts based on the NIRSpec emission line measurements. We use the stellar population synthesis package, Flexible Stellar Population Synthesis (FSPS; Conroy et al. 2009; Conroy & Gunn 2010) for stellar SEDs, and include nebular emission from the photoionization models of Cloudy (Byler et al. 2017). We assume the Chabrier (2003) stellar initial mass function (IMF) of , the intergalactic medium (IGM) attenuation model of Madau (1995), the Calzetti et al. (2000) dust attenuation law, and a fixed metallicity of 0.2 . We choose a flexible star formation history as adopted in Harikane et al. (2023) with a continuity prior. The estimated stellar masses are presented in Table 3. The systematic uncertainty on the stellar mass due to the fixed prior is typically dex (Leja et al. 2019), which is smaller than the statistical uncertainty. For sources whose host galaxies are not seen (i.e., CEERS_00746, CEERS_00672, and CEERS_02782) and GLASS_160133, we estimate the stellar mass by fitting the total lights of that source with the galaxy templates using prospector, and use the derived value as the upper limit.
4.5.3 Result
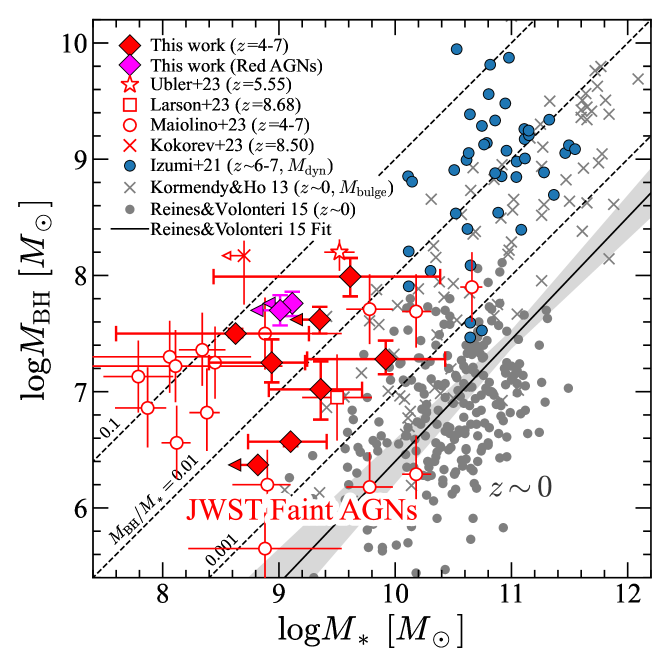
Figure 13 shows the stellar masses and black hole masses of our AGNs. Compared to the AGNs at (Reines & Volonteri 2015), our AGNs at have similar black hole masses but systematically lower stellar masses. Similar results are obtained in previous studies with a smaller number of AGNs (Kocevski et al. 2023; Übler et al. 2023; Kocevski et al. 2023), but we confirm this trend of lower (higher ) with a sample of 10 AGNs at . Our results at showing lower (higher ) than AGNs indicate that the black hole grows faster than its host galaxy at high redshift. The fast black hole growth is also suggested by previous studies at (e.g., Zhang et al. 2023d). Such over-massive black holes compared to their host stellar masses are indeed predicted in some theoretical simulations (e.g., Toyouchi et al. 2021; Trinca et al. 2022; Inayoshi et al. 2022; Hu et al. 2022; Zhang et al. 2023b).
| (mag) | ||
|---|---|---|
Note. — Errors are and upper limits are .
| Redshift | ||||||
|---|---|---|---|---|---|---|
| (mag) | ||||||
Note. — , , and are fixed to values in Harikane et al. (2022). Errors are .
4.6 UV Luminosity Function
We estimate the number density of our broad-line AGNs detected with NIRSpec. Since the selection function including the target selection completeness with NIRSpec/MSA is not known, we cannot precisely calculate the number density of our AGNs. Instead, we present rough estimates based on the spectroscopic results. We divide our AGN sample and the entire galaxy sample in Nakajima et al. (2023) into magnitude and redshift bins and calculate the fraction of the AGNs to the entire sources in each bin. Table 4 summarizes our calculated AGN fraction at each redshift and magnitude bin. Using this AGN fraction, , we estimate the number density of the AGNs, , from the galaxy UV luminosity function fitted with the double-power law form, , as
| (19) |
where the fitting parameters of the galaxy luminosity function are taken from Harikane et al. (2022), which are consistent with Adams et al. (2020, 2022). The error of the number density includes both the Poisson error (Gehrels 1986) and the cosmic variance. We estimate the cosmic variance following the procedures in Somerville et al. (2004), using the bias value of faint quasars at (He et al. 2018) and the effective volume assuming the survey area of ( NIRSpec pointings). Using the effective volume calculated here, we can also evaluate the lower limit of the number density based on the observed number of AGNs in each bin. If the lower limit calculated with is higher than the volume-based value, we replace the lower limit with the volume-based lower limit.
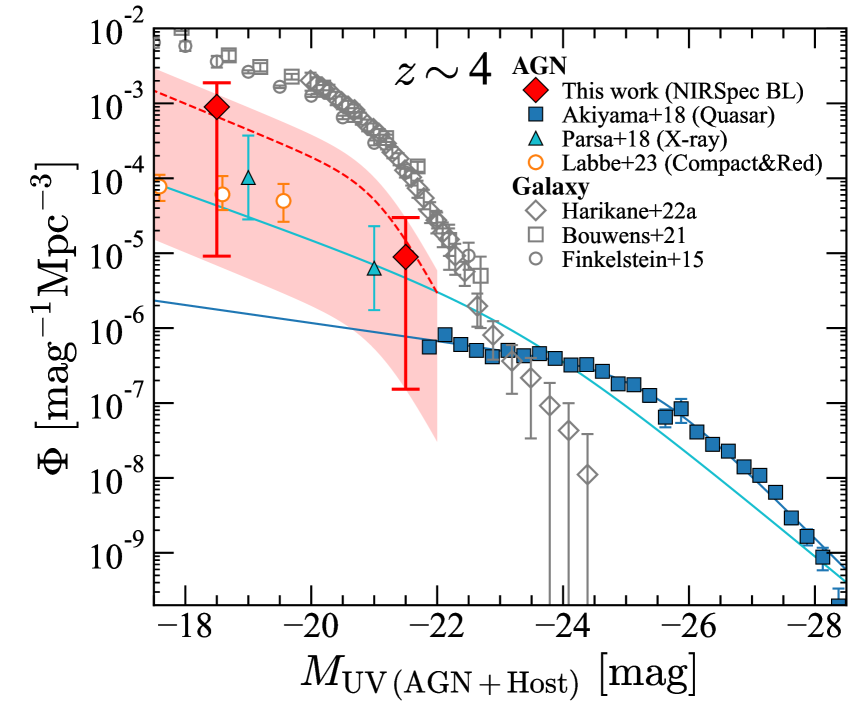

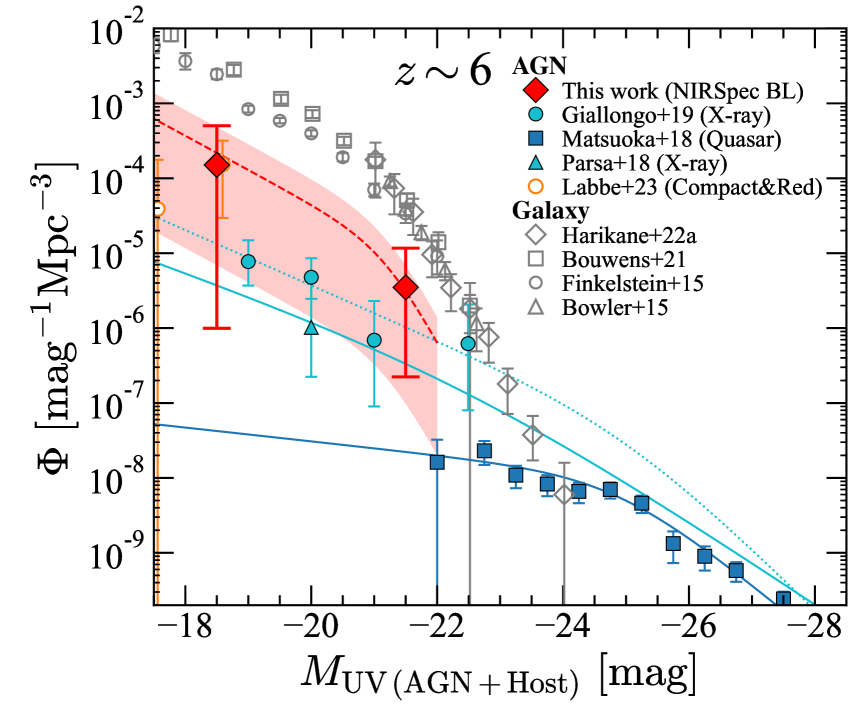
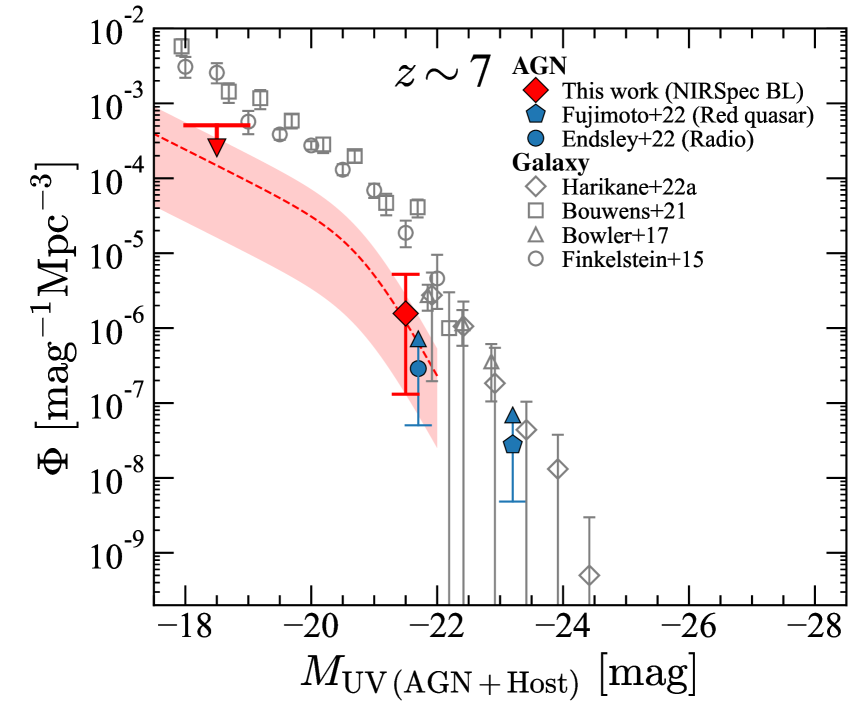
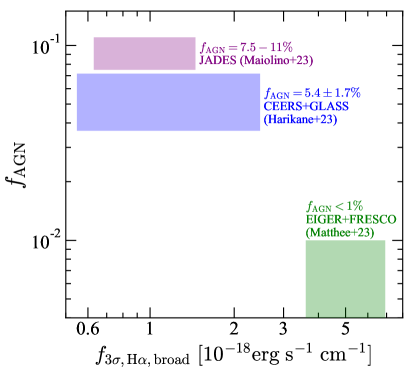
Figure 14 shows the calculated number densities of our AGNs at with previous measurements for AGNs and galaxies. Tables 4 and 5 present our number density estimates and parameters of the best-fit double power-law function,
| (20) |
The number density of our broad-line type-1 AGNs detected with NIRSpec is higher than an extrapolation of the quasar luminosity functions (Akiyama et al. 2018; Niida et al. 2020; Matsuoka et al. 2018), because these quasar studies only select compact objects. The best estimates of the number densities are higher than those of the X-ray selected AGNs (Parsa et al. 2018; Giallongo et al. 2019), probably due to the limited sensitivity in X-ray observations. Our best estimates are higher than Matthee et al. (2023) and lower than Maiolino et al. (2023), because of the difference in sensitivities and selection functions. As shown in Figure 15, the typical sensitivity of NIRCam Grism spectra in Matthee et al. (2023) is lower than those of the NIRSpec data in this study and Maiolino et al. (2023), resulting in the low AGN fraction in Matthee et al. (2023). The slightly higher AGN fraction in Maiolino et al. (2023) compared to this study may be due to the slightly higher typical sensitivity in the JADES data, or a biased selection to AGN candidates in the NIRSpec MSA target selection as discussed in Maiolino et al. (2023).
5 Discussion
5.1 Contribution to Cosmic Reionization
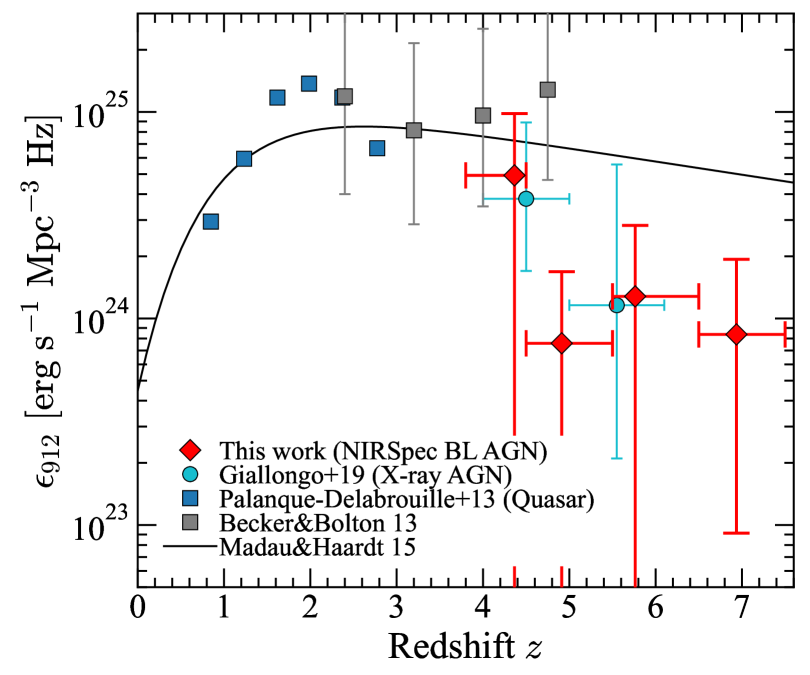
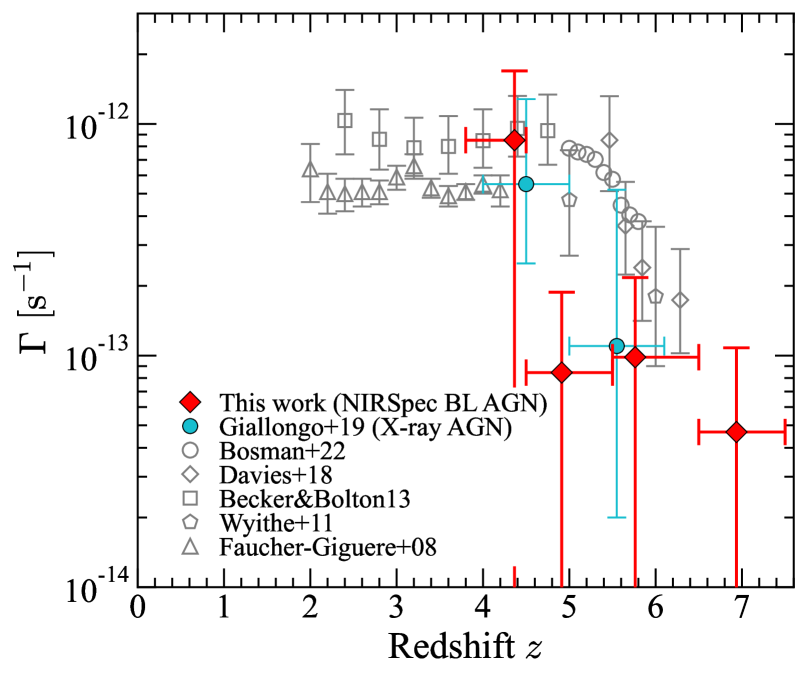
To discuss the contribution of our AGNs to cosmic reionization, we estimate the cosmic ionizing emissivity density, , and the cosmic photoionization rate, , following Giallongo et al. (2019). First, we estimate the rest-frame UV emissivity at , , by integrating the UV luminosity function at each redshift down to mag, the same limit as Giallongo et al. (2019). Since an AGN does not dominate all of the rest-frame UV light as discussed in Section 4.1, we multiply the UV luminosity density with the fraction of light from an AGN to all light including both an AGN and its host galaxy, which is estimated to be in rest-frame UV (1450 Å) based on the decomposition analysis in Section 4.5.1. Then we calculate from using the SED presented in Lusso et al. (2015) and an ionizing photon escape fraction. The escape fraction of faint AGNs is highly uncertain, with a variety of the values reported () by previous studies (e.g., Micheva et al. 2017; Grazian et al. 2018; Romano et al. 2019; Iwata et al. 2022). In this calculation, we assume . The photoionization rate, , is estimated from using an equation presented in Lusso et al. (2015). We increase the AGN emissivity by a factor of 1.2 to include the contribution by radiative recombination in the IGM following D’Aloisio et al. (2018). Calculated emissivities and photoionization rates are summarized in Table 5.
Figure 16 presents the cosmic ionizing emissivity density and the photoionization rate from our AGNs with previous measurements. The emissivities of our AGNs at are comparable to those of X-ray selected AGNs in Giallongo et al. (2019), although our AGNs selected with broad emission lines may not be the same population from X-ray selected AGNs. The cosmic photoionization rates from our AGNs are also comparable to those of X-ray-selected AGNs. At , the photoionization rate of our AGNs is lower than the measurement from the Ly forest analysis (e.g., Bosman et al. 2022; Davies et al. 2018; Wyithe & Bolton 2011). This indicates that such faint AGNs contribute to cosmic reionization, while the total contribution is not large, up to at , because of their faint nature.
5.2 Nature of the NIRSpec-Detected AGNs and Redshift Evolution
Our broad-line type-1 AGNs have low-mass black holes with . Given that more than half of the AGNs show extended morphologies, the total lights are partly dominated by lights from their host galaxies rather than those of the AGNs, suggesting that these AGNs are type-1 Seyfert galaxies. Some of them show weak broad H emission lines with a broad-to-narrow-line luminosity ratio of , suggesting that they are intermediate-type AGNs such as type 1.5, 1.8, and 1.9 Seyfert galaxies (Osterbrock 1981; Blandford 1990; Whittle 1992). Indeed, such a weak broad component observed in our AGNs is similarly seen in some Seyfert 1.5-1.9 galaxies (e.g., Stern & Laor 2012, their Figure 1). The moderate line width of the broad component () in some of our AGNs are comparable to those of narrow-line Seyfert 1 galaxies.
Although our AGNs are similar to intermediate-type AGNs seen in local universe, the fraction of such AGNs may increase toward higher redshifts. Our analysis indicates that about 5% of the galaxies at harbor faint type-1 AGNs, while studies of local AGNs implies that only 1-2% of galaxies with similar bolometric luminosities (, or ) are type-1 AGNs (Stern & Laor 2012). Spectroscopic studies for Lyman break galaxies indicate that of them are type-1 AGNs. Although a larger sample of broad-line AGNs at is needed, our study finding the high fraction () implies a possible redshift evolution of the type-1 AGN fraction.
Some of our AGNs show weak (but statistically significant) broad H emission lines compared to their narrow components with low broad-to-narrow line flux ratios, which are detected in the deep NIRspec spectra but will be missed in shallow spectroscopic observations. Although the broad emission lines are detected, the low broad-to-narrow line flux ratios suggest that these AGNs may be significantly contributed from Hii regions in their host galaxies, or partly obscured, implying a high obscured fraction in the universe at . Indeed, several X-ray observations indicate a higher fraction of obscured AGNs in the higher redshift universe at (e.g., Hasinger 2008; Ueda et al. 2014; Liu et al. 2017; Zappacosta et al. 2018; Iwasawa et al. 2020; Peca et al. 2023). From recent ALMA observations, Gilli et al. (2022) predict that AGNs at are significantly obscured by their host galaxies’ interstellar medium, which may reasonably explain the observed high obscured fraction at high redshifts. This indicates there may be many obscured AGNs (type-2 AGNs) in the universe possibly more than the type-1 AGNs we have identified, consistent with recent findings of heavily obscured AGNs at (Fujimoto et al. 2022; Endsley et al. 2022).
6 Summary
In this paper, we conduct a systematic search for broad-line emission in the JWST/NIRSpec deep spectra of a total of 185 galaxies at . We identify 10 faint type-1 AGNs at , two of which are reported in Kocevski et al. (2023), allowing us to conduct the first statistical census of such faint AGNs in the early universe. Our major findings are summarized below.
-
1.
Our faint AGNs show a broad emission line with only in the permitted H line (Figures 1-3). Their forbidden [Oiii]5007 line is detected with a higher signal-to-noise ratio than H, but show only narrow emission with . These spectral features are consistent with the fact that these objects are type-1 AGNs. The broad emission in some objects is very weak with a broad line-to-narrow line ratio of , comparable to those seen in local intermediate-type AGNs.
-
2.
High-resolution JWST/NIRCam and HST/ACS and WFC3 images reveal that seven AGNs in our sample show extended morphologies, indicating significant contributions to the total lights from their host galaxies (Figure 5). The remaining three objects are dominated by compact emission consistent with the PSF, and two of them show red SEDs implying that they are dusty compact AGNs (Figures 7 and 8).
-
3.
Our selected AGNs show narrow emission line ratios of high [Oiii]/H and low [Nii]/H, similar to star-forming galaxies at . These AGNs cannot be distinguished from normal star-forming galaxies with the classical BPT diagram (Figure 9), probably due to their low metallicities.
-
4.
Our faint AGNs have low-mass black holes with , remarkably lower than those of low-luminosity quasars previously identified at with ground-based telescopes (Figure 11). Our AGNs at show higher bolometric luminosities than AGNs at with similar black hole masses on average, possibly due to the selection bias. Deeper NIRSpec spectroscopy is needed to confirm this trend.
-
5.
We estimate the stellar masses of AGN’s host galaxies with careful AGN-host decomposition analyses. The estimated stellar masses are systematically lower than the black hole mass-stellar mass relation at (Figure 13). The lower stellar mass (higher black hole mass) at high redshifts implies fast black hole growth, which is consistent with predictions from theoretical simulations.
-
6.
We estimate that of galaxies at are type-1 AGNs on average, whose fraction is higher than that in local galaxies with similar luminosities. The estimated number density of our faint AGNs is higher than an extrapolation of the quasar UV luminosity functions and is comparable to those of X-ray selected AGNs (Figure 14). Estimates of the ionizing emissivity and photoionization rate by the faint AGNs indicate that such faint AGNs contribute to cosmic reionization, while the total contribution is not large, up to at , because of their faint nature (Figure 16).
This study demonstrates that NIRSpec spectroscopy is an efficient and powerful tool to find faint type-1 AGNs with low mass black holes that are embedded in their host galaxies. Future large NIRSpec observations will uncover a large number of high redshift faint AGNs, allowing us to investigate the galaxy-SMBH co-evolution in the early universe.
References
- Abazajian et al. (2009) Abazajian, K. N., Adelman-McCarthy, J. K., Agüeros, M. A., et al. 2009, ApJS, 182, 543
- Adams et al. (2020) Adams, N. J., Bowler, R. A. A., Jarvis, M. J., et al. 2020, MNRAS, 494, 1771
- Adams et al. (2022) Adams, N. J., Bowler, R. A. A., Jarvis, M. J., Varadaraj, R. G., & Häußler, B. 2022, arXiv e-prints, arXiv:2207.09342
- Aihara et al. (2018) Aihara, H., Arimoto, N., Armstrong, R., et al. 2018, PASJ, 70, S4
- Akaike (1974) Akaike, H. 1974, IEEE Transactions on Automatic Control, 19, 716
- Akiyama et al. (2018) Akiyama, M., He, W., Ikeda, H., et al. 2018, PASJ, 70, S34
- Anglés-Alcázar et al. (2017) Anglés-Alcázar, D., Faucher-Giguère, C.-A., Quataert, E., et al. 2017, MNRAS, 472, L109
- Bañados et al. (2016) Bañados, E., Venemans, B. P., Decarli, R., et al. 2016, ApJS, 227, 11
- Bañados et al. (2018) Bañados, E., Venemans, B. P., Mazzucchelli, C., et al. 2018, Nature, 553, 473
- Bagley et al. (2022) Bagley, M. B., Finkelstein, S. L., Koekemoer, A. M., et al. 2022, arXiv e-prints, arXiv:2211.02495
- Baldwin et al. (1981) Baldwin, J. A., Phillips, M. M., & Terlevich, R. 1981, PASP, 93, 5
- Becker & Bolton (2013) Becker, G. D., & Bolton, J. S. 2013, MNRAS, 436, 1023
- Bertin & Arnouts (1996) Bertin, E., & Arnouts, S. 1996, A&AS, 117, 393
- Bezanson et al. (2022) Bezanson, R., Labbe, I., Whitaker, K. E., et al. 2022, arXiv e-prints, arXiv:2212.04026
- Blandford (1990) Blandford, R. D. 1990, in Active Galactic Nuclei, ed. R. D. Blandford, H. Netzer, L. Woltjer, T. J. L. Courvoisier, & M. Mayor, 161–275
- Bogdan et al. (2023) Bogdan, A., Goulding, A., Natarajan, P., et al. 2023, arXiv e-prints, arXiv:2305.15458
- Bosman et al. (2022) Bosman, S. E. I., Davies, F. B., Becker, G. D., et al. 2022, MNRAS, 514, 55
- Bouwens et al. (2021) Bouwens, R. J., Oesch, P. A., Stefanon, M., et al. 2021, AJ, 162, 47
- Bowler et al. (2021) Bowler, R. A. A., Adams, N. J., Jarvis, M. J., & Häußler, B. 2021, MNRAS, 502, 662
- Bowler et al. (2017) Bowler, R. A. A., Dunlop, J. S., McLure, R. J., & McLeod, D. J. 2017, MNRAS, 466, 3612
- Bowler et al. (2015) Bowler, R. A. A., Dunlop, J. S., McLure, R. J., et al. 2015, MNRAS, 452, 1817
- Byler et al. (2017) Byler, N., Dalcanton, J. J., Conroy, C., & Johnson, B. D. 2017, ApJ, 840, 44
- Calzetti et al. (2000) Calzetti, D., Armus, L., Bohlin, R. C., et al. 2000, ApJ, 533, 682
- Carnall et al. (2023) Carnall, A. C., McLure, R. J., Dunlop, J. S., et al. 2023, Nature, 619, 716
- Chabrier (2003) Chabrier, G. 2003, PASP, 115, 763
- Conroy & Gunn (2010) Conroy, C., & Gunn, J. E. 2010, ApJ, 712, 833
- Conroy et al. (2009) Conroy, C., Gunn, J. E., & White, M. 2009, ApJ, 699, 486
- D’Aloisio et al. (2018) D’Aloisio, A., McQuinn, M., Davies, F. B., & Furlanetto, S. R. 2018, MNRAS, 473, 560
- Davies et al. (2018) Davies, F. B., Hennawi, J. F., Eilers, A.-C., & Lukić, Z. 2018, ApJ, 855, 106
- Di Matteo et al. (2005) Di Matteo, T., Springel, V., & Hernquist, L. 2005, Nature, 433, 604
- Ding et al. (2022) Ding, X., Onoue, M., Silverman, J. D., et al. 2022, arXiv e-prints, arXiv:2211.14329
- Endsley et al. (2022) Endsley, R., Stark, D. P., Lyu, J., et al. 2022, arXiv e-prints, arXiv:2206.00018
- Faucher-Giguère et al. (2008) Faucher-Giguère, C.-A., Lidz, A., Hernquist, L., & Zaldarriaga, M. 2008, ApJ, 688, 85
- Finkelstein et al. (2015) Finkelstein, S. L., Ryan, Jr., R. E., Papovich, C., et al. 2015, ApJ, 810, 71
- Finkelstein et al. (2022a) Finkelstein, S. L., Bagley, M., Song, M., et al. 2022a, ApJ, 928, 52
- Finkelstein et al. (2022b) Finkelstein, S. L., Bagley, M. B., Ferguson, H. C., et al. 2022b, arXiv e-prints, arXiv:2211.05792
- Förster Schreiber et al. (2014) Förster Schreiber, N. M., Genzel, R., Newman, S. F., et al. 2014, ApJ, 787, 38
- Freeman et al. (2019) Freeman, W. R., Siana, B., Kriek, M., et al. 2019, ApJ, 873, 102
- Fujimoto et al. (2022) Fujimoto, S., Brammer, G. B., Watson, D., et al. 2022, Nature, 604, 261
- Fujimoto et al. (2023) Fujimoto, S., Wang, B., Weaver, J., et al. 2023, arXiv e-prints, arXiv:2308.11609
- Furtak et al. (2022) Furtak, L. J., Zitrin, A., Plat, A., et al. 2022, arXiv e-prints, arXiv:2212.10531
- Furtak et al. (2023) Furtak, L. J., Labbé, I., Zitrin, A., et al. 2023, arXiv e-prints, arXiv:2308.05735
- Gallerani et al. (2017) Gallerani, S., Fan, X., Maiolino, R., & Pacucci, F. 2017, PASA, 34, e022
- Gebhardt et al. (2000) Gebhardt, K., Bender, R., Bower, G., et al. 2000, ApJ, 539, L13
- Gehrels (1986) Gehrels, N. 1986, ApJ, 303, 336
- Genzel et al. (2014) Genzel, R., Förster Schreiber, N. M., Rosario, D., et al. 2014, ApJ, 796, 7
- Giallongo et al. (2019) Giallongo, E., Grazian, A., Fiore, F., et al. 2019, ApJ, 884, 19
- Gilli et al. (2022) Gilli, R., Norman, C., Calura, F., et al. 2022, A&A, 666, A17
- Goulding et al. (2023) Goulding, A. D., Greene, J. E., Setton, D. J., et al. 2023, arXiv e-prints, arXiv:2308.02750
- Granato et al. (2004) Granato, G. L., De Zotti, G., Silva, L., Bressan, A., & Danese, L. 2004, ApJ, 600, 580
- Grazian et al. (2018) Grazian, A., Giallongo, E., Boutsia, K., et al. 2018, A&A, 613, A44
- Greene & Ho (2005) Greene, J. E., & Ho, L. C. 2005, ApJ, 630, 122
- Greene et al. (2023) Greene, J. E., Labbe, I., Goulding, A. D., et al. 2023, arXiv e-prints, arXiv:2309.05714
- Grogin et al. (2011) Grogin, N. A., Kocevski, D. D., Faber, S. M., et al. 2011, ApJS, 197, 35
- Habouzit et al. (2022) Habouzit, M., Onoue, M., Bañados, E., et al. 2022, MNRAS, 511, 3751
- Harikane et al. (2022) Harikane, Y., Ono, Y., Ouchi, M., et al. 2022, ApJS, 259, 20
- Harikane et al. (2023) Harikane, Y., Ouchi, M., Oguri, M., et al. 2023, ApJS, 265, 5
- Hashimoto et al. (2019) Hashimoto, T., Inoue, A. K., Mawatari, K., et al. 2019, PASJ, 71, 71
- Hasinger (2008) Hasinger, G. 2008, A&A, 490, 905
- He et al. (2018) He, W., Akiyama, M., Bosch, J., et al. 2018, PASJ, 70, S33
- Hirschmann et al. (2019) Hirschmann, M., Charlot, S., Feltre, A., et al. 2019, MNRAS, 487, 333
- Hirschmann et al. (2022) —. 2022, arXiv e-prints, arXiv:2212.02522
- Hopkins et al. (2006) Hopkins, P. F., Hernquist, L., Cox, T. J., et al. 2006, ApJS, 163, 1
- Hu et al. (2022) Hu, H., Inayoshi, K., Haiman, Z., et al. 2022, ApJ, 935, 140
- Inayoshi et al. (2022) Inayoshi, K., Nakatani, R., Toyouchi, D., et al. 2022, ApJ, 927, 237
- Inayoshi et al. (2020) Inayoshi, K., Visbal, E., & Haiman, Z. 2020, ARA&A, 58, 27
- Isobe et al. (2023) Isobe, Y., Ouchi, M., Nakajima, K., et al. 2023, arXiv e-prints, arXiv:2301.06811
- Iwasawa et al. (2020) Iwasawa, K., Comastri, A., Vignali, C., et al. 2020, A&A, 639, A51
- Iwata et al. (2022) Iwata, I., Sawicki, M., Inoue, A. K., et al. 2022, MNRAS, 509, 1820
- Izumi et al. (2018) Izumi, T., Onoue, M., Shirakata, H., et al. 2018, PASJ, 70, 36
- Izumi et al. (2019) Izumi, T., Onoue, M., Matsuoka, Y., et al. 2019, PASJ, 71, 111
- Izumi et al. (2021) Izumi, T., Matsuoka, Y., Fujimoto, S., et al. 2021, ApJ, 914, 36
- Johnson et al. (2021) Johnson, B. D., Leja, J., Conroy, C., & Speagle, J. S. 2021, ApJS, 254, 22
- Kashikawa et al. (2015) Kashikawa, N., Ishizaki, Y., Willott, C. J., et al. 2015, ApJ, 798, 28
- Kashino et al. (2017) Kashino, D., Silverman, J. D., Sanders, D., et al. 2017, ApJ, 835, 88
- Kauffmann et al. (2003) Kauffmann, G., Heckman, T. M., Tremonti, C., et al. 2003, MNRAS, 346, 1055
- Kawasaki et al. (2017) Kawasaki, K., Nagao, T., Toba, Y., Terao, K., & Matsuoka, K. 2017, ApJ, 842, 44
- Kewley et al. (2001) Kewley, L. J., Dopita, M. A., Sutherland, R. S., Heisler, C. A., & Trevena, J. 2001, ApJ, 556, 121
- Kocevski et al. (2023) Kocevski, D. D., Onoue, M., Inayoshi, K., et al. 2023, ApJ, 954, L4
- Koekemoer et al. (2011) Koekemoer, A. M., Faber, S. M., Ferguson, H. C., et al. 2011, ApJS, 197, 36
- Kokorev et al. (2023) Kokorev, V., Fujimoto, S., Labbe, I., et al. 2023, arXiv e-prints, arXiv:2308.11610
- Kormendy & Ho (2013) Kormendy, J., & Ho, L. C. 2013, ARA&A, 51, 511
- Labbe et al. (2023) Labbe, I., Greene, J. E., Bezanson, R., et al. 2023, arXiv e-prints, arXiv:2306.07320
- Laporte et al. (2017) Laporte, N., Nakajima, K., Ellis, R. S., et al. 2017, ApJ, 851, 40
- Larson et al. (2023) Larson, R. L., Finkelstein, S. L., Kocevski, D. D., et al. 2023, arXiv e-prints, arXiv:2303.08918
- Leja et al. (2019) Leja, J., Carnall, A. C., Johnson, B. D., Conroy, C., & Speagle, J. S. 2019, ApJ, 876, 3
- Li et al. (2007) Li, Y., Hernquist, L., Robertson, B., et al. 2007, ApJ, 665, 187
- Liu et al. (2019) Liu, H.-Y., Liu, W.-J., Dong, X.-B., et al. 2019, ApJS, 243, 21
- Liu et al. (2017) Liu, T., Tozzi, P., Wang, J.-X., et al. 2017, ApJS, 232, 8
- Lotz et al. (2017) Lotz, J. M., Koekemoer, A., Coe, D., et al. 2017, ApJ, 837, 97
- Lusso et al. (2015) Lusso, E., Worseck, G., Hennawi, J. F., et al. 2015, MNRAS, 449, 4204
- Madau (1995) Madau, P. 1995, ApJ, 441, 18
- Madau & Haardt (2015) Madau, P., & Haardt, F. 2015, ApJ, 813, L8
- Magorrian et al. (1998) Magorrian, J., Tremaine, S., Richstone, D., et al. 1998, AJ, 115, 2285
- Mainali et al. (2018) Mainali, R., Zitrin, A., Stark, D. P., et al. 2018, MNRAS, 479, 1180
- Maiolino et al. (2023) Maiolino, R., Scholtz, J., Curtis-Lake, E., et al. 2023, arXiv e-prints, arXiv:2308.01230
- Matsuoka et al. (2016) Matsuoka, Y., Onoue, M., Kashikawa, N., et al. 2016, ApJ, 828, 26
- Matsuoka et al. (2018) Matsuoka, Y., Strauss, M. A., Kashikawa, N., et al. 2018, ApJ, 869, 150
- Matsuoka et al. (2019) Matsuoka, Y., Onoue, M., Kashikawa, N., et al. 2019, ApJ, 872, L2
- Matthee et al. (2023) Matthee, J., Naidu, R. P., Brammer, G., et al. 2023, arXiv e-prints, arXiv:2306.05448
- McLure & Dunlop (2004) McLure, R. J., & Dunlop, J. S. 2004, MNRAS, 352, 1390
- Micheva et al. (2017) Micheva, G., Iwata, I., & Inoue, A. K. 2017, MNRAS, 465, 302
- Nakajima et al. (2023) Nakajima, K., Ouchi, M., Isobe, Y., et al. 2023, arXiv e-prints, arXiv:2301.12825
- Nakajima et al. (2018) Nakajima, K., Schaerer, D., Le Fèvre, O., et al. 2018, A&A, 612, A94
- Netzer (2009) Netzer, H. 2009, MNRAS, 399, 1907
- Niida et al. (2020) Niida, M., Nagao, T., Ikeda, H., et al. 2020, ApJ, 904, 89
- Oke & Gunn (1983) Oke, J. B., & Gunn, J. E. 1983, ApJ, 266, 713
- Onoue et al. (2017) Onoue, M., Kashikawa, N., Willott, C. J., et al. 2017, ApJ, 847, L15
- Onoue et al. (2019) Onoue, M., Kashikawa, N., Matsuoka, Y., et al. 2019, ApJ, 880, 77
- Onoue et al. (2023) Onoue, M., Inayoshi, K., Ding, X., et al. 2023, ApJ, 942, L17
- Osterbrock (1981) Osterbrock, D. E. 1981, ApJ, 249, 462
- Palanque-Delabrouille et al. (2013) Palanque-Delabrouille, N., Magneville, C., Yèche, C., et al. 2013, A&A, 551, A29
- Parsa et al. (2018) Parsa, S., Dunlop, J. S., & McLure, R. J. 2018, MNRAS, 474, 2904
- Peca et al. (2023) Peca, A., Cappelluti, N., Urry, C. M., et al. 2023, ApJ, 943, 162
- Peng et al. (2002) Peng, C. Y., Ho, L. C., Impey, C. D., & Rix, H.-W. 2002, AJ, 124, 266
- Planck Collaboration et al. (2020) Planck Collaboration, Aghanim, N., Akrami, Y., et al. 2020, A&A, 641, A6
- Pontoppidan et al. (2022) Pontoppidan, K. M., Barrientes, J., Blome, C., et al. 2022, ApJ, 936, L14
- Reines & Volonteri (2015) Reines, A. E., & Volonteri, M. 2015, ApJ, 813, 82
- Richards et al. (2006) Richards, G. T., Lacy, M., Storrie-Lombardi, L. J., et al. 2006, ApJS, 166, 470
- Romano et al. (2019) Romano, M., Grazian, A., Giallongo, E., et al. 2019, A&A, 632, A45
- Romano et al. (2021) Romano, M., Cassata, P., Morselli, L., et al. 2021, A&A, 653, A111
- Sanders et al. (2023) Sanders, R. L., Shapley, A. E., Topping, M. W., Reddy, N. A., & Brammer, G. B. 2023, arXiv e-prints, arXiv:2301.06696
- Shapley et al. (2015) Shapley, A. E., Reddy, N. A., Kriek, M., et al. 2015, ApJ, 801, 88
- Shen et al. (2019) Shen, Y., Wu, J., Jiang, L., et al. 2019, ApJ, 873, 35
- Somerville et al. (2004) Somerville, R. S., Lee, K., Ferguson, H. C., et al. 2004, ApJ, 600, L171
- Steidel et al. (2014) Steidel, C. C., Rudie, G. C., Strom, A. L., et al. 2014, ApJ, 795, 165
- Steinhardt et al. (2020) Steinhardt, C. L., Jauzac, M., Acebron, A., et al. 2020, ApJS, 247, 64
- Stern & Laor (2012) Stern, J., & Laor, A. 2012, MNRAS, 423, 600
- Storey & Zeippen (2000) Storey, P. J., & Zeippen, C. J. 2000, MNRAS, 312, 813
- Swinbank et al. (2019) Swinbank, A. M., Harrison, C. M., Tiley, A. L., et al. 2019, MNRAS, 487, 381
- Tilvi et al. (2016) Tilvi, V., Pirzkal, N., Malhotra, S., et al. 2016, ApJ, 827, L14
- Toyouchi et al. (2021) Toyouchi, D., Inayoshi, K., Hosokawa, T., & Kuiper, R. 2021, ApJ, 907, 74
- Trakhtenbrot et al. (2011) Trakhtenbrot, B., Netzer, H., Lira, P., & Shemmer, O. 2011, ApJ, 730, 7
- Treu et al. (2022) Treu, T., Roberts-Borsani, G., Bradac, M., et al. 2022, arXiv e-prints, arXiv:2206.07978
- Trinca et al. (2022) Trinca, A., Schneider, R., Valiante, R., et al. 2022, MNRAS, 511, 616
- Übler et al. (2023) Übler, H., Maiolino, R., Curtis-Lake, E., et al. 2023, arXiv e-prints, arXiv:2302.06647
- Ueda et al. (2014) Ueda, Y., Akiyama, M., Hasinger, G., Miyaji, T., & Watson, M. G. 2014, ApJ, 786, 104
- Valentini et al. (2021) Valentini, M., Gallerani, S., & Ferrara, A. 2021, MNRAS, 507, 1
- Valiante et al. (2017) Valiante, R., Agarwal, B., Habouzit, M., & Pezzulli, E. 2017, PASA, 34, e031
- Vanden Berk et al. (2001) Vanden Berk, D. E., Richards, G. T., Bauer, A., et al. 2001, AJ, 122, 549
- Wang et al. (2021) Wang, F., Yang, J., Fan, X., et al. 2021, ApJ, 907, L1
- Whittle (1992) Whittle, M. 1992, ApJS, 79, 49
- Willott et al. (2010a) Willott, C. J., Albert, L., Arzoumanian, D., et al. 2010a, AJ, 140, 546
- Willott et al. (2010b) Willott, C. J., Delorme, P., Reylé, C., et al. 2010b, AJ, 139, 906
- Wyithe & Bolton (2011) Wyithe, J. S. B., & Bolton, J. S. 2011, MNRAS, 412, 1926
- Xu et al. (2022) Xu, Y., Ouchi, M., Rauch, M., et al. 2022, ApJ, 929, 134
- Yang et al. (2020) Yang, J., Wang, F., Fan, X., et al. 2020, ApJ, 897, L14
- Zappacosta et al. (2018) Zappacosta, L., Comastri, A., Civano, F., et al. 2018, ApJ, 854, 33
- Zhang et al. (2023a) Zhang, H., Behroozi, P., Volonteri, M., et al. 2023a, MNRAS, 518, 2123
- Zhang et al. (2023b) —. 2023b, arXiv e-prints, arXiv:2303.08150
- Zhang et al. (2023c) Zhang, Y., Ouchi, M., Nakajima, K., et al. 2023c, arXiv e-prints, arXiv:2306.07940
- Zhang et al. (2023d) Zhang, Y., Ouchi, M., Gebhardt, K., et al. 2023d, arXiv e-prints, arXiv:2303.02929
- Zhu et al. (2022) Zhu, Q., Li, Y., Li, Y., et al. 2022, MNRAS, 514, 5583
- Zitrin et al. (2015) Zitrin, A., Labbé, I., Belli, S., et al. 2015, ApJ, 810, L12