A Physical Model for the Origin of Quasar Lifetimes
Abstract
We propose a model of quasar lifetimes in which observational quasar lifetimes and an intrinsic lifetime of rapid accretion are strongly distinguished by the physics of obscuration by surrounding gas and dust. Quasars are powered by gas funneled to galaxy centers, but for a large part of the accretion lifetime they are heavily obscured by the large gas densities powering accretion. During this obscured phase, starbursts and black hole growth are fueled but the quasar is buried. Eventually, feedback from the accretion energy disperses surrounding gas and creates a window in which the black hole is observable optically as a quasar, until the accretion rate drops below that required to maintain a quasar luminosity. We model this process and measure the unobscured and intrinsic quasar lifetimes in a hydrodynamical simulation of a major galaxy merger. The bolometric luminosity of the source is determined from the black hole accretion rate, calculated from the local gas properties. We calculate the column density of hydrogen to the central galactic black hole along multiple lines-of-sight in the simulation, and use these column densities and the gas metallicity to determine the B-band attenuation of the central source. Defining the observable quasar lifetime as the total time with an observed B-band luminosity greater than some lower limit , we find lifetimes Myr for (), in good agreement with observationally determined quasar lifetimes. These numbers are significantly smaller than the “intrinsic” lifetime Myr obtained if attenuation is neglected. We find similar lifetimes defined by an observed bolometric luminosity greater than of the Eddington luminosity. The ratio of observed lifetimes to intrinsic lifetime is also strong function of both the limiting luminosity and the observed frequency.
Subject headings:
quasars: general — galaxies: nuclei — galaxies: active — galaxies: evolution — cosmology: theory1. Introduction
The recent discovery of a strong correlation between the velocity dispersion of galaxy spheroids and the mass of their central, supermassive black holes (Ferrarese & Merritt, 2000; Gebhardt et al., 2000) suggests that their evolution is strongly linked. One of the most fundamental parameters of black hole growth is the quasar lifetime , which sets the length of rapid black hole growth. Observational estimates generally constrain the net quasar lifetime to the range yr (for a review see Martini, 2004). These estimates are primarily based on demographic or integral arguments which combine observations of the present-day population of supermassive black holes and accretion by the high-redshift quasar population (e.g., Soltan, 1982; Haehnelt, Natarajan, & Rees, 1998; Yu & Tremaine, 2002; Yu & Lu, 2004), or incorporate quasars into models of galaxy evolution (e.g., Kauffmann & Haehnelt, 2000; Wyithe & Loeb, 2002; Di Matteo et al., 2003; Granato et al., 2004). Recent results from clustering in quasar surveys (e.g., Porciani, Magliocchetti, & Norberg, 2004; Grazian et al., 2004) similarly suggest lifetimes a few yr.
These estimates constrain only the total time a supermassive black hole is radiating above a quasar luminosity threshold, and do not address a scenario in which a supermassive black hole experiences multiple short, episodic quasar phases. A minimum episodic lifetime yr is required to explain the proximity effect in the Ly forest (Bajtlik, Duncan, & Ostriker, 1988), while multi-epoch observations give a minimum lifetime yr (Martini & Schneider, 2003), but recent observations of the proximity effect in high-redshift QSOs (Haiman & Cen, 2002; Yu & Lu, 2005) and the transverse proximity effect in He II (Jakobsen et al., 2003) also imply a lifetime of yr. If the net and episodic lifetimes are similar and yr, quasars could be produced by the relatively rare mergers of equal mass, gas rich galaxies. This mechanism has some good observational support (Heckman et al., 1984; Hutchings & Neff, 1992), and is also favored theoretically, as major mergers can efficiently dissipate angular momentum and drive gas to the center of galaxies (e.g., Hernquist, 1989; Barnes & Hernquist, 1991, 1996; Mihos & Hernquist, 1996).
Theoretical models of supermassive black hole evolution and its correlation with galaxy structure predict that, beyond a certain threshold, the feedback energy of the black hole accretion expels nearby gas and shuts down the accretion phase (Ciotti & Ostriker, 1997, 2001; Silk & Rees, 1998; Wyithe & Loeb, 2003). However, these models do not predict the characteristic lifetime of the accretion phase prior to its self-termination, but usually take it to be an independent input parameter of the model. The input lifetime is either taken from observational estimates or assumed to be similar to a characteristic timescale such as the dynamical time of the host galaxy disk or the -folding time for Eddington-limited black hole growth yr for accretion with radiative efficiency and (Salpeter, 1964).
However, recent hydrodynamical simulations (Di Matteo, Springel, & Hernquist, 2005; Springel, Di Matteo, & Hernquist, 2005b), which include black holes, associated gas accretion and feedback processes during galaxy mergers, have shown that black hole growth is determined by the gas supply and terminates abruptly when significant gas is expelled as a result of the coupling of radiative feedback energy from black hole accretion to the surrounding gas. This determines a timescale for a strong accretion phase - i.e. a quasar phase for the black hole - of (for a Milky Way mass system). This timescale is approximately equal to the gas inflow timescale, set by the time when strong torques are present in the central region, and is substantially shorter than the merger timescale of (Hernquist, 1989; Barnes & Hernquist, 1991, 1996). The timescale for associated starbursts can be similarly understood as dependent on large densities and thus related to the timescale of gas inflow (Mihos & Hernquist, 1994, 1996). In order to compare the quasar lifetime predicted in these simulations with the observational estimates of the quasar lifetime, mostly inferred from visible wavelength observations, is necessary to take into account additional physical mechanisms.
Previous theoretical models of supermassive black hole and quasar evolution assume that the observed quasar lifetime and the lifetime of the accretion phase are the same. However, the accretion rate is tied to the surrounding density of gas, and quasar activity occurs when material is efficiently channeled to the center of the galaxy onto the supermassive black hole. Therefore, the time(s) of greatest accretion activity are likely to also have the largest obscuring column density, especially if the line-of-sight column to the black hole is dominated by the density in the central, most dense regions of the galaxy. The corresponding attenuation may render the quasar unobservable in some bands or lower its observed luminosity below the quasar threshold, giving a shorter observed lifetime than intrinsic lifetime. Modeling this effect is necessary to estimate the intrinsic quasar lifetimes from observations, as well as for using theoretically motivated accretion models to predict the quasar luminosity function and space density of present-day supermassive black holes. Further, this effect can account for the presence of an obscured population of quasars which are missed by optical, UV, or soft X-ray surveys but significantly contribute to the cosmic X-ray background (Brandt & Hasinger, 2005, and references therein). Similarly, re-processing of quasar radiation by dust in a large obscuring column can account for and model observations of luminous and ultra-luminous infrared galaxies, which show evidence of both merger activity and obscured AGN in their cores (e.g., Sanders & Mirabel, 1996; Komossa et al., 2003).
In this paper, we propose a model of quasar lifetimes in which quasars are created and fed in major mergers, but for a large part of the accretion lifetime they are heavily obscured by the large gas densities powering accretion. Eventually, feedback from the accretion energy drives away gas, creating a brief window in which the central object is observable as a quasar, until accretion levels drop below quasar thresholds. To test this, we determine quasar lifetimes from a simulation of a major merger of gas-rich galaxies, calculating the effects of obscuration. Using a model for black hole accretion and associated feedback developed by Springel, Di Matteo, & Hernquist (2005b); Di Matteo, Springel, & Hernquist (2005), the simulation allows us to determine unambiguously the intrinsic lifetime of a strong accretion phase in the merger. By simultaneously tracing the column densities along different lines-of-sight from the simulation supermassive black hole, here we calculate the observed luminosity in visible wavelengths, and determine a lifetime over which the AGN would be observed as a quasar, with luminosity above some threshold. We find that there is a significant difference between the intrinsic lifetime and the observable value, and find that our predicted observed lifetimes agree well with the observational estimates, with a substantially longer intrinsic lifetime.
2. The Simulations
The simulations used the GADGET-2 code, a new version of the parallel TreeSPH code GADGET (Springel, Yoshida, & White, 2001). It uses an entropy-conserving formulation of SPH (Springel & Hernquist, 2002), and includes radiative cooling, heating by a UV background, and a sub-resolution model of a two-phase structure of the dense ISM to describe star formation and supernova feedback (Springel & Hernquist, 2003). This sub-resolution model gives an effective equation of state which includes pressure feedback from supernovae heating, and allows us to stably evolve even massive pure gaseous disks (see, e.g. Robertson et al. 2004). The methodology of accretion, feedback, and galaxy generation is described in detail in Springel, Di Matteo, & Hernquist (2005b). In particular, in this model, supermassive black holes (BHs) are represented by “sink” particles that accrete gas from their local environment, with an accretion rate estimated from the local gas density and sound speed using a Bondi-Hoyle-Lyttleton parameterization with an imposed upper limit equal to the Eddington rate. The bolometric luminosity of the BH particle is then , with the accretion efficiency. We further assume that a small fraction () of couples dynamically to the surrounding gas, and this feedback is injected as thermal energy. This fraction is a free parameter, determined in Di Matteo, Springel, & Hernquist (2005) by fitting to the - relation. We do not attempt to resolve the small-scale accretion dynamics near the black hole, but instead assume that the time-averaged accretion can be estimated from the gas properties on the scale of our spatial resolution ( pc).
We generate two stable, isolated disk galaxies, each with an extended dark matter halo with a Hernquist (1990) profile, an exponential gas disk, and a bulge. Our simulation is one of the series described in detail in Springel, Di Matteo, & Hernquist (2005a), with virial velocity , a fiducial choice with a rotation curve and mass similar to the Milky Way. We begin our simulation with pure gaseous disks, which may better correspond to the high-redshift galaxies in which most quasars are observed. Each galaxy is initially composed of 168000 dark matter halo particles, 8000 bulge particles, 24000 gaseous disk particles, and one BH particle, with a small initial seed mass of . Given these choices, the dark matter, gas, and star particles are all of roughly equal mass, and central cusps in the dark matter and bulge profiles (Hernquist, 1990) are reasonably well resolved. The galaxies are then set to collide in a pure prograde encounter with zero orbital energy and a pericenter separation of .
3. Column Densities & Quasar Attenuation
We calculate the column density between a black hole and a hypothetical observer from the simulation outputs spaced every 10 Myr before and after the merger and every 5 Myr during the merger (1.14 - 1.71 Gyr). We first generate radial lines-of-sight (rays), each with its origin at the black hole particle location and with directions uniformly spaced in solid angle . For each ray, we then begin at the origin, calculate and record the local gas properties using GADGET, and then move a distance along the ray , where and is the local SPH smoothing length. The process is repeated until a ray is sufficiently far from its origin ( kpc). The gas properties along a given ray can then be integrated to give the line-of-sight column density and mean metallicity. We test different values of and find that gas properties along a ray converge rapidly and change smoothly for and smaller. We similarly test different numbers of rays and find that the distribution of line-of-sight properties converges for rays.
Given the local gas properties, we use the GADGET two-phase equilibrium model of the ISM described in Springel & Hernquist (2003) to calculate the local mass fraction in “hot” (diffuse) and “cold” (molecular and HI cloud) phases of dense gas, and assuming pressure equilibrium between the two phases we obtain the density of the local hot and cold phase gas and the corresponding volume filling factors. These values correspond roughly to the fiducial values of McKee & Ostriker (1977). Using only the hot-phase density allows us to place an effective lower limit on the column density along a particular line of sight, as it assumes a ray passes only through the diffuse ISM, with of the mass of the dense ISM concentrated in cold-phase “clumps.” Given the small volume filling factor () and cross section of such clouds, we expect that the majority of sightlines will pass only through the “hot-phase” medium, with rare outliers dominated by single clouds along the line of sight (covering fraction ).
Using , we model the form of the intrinsic quasar continuum SED following Marconi et al. (2004), based on optical through hard X-ray observations (e.g., Elvis et al., 1994; George et al., 1998; Vanden Berk et al., 2001; Perola et al., 2002; Telfer et al., 2002; Ueda et al., 2003; Vignali et al., 2003). This gives a B-band luminosity , where , and we take Å. We then use a gas-to-dust ratio to determine the extinction along a given line of sight at this frequency. Observations suggest that the majority of the population of reddened quasars have reddening curves similar to that of the Small Magellenic Cloud (SMC) (Hopkins et al., 2004), which has a gas-to-dust ratio lower than the Milky Way by approximately the same factor as its metallicity (Bouchet et al., 1985). We consider both a gas-to-dust ratio equal to that of the Milky Way, , and a gas-to-dust ratio scaled by metallicity, . For both cases we use the SMC-like reddening curve of Pei (1992). We do not perform a full radiative transfer calculation but defer this to a future paper, and therefore do not model scattering or re-processing of radiation by dust.


4. Results
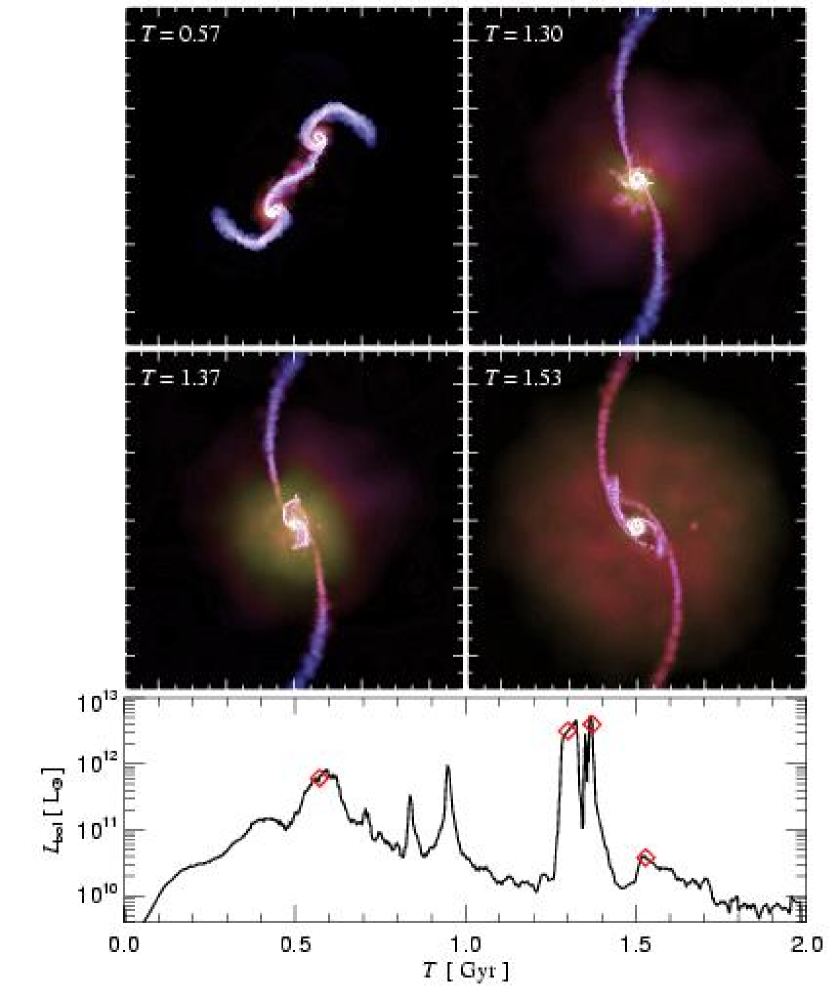
Figure 1 shows the simulation SPH particles at four representative times during the run, with the bolometric luminosity of the supermassive black hole as a function of time below. After the first passage (upper left), there is an extended period of strong accretion, but central gas densities are very large and the intrinsic quasar luminosity will be attenuated well below our quasar threshold of (). Once the merger begins (upper right), the intrinsic luminosity peaks as gas is channeled to the merging cores. However, this also results in very large columns which similarly obscure the quasar. After a short time (lower left), feedback from the quasar clears out the gas in the central regions and the object may be observable as a quasar. Shortly after the merger (lower right), gas has been consumed by star formation and accretion or expelled from the center and densities have dropped well below the levels needed to fuel quasar activity.
Figure 2 shows the bolometric luminosity of and column densities to the supermassive black hole as a function of simulation time, for the period shortly before and after the merger (). The median column densities and 25%-75% contours are shown for the total average simulation density, and the calculated hot-phase density, as described in § 3.We note that the metallicity-weighted column densities show little difference from the non-weighted columns. This is because the column is dominated by large densities in the central, most dense regions, where star formation rates (and thus metallicities) are large. The bolometric luminosity shows a strong rise above during the merger, but the column densities simultaneously become very large, up to for the total column density and for the hot-phase column. These values correspond to the large columns seen towards obscured quasars and suggest that the quasar will not be observable at visible wavelengths for a significant fraction of this period.
We quantify the resulting quasar lifetimes in Figure 3. For each sightline, an observed lifetime is determined as the integrated time in the simulation during which the given sightline sees a B-band luminosity above a given threshold, . The histogram plots the fraction of sightlines with a particular observed quasar lifetime , spaced in logarithmic bins. Lifetimes are calculated using the metallicity-weighted hot-phase density. Using the total (cold-phase) column density attenuates the quasar below this limit along all sightlines at all times. The line at yr shows the intrinsic lifetime along all sightlines if attenuation is ignored. We note that below 5 Myr (the simulation output frequency) our estimates of become uncertain owing to the effects of variability and our inability to resolve the local small-scale physics of the ISM. However, the more reliable estimates of a typical observation, from the hot-phase column density, lie well above this limit. The majority of such sightlines see lifetimes in the range Myr, in good agreement with observations suggesting lifetimes yr. The longest observable lifetimes in this case are approximately Myr, of the intrinsic strong accretion-phase lifetime. We also show the observed lifetime with an inferred bolometric luminosity (calculated from the observed using the bolometric corrections defined in § 3) greater than , where is the Eddington luminosity for the black hole mass at a given time ( for the final black hole mass ), and find similar lifetimes.
In Figure 4 we plot the quasar lifetime as a function of the limiting B-band luminosity . The uppermost curve shows the intrinsic lifetime , the total time the intrinsic . The bottom curves show the integrated time that the observed B-band luminosity meets this criterion, using the total metallicity-weighted column density of the simulation. The solid curve shows the integrated time, weighted by the fraction of sightlines along which the above definition is met []. The dotted curve shows the integrated time during which of sightlines meet the criterion, and the dashed curve the integrated time during which of sightlines meet the criterion. The middle curves show the same, using the hot-phase density. In all cases, changing the definition of based on the fraction of sightlines with a given column does not significantly change . However, is, unsurprisingly, a strong function of . The observed is significantly smaller than the intrinsic lifetime for all , and the ratio decreases with increasing . We also plot the lifetime as a function of , the ratio of the inferred bolometric luminosity to the Eddington luminosity, and find a similar trend.
5. Conclusions
We find that incorporating the effects of obscuration in a galaxy merger simulation gives observed quasar lifetimes of , in good agreement with observational estimates. For a significant fraction of the intrinsic lifetime for quasar activity, the object is heavily obscured, and attenuated well below observable limits in the B-band. The significant difference between the observed and intrinsic lifetimes is critical for modeling quantities dependent on observed lifetimes, such as the quasar luminosity function. This distinction must also be accounted for in comparing these quantities with others which depend on the much larger intrinsic lifetimes, such as the present-day population of supermassive black holes or the cosmic X-ray background spectrum. Furthermore, our model naturally predicts that the observed lifetime is itself a function of the observed frequency, an effect that must be considered in extending an observed quasar luminosity function to other wavelengths or using observational constraints of quasar lifetimes to study the infrared and X-ray backgrounds. Estimates of the fraction of nuclear or starbursting galaxies with nuclear activity must similarly combine multiwavelength observations as optical or IR observations alone may miss a large fraction of AGN.
Our model predicts that self-regulating feedback processes in galaxy mergers reproduce observed quasar lifetimes naturally, in the final stages of strong accretion as feedback removes nearby gas. In determining the lifetime and evolution of accretion these feedback processes must be taken into account. Major merger scenarios using this model reproduce observed lifetimes of quasars with approximately equivalent episodic and total observed lifetimes. The population of obscured quasars is a natural consequence of the model, not as an independent population but as a stage in the “standard” evolution of quasars over their lifetime, before feedback can clear sufficient material to render the quasar visible.
As the black hole growth and column densities are strong functions of the galaxy sizes and merger conditions, we defer a full treatment of the statistics of quasar lifetime distributions as a function of these parameters to a following paper. However, the relationship between observed and intrinsic quasar lifetimes should remain qualitatively similar under a wide range of initial conditions, as it is determined by feedback mechanisms in the final stages of black hole growth. Using this model, a wider examination of simulations will allow for a consistent prediction of quasar lifetimes as a function of observed wavelength, redshift, and host galaxy properties.
References
- Bajtlik, Duncan, & Ostriker (1988) Bajtlik, S., Duncan, R. C., & Ostriker, J. P. 1988, ApJ, 327, 570
- Barnes & Hernquist (1991) Barnes, J. E. & Hernquist, L. 1991, ApJ, 370, L65
- Barnes & Hernquist (1996) Barnes, J. E. & Hernquist, L. 1996, ApJ, 471, 115
- Bouchet et al. (1985) Bouchet, P., Lequeux, J., Maurice, E., Prevot, L., & Prevot-Burnichon, M. L. 1985, A&A, 149, 330
- Brandt & Hasinger (2005) Brandt, W.N., Hasinger G., 2005, A. Rev.A.& A, in press
- Ciotti & Ostriker (1997) Ciotti, L. & Ostriker, J. P. 1997, ApJ, 487, L105
- Ciotti & Ostriker (2001) Ciotti, L. & Ostriker, J. P. 2001, ApJ, 551, 131
- Di Matteo et al. (2003) Di Matteo, T., Croft, R. A. C, Springel, V., & Hernquist, L. 2003, ApJ, 593, 56
- Di Matteo, Springel, & Hernquist (2005) Di Matteo, T., Springel, V., & Hernquist, L. 2005, Nature, in press
- Elvis et al. (1994) Elvis, M., et al. 1994, ApJS, 95, 1
- Ferrarese & Merritt (2000) Ferrarese, L. & Merritt, D. 2000, ApJ, 539, L9
- Gebhardt et al. (2000) Gebhardt, K., Bender, R., Bower, G. et al. 2000, ApJ, 539, L13
- George et al. (1998) George, I. M., Turner, T. J., Netzer, H., Nandra, K., Mushotzsky, R. F., & Yaqoob, T. 1998, ApJS, 114, 73
- Granato et al. (2004) Granato G.L., De Zotti G., Silva L., Bressan A., Danese L., 2004, ApJ, 600, 580
- Grazian et al. (2004) Grazian, A., Negrello, M., Moscardini, L., Cristiani, S., Haehnelt, M. G., Matarrese, S., Omizzolo, A., & Vanzella, E. 2004, AJ, 127, 592
- Haehnelt, Natarajan, & Rees (1998) Haehnelt, M. G., Natarajan, P., & Rees, M. J. 1998, MNRAS, 300, 817
- Haiman & Cen (2002) Haiman, Z. & Cen, R. 2002, ApJ, 578, 702
- Heckman et al. (1984) Heckman, T. M., Bothun, G. D., Balick, B., & Smith, E. P. 1984, AJ, 89, 958
- Hernquist (1989) Hernquist, L. 1989, Nature, 340, 687
- Hernquist (1990) Hernquist, L. 1990, ApJ, 356, 359
- Hopkins et al. (2004) Hopkins, P. F., et al. 2004, AJ, 128, 1112
- Hutchings & Neff (1992) Hutchings, J. B., & Neff, S. G. 1992, AJ, 104, 1
- Jakobsen et al. (2003) Jakobsen, P., Jansen, R. A., Wagner, S., & Reimers, D. 2003, A&A, 397, 891
- Kauffmann & Haehnelt (2000) Kauffmann, G. & Haehnelt, M. 2000, MNRAS, 311, 576
- Komossa et al. (2003) Komossa, S., Burwitz, V., Hasinger, G., Predehl, P., Kaastra, J. S., & Ikebe, Y. 2003, ApJ, 582, L15
- Marconi et al. (2004) Marconi, A., Risaliti, G., Gilli, R., Hunt, L. K., Maiolino, R., & Salvati, M. 2004, MNRAS, 351, 169
- Martini & Schneider (2003) Martini, P. & Schneider, D. P. 2003, ApJ, 597, L109
- Martini (2004) Martini, P. 2004, in Carnegie Obs. Astrophys. Ser. 1, Coevolution of Black Holes and Galaxies, ed. L.C. Ho (Cambridge: Cambridge Univ. Press), 170
- McKee & Ostriker (1977) McKee, C. F. & Ostriker, J. P. 1977, ApJ, 218, 148
- Mihos & Hernquist (1994) Mihos, J. C., & Hernquist, L. 1994, ApJ, 437, 611
- Mihos & Hernquist (1996) Mihos, J.C. & Hernquist, L. 1996, ApJ, 464, 641
- Pei (1992) Pei, Y. C. 1992, ApJ, 395, 130
- Perola et al. (2002) Perola, G. C., Matt, G., Cappi, M., Fiore, F., Guainazzi, M., Maraschi, L., Petrucci, P. O., & Piro, L. 2002, A&A, 389, 802
- Porciani, Magliocchetti, & Norberg (2004) Porciani, C., Magliocchetti, M., & Norberg, P. 2004, MNRAS, 355, 1010
- Robertson et al. (2004) Robertson, B., Yoshida, N., Springel, V., & Hernquist, L. 2004, ApJ, 606, 32
- Salpeter (1964) Salpeter, E. E. 1964, ApJ, 140, 796
- Sanders & Mirabel (1996) Sanders, D. B. & Mirabel, I. F. 1996, ARA&A, 34, 749
- Silk & Rees (1998) Silk, J. & Rees, M. J. 1998, A&A, 331, L1
- Soltan (1982) Soltan, A. 1982, MNRAS, 200, 115
- Springel, Di Matteo, & Hernquist (2005a) Springel, V., Di Matteo, T., & Hernquist, L. 2005a, ApJ, submitted, (astro-ph/0409436)
- Springel, Di Matteo, & Hernquist (2005b) Springel, V., Di Matteo, T., & Hernquist, L. 2005b, MNRAS, submitted, (astro-ph/0411108)
- Springel & Hernquist (2002) Springel, V. & Hernquist, L. 2002, MNRAS, 333, 649
- Springel & Hernquist (2003) Springel, V. & Hernquist, L. 2003, MNRAS, 339, 289
- Springel, Yoshida, & White (2001) Springel, V., Yoshida, N., & White, S. D. M. 2001, New Astronomy, 6, 79
- Telfer et al. (2002) Telfer, R. C., Zheng, W., Kriss, G. A., & Davidsen, A. F. 2002, ApJ, 565, 773
- Ueda et al. (2003) Ueda, Y., Akiyama, M., Ohta, K., & Miyaji, T. 2003, ApJ, 598, 886
- Vanden Berk et al. (2001) Vanden Berk, D. E., et al.2001, AJ, 122, 549
- Vignali et al. (2003) Vignali, C., Brandt, W. N., & Schneider, D. P. 2003, AJ, 125, 433
- Wyithe & Loeb (2002) Wyithe, J. S. B. & Loeb, A. 2002, ApJ, 581, 886
- Wyithe & Loeb (2003) Wyithe, J. S. B. & Loeb, A. 2003, ApJ, 595, 614
- Yu & Lu (2004) Yu, Q. & Lu, Y. 2004, ApJ, 602, 603
- Yu & Lu (2005) Yu, Q. & Lu, Y. 2005, ApJ, accepted, in press (astro-ph/0411098)
- Yu & Tremaine (2002) Yu, Q. & Tremaine, S. 2002, MNRAS, 335, 965