UNCOVER spectroscopy confirms a surprising ubiquity of AGN in red galaxies at
Abstract
is revealing a new population of dust-reddened broad-line active galactic nuclei (AGN) at redshifts . Here we present deep NIRSpec/Prism spectroscopy from the Cycle 1 Treasury program UNCOVER of 17 AGN candidates selected to be compact, with red continua in the rest-frame optical but with blue slopes in the UV. From NIRCam photometry alone, they could have been dominated by dusty star formation or AGN. Here we show that the majority of the compact red sources in UNCOVER are dust-reddened AGN: 60% show definitive evidence for broad-line H with FWHM km/s, for 20% current data are inconclusive, and are brown dwarf stars. We propose an updated photometric criterion to select red AGN that excludes brown dwarfs and is expected to yield AGN. Remarkably, among all galaxies with F277WF444W in UNCOVER at least are AGN regardless of compactness, climbing to at least % AGN for sources with F277WF444W. The confirmed AGN have black hole masses of . While their UV-luminosities ( AB mag) are low compared to UV-selected AGN at these epochs, consistent with percent-level scattered AGN light or low levels of unobscured star formation, the inferred bolometric luminosities are typical of black holes radiating at of Eddington. The number densities are surprisingly high at Mpc-3 mag-1, 100 times more common than the faintest UV-selected quasars, while accounting for of the UV-selected galaxies. While their UV-faintness suggest they may not contribute strongly to reionization, their ubiquity poses challenges to models of black hole growth.
1 Introduction
Over the past decade, large-area surveys have discovered hundreds of UV-luminous active galactic nuclei (AGN) at (e.g., Mortlock et al., 2011; Bañados et al., 2018; Fan et al., 2019; Wang et al., 2021; Harikane et al., 2022; Fan et al., 2022). Unlike lower redshifts, the number densities of UV-selected AGN at are not strongly luminosity dependent for fainter than mag (Matsuoka et al., 2018, 2023), while the galaxy LF rises steeply, so that UV-selected AGN fainter than about mag make up % of the galaxy population at high redshift. Determining whether or not black hole growth is preceding or lagging galaxy growth at these epochs has important implications for the seeding and co-evolution of black holes and galaxies (e.g., Volonteri & Reines, 2016; Dayal et al., 2019a; Inayoshi et al., 2020; Greene et al., 2020; Zhang et al., 2023a), for the sources of reionization (e.g., Madau & Haardt, 2015; Dayal et al., 2020a; Trebitsch et al., 2023), and potentially for the sources of gravitational waves (e.g., Amaro-Seoane et al., 2023; Somalwar & Ravi, 2023).
With the advent of the James Webb Space Telescope ( Gardner et al., 2023), we have begun to identify the heretofore missing UV-faint AGN. They have been discovered through broad Balmer lines (Kocevski et al., 2023; Harikane et al., 2023; Oesch et al., 2023; Larson et al., 2023; Übler et al., 2023; Barro et al., 2023; Matthee et al., 2023; Maiolino et al., 2023), from color and morphology (Onoue et al., 2023; Ono et al., 2022; Furtak et al., 2023a; Endsley et al., 2022; Hainline et al., 2023a; Leung et al., 2023; Yang et al., 2023), and from X-ray emission (Bogdan et al., 2023; Goulding et al., 2023). The number densities of these -selected sources is roughly a few percent of the galaxy population, and while they are UV faint, their implied bolometric luminosities span a broad range ( erg/s), implying a wide range of .
An interesting sub-component of the -selected AGN population are quite red (e.g., F2777F444W¿1) (see also Fujimoto et al., 2022; Furtak et al., 2023a). For instance, Matthee et al. (2023) spectroscopically identified a sample of broad-line AGN that all appear as “little red dots” with steep red continua in the rest-frame optical (see also Kocevski et al., 2023). Other +broad-line selected samples show large red fractions of 10-20% (Harikane et al., 2023; Maiolino et al., 2023). At , reddened broad-line AGN are known (e.g., Glikman et al., 2012; Banerji et al., 2015), but these particular spectral energy distributions, with both a steep red optical continuum and an additional UV component are quite rare (e.g., Noboriguchi et al., 2019).
What has not been clear to date is whether a photometrically selected sample of compact red sources with a significant UV component are dominated by AGN as well, or whether they may be powered by star formation (Barro et al., 2023; Akins et al., 2023; Maiolino et al., 2023). Recently, we (Labbé et al., 2023a, L23 hereafter) published a large photometric sample of compact red sources from the Cycle 1 program UNCOVER (Bezanson et al., 2022). We have now obtained follow-up NIRSpec spectroscopy for 15 of the 40 galaxies presented in L23. Here, we explore the nature of the sample, and show that our selection indeed provides a very high yield of AGN.
2 Data, Sample, and Spectroscopic Follow-up
In this section we briefly describe the UNCOVER survey (§2.1 Bezanson et al., 2022) and the MSA/PRISM spectroscopy and reductions 2.2. Many exciting results have already come from the PRISM spectroscopy of the compact red sources, including a triply-imaged AGN (Furtak et al., 2023b), a broad-line AGN at z=8.5 (Kokorev et al., 2023; Fujimoto et al., 2023a), and three brown dwarfs which can show similar SEDs as red AGN (Langeroodi et al., 2023; Burgasser et al., 2023). We have also reported two galaxies (Wang et al., 2023a), and some of the faintest known targets in the epoch of reionization (Atek et al., 2023a).
2.1 UNCOVER Photometry
Our search is performed using the JWST Cycle 1 Treasury program Ultradeep NIRSpec and NIRCam ObserVations before the Epoch of Reionization (UNCOVER; Bezanson et al., 2022). UNCOVER imaging was completed in November 2022, comprising ultradeep ( AB mag) imaging over 45 arcmin2 in the galaxy cluster Abell 2744. This well-studied Frontier Field cluster (Lotz et al., 2017) at has one of the largest high-magnification areas of known clusters, and thus made an excellent target for deep (4-6 hours per filter) imaging across seven NIRCam filters (F115W, F150W, F200W, F277W, F356W, F410M, F444W). The nominal depth of mag can comfortably reach sources as faint as 31.5 mag with the help of magnification. Photometric catalogs (Weaver et al., 2023) including existing HST data have been made available to the public, and the lens model is also publicly available (Furtak et al., 2023c). The initial selection of objects is based on the UNCOVER Data Release DR1 images and catalogs (Weaver et al., 2023).
Fujimoto et al. (2023b) present deep ALMA 1.2 mm continuum imaging in Abell 2744. A wider, deeper 1.2 mm map of the full NIRCam UNCOVER area was newly obtained in Cycle 9 (#2022.1.00073.S; S. Fujimoto in prep), reaching continuum r.m.s. sensitivity of in the deepest areas. Prior-based photometry is extracted for all sources by measuring the ALMA flux in the natural resolution map (beam ) at the NIRCam positions.
The UNCOVER region additionally has full coverage with high spatial resolution X-ray imaging using the Chandra ACIS-I detector, which upon completion will be at 2.3 Ms depth (PI:A.Bogdan). This X-ray data has already identified the highest-redshift X-ray AGN to date, UHZ-1, spectroscopically confirmed at (Bogdan et al., 2023; Goulding et al., 2023). There is also deep Jansky Very Large Array data from program 22A-017 (PI Murphy) that may provide complementary radio imaging.
2.2 PRISM Spectroscopy and Reductions
2.2.1 MSA Observational Setup
All 17 spectroscopic targets were observed with the Micro-Shutter Assembly (MSA) follow-up program of the UNCOVER field Abell 2744 (Bezanson et al., 2022). The UNCOVER NIRSpec/PRISM observations were taken over 7 MSA configurations. These observations employed a 2-POINT-WITH-NIRCam-SIZE2 dither pattern and a 3 shutter slit-let nod pattern at an aperture angle of degrees. The observational design for the photometric component is described in detail in Bezanson et al. (2022), the catalog is described by Weaver et al. (2023), the photometric redshifts are explored in some depth by Wang et al. (2023b), and the spectroscopic experimental design and reductions are explained by Price et al. (2023, in prep).
2.2.2 NIRSpec/PRISM Data Reduction
The data reduction is performed with msaexp (v0.6.10, Brammer, 2022), beginning from the level 2 products downloaded from MAST111Available from: http://dx.doi.org/10.17909/8k5c-xr27. msaexp then corrects for 1/f noise, masks snowballs, and removes the bias frame-by-frame. The reduction pipeline is used to apply WCS, to identify each slit, and then to perform flat-fielding and to apply photometric correction. 2D slits are extracted and drizzled onto a common grid to make vertically shifted and stacked 2D spectra, to which a local background subtraction is applied. The optimal extraction uses a Gaussian model on the collapsed spectrum with a free center and width (e.g., Horne, 1986). To flux calibrate the spectra, the single-mask extracted 1D spectra are convolved with the broad/medium band filters, and then we compare to the total photometry (Weaver et al. 2023), and model the wavelength dependent linear correction with a first order polynomial. Reduced data will be presented in Price et al. (2023, in prep).
2.3 Gravitational magnification
Throughout this study we use the latest version (v1.1) of the Furtak et al. (2023c) strong lensing model of Abell 2744222The v1.1 lensing maps are publicly available at https://jwst-uncover.github.io/DR1.html#LensingMaps. The parametric strong lensing model was constructed with an updated version of the Zitrin et al. (2015) parameteric method (Pascale et al., 2022; Furtak et al., 2023c) and includes 421 cluster member galaxies and five smooth cluster-scale dark matter halos. The v1.1 has been updated with 5 new multiple image systems and and additional spectroscopic redshifts (Bergamini et al., 2023), and is thus constrained with 141 multiple images belonging to 48 sources across the several main clumps of the cluster. The final lens plane image reproduction error is . We compute magnifications and their uncertainties for our sample at each object’s position and spectroscopic redshift.
3 Photometric and Spectroscopic Sample
First, we briefly review the basic properties of the photometrically selected AGN sample (§3.1, L23), then we summarize the objects targeted for MSA/PRISM spectroscopy.
3.1 Sample of Red Compact Sources
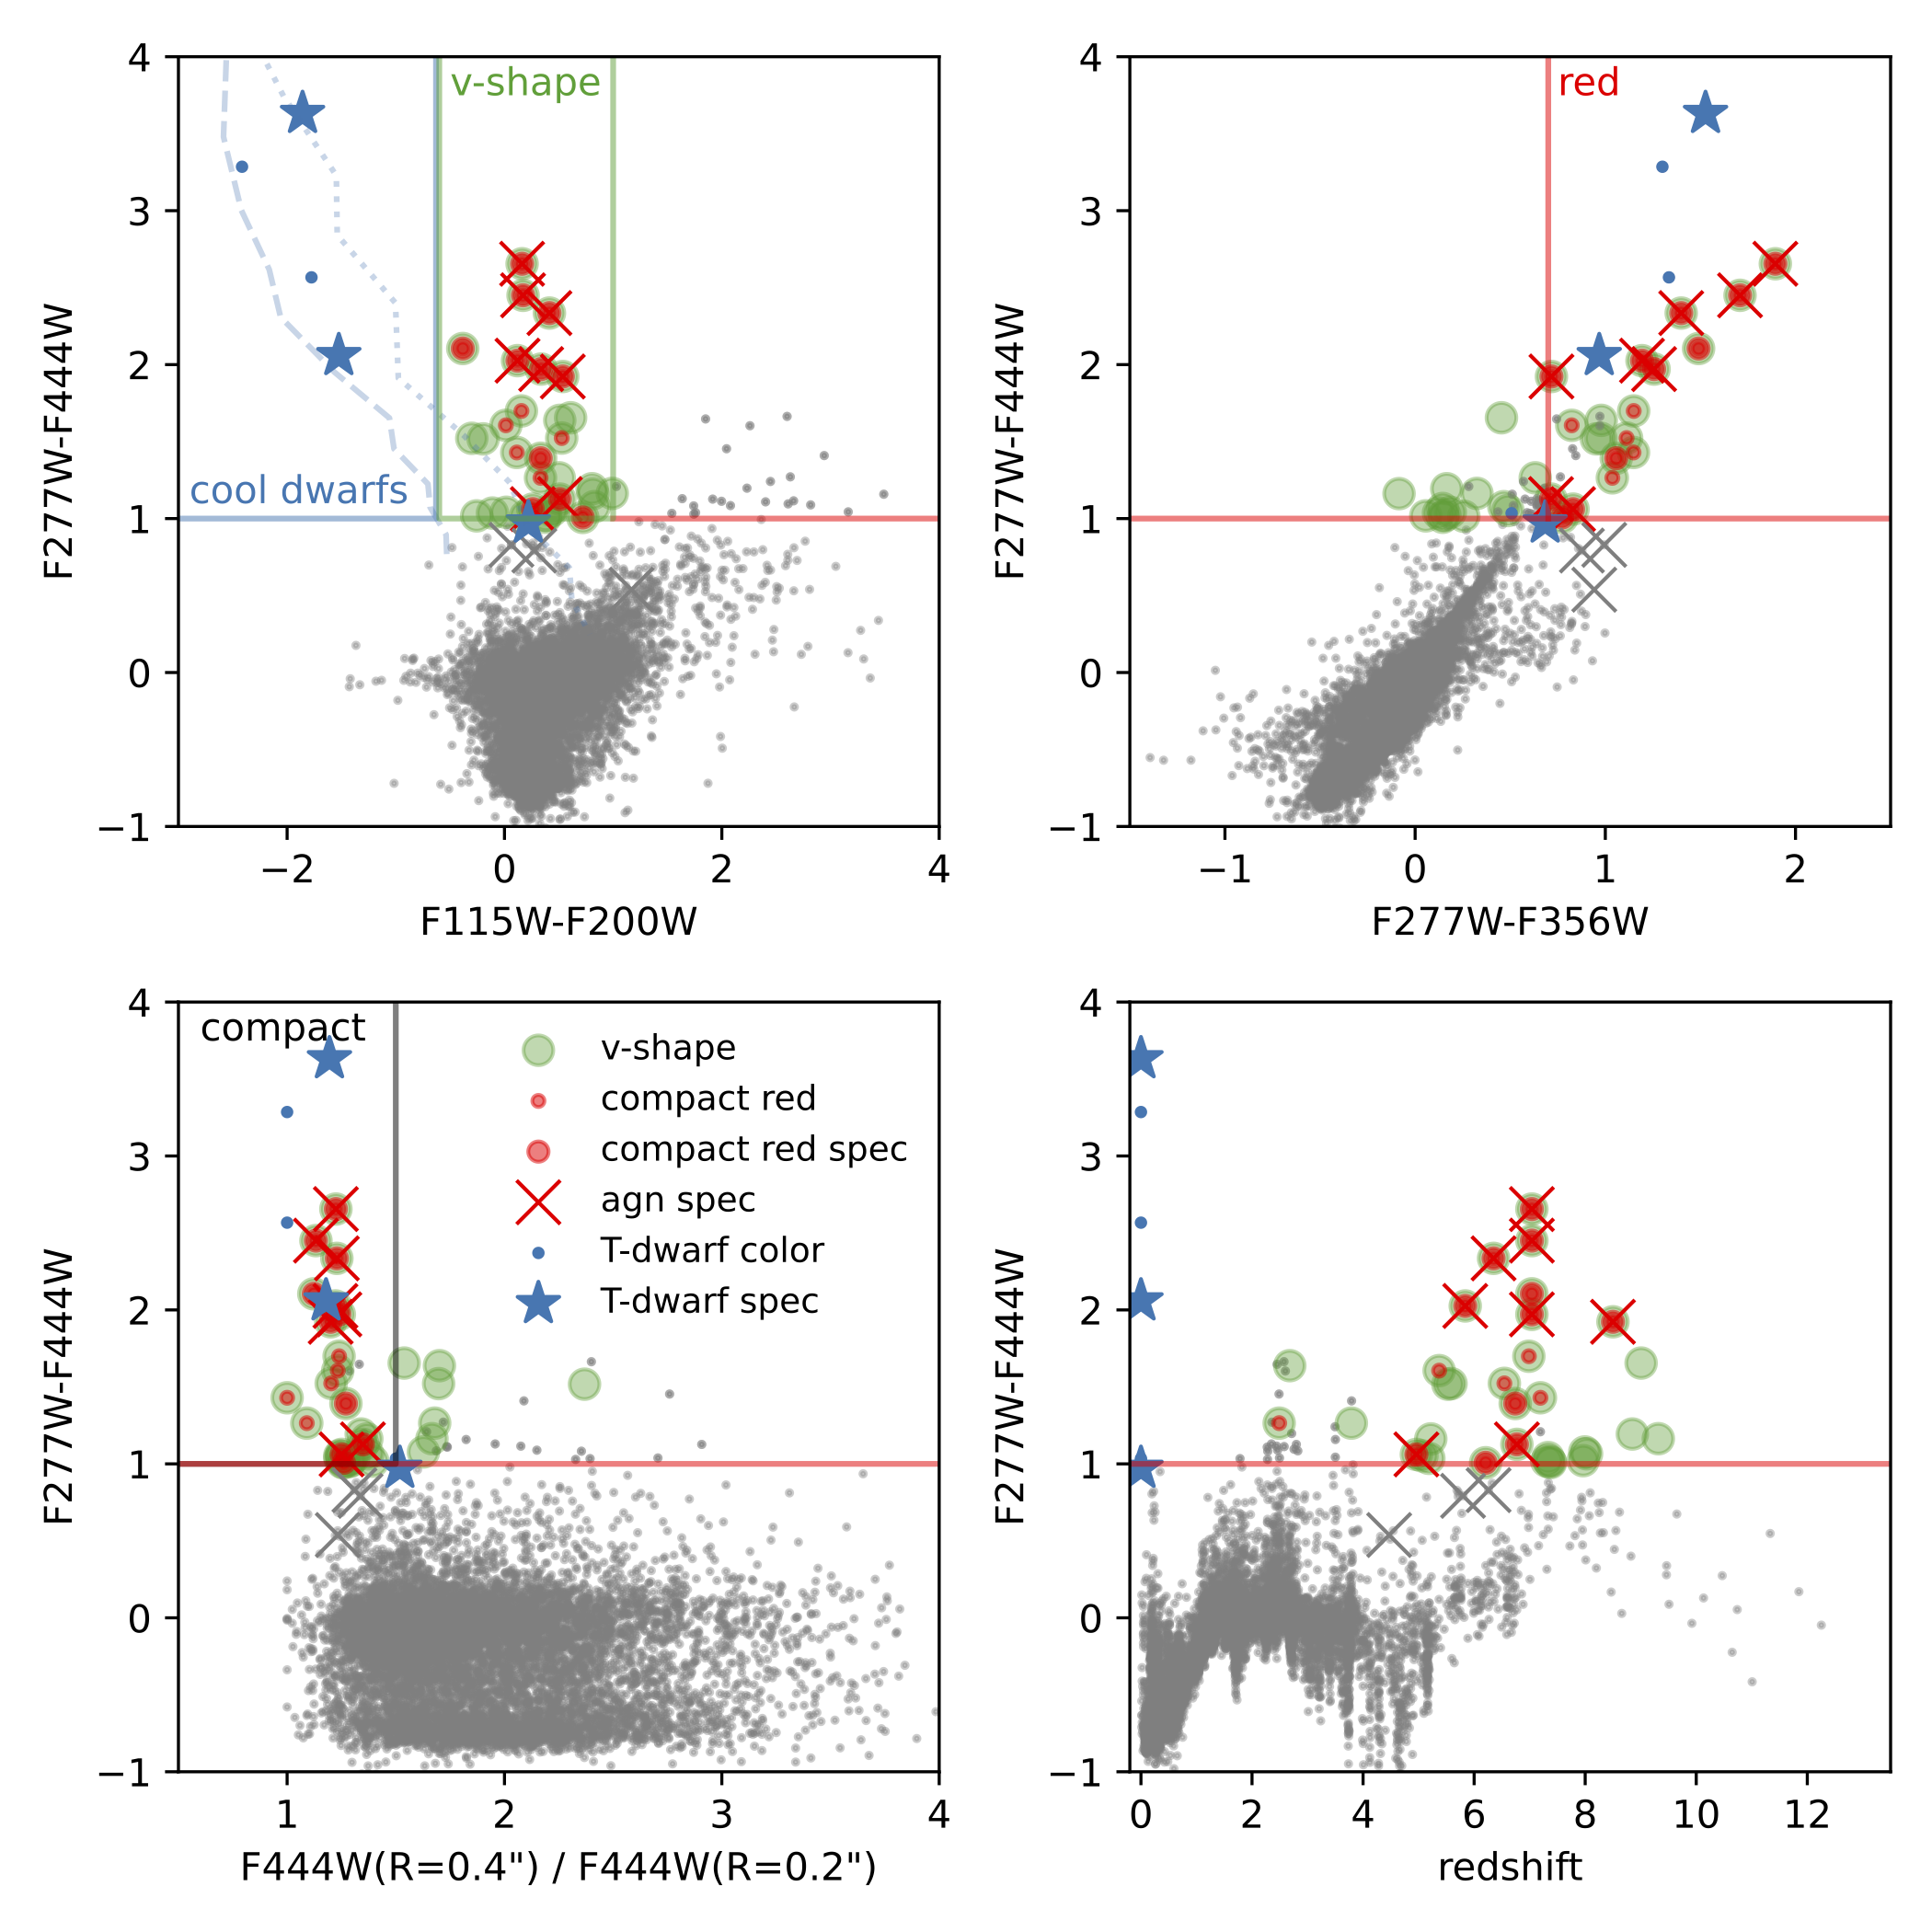
We build the photometric sample of AGN candidates in a number of key steps. First we select compact and red sources, with the following color and morphology cuts. With mag within a 0.32″ aperture, we select sources that are (red1 red2 ) & compact, where
And:
for measured within a 0.4″ diameter aperture. This initial sample comprises 40 sources, the “compact red” sample. We show the full selection in Figure 1; the main difference between and is that favors higher redshift galaxies owing to the redder filters used. The sample accounts for of the photometric sample and has been the focus for spectroscopic follow-up, representing of spectroscopic targets.
For context, L23 color criteria, specifically , to select the compact red sample are similar to those used by Labbé et al. (2023b) to select “v-shaped” SEDs as candidates for massive galaxies at similar epochs, with an important distinction. The applies a more stringent set of cuts to ensure that the sources are point-source dominated and show two red consecutive colors in the LW NIRCam filters, thus favoring sources with red continuum slopes rather than contribution of emission lines or a continuum break. Overlap betweent the samples is discussed in §5.
As a final step, L23 identified a “clean” sample of 17 objects keeping only sources where two-dimensional image fitting in F356W indicated 50% of the light residing in an extended component and where spectral energy distribution (SED) fitting indicated the broad-band SEDs could not be fit without an AGN component.
In nearly all cases, the highest priority targets are those with deep ALMA limits, because in these cases we can effectively rule out dusty star formation as the origin of the red continuum, unless we were to invoke much hotter dust than is seen at these (or any) redshift. However, only 3/20 targets with ALMA coverage favored SED solutions without an AGN component, so we will assume that the NIRCam color selected sample is largely representative of the SED selected sample. We will discuss the AGN yield under different cuts in §5.
| MSAID | RA | Dec | F444W | 277-444 | 277-356 | Flg | MSA | Texp | ||||
|---|---|---|---|---|---|---|---|---|---|---|---|---|
| (1) | (2) | (3) | (4) | (5) | (6) | (7) | (8) | (9) | (10) | (11) | (12) | (13) |
| 2008 | 3.592423 | 30.432828 | 6.740.00 | 1.69 | 1.68 | 1.72 | 27.3 | 1.39 | 1.06 | 0 | 1 | 2.7 |
| 4286 | 3.619202 | 30.423270 | 5.840.00 | 1.62 | 1.61 | 1.64 | 24.8 | 2.03 | 1.19 | 0 | 2 | 2.7 |
| 10686 | 3.550838 | 30.406598 | 5.050.00 | 1.44 | 1.45 | 1.47 | 24.3 | 1.05 | 0.49 | 1 | 1 | 2.7 |
| 13123a | 3.579829 | 30.401570 | 7.040.00 | 6.15 | 5.96 | 6.69 | 25.0 | 2.66 | 1.89 | 1 | 2,3,5,6,7 | 17.4 |
| 13821 | 3.620607 | 30.399951 | 6.340.00 | 1.59 | 1.57 | 1.61 | 25.0 | 2.33 | 1.40 | 1 | 1 | 2.7 |
| 15383a | 3.583534 | 30.396678 | 7.040.00 | 7.29 | 5.78 | 7.30 | 25.3 | 2.45 | 1.71 | 1 | 2,3,6 | 9.9 |
| 16594a | 3.597203 | 30.394330 | 7.040.00 | 3.55 | 3.38 | 3.70 | 26.3 | 1.97 | 1.26 | 1 | 1,5,6,7 | 14.7 |
| 20466 | 3.640409 | 30.386437 | 8.500.00 | 1.33 | 1.31 | 1.34 | 26.2 | 1.92 | 0.72 | 1 | 2 | 2.7 |
| 23608 | 3.542815 | 30.380646 | 5.800.00 | 2.07 | 2.07 | 2.13 | 24.9 | 0.79 | 0.88 | 0 | 3 | 2.7 |
| 28876 | 3.569596 | 30.373222 | 7.040.00 | 2.70 | 2.60 | 2.73 | 26.8 | 2.10 | 1.49 | 1 | 1,4 | 6.4 |
| 32265 | 3.537530 | 30.370168 | 0.000.00 | 27.3 | 0.97 | 0.68 | 1 | 3,5,6,7 | 14.7 | |||
| 33437 | 3.546419 | 30.366245 | 0.000.00 | 27.0 | 2.06 | 0.97 | 1 | 3,5,6,7 | 14.7 | |||
| 35488 | 3.578984 | 30.362598 | 6.260.00 | 3.38 | 3.14 | 3.74 | 24.5 | 0.83 | 0.99 | 0 | 1 | 2.7 |
| 38108 | 3.530009 | 30.358013 | 4.960.00 | 1.59 | 1.58 | 1.62 | 24.7 | 1.06 | 0.83 | 1 | 4 | 3.7 |
| 39243 | 3.513894 | 30.356024 | 0.000.00 | 25.6 | 3.63 | 1.53 | 1 | 4 | 3.7 | |||
| 41225 | 3.533994 | 30.353308 | 6.760.00 | 1.50 | 1.49 | 1.53 | 25.9 | 1.13 | 0.71 | 1 | 4 | 3.7 |
| 45924 | 3.584758 | 30.343630 | 4.460.00 | 1.59 | 1.58 | 1.65 | 22.1 | 0.54 | 0.94 | 1 | 4,5,6,7 | 15.7 |
Note. — Table of objects that satisfy and . are the three images of the multiply-imaged red AGN presented in Furtak et al. (2023a, b). Column (1): MSA ID. Column (2): R.A. Column (3): Dec. Column (4): Spectroscopic redshifts Column (5): Total magnification () based on the v1.1 UNCOVER strong lensing model (see section 2.3). Column (6): Magnification 68% low value. Column (7): Magnification 68% high value. Column (8): F444W mag. Column (9): F277W-F444W color (mag). Column (10): F277W-F356W color (mag). Column (11): Flag for the high-priority photometric sample. Column (12): MSA number (1-7). Column (13): Total exposure time (h).
3.2 Spectroscopic sample
In designing the MSA PRISM masks, we prioritized observing the compact red sources from L23. We obtained spectra for most (75%) of the highest-priority targets, as is shown in Figure 1.
4 Spectral Analysis
We targeted with the NIRSpec/PRISM 17 sources that were photometrically identified in the UNCOVER photometry (L23). Of these, 14 are extragalactic sources and three turn out to be cool brown dwarfs (Burgasser et al., 2023). Three of the extragalactic sources are confirmed as multiply lensed images of the same source, A2744-QSO1 (Furtak et al., 2023a, b), leaving 12 unique non-stellar sources. All have redshifts . Overall the photometric redshifts were accurate (Fig. 1), with a median offset in /(1+z) of and , but for some objects the redshift was underestimated (e.g., Kokorev et al., 2023), due to degeneracy between redshifts where [OIII] or H are in the F410M or F444W band.
The main goal of this paper is to determine the nature of these sources. Based on their unique properties – detected UV continuum, red optical continuum, ALMA-undetected, and spatially compact – we proposed based on an SED fitting that the sources are likely to be AGN. We now ask whether the spectra provide evidence for an accreting black hole. The main evidence we will present is in the form of broad Balmer lines, which has long been an accepted signature of gas orbiting the central black hole in the broad-line region (e.g., Osterbrock, 1977).
4.1 Line fitting
From our broad wavelength coverage, from , we cover from Ly to Balmer lines at . The spectra are very rich, albeit at relatively low () dispersion. In this section, we will focus only on fitting the strong optical emission lines H, [O III], H, [N II]. Note that because H falls at the reddest end of the spectrum, we have enough spectral resolution to model the [N II] lines separately from H.
In all cases we model the narrow forbidden lines with a single velocity width, and the ratios of the [O III] and [N II]doublets are fixed to . We model the continuum as a power-law, normalized at 5100Å. We then perform two different fits to the H+[O III]+H+[N II]complex. In all fits, the radial velocities of all lines are tied together. First, we perform a narrow-line only fit, where all the lines are fixed to the same velocity width, with a flat broad prior on the width up to 800 km/s. Then we perform a two-component fit with a narrow and broad component to the Balmer lines. In this fit, all narrow lines are fixed in velocity width and fit over a narrow prior range (50-150 km/s). The ratio of narrow H/H flux is fit over a prior range of 3-20 () under the assumption of case B recombination (Osterbrock, 1989). Broad H and H fluxes are fitted independently, and the width of H is constrained to fall within a factor of two of H. In the first fit we constrain eight free parameters (including a power-law continuum) and in the second model we add four additional free parameters.
Each model is then forward modeled through the instrument before calculating the likelihood. We use the predicted pre-launch instrumental broadening from JDOX (Jakobsen et al., 2022), but because our targets are by definition point sources, the resolution is considerably better than the nominal resolution for a uniformly illuminated slit (by up to a factor 2; de Graaff et al., 2023). On the other hand, the rectification and combination of the spectra results in additional broadening due to the relatively large pixel size compared to the instrument point spread function. We therefore increase the nominal resolution by a conservative, uniform factor of 1.3, but caution that we then neglect any wavelength-dependence of the correction factor to the line spread function. The effect on the inferred broad-line widths is negligible, but the inferred widths for the narrow-line components suffer from a systematic uncertainty. For the fitting, we define a variable wavelength grid that oversamples the native resolution by a factor of four, convolve the model with the instrumental broadening, and then resample onto the wavelength grid while preserving flux.
The full set of narrow-only and two-component fits are presented in Figures 2 and 3, continuum fits are presented in Table 2, and broad H parameters are presented in Table 3. To explore the impact of the degeneracy between broad and narrow lines, we perform an additional two-component fit in which we fix the Balmer decrement to fall between H/H, corresponding to the continuum-derived mag as is seen in our more conservative continuum fits (§4.4). We find that in all cases but one, the derived H width agrees within 5-10% of our fiducial fits. In the case of MSAID23608, which has a very strong narrow-line component, the broad H width decreases to 1500 km/s. Thus, we are confident that overall, our broad-line widths are robust to degeneracy with the narrow components.
| MSAID | ||||||
|---|---|---|---|---|---|---|
| (1) | (2) | (3) | (4) | (5) | (6) | (7) |
| 2008 | 1.40.3 | 1.90.3 | 2.10.5 | 2.43.0 | 43.5 | 43.7 |
| 4286 | 0.90.1 | 1.60.1 | 1.30.2 | 2.70.2 | 44.6 | 44.7 |
| 10686 | 0.40.3 | 1.60.1 | 2.01.1 | 3.20.2 | 44.9 | 44.3 |
| 13123a | 1.20.3 | 44.4 | 43.8 | |||
| 13821 | 1.00.3 | 1.20.1 | 1.10.3 | 1.70.2 | 44.2 | 44.5 |
| 20466b | 0.50.3 | 0.70.2 | 44.5 | 44.9 | ||
| 23608 | 0.00.1 | 1.50.1 | 0.10.1 | 1.90.7 | 43.5 | 43.5 |
| 28876 | 1.00.2 | 2.10.1 | 1.40.1 | 2.91.2 | 44.1 | 43.9 |
| 35488 | 0.10.2 | 2.30.1 | 0.30.5 | 2.00.3 | 44.2 | 44.1 |
| 38108 | 0.50.1 | 1.90.1 | 0.80.2 | 3.30.2 | 44.7 | 44.7 |
| 41225 | 0.30.1 | 1.70.1 | 1.00.2 | 3.90.1 | 45.0 | 44.7 |
| 45924 | 0.50.1 | 0.00.1 | 1.60.3 | 1.10.9 | 44.9 | 45.3 |
Note. — Table of continuum measurements from the PRISM spectroscopy. a is the highest S/N spectrum of the triply-imaged object from Furtak et al. (2023b). The is derived from the Balmer decrement for this source. b is the broad-line AGN discussed by Kokorev et al. (2023); in this case the measurements are derived from the Balmer decrement and a full spectral fit respectively, while in Col. (7) is derived from H assuming a ratio of H/H. Column (1): MSA ID. Column (2): Optical slope , fitted redward of 4400Å. Column (3): UV slope , fitted blueward of 3000Å. Column (4): (mag) estimated from the continuum slope assuming an intrinsic AGN power-law slope of and an SMC reddening law. Column (5): (mag) estimated from the continuum slope assuming an intrinsic AGN power-law slope as fitted to the UV component of the spectrum and an SMC reddening law. Column (6): Demagnified and dereddened luminosity at 5100Å (erg/s) as estimated from the measured continuum and the from Column (5). Column (7): Demagnified and dereddened luminosity at 5100Å (erg/s) as estimated from the measured H luminosity and the from Column (5).
| MSAID | FWHMn | FWHMtwo | |||||||
|---|---|---|---|---|---|---|---|---|---|
| (1) | (2) | (3) | (4) | (5) | (6) | (7) | (8) | (9) | |
| 2008 | 650100 | 1200430 | 1.40.3 | 94 | 94 | ||||
| 4286 | 80010 | 29001040 | 13.70.4 | 807 | 361 | 43.4 | 8.00.3 | 45.40.3 | |
| 10686 | 6010 | 49001570 | 5.51.6 | 332 | 296 | ||||
| 13123a | 2670170 | 5.00.45 | 42.7 | 7.30.2 | 45.00.1 | ||||
| 13821 | 79010 | 3100710 | 17.40.8 | 461 | 248 | 43.3 | 8.10.2 | 45.40.2 | |
| 20466b | 203154 | 3439413 | 2.30.2 | 4817 | 410 | 43.8 | 8.170.42 | 45.8 | |
| 23608 | 7010 | 2900340 | 2.40.2 | 409 | 341 | 42.3 | 7.50.2 | 44.20.4 | |
| 28876 | 65070 | 1800650 | 2.20.4 | 265 | 265 | ||||
| 35488 | 9010 | 1900210 | 10.92.1 | 1123 | 976 | 42.8 | 7.40.2 | 44.80.4 | |
| 38108 | 80010 | 41001980 | 14.30.5 | 671 | 215 | 43.4 | 8.40.5 | 45.30.5 | |
| 41225 | 51030 | 2000600 | 4.70.3 | 539 | 435 | 43.5 | 7.70.4 | 45.30.5 | |
| 45924 | 7010 | 450040 | 383.40.4 | 1621505 | 90681 | 44.0 | 8.90.1 | 46.40.2 |
Note. — Table of H measurement from the PRISM spectroscopy. is the highest S/N spectrum of the triply-imaged object from Furtak et al. (2023b), while is the broad-line AGN from Kokorev et al. (2023). Column (1): MSA ID. Column (2): FWHM (H), narrow-only fit (km/s). Column (3): FWHM (H), two-component broad fit (km/s). (b) is measured from H (Kokorev et al., 2023). Column (4): Observed H flux, two-component broad fit ( erg/s/cm2). (b) is measured from H (Kokorev et al., 2023). Column (5): (narrow-only). Column (6): (two-component). Column (7): De-magnified and dereddened H luminosity (erg/s), using from Table 2. Only definite broad-line objects have H luminosities listed. Column (8): Black hole mass, using H linewidth and luminosity. Errors account linewidth errors and two reddening values. Maybe sources have no listed. Column (9): Log of the bolometric luminosity (erg/s), estimated from the H luminosity. Errors account for two reddening values and uncertainty in the bolometric correction.
4.2 Identifying Broad Balmer Lines
Two targets (A2744-QSO1 and MSAID20466) have previously been identified as robust broad-line AGN (Furtak et al., 2023b; Kokorev et al., 2023). We here examine the remaining 10 objects, after removing the three brown dwarfs. The majority of our targets have , meaning that H falls fully in the spectrum. Given the significant dust reddening, we focus exclusively on identifying broad H, since given the typical Balmer decrements of , we have substantially higher signal-to-noise in H than H.
To determine which sources have broad lines, we apply the following three criteria. First, we insist that the fit improvement in be better than ( for four additional degrees of freedom) between the narrow-only and two-component fit (MSAID2008 and MSAID35488 are removed at this step). Second, we require that the two-component broad H have FWHM km/s. We choose 2000 km/s as a conservative limit, compared to the bimodality at 1200 km/s identified by Hao et al. (2005). Finally, we remove any object with detection of a broad line, where is measured as the 68% distribution from the nested sampling (MSAID10686 is removed at this step). All objects have narrow [O III] and H detections. The “unconfirmed black hole” targets could show evidence of broad emission lines with higher spectral resolution (and in one case complete coverage of H). Specifically, many very significant but weak broad lines have been identified in higher-resolution spectroscopy (e.g., Larson et al., 2023; Harikane et al., 2023; Maiolino et al., 2023). We could not identify such lines in our data, and so we retain a label of unconfirmed for the remaining three objects. We do not report broad-line fluxes or black-hole masses for the unconfirmed targets.
Another question is whether the broad lines might arise from outflows, rather than the broad-line region of the AGN. It is true that outflows of km/s have been seen in narrow permitted and forbidden lines in very luminous (and reddened) AGN at (e.g., Zakamska et al., 2016). However, while we do not have robust measurements of the narrow-line widths, we know that they are km/s, so that the broad permitted lines almost certainly arise from the broad-line region.
4.3 Other Emission Lines
We do not present exhaustive fits of other UV emission lines in this work. However, we did perform a search for the forbidden line [Ne V]. This line is widely accepted as a likely indicator of AGN activity, given the ionization potential of 95 eV, although it has been attributed to Wolf-Rayet stars and/or shocks in various situations (e.g., Abel & Satyapal, 2008; Izotov et al., 2012; Leung et al., 2021). We only find compelling evidence for [Ne V] in source 45924, which is already a very strong AGN candidate by virtue of the broad-line width of FWHM(H) km/s. Since [Ne V] is typically the strength of [O III], and considering the strong reddening, this non-detection is not surprising (Netzer, 1990). We also attempt to decompose the [O III] and H emission lines, which may also provide corroborating evidence for excitation by an AGN (Baskin & Laor, 2005; Binette et al., 2022). However, given our spectral resolution, we do not achieve robust decompositions for any of the unconfirmed AGN candidates.
4.4 Balmer decrement and continuum slopes
By selection, our targets contain steep red continua. With the spectra, we have good constraints on both the UV and optical slopes, which we will denote as ( Å) and ( Å). For the definitive and unconfirmed broad-line sources, we find and respectively. The unconfirmed AGN candidates are bluer in the rest-UV than the average AGN in our sample, but all the targets are on the redder end of what is seen for F444W selected galaxies with (Bouwens et al., 2016; Bhatawdekar & Conselice, 2021; Topping et al., 2023; Nanayakkara et al., 2023). The optical slopes are by construction quite red, with , for AGN and unconfirmed samples respectively (Table 2).
We now try to estimate the dust reddening. Nominally, we measure the Balmer decrement from the narrow Balmer line fits (ranging from 4-15), implying . Because of the degeneracy with the broad Balmer lines, the Balmer decrements are not well constrained in general. Small changes in the broad-line fits can lead to large fluctuations in the Balmer decrements. Note that we do not trust broad-line Balmer decrements, since self-absorption in the broad-line region can also change the H to H ratio (Korista & Goad, 2004). We thus base our reddening estimates on the continuum slopes.
We fit the UV and optical sides of the spectra separately to derive and as power-laws in . To derive the dust reddening, we must assume an intrinsic (unreddened) spectral shape. All of our determinations of are under the assumption that the red continuum is dominated by AGN light (see §6). We take two AGN models. First, we use the Sloan Digital Sky Survey (SDSS York et al., 2000) composite AGN templates from Vanden Berk et al. (2001). The composite slope has in the UV. The UV slope of the SDSS template is consistent with many other works (e.g., Davis et al., 2007), and seems to hold over a wide range of redshift (Temple et al., 2021). The SDSS template then has a break to in the rest-frame optical at Å. The redder slope could be an intrinsic spectral change, or the impact of galaxy light redward of the 4000Å break, which is hard to determine robustly. Hence, we fit the SDSS-QSO template independently to each spectrum in the range Å and Å (to avoid the observed break seen in several of the spectra). In each case we allow a free extinction parameter characterized by the SMC reddening curve (Gordon et al., 2003).
We also perform a second more agnostic fit in which we fit the rest-frame UV slope directly assuming , and then assume this empirical slope holds over the full spectral range. In the case that the UV emission arises from scattered light, a single spectral slope should describe the scattered and intrinsic slopes. We allow for an additional two free parameters, an affecting an SMC-like reddened component to describe the red end of the spectra, and a zero-reddening scattered light fraction () that describes the rest-frame UV portion of the final model such that .
The reddening derived from the SDSS template is tabulated as due to the rest-frame optical slope of the composite spectrum. The agnostic empirical fit is denoted as because we fit directly for . These two reddening values thus bracket a reasonable range of reddening levels, and are presented in Table 2.
We find that although the flux level in the UV is suppressed compared to the standard AGN template, the UV slopes are very similar to the unreddened UV slope of the SDSS AGN template (). The rest-optical slopes are more variable. In §6.1, we will discuss the origin of the UV emission.
5 High fraction of AGN in red photometric samples
Our NIRSpec/PRISM spectra confirm the AGN hypothesis for a majority of the objects photometrically selected in L23. With the spectra in hand, we can explore the demographics of red sources at high redshift, as well as devise refined photometric selection criteria for future searches.
5.1 Yield and Contaminants
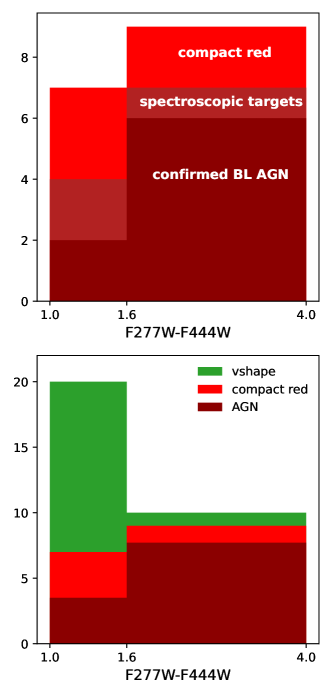
Of the 17 targets from L23 with UNCOVER PRISM spectra, 11 have unambiguous evidence for broad emission lines, including three which are multiple images of the same target (Furtak et al., 2023b). Three targets do not show clear evidence for broad emission lines, and a further three are brown dwarfs (Burgasser et al., 2023). Therefore 11/17 of the sample are confirmed as broad line AGN. Accounting for multiplicity, the confirmed AGN fraction among the targetted extragalactic objects in our sample is 9/12 , but we note AGN activity is not strongly ruled out in the remaining galaxies, so the true fraction could be as high as .
One obvious contaminant are brown dwarf stars. A simple color cut, excluding all sources bluer than F115WF200W (blue box in Figure 4), would remove the majority of brown dwarfs from high-z galaxy selections in high-latitude deep fields (see also Langeroodi et al., 2023). Based on the simulations from Burgasser et al. (2023) in the UNCOVER area we expect 5 low-metallicity halo brown dwarfs, expected to have the bluest F150WF200W colors, as can be seen from model tracks in Figure 4. Some contaminants at redder colors would remain: metal-rich brown dwarfs that reside in the Galactic thin disk are expected. The higher metallicity brown dwarfs in the thin disk should be bright, F444 mag, since the limited vertical scale height of the disk will limit these brown dwarfs to be within a few hundred pc. A more refined filter could possibly be defined from a larger model and/or template sample. Upcoming medium-band data (GO-4111; PI W. Suess) will allow for even cleaner identification of brown dwarfs (Hainline et al., 2023b).
5.2 Updated Photometric Selections of High Redshift Galaxies and AGN
Here we define updated NIRCam-only criteria to the selections of Labbé et al. (2023a, b). Specifically, we start with the same mag cuts as before. Then, we define a “v-shape” color selection to mimic that of Labbé et al. (2023b), designed to find candidate massive high-redshift galaxies:
The main difference with respect to Labbé et al. (2023b) is using rather than , and a blue limit to facilitate removing brown dwarfs. In addition, since we lack deep ACS coverage, we forego the HST/ACS optical nondetection criterion, thereby extending the selection towards lower redshift . This selection produces 31 unique sources in UNCOVER and is both effective and complete at identifying high-redshift galaxies with red rest-frame optical colors. The median and 28/31 = sources have (see Figure 4). In total 15 sources were targeted with UNCOVER PRISM spectroscopy, 11 presented in this paper and a further 4 presented in Price et al. (in preparation), all are at . Only one source with F277WF444W at does not satisfy the v-shape selection.
Remarkably, with this color selection alone, at least 29% of the objects are spectroscopically identified AGN, corresponding to about one-third of all F277WF444W at . We expect there are many non-active galaxies in the sample as well. Most of the Labbé et al. (2023b) objects found in the CEERS field are spatially resolved in the rest-UV, with densities similar to the cores of present-day ellipticals (Baggen et al., 2023). Out of 4 galaxies with spectroscopy in that sample, one was found to be a red broad line AGN (Kocevski et al., 2023). Cycle 2 spectroscopy (program JWST-GO-4106, PI Nelson) will determine what fraction of these color-selected but spatially-resolved objects show evidence for AGN activity.
To select red AGN more specifically in a similar fashion to the selection of L23, we add an additional red color and compactness criterion compared to the v-shape criterion:
where the additional 0.7 facilitates selecting SEDs with red continuum slopes, rather than breaks or emission lines (Figure 4, top right), and the compactness criterion helps to target point-source dominated sources (Figure 4, bottom left). These extra cuts remove roughly 50% of the targets. The main differences compared to L23 are the brown dwarf removal and a slightly more stringent cut than in L23.
Amongst this more stringent AGN-focused selection, we find at least 75% are AGN. The AGN fraction is a function of F277WF444W color (Figure 5). The majority of the broader sample of galaxies have . Therefore, an alternative high yield selection of AGN can be made by selecting on F277WF444W. In this situation, 80% of the galaxies are AGN, while % of the compact red galaxies are AGN (see also Barro et al., 2023).
In short, among galaxies with red colors (F115W–F200W, F277W–F444W), at least one third are AGN. Making more stringent compactness and color criteria, or simply cutting at F277W–F444W, can yield an 80-90% AGN fraction.
6 The Nature of the ‘Little Red Dots’
Now focusing exclusively on the confirmed broad-line AGN, we explore their properties, including SEDs, luminosity functions, and black holes masses.
6.1 Origin of the Continuum
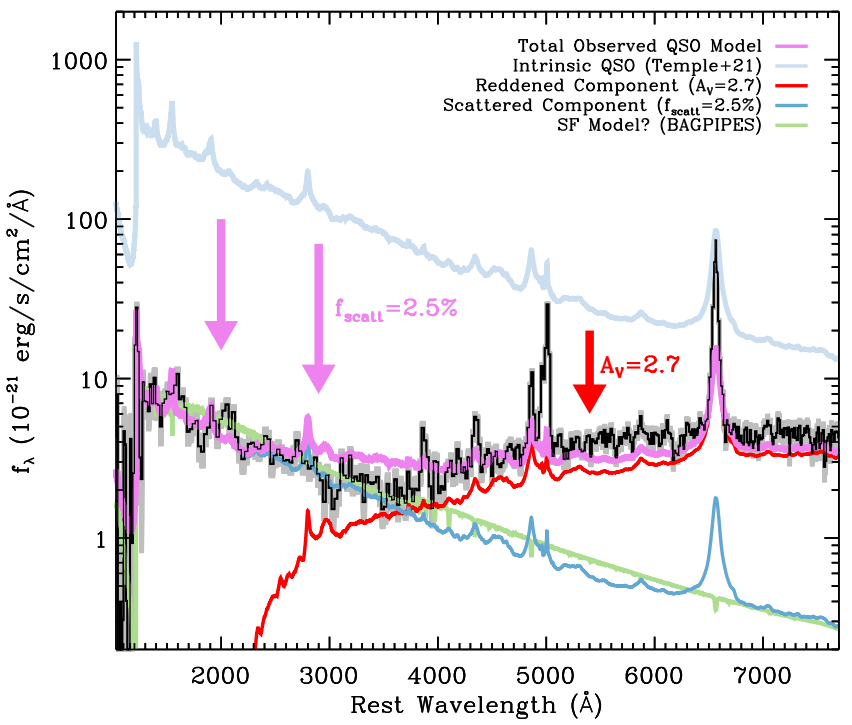
The compact red objects were photometrically selected not only to have a red continuum in the rest-frame optical, but also detectable UV emission. From a template fit to the photometry alone, we came to the conclusion that the red continuum was most likely dominated by reddened AGN light. With the spectra, we now ask whether it is possible to distinguish the origin of the rest-frame optical and UV continua more directly. We demonstrate the different methods of modeling the spectra with one example in Figure 6. We will defer full SED modeling to a future work, as that will require exploiting both the continua and the emission lines.
In the rest-frame optical, we immediately see that the observed red slopes are continuum-dominated, not arising from high-EW emission lines (see possibilities in Furtak et al., 2023a; Endsley et al., 2023). The rest-frame optical slopes are consistent with a reddened AGN template or dusty star-formation, as was concluded from the photometric fitting. However, the broad emission lines provide an additional clue. We can calculate the expected continuum given the observed H luminosity (Greene & Ho, 2005) and a measurement of reddening. We can also directly calculate the observed continuum. The two should match.333Comparing to the Greene & Ho (2005) relation is a bit easier than looking at the H equivalent width distribution directly, since there may be subtle trends between line equivalent widths and luminosity (e.g., Croom et al., 2002; Stern & Laor, 2012) that are fitted for directly by Greene & Ho. We include the two values, based on the continuum and H but using the same , in Table 2. While the H-derived values tend to be a bit higher, they agree within a factor of two, suggesting that the broad H equivalent widths are comparable to the low-redshift SDSS calibration sample from Greene & Ho (2005). The equivalent widths from pure star formation are much higher for dusty massive galaxies at lower redshift (Fumagalli et al., 2012; Whitaker et al., 2014). Given the detection of broad H and the AGN-like ratios of H to continuum, we conclude that the rest-frame optical is AGN dominated.
The dominant component from the AGN is the red continuum, and given the that we infer, we could not detect that component in the UV (see Fig. 6). Instead, we must invoke a second component, which is brighter than the pure reddened AGN spectrum, but still only a few percent of an unreddened (blue) AGN. The two possible origins for this second UV-emitting component are either star formation from the host or some small fraction of the photons from the accretion disk, whether via scattering or direct leakage. Unfortunately, we cannot make a concrete determination of the origin of the UV based on the spectral slopes alone. The rest-frame UV slopes are quite consistent with the observed slopes of blue AGN with , and in some cases there are likely broad UV lines. With higher resolution data this would be a smoking gun of AGN light dominating the UV. Alternatively, they could be consistent with the redder end of galaxies (e.g., Bouwens et al., 2016; Bhatawdekar & Conselice, 2021), particularly those selected at F444W (e.g., Nanayakkara et al., 2023; Topping et al., 2023).
To explore the UV origin further, we can ask what UV luminosities we would expect given the intrinsic luminosities. We bracket the range of reasonable using the two assumed intrinsic AGN slopes, and over that range we find that the observed is 1-3% percent or 10-20% of percent of the expected intrinsic , depending on whether we assume or respectively. The former can easily be explained by a scattered (or directly transmitted) AGN component, while 10-20% fractions are likely too high for pure AGN scattering (e.g., Liu et al., 2009). In such cases, we would favor a star-formation contribution to the UV. We choose not to fit the UV alone, since it has limited sensitivity to the stellar mass, but naively converting the measurements to star-formation rates, and assuming that all the UV arises from star-formation, we find rates of /yr. In terms of , we would expect 10-1000 times less H luminosity for this star formation rate than what we measure in the broad lines. On the other hand, this level of star formation seems both plausible and challenging to rule out from other measurements. In principle, the UV emission lines could distinguish the UV origins; higher resolution data are needed for this purpose.
Overall, we conclude that the rest-frame optical continuum is dominated by a dusty broad-line AGN continuum, and that more work is needed to definitively determine the origin of the UV emission. Finally, we also note that two objects, MSAID45924 and the triply-imaged A2744-QSO1 (MSAID13123 in this work) both have rather extraordinary spectral breaks that are not easily modeled with any AGN template. We leave to future work a more exhaustive fitting of the continuum, to attempt to understand the nature of their extreme breaks.
6.2 Luminosity Functions
| sample | ||
| 19.5 | ||
| 19.0 | ||
| 18.5 | ||
| sample | ||
| 19.0 | ||
| 18.0 | ||
| 17.0 | ||
| sample | ||
| sample | ||
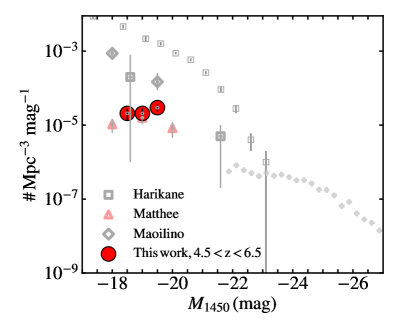
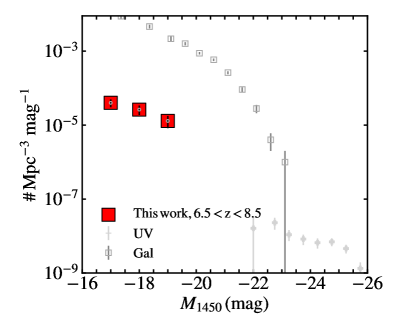
We now compute the rest-frame UV luminosity function of red AGN at high-redshifts based on the spectroscopic sample alone. Since Abell 2744 is a strong lensing field, the lensing distortion needs to be taken into account when computing the volume of each luminosity bin. To calculate the volumes, we follow the forward-modeling method used in the Hubble Frontier Fields by Atek et al. (2018): The sample completeness is assessed with a series of completeness simulations in which we populate the source plane with mock red AGN using the L23 SED, normalizing it to random UV luminosities and redshifts. These are then deflected into the lens plane with the deflection maps of the UNCOVER strong lensing model (see section 2.3) and added into the mosaics on which we re-run the detection routines and assess the fraction of recovered sources to derive the selection function . Note that the details of our completeness simulation methods will be published in Chemerynska et al. (in prep.). The selection function is used to weight the co-moving volume element which is then integrated over the source plane area of sufficient magnification required to detect each object in all bands given the UNCOVER mosaic depths (see equation 2 in Atek et al. 2018) to obtain the effective volume probed by UNCOVER. Note that since the UNCOVER source detection is performed in the stacked LW bands (see e.g. Weaver et al., 2023) where the compact red objects are the brightest, our sample is complete down to mag and objects brighter than mag do not necessarily need to be magnified in order to be detected given the UNCOVER depths listed in Weaver et al. (2023). Our sample is binned in UV luminosity bins of 0.5 magnitude width. The number count uncertainties are derived by drawing random luminosities from each object’s error distribution and re-binning the luminosity function each time to allow objects to change luminosity bin. The uncertainty in magnification is taken into account in the computation of the UV luminosity uncertainties.
The resulting UV luminosity functions in the two redshift bins are presented in Table 4 and Fig. 7. As established above, the spectroscopic sample represents a conservative but fairly accurate proxy for the true luminosity function of the reddened broad-line AGN. We confirm the result from L23 that the number densities of these red-selected AGN are higher by roughly two orders of magnitude compared to the UV-selected AGN at similar magnitudes. The number density we find is also comparable to what has been inferred for other moderate-luminosity red AGN samples at (Kocevski et al., 2023; Barro et al., 2023; Matthee et al., 2023), and accounts for of the general broad-line AGN population as selected with (Harikane et al., 2023; Maiolino et al., 2023). The spectroscopically-identified samples rely on higher-resolution NIRSpec data, which is inclusive of AGN with narrower lines and systems where the AGN does not necessarily dominate the total light output.
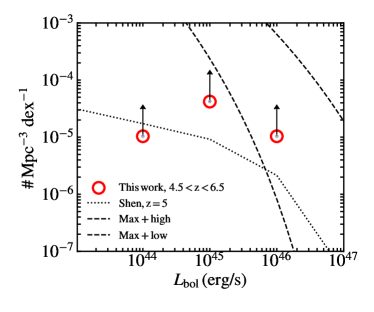
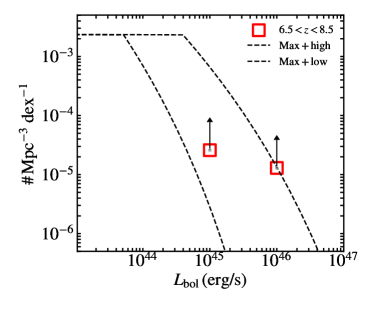
We have tried to emphasize that the UV light is a small fraction of the total luminosity due to the large reddening values and has an unknown origin in either scattered or transmitted AGN light or low-level unobscured star formation. Thus, while useful to put our targets into context, the UV luminosity function does not truly describe the physical properties of the AGN in this sample. For this reason, we also present a bolometric luminosity function in Table 5 and Figure 8. Since the derivation of completeness as a function of bolometric luminosity is not straightforward and would require detailed SED-modeling in the completeness simulations, we here use the fact that our sample is mostly complete in UV luminosity (see above) to approximate the effective volume for the bolometric luminosity function by assuming the maximum -completeness derived above in each -bin (of width 1 dex) and no magnification, i.e. the effective volume element is integrated over the whole UNCOVER source plane area of (see Furtak et al., 2023c; Atek et al., 2023b). While this is a reasonable approximation given the properties of our sample, the thus derived bolometric luminosity function remains a lower limit. The lower luminosity bins in particular are probably underestimated since these would be more sensitive to magnification.
To guide our interpretation, we also calculate “maximal” black hole bolometric luminosity functions using a combination of high and low-redshift observations. We start by using the Sheth-Tormen halo mass function (Sheth & Tormen, 2002) at . Each halo is assumed to contain a gas mass that is linked to the halo mass through the cosmological ratio such that . The total stellar mass in any halo is assumed to scale with the gas mass as . Matching to the evolving observed stellar mass function at requires a star formation efficiency that evolves as at these redshifts (Dayal & Giri, 2023, for detailes see). For each halo, we then use two sets of observed relations linking the black hole and stellar mass at from Reines & Volonteri (2015): our “high” black-hole mass model uses , valid for high stellar mass ellipticals. The “low” black-hole model on the other hand uses , valid for moderate-luminosity AGN in low-mass halos. Based on previous theoretical works (Bower et al., 2017; Dayal et al., 2019b) that find suppressed Eddington accretion rate for black holes in halos below , we limit the Eddington accretion rate to for such halos; higher mass halos are allowed to accrete at the Eddington rate in order to obtain the bolometric luminosity function shown in Fig. 8.
We can already draw some interesting conclusions from these bolometric luminosity function lower limits. First, we see the full range of spanned by the sample is quite broad, erg/s, corresponding to Eddington-limited accretion onto black holes with , most of the supermassive black hole population. We also see that the number density of sources at the bright end is approaching the maximal number of accreting black holes. In other words, we are finding an unexpectedly large number of relatively luminous black holes (e.g., Furtak et al., 2023b; Kokorev et al., 2023; Pacucci et al., 2023).
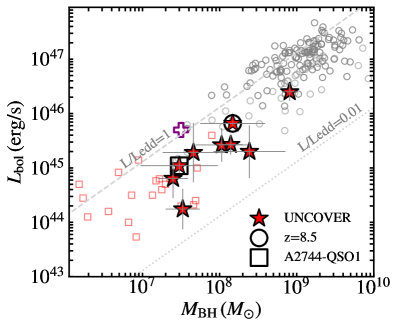
6.3 Black Hole Masses
We follow Greene & Ho (2005), as updated by Reines et al. (2013), to calculate BH mass based on the luminosity and velocity FWHM(H) of the broad H line. These single-epoch BH mass estimates (e.g., Shen et al., 2019) are based on assuming that the BLR acts as a dynamical tracer of the BH (e.g., Pancoast et al., 2014). The size of the BLR is estimated from the AGN luminosity (e.g., Bentz et al., 2013), and then assuming virial equilibrium, the dynamical mass scales as . Of course, we do not know that the BLR is in virial equilibrium, nor do we know whether we probe the velocity field at a comparable radius as the BLR “size” we estimate from the luminosity (e.g., Krolik, 2001; Linzer et al., 2022).
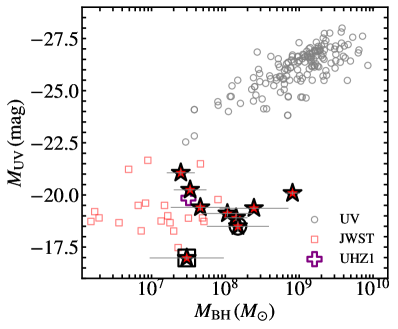
The black hole masses are plotted against the UV luminosities and the H-inferred bolometric luminosities in Figure 9. We compare the sources both to luminous UV-selected quasars from the review of Fan et al. (2022) and from recent moderate-luminosity broad-line AGN discovered with (Kocevski et al., 2023; Harikane et al., 2023; Barro et al., 2023; Matthee et al., 2023). Our sources are on the massive end of the broad-line AGN found in deep fields, but barely reach the low end of the BH mass and luminosity seen in the rare UV-selected sources. However, their UV luminosities are 4-5 magnitudes lower than the UV-selected AGN at comparable . This difference is very likely due to dust obscuration. As shown on the right hand side, when we use the broad emission lines to estimate the bolometric luminosity, we find much more agreement in luminosity range at a given .
It is worth noting MSAID45924. This galaxy is the brightest in the sample (F444W mag) and stands out for its high SNR and black hole mass of . The object warrants bespoke analysis that is beyond the scope of this work.
7 Discussion and Summary
In this work, we present NIRSpec/PRISM spectroscopic follow-up of 15 red, compact sources selected in the UNCOVER+Abell 2744 field. The majority of these targets are confirmed to be AGN with . The UV/optical SEDs have a characteristic steep red continuum towards the rest-frame optical but also a non-negligible UV component. The rest-frame optical is consistent with a reddened () broad-line AGN. The UV slopes are well fit as unobscured AGN in slope, but suppressed by times relative to an un-reddened source. From the available low-resolution spectroscopy and broad-band SED data, we cannot rule out that the UV component is due to moderately reddened star formation at the level of a few solar masses per year in the host. AGN with similar shapes (Noboriguchi et al., 2023) are known at all redshifts (e.g., Veilleux et al., 2016; Pan et al., 2021; Glikman et al., 2012; Banerji et al., 2015; Hamann et al., 2017; Assef et al., 2018). However, at , these reddened sources with a UV excess are rare; Noboriguchi et al. (2019) estimate that of all the dust-obscured galaxies, only 1% have a UV excess.
is uncovering a surprisingly high number density of red AGN at (see also Harikane et al., 2023; Barro et al., 2023; Matthee et al., 2023, L23). This high number density is unexpected compared to UV-selected sources, which have measured number densities nearly 100 times lower at their faintest UV luminosities (e.g., Matsuoka et al., 2018, 2023), although nominally the densities are similar to some X-ray selections (Giallongo et al., 2019). Additionally, the compact red AGN account for a large fraction of all red-selected sources with . After applying simple color cuts designed to select massive galaxies (as in Labbé et al., 2023b), our spectra imply that at least one-third of the selected objects will be AGN. This number rises to nearly 100% for the reddest tail of galaxies (F277F444W), and is also when we apply a compactness criterion and enforce a red power-law continuum.
An obvious additional question is the possible role of these sources in reionization. Depending on the (poorly understood) number densities and accretion rates of black holes compared to star forming galaxies at the faint-end of the UV LF, they could either have made a minimal contribution (few tens of percent, Hassan et al., 2018; Dayal et al., 2020b; Trebitsch et al., 2021; Finkelstein & Bagley, 2022) or dominate the photon budget for reionization (e.g., Madau & Haardt, 2015; Grazian et al., 2018). Furthermore, current models of black hole and galaxy evolution underpredict the number densities of vigorously accreting black holes (e.g., Furtak et al., 2023b). We see this directly in our bolometric luminosity functions, where at the highest luminosities we can only match the number densities if we assume that every black hole is accreting at its Eddington luminosity.
It is in principle possible that the occupation fraction approaches unity at high mass. Since we must posit continuous black hole growth at early times to explain the AGN that we are finding (e.g., Bogdan et al., 2023; Kokorev et al., 2023), perhaps nature has a way to grow black holes at such high rates. Another possibility is that the black holes outgrow their galaxies dramatically at early times, such that the number densities of available halos is much higher than we assume and the occupation fraction is lowered. We also measure extreme black hole to galaxy ratios in many sources (e.g., Izumi et al., 2019; Furtak et al., 2023b). Finally, we could alleviate the high occupation fractions if we allow sources to exceed their Eddington luminosities. Given the unusual properties of the SEDs of the red AGN, perhaps we are detecting the signature of super-Eddington accretion.
Regardless, we cannot get away from the high number density of black holes at . There are a few ways to imagine growing enough black hole mass density this early. Black hole seeds could form heavy ( ) as in direct collapse models (Bromm & Loeb, 2003; Loeb & Rasio, 1994; Lodato & Natarajan, 2006; Begelman et al., 2008; Visbal et al., 2014; Habouzit et al., 2016) or in dense star clusters (e.g., Portegies Zwart & McMillan, 2002; Mapelli, 2016; Omukai et al., 2008; Schleicher et al., 2022; Natarajan, 2021). With heavy seeds, it is easier to grow the black hole more rapidly than the galaxy, but most models cannot make high number densities of heavy seeds (Dayal et al., 2019b; Inayoshi et al., 2022). Alternatively, all of the black holes could start as light seeds (Fryer et al., 2001; Bromm & Larson, 2004; Madau & Rees, 2001), but then grow at super-Eddington rates to make the high mass density of black holes (e.g., Alexander & Natarajan, 2014). Some super-Eddington accretion is favored by the semi-empirical model TRIDENT (Zhang et al., 2023b), that uses halo trees to jointly model galaxy and black hole growth. At the same time, detailed magneto hydrodynamical simulations do find viable super-Eddington accretion flows (e.g., Jiang et al., 2019). Super-eddington accretion may also explain some of the SED properties of the compact red sources, in particular the apparently low X-ray luminosities (Matthee et al., 2023; Furtak et al., 2023b) and even possibly the red continuum if the inner accretion flow grows optically thick but leaves an outer disk. Finally, super-Eddington accretion would alleviate the tension with our “maximal” model, but producing more luminosity for a given black hole.
One other complication may come from mergers. At low redshifts, reddened broad-line AGN seem to preferentially reside in merging hosts (e.g., Urrutia et al., 2008). If the red sources presented here were also dominated by merging hosts, then perhaps the merging system may be harder to detect than an undisturbed galaxy, due to variable extinction and perhaps a significant low surface brightness component. There could also be two AGN powering the objects in some cases in principle. Notionally, the number densities of major mergers at could be high enough to match the number density of the compact red sources. Taking an empirically motivated merger timescale of Gyr and a merger volume density of Mpc-3 Gyr-1 for galaxies from empirical halo modeling (O’Leary et al., 2021), we estimate Mpc-3 mergers at . Plausibly then there could be a relationship between the AGN triggering, merging, and the observed reddening. As was seen in Matthee et al. (2023), the compact red sources also appear to be clustered with each other. Fujimoto et al. (2023a) highlights a potential overdensity hinted from a compact red AGN and a UV-bright object found together in the same giant ionized bubble with a radius of proper Mpc at . Perhaps this excess clustering could be related to a merger origin for these sources.
There are many additional puzzles raised by the ’little red dots’, including their apparent clustering, their unique SEDs (characteristic red optical continuum, an additional UV component, and lack of X-ray emission), and their apparent lack of a significant host galaxy component. These red broad-line AGN apparently constitute a sizable fraction of broad-line AGN at , as well as a sizable fraction of red galaxies at the same epoch. They are an important part of the story of black hole growth at early times.
Acknowledgments
J.E.G. and A.D.G acknowledge support from NSF/AAG grant# 1007094, and J.E.G. also acknowledges support from NSF/AAG grant # 1007052. A.Z. acknowledges support by Grant No. 2020750 from the United States-Israel Binational Science Foundation (BSF) and Grant No. 2109066 from the United States National Science Foundation (NSF), and by the Ministry of Science & Technology of Israel. The Cosmic Dawn Center is funded by the Danish National Research Foundation (DNRF) under grant #140. This work has received funding from the Swiss State Secretariat for Education, Research and Innovation (SERI) under contract number MB22.00072, as well as from the Swiss National Science Foundation (SNSF) through project grant 200020_207349. PD acknowledges support from the NWO grant 016.VIDI.189.162 (“ODIN”) and from the European Commission’s and University of Groningen’s CO-FUND Rosalind Franklin program. K.G. and T.N. acknowledge support from Australian Research Council Laureate Fellowship FL180100060. H.A. and IC acknowledge support from CNES, focused on the mission, and the Programme National Cosmology and Galaxies (PNCG) of CNRS/INSU with INP and IN2P3, co-funded by CEA and CNES. RPN acknowledges funding from programs GO-1933 and GO-2279. Support for this work was provided by NASA through the NASA Hubble Fellowship grant HST-HF2-51515.001-A awarded by the Space Telescope Science Institute, which is operated by the Association of Universities for Research in Astronomy, Incorporated, under NASA contract NAS5-26555. The research of CCW is supported by NOIRLab, which is managed by the Association of Universities for Research in Astronomy (AURA) under a cooperative agreement with the National Science Foundation. A.J.B. acknowledges funding support from NASA/ADAP grant 21-ADAP21-0187. Support for this work was provided by The Brinson Foundation through a Brinson Prize Fellowship grant. RPN acknowledges support for this work provided by NASA through the NASA Hubble Fellowship grant HST-HF2-51515.001-A awarded by the Space Telescope Science Institute, which is operated by the Association of Universities for Research in Astronomy, Incorporated, under NASA contract NAS5-26555. CP thanks Marsha and Ralph Schilling for generous support of this research.
References
- Abel & Satyapal (2008) Abel, N. P., & Satyapal, S. 2008, ApJ, 678, 686, doi: 10.1086/529013
- Akins et al. (2023) Akins, H. B., Casey, C. M., Allen, N., et al. 2023, arXiv e-prints, arXiv:2304.12347, doi: 10.48550/arXiv.2304.12347
- Akiyama et al. (2018) Akiyama, M., He, W., Ikeda, H., et al. 2018, PASJ, 70, S34, doi: 10.1093/pasj/psx091
- Alexander & Natarajan (2014) Alexander, T., & Natarajan, P. 2014, Science, 345, 1330, doi: 10.1126/science.1251053
- Amaro-Seoane et al. (2023) Amaro-Seoane, P., Andrews, J., Arca Sedda, M., et al. 2023, Living Reviews in Relativity, 26, 2, doi: 10.1007/s41114-022-00041-y
- Assef et al. (2018) Assef, R. J., Stern, D., Noirot, G., et al. 2018, ApJS, 234, 23, doi: 10.3847/1538-4365/aaa00a
- Atek et al. (2018) Atek, H., Richard, J., Kneib, J.-P., & Schaerer, D. 2018, MNRAS, 479, 5184, doi: 10.1093/mnras/sty1820
- Atek et al. (2023a) Atek, H., Labbé, I., Furtak, L. J., et al. 2023a, arXiv e-prints, arXiv:2308.08540, doi: 10.48550/arXiv.2308.08540
- Atek et al. (2023b) Atek, H., Chemerynska, I., Wang, B., et al. 2023b, arXiv e-prints, arXiv:2305.01793, doi: 10.48550/arXiv.2305.01793
- Bañados et al. (2018) Bañados, E., Venemans, B. P., Mazzucchelli, C., et al. 2018, Nature, 553, 473, doi: 10.1038/nature25180
- Baggen et al. (2023) Baggen, J. F. W., van Dokkum, P., Labbe, I., et al. 2023, arXiv e-prints, arXiv:2305.17162, doi: 10.48550/arXiv.2305.17162
- Banerji et al. (2015) Banerji, M., Alaghband-Zadeh, S., Hewett, P. C., & McMahon, R. G. 2015, MNRAS, 447, 3368, doi: 10.1093/mnras/stu2649
- Barro et al. (2023) Barro, G., Perez-Gonzalez, P. G., Kocevski, D. D., et al. 2023, arXiv e-prints, arXiv:2305.14418, doi: 10.48550/arXiv.2305.14418
- Baskin & Laor (2005) Baskin, A., & Laor, A. 2005, MNRAS, 358, 1043, doi: 10.1111/j.1365-2966.2005.08841.x
- Begelman et al. (2008) Begelman, M. C., Rossi, E. M., & Armitage, P. J. 2008, MNRAS, 387, 1649, doi: 10.1111/j.1365-2966.2008.13344.x
- Bentz et al. (2013) Bentz, M. C., Denney, K. D., Grier, C. J., et al. 2013, ApJ, 767, 149, doi: 10.1088/0004-637X/767/2/149
- Bergamini et al. (2023) Bergamini, P., Acebron, A., Grillo, C., et al. 2023, ApJ, 952, 84, doi: 10.3847/1538-4357/acd643
- Bezanson et al. (2022) Bezanson, R., Labbe, I., Whitaker, K. E., et al. 2022, arXiv e-prints, arXiv:2212.04026, doi: 10.48550/arXiv.2212.04026
- Bhatawdekar & Conselice (2021) Bhatawdekar, R., & Conselice, C. J. 2021, ApJ, 909, 144, doi: 10.3847/1538-4357/abdd3f
- Binette et al. (2022) Binette, L., Villar Martín, M., Magris C., G., et al. 2022, Rev. Mexicana Astron. Astrofis., 58, 133, doi: 10.22201/ia.01851101p.2022.58.01.11
- Bogdan et al. (2023) Bogdan, A., Goulding, A., Natarajan, P., et al. 2023, arXiv e-prints, arXiv:2305.15458, doi: 10.48550/arXiv.2305.15458
- Bouwens et al. (2017) Bouwens, R. J., Oesch, P. A., Illingworth, G. D., Ellis, R. S., & Stefanon, M. 2017, ApJ, 843, 129, doi: 10.3847/1538-4357/aa70a4
- Bouwens et al. (2016) Bouwens, R. J., Aravena, M., Decarli, R., et al. 2016, ApJ, 833, 72, doi: 10.3847/1538-4357/833/1/72
- Bower et al. (2017) Bower, R. G., Schaye, J., Frenk, C. S., et al. 2017, MNRAS, 465, 32, doi: 10.1093/mnras/stw2735
- Brammer (2022) Brammer, G. 2022, msaexp: NIRSpec analyis tools, 0.3.4, Zenodo, Zenodo, doi: 10.5281/zenodo.7299500
- Bromm & Larson (2004) Bromm, V., & Larson, R. B. 2004, ARA&A, 42, 79, doi: 10.1146/annurev.astro.42.053102.134034
- Bromm & Loeb (2003) Bromm, V., & Loeb, A. 2003, ApJ, 596, 34, doi: 10.1086/377529
- Burgasser et al. (2023) Burgasser, A. J., Gerasimov, R., Bezanson, R., et al. 2023, arXiv e-prints, arXiv:2308.12107. https://arxiv.org/abs/2308.12107
- Carnall et al. (2018) Carnall, A. C., McLure, R. J., Dunlop, J. S., & Davé, R. 2018, MNRAS, 480, 4379, doi: 10.1093/mnras/sty2169
- Carnall et al. (2019) Carnall, A. C., McLure, R. J., Dunlop, J. S., et al. 2019, MNRAS, 490, 417, doi: 10.1093/mnras/stz2544
- Croom et al. (2002) Croom, S. M., Rhook, K., Corbett, E. A., et al. 2002, MNRAS, 337, 275, doi: 10.1046/j.1365-8711.2002.05910.x
- Davis et al. (2007) Davis, S. W., Woo, J.-H., & Blaes, O. M. 2007, ApJ, 668, 682, doi: 10.1086/521393
- Dayal & Giri (2023) Dayal, P., & Giri, S. K. 2023, arXiv e-prints, arXiv:2303.14239, doi: 10.48550/arXiv.2303.14239
- Dayal et al. (2019a) Dayal, P., Rossi, E. M., Shiralilou, B., et al. 2019a, MNRAS, 486, 2336, doi: 10.1093/mnras/stz897
- Dayal et al. (2019b) —. 2019b, MNRAS, 486, 2336, doi: 10.1093/mnras/stz897
- Dayal et al. (2020a) Dayal, P., Volonteri, M., Choudhury, T. R., et al. 2020a, MNRAS, 495, 3065, doi: 10.1093/mnras/staa1138
- Dayal et al. (2020b) —. 2020b, MNRAS, 495, 3065, doi: 10.1093/mnras/staa1138
- de Graaff et al. (2023) de Graaff, A., Rix, H.-W., Carniani, S., et al. 2023, arXiv e-prints, arXiv:2308.09742, doi: 10.48550/arXiv.2308.09742
- Endsley et al. (2022) Endsley, R., Stark, D. P., Whitler, L., et al. 2022, arXiv e-prints, arXiv:2208.14999, doi: 10.48550/arXiv.2208.14999
- Endsley et al. (2023) Endsley, R., Stark, D. P., Lyu, J., et al. 2023, MNRAS, 520, 4609, doi: 10.1093/mnras/stad266
- Fan et al. (2022) Fan, X., Banados, E., & Simcoe, R. A. 2022, arXiv e-prints, arXiv:2212.06907, doi: 10.48550/arXiv.2212.06907
- Fan et al. (2019) Fan, X., Wang, F., Yang, J., et al. 2019, ApJ, 870, L11, doi: 10.3847/2041-8213/aaeffe
- Finkelstein & Bagley (2022) Finkelstein, S. L., & Bagley, M. B. 2022, ApJ, 938, 25, doi: 10.3847/1538-4357/ac89eb
- Fryer et al. (2001) Fryer, C. L., Woosley, S. E., & Heger, A. 2001, ApJ, 550, 372, doi: 10.1086/319719
- Fujimoto et al. (2022) Fujimoto, S., Brammer, G. B., Watson, D., et al. 2022, Nature, 604, 261, doi: 10.1038/s41586-022-04454-1
- Fujimoto et al. (2023a) Fujimoto, S., Wang, B., Weaver, J., et al. 2023a, arXiv e-prints, arXiv:2308.11609, doi: 10.48550/arXiv.2308.11609
- Fujimoto et al. (2023b) Fujimoto, S., Kohno, K., Ouchi, M., et al. 2023b, arXiv e-prints, arXiv:2303.01658, doi: 10.48550/arXiv.2303.01658
- Fumagalli et al. (2012) Fumagalli, M., Patel, S. G., Franx, M., et al. 2012, ApJ, 757, L22, doi: 10.1088/2041-8205/757/2/L22
- Furtak et al. (2023a) Furtak, L. J., Zitrin, A., Plat, A., et al. 2023a, ApJ, 952, 142, doi: 10.3847/1538-4357/acdc9d
- Furtak et al. (2023b) Furtak, L. J., Labbé, I., Zitrin, A., et al. 2023b, arXiv e-prints, arXiv:2308.05735, doi: 10.48550/arXiv.2308.05735
- Furtak et al. (2023c) Furtak, L. J., Zitrin, A., Weaver, J. R., et al. 2023c, MNRAS, 523, 4568, doi: 10.1093/mnras/stad1627
- Gardner et al. (2023) Gardner, J. P., Mather, J. C., Abbott, R., et al. 2023, PASP, 135, 068001, doi: 10.1088/1538-3873/acd1b5
- Giallongo et al. (2019) Giallongo, E., Grazian, A., Fiore, F., et al. 2019, ApJ, 884, 19, doi: 10.3847/1538-4357/ab39e1
- Glikman et al. (2012) Glikman, E., Urrutia, T., Lacy, M., et al. 2012, ApJ, 757, 51, doi: 10.1088/0004-637X/757/1/51
- Gordon et al. (2003) Gordon, K. D., Clayton, G. C., Misselt, K. A., Landolt, A. U., & Wolff, M. J. 2003, ApJ, 594, 279, doi: 10.1086/376774
- Goulding et al. (2023) Goulding, A. D., Greene, J. E., Setton, D. J., et al. 2023, arXiv e-prints, arXiv:2308.02750, doi: 10.48550/arXiv.2308.02750
- Grazian et al. (2018) Grazian, A., Giallongo, E., Boutsia, K., et al. 2018, A&A, 613, A44, doi: 10.1051/0004-6361/201732385
- Greene & Ho (2005) Greene, J. E., & Ho, L. C. 2005, ApJ, 630, 122, doi: 10.1086/431897
- Greene et al. (2020) Greene, J. E., Strader, J., & Ho, L. C. 2020, ARA&A, 58, 257, doi: 10.1146/annurev-astro-032620-021835
- Habouzit et al. (2016) Habouzit, M., Volonteri, M., Latif, M., Dubois, Y., & Peirani, S. 2016, MNRAS, 463, 529, doi: 10.1093/mnras/stw1924
- Hainline et al. (2023a) Hainline, K. N., Johnson, B. D., Robertson, B., et al. 2023a, arXiv e-prints, arXiv:2306.02468, doi: 10.48550/arXiv.2306.02468
- Hainline et al. (2023b) Hainline, K. N., Helton, J. M., Johnson, B. D., et al. 2023b, arXiv e-prints, arXiv:2309.03250, doi: 10.48550/arXiv.2309.03250
- Hamann et al. (2017) Hamann, F., Zakamska, N. L., Ross, N., et al. 2017, MNRAS, 464, 3431, doi: 10.1093/mnras/stw2387
- Hao et al. (2005) Hao, L., Strauss, M. A., Tremonti, C. A., et al. 2005, AJ, 129, 1783, doi: 10.1086/428485
- Harikane et al. (2022) Harikane, Y., Ono, Y., Ouchi, M., et al. 2022, ApJS, 259, 20, doi: 10.3847/1538-4365/ac3dfc
- Harikane et al. (2023) Harikane, Y., Zhang, Y., Nakajima, K., et al. 2023, arXiv e-prints, arXiv:2303.11946, doi: 10.48550/arXiv.2303.11946
- Hassan et al. (2018) Hassan, S., Davé, R., Mitra, S., et al. 2018, MNRAS, 473, 227, doi: 10.1093/mnras/stx2194
- Hinshaw et al. (2013) Hinshaw, G., Larson, D., Komatsu, E., et al. 2013, ApJS, 208, 19, doi: 10.1088/0067-0049/208/2/19
- Horne (1986) Horne, K. 1986, PASP, 98, 609, doi: 10.1086/131801
- Inayoshi et al. (2022) Inayoshi, K., Onoue, M., Sugahara, Y., Inoue, A. K., & Ho, L. C. 2022, ApJ, 931, L25, doi: 10.3847/2041-8213/ac6f01
- Inayoshi et al. (2020) Inayoshi, K., Visbal, E., & Haiman, Z. 2020, ARA&A, 58, 27, doi: 10.1146/annurev-astro-120419-014455
- Izotov et al. (2012) Izotov, Y. I., Thuan, T. X., & Privon, G. 2012, MNRAS, 427, 1229, doi: 10.1111/j.1365-2966.2012.22051.x
- Izumi et al. (2019) Izumi, T., Onoue, M., Matsuoka, Y., et al. 2019, PASJ, 71, 111, doi: 10.1093/pasj/psz096
- Jakobsen et al. (2022) Jakobsen, P., Ferruit, P., Alves de Oliveira, C., et al. 2022, A&A, 661, A80, doi: 10.1051/0004-6361/202142663
- Jiang et al. (2019) Jiang, Y.-F., Stone, J. M., & Davis, S. W. 2019, ApJ, 880, 67, doi: 10.3847/1538-4357/ab29ff
- Kocevski et al. (2023) Kocevski, D. D., Onoue, M., Inayoshi, K., et al. 2023, arXiv e-prints, arXiv:2302.00012, doi: 10.48550/arXiv.2302.00012
- Kokorev et al. (2023) Kokorev, V., Fujimoto, S., Labbe, I., et al. 2023, arXiv e-prints, arXiv:2308.11610, doi: 10.48550/arXiv.2308.11610
- Korista & Goad (2004) Korista, K. T., & Goad, M. R. 2004, ApJ, 606, 749, doi: 10.1086/383193
- Krolik (2001) Krolik, J. H. 2001, ApJ, 551, 72, doi: 10.1086/320091
- Labbé et al. (2023a) Labbé, I., Greene, J. E., Bezanson, R., et al. 2023a, arXiv e-prints, arXiv:2306.07320, doi: 10.48550/arXiv.2306.07320
- Labbé et al. (2023b) Labbé, I., van Dokkum, P., Nelson, E., et al. 2023b, Nature, 616, 266, doi: 10.1038/s41586-023-05786-2
- Langeroodi et al. (2023) Langeroodi, D., Hjorth, J., & Zhang, Z. 2023, arXiv e-prints, arXiv:2308.10900, doi: 10.48550/arXiv.2308.10900
- Larson et al. (2023) Larson, R. L., Finkelstein, S. L., Kocevski, D. D., et al. 2023, arXiv e-prints, arXiv:2303.08918, doi: 10.48550/arXiv.2303.08918
- Leung et al. (2021) Leung, G. C. K., Coil, A. L., Rupke, D. S. N., & Perrotta, S. 2021, ApJ, 914, 17, doi: 10.3847/1538-4357/abf4da
- Leung et al. (2023) Leung, G. C. K., Bagley, M. B., Finkelstein, S. L., et al. 2023, arXiv e-prints, arXiv:2306.06244. https://arxiv.org/abs/2306.06244
- Linzer et al. (2022) Linzer, N. B., Goulding, A. D., Greene, J. E., & Hickox, R. C. 2022, ApJ, 937, 65, doi: 10.3847/1538-4357/ac8d5c
- Liu et al. (2009) Liu, X., Zakamska, N. L., Greene, J. E., et al. 2009, ApJ, 702, 1098, doi: 10.1088/0004-637X/702/2/1098
- Lodato & Natarajan (2006) Lodato, G., & Natarajan, P. 2006, MNRAS, 371, 1813, doi: 10.1111/j.1365-2966.2006.10801.x
- Loeb & Rasio (1994) Loeb, A., & Rasio, F. A. 1994, ApJ, 432, 52, doi: 10.1086/174548
- Lotz et al. (2017) Lotz, J. M., Koekemoer, A., Coe, D., et al. 2017, ApJ, 837, 97, doi: 10.3847/1538-4357/837/1/97
- Madau & Haardt (2015) Madau, P., & Haardt, F. 2015, ApJ, 813, L8, doi: 10.1088/2041-8205/813/1/L8
- Madau & Rees (2001) Madau, P., & Rees, M. J. 2001, ApJ, 551, L27, doi: 10.1086/319848
- Maiolino et al. (2023) Maiolino, R., Scholtz, J., Curtis-Lake, E., et al. 2023, arXiv e-prints, arXiv:2308.01230, doi: 10.48550/arXiv.2308.01230
- Mapelli (2016) Mapelli, M. 2016, MNRAS, 459, 3432, doi: 10.1093/mnras/stw869
- Matsuoka et al. (2018) Matsuoka, Y., Strauss, M. A., Kashikawa, N., et al. 2018, ApJ, 869, 150, doi: 10.3847/1538-4357/aaee7a
- Matsuoka et al. (2023) Matsuoka, Y., Onoue, M., Iwasawa, K., et al. 2023, arXiv e-prints, arXiv:2305.11225, doi: 10.48550/arXiv.2305.11225
- Matthee et al. (2023) Matthee, J., Naidu, R. P., Brammer, G., et al. 2023, arXiv e-prints, arXiv:2306.05448, doi: 10.48550/arXiv.2306.05448
- Meisner et al. (2021) Meisner, A. M., Schneider, A. C., Burgasser, A. J., et al. 2021, ApJ, 915, 120, doi: 10.3847/1538-4357/ac013c
- Mortlock et al. (2011) Mortlock, D. J., Warren, S. J., Venemans, B. P., et al. 2011, Nature, 474, 616, doi: 10.1038/nature10159
- Nanayakkara et al. (2023) Nanayakkara, T., Glazebrook, K., Jacobs, C., et al. 2023, ApJ, 947, L26, doi: 10.3847/2041-8213/acbfb9
- Natarajan (2021) Natarajan, P. 2021, MNRAS, 501, 1413, doi: 10.1093/mnras/staa3724
- Netzer (1990) Netzer, H. 1990, in Active Galactic Nuclei, ed. R. D. Blandford, H. Netzer, L. Woltjer, T. J. L. Courvoisier, & M. Mayor, 57–160
- Noboriguchi et al. (2023) Noboriguchi, A., Inoue, A. K., Nagao, T., Toba, Y., & Misawa, T. 2023, arXiv e-prints, arXiv:2309.00955, doi: 10.48550/arXiv.2309.00955
- Noboriguchi et al. (2019) Noboriguchi, A., Nagao, T., Toba, Y., et al. 2019, ApJ, 876, 132, doi: 10.3847/1538-4357/ab1754
- Oesch et al. (2023) Oesch, P. A., Brammer, G., Naidu, R. P., et al. 2023, arXiv e-prints, arXiv:2304.02026, doi: 10.48550/arXiv.2304.02026
- O’Leary et al. (2021) O’Leary, J. A., Moster, B. P., Naab, T., & Somerville, R. S. 2021, MNRAS, 501, 3215, doi: 10.1093/mnras/staa3746
- Omukai et al. (2008) Omukai, K., Schneider, R., & Haiman, Z. 2008, ApJ, 686, 801, doi: 10.1086/591636
- Ono et al. (2022) Ono, Y., Harikane, Y., Ouchi, M., et al. 2022, arXiv e-prints, arXiv:2208.13582, doi: 10.48550/arXiv.2208.13582
- Onoue et al. (2023) Onoue, M., Inayoshi, K., Ding, X., et al. 2023, ApJ, 942, L17, doi: 10.3847/2041-8213/aca9d3
- Osterbrock (1977) Osterbrock, D. E. 1977, ApJ, 215, 733, doi: 10.1086/155407
- Osterbrock (1989) —. 1989, Astrophysics of gaseous nebulae and active galactic nuclei
- Pacucci et al. (2023) Pacucci, F., Nguyen, B., Carniani, S., Maiolino, R., & Fan, X. 2023, arXiv e-prints, arXiv:2308.12331, doi: 10.48550/arXiv.2308.12331
- Pan et al. (2021) Pan, X., Zhou, H., Yang, C., et al. 2021, ApJ, 912, 118, doi: 10.3847/1538-4357/abf148
- Pancoast et al. (2014) Pancoast, A., Brewer, B. J., Treu, T., et al. 2014, MNRAS, 445, 3073, doi: 10.1093/mnras/stu1419
- Pascale et al. (2022) Pascale, M., Frye, B. L., Diego, J., et al. 2022, ApJ, 938, L6, doi: 10.3847/2041-8213/ac9316
- Portegies Zwart & McMillan (2002) Portegies Zwart, S. F., & McMillan, S. L. W. 2002, ApJ, 576, 899, doi: 10.1086/341798
- Reines et al. (2013) Reines, A. E., Greene, J. E., & Geha, M. 2013, ApJ, 775, 116, doi: 10.1088/0004-637X/775/2/116
- Reines & Volonteri (2015) Reines, A. E., & Volonteri, M. 2015, ApJ, 813, 82, doi: 10.1088/0004-637X/813/2/82
- Schleicher et al. (2022) Schleicher, D. R. G., Reinoso, B., Latif, M., et al. 2022, MNRAS, 512, 6192, doi: 10.1093/mnras/stac926
- Shen et al. (2020) Shen, X., Hopkins, P. F., Faucher-Giguère, C.-A., et al. 2020, MNRAS, 495, 3252, doi: 10.1093/mnras/staa1381
- Shen et al. (2019) Shen, Y., Wu, J., Jiang, L., et al. 2019, ApJ, 873, 35, doi: 10.3847/1538-4357/ab03d9
- Sheth & Tormen (2002) Sheth, R. K., & Tormen, G. 2002, Monthly Notices of the Royal Astronomical Society, 329, 61
- Somalwar & Ravi (2023) Somalwar, J. J., & Ravi, V. 2023, arXiv e-prints, arXiv:2306.00898, doi: 10.48550/arXiv.2306.00898
- Stern & Laor (2012) Stern, J., & Laor, A. 2012, MNRAS, 423, 600, doi: 10.1111/j.1365-2966.2012.20901.x
- Temple et al. (2021) Temple, M. J., Hewett, P. C., & Banerji, M. 2021, MNRAS, 508, 737, doi: 10.1093/mnras/stab2586
- Topping et al. (2023) Topping, M. W., Stark, D. P., Endsley, R., et al. 2023, arXiv e-prints, arXiv:2307.08835, doi: 10.48550/arXiv.2307.08835
- Trebitsch et al. (2023) Trebitsch, M., Hutter, A., Dayal, P., et al. 2023, MNRAS, 518, 3576, doi: 10.1093/mnras/stac2138
- Trebitsch et al. (2021) Trebitsch, M., Dubois, Y., Volonteri, M., et al. 2021, A&A, 653, A154, doi: 10.1051/0004-6361/202037698
- Übler et al. (2023) Übler, H., Maiolino, R., Curtis-Lake, E., et al. 2023, arXiv e-prints, arXiv:2302.06647, doi: 10.48550/arXiv.2302.06647
- Urrutia et al. (2008) Urrutia, T., Lacy, M., & Becker, R. H. 2008, ApJ, 674, 80, doi: 10.1086/523959
- Vanden Berk et al. (2001) Vanden Berk, D. E., Richards, G. T., Bauer, A., et al. 2001, AJ, 122, 549, doi: 10.1086/321167
- Veilleux et al. (2016) Veilleux, S., Meléndez, M., Tripp, T. M., Hamann, F., & Rupke, D. S. N. 2016, ApJ, 825, 42, doi: 10.3847/0004-637X/825/1/42
- Visbal et al. (2014) Visbal, E., Haiman, Z., & Bryan, G. L. 2014, MNRAS, 445, 1056, doi: 10.1093/mnras/stu1794
- Volonteri & Reines (2016) Volonteri, M., & Reines, A. E. 2016, ApJ, 820, L6, doi: 10.3847/2041-8205/820/1/L6
- Wang et al. (2023a) Wang, B., Fujimoto, S., Labbe, I., et al. 2023a, arXiv e-prints, arXiv:2308.03745, doi: 10.48550/arXiv.2308.03745
- Wang et al. (2023b) Wang, B., Leja, J., Bezanson, R., et al. 2023b, ApJ, 944, L58, doi: 10.3847/2041-8213/acba99
- Wang et al. (2021) Wang, F., Fan, X., Yang, J., et al. 2021, ApJ, 908, 53, doi: 10.3847/1538-4357/abcc5e
- Weaver et al. (2023) Weaver, J. R., Cutler, S. E., Pan, R., et al. 2023, arXiv e-prints, arXiv:2301.02671, doi: 10.48550/arXiv.2301.02671
- Whitaker et al. (2014) Whitaker, K. E., Franx, M., Leja, J., et al. 2014, ApJ, 795, 104, doi: 10.1088/0004-637X/795/2/104
- Yang et al. (2023) Yang, G., Caputi, K. I., Papovich, C., et al. 2023, arXiv e-prints, arXiv:2303.11736, doi: 10.48550/arXiv.2303.11736
- York et al. (2000) York, D. G., Adelman, J., Anderson, John E., J., et al. 2000, AJ, 120, 1579, doi: 10.1086/301513
- Zakamska et al. (2016) Zakamska, N. L., Hamann, F., Pâris, I., et al. 2016, MNRAS, 459, 3144, doi: 10.1093/mnras/stw718
- Zhang et al. (2023a) Zhang, H., Behroozi, P., Volonteri, M., et al. 2023a, arXiv e-prints, arXiv:2303.08150, doi: 10.48550/arXiv.2303.08150
- Zhang et al. (2023b) —. 2023b, MNRAS, 518, 2123, doi: 10.1093/mnras/stac2633
- Zitrin et al. (2015) Zitrin, A., Fabris, A., Merten, J., et al. 2015, ApJ, 801, 44, doi: 10.1088/0004-637X/801/1/44