GA-NIFS: Early-stage feedback in a heavily obscured AGN at
Dust-obscured galaxies are thought to represent an early evolutionary phase of massive galaxies in which the active galactic nucleus (AGN) is still deeply buried in significant amounts of dusty material and its emission is strongly suppressed. The unprecedented sensitivity of the James Webb Space Telescope (JWST) enables us for the first time to detect the rest-frame optical emission of heavily obscured AGN and unveil the properties of the hidden accreting super-massive black holes (BHs). In this work, we present the JWST/NIRSpec Integral Field Spectroscopy (IFS) data of ALESS073.1, a massive () dusty, star-forming galaxy at hosting an AGN at its center. The detection of a very broad ( ) H emission associated with the Broad Line Region (BLR) confirms the presence of a BH () accreting at less than 15% of its Eddington limit. The identification of the BLR classifies the target as a Type 1 AGN despite the observed high column density of . The rest-frame optical emission lines also reveal a fast ( ) ionized gas outflow marginally resolved in the galaxy center. The high sensitivity of NIRSpec allows us to perform the kinematic analysis of the narrow H component which indicates that the warm ionized gas velocity field is consistent with disk rotation. Interestingly, we find that in the innermost nuclear regions ( kpc), the intrinsic velocity dispersion of the disk reaches , times higher than the velocity dispersion inferred from the [Cii]158m line tracing mostly cold gas. Since, at large radii, the velocity dispersion of the warm and cold gas are comparable, we conclude that the outflows are injecting turbulence in the warm ionized gas in the central region, but they are not sufficiently powerful to disrupt the dense gas and quench star formation. These findings support the scenario that dust-obscured galaxies represent the evolutionary stage preceding the unobscured quasar when all gas and dust are removed from the host.
Key Words.:
quasars: supermassive black holes – quasars: emission lines – ISM: jets and outflows – Galaxies: high-redshift – Galaxies: kinematics and dynamics.1 Introduction
Supermassive black holes (BHs) are thought to reside in the center of the majority of local massive galaxies (Hopkins et al., 2008). A symbiotic connection between the growth of BHs and their hosts is suggested by the observed relations between the BH masses and the galaxy properties (e.g. Kormendy & Ho, 2013; Heckman & Best, 2014). Specifically, observations of local galaxies reveal tight relations between the BH mass and the stellar velocity dispersion and the mass and luminosity of the galactic bulge. These relations hold up throughout several orders of magnitude in black hole masses and galaxy properties and up to high redshift with different normalization (Carraro et al., 2020; Suh et al., 2020).
During the accretion phase, BHs are revealed as active galactic nuclei (AGN) due to the radiation emitted from radio to X-ray wavelengths by the accretion disk (Padovani et al., 2017). X-ray surveys show that the most luminous and massive AGN were most numerous at and, in particular, observations find the cosmic black hole accretion rate density peaks at , like the cosmic star formation rate density (Shankar et al., 2009; Delvecchio et al., 2014; Madau & Dickinson, 2014). Both cosmic star formation rate and BH accretion rate are driven by the availability of cold gas in the system (Hopkins et al., 2008). The tight relations between the BH and host galaxy properties and the similar evolution of activity with redshift suggests that BHs and the galaxies they inhabit have undergone a common evolutionary process (Kormendy & Ho, 2013).
The origin and the mechanisms that regulate the co-evolution of BHs with their host galaxy are still unclear. Massive galactic outflows driven by the radiation emitted by the most luminous AGN are considered a fundamental physical process in the evolution of galaxies. They are believed to regulate star formation (e.g., Fabian, 2012; Zubovas & King, 2014; Muratov et al., 2015; Nelson et al., 2019) and reduce the number of galaxies at the high-mass end of the stellar mass function (Benson et al., 2003; Puchwein & Springel, 2013). Such fast outflows can potentially accelerate a substantial mass of gas beyond the escape velocity of the local gravitational potential, inject turbulence in the ISM, and/or heat the gas in the galaxy, in this way damping or even halting star formation in their host galaxies (“Negative feedback” ; e.g., Fabian 2012; Harrison et al. 2017). On the other hand, AGN feedback has been observed to enhance star formation (“Positive Feedback”; e.g., Shin et al. 2019), with stars actively forming in outflowing material (e.g., Maiolino et al., 2017; Gallagher et al., 2019). It is thus fundamental to investigate the feedback mechanism over the various phases of the evolution of the BHs and galaxies to understand their role in the co-evolution process.
Sub-millimeter galaxies (SMGs) are a class of high-redshift () galaxies mostly characterized by a high luminosity in the FIR continuum emission ( L⊙), high star-formation rates (SFR M⊙ yr-1), and high dust content (; Santini et al. 2010). Although SMGs are a rare cosmological population of galaxies, they account for 20% of the SFR cosmic density at (Swinbank et al., 2014). These galaxies are also thought to be the precursors of local massive and quiescent early-type galaxies (ETG) that host BHs with masses in their centers (Sanders et al., 1988; Swinbank et al., 2004; Hopkins et al., 2008; Toft et al., 2014). Quiescent galaxies are already common at (), and are observed up to (Carnall et al., 2023). The evolutionary path that connects SMGs and quiescent galaxies is thought to be driven by the interaction between the galaxy and the BH (Sanders et al., 1988; Hopkins et al., 2008). The current theoretical scenarios expect that the feeding of galaxies with gas from the cosmic web or via mergers triggers both episodes of intense star formation and BH accretion. This process is thought to be self-regulated. In particular, the feedback from the accreting BHs should be able to balance the star formation (SF) in the host galaxy and the accretion of gas on the BH itself due to powerful radiation-driven outflows that are able to sweep out the host galaxy gas reservoir (Debuhr et al., 2012) and halt the accretion of gas (Peng et al., 2015). These outflows are thought to become important when the accretion rate on the BH reaches the Eddington rate (King & Pounds, 2015). The dust in the system will also be swept out, allowing the radiation coming from the BH accretion zone to be detected and identified as a luminous quasar (QSO) (Sanders et al., 1988; Hopkins et al., 2008). The removal and heating of gas due to the AGN feedback halts star formation in the system, turning the host into a “red and dead” galaxy. This is consistent with what is observed in local ETGs, which are dominated by old stellar populations, with formation redshifts of (Thomas et al., 2005; McDermid et al., 2015). Several studies also find galaxies whose gas content has been depleted on short timescales (Bezanson et al., 2019; Williams et al., 2021). Moreover, recent observations of quiescent galaxies at indicate that fast quenching processes are already in place in the first 2 Gyr of the Universe (Glazebrook et al., 2017; Valentino et al., 2020; Carnall et al., 2023). In conclusion, it is crucial to study the SMG population to asses whether they really represent the evolutionary stage preceding the active quasar phase and, thus, are the progenitors of local ETGs or not. Moreover, SMGs enable us to study the first phases of the BH feedback process outlined above feedback process.
The ISM properties of the high-redshift SMG population have been mainly studied through millimeter observations, which do not allow us to determine whether a BH is hidden at the center of the galaxies. Up until the advent of the James Webb Space Telescope (JWST), the rest-frame optical emission lines from galaxies at were extremely difficult to access from ground-based telescopes because the lines are redshifted to wavelength which are outside the atmospheric windows. Thanks to its unique sensitivity, the NIRSpec instrument (Jakobsen et al., 2022) on board JWST has already proven its capabilities to detect faint galaxies and identify serendipitous AGN by observing the emission that arises from the broad line regions (BLRs) surrounding super-massive BHs (Kocevski et al., 2023; Maiolino et al., 2023; Matthee et al., 2023; Übler et al., 2023)
By using the Integral Field Spectrograph (IFS) mode of NIRSpec (Böker et al., 2022) we can also exploit the rest-frame optical lines at high redshift to spatially resolve the emission from the ISM and stellar population and determine the impact of the feedback mechanism on the host galaxy (Cresci et al., 2023; Marshall et al., 2023; Perna et al., 2023; Übler et al., 2023).
In this work, we study the properties of ALESS073.1 (from the LABOCA ECDFS submillimetre survey LESS J033229.3-275619), a massive ( M⊙ Circosta et al. 2019) SMG at showing spectral features consistent with a Compton thick AGN ( cm-2) (Vanzella et al., 2009; Gilli et al., 2011; Giallongo et al., 2019). ALESS073.1 has a plethora of observations targeting both rest-frame far-infrared (Coppin et al., 2009; De Breuck et al., 2011; Nagao et al., 2012; De Breuck et al., 2014; D’Amato et al., 2020; Zhao et al., 2020; Lelli et al., 2021), UV (Vanzella et al., 2006, 2009; Coppin et al., 2009), and X-ray emission (Tozzi et al., 2006; Gilli et al., 2011; Vito et al., 2013; Gilli et al., 2014; Circosta et al., 2019; Giallongo et al., 2019). The bright rest-frame far-infrared emission indicates a massive burst of star formation with SFR of M⊙ yr-1 (Coppin et al., 2009; Gilli et al., 2014; Swinbank et al., 2014; Circosta et al., 2019) and a large dust content ( M⊙; Swinbank et al. 2014; da Cunha et al. 2015). This massive, dusty, highly star-forming SMG offers us a great opportunity to study the interplay between AGN and host galaxy at their first stages when the AGN accretion is creating a weak outflow that is starting to reveal the central AGN. We use NIRSpec observations to study the properties of the BH and investigate the impact of AGN-driven outflows (if any) on the host galaxy.
This work is structured as follows. In section 2, we describe the target and the new JWST IFS observations. In section 3, we present the analysis of the spatially-integrated and single-spaxel spectra. In section 4, we investigate which is the primary excitation mechanism of the gas. In Section 5 we compute the black hole mass and compare the position of ALESS073.1on the plane with other low and high redshift AGN and QSOs. In section 6, we study the properties and energetics of the outflow. In section 7, we perform a detailed kinematic analysis of the host galaxy. We discuss our results in section 8, and we draw our conclusions in section 9. In this work, we adopt the cosmological parameters from Planck Collaboration et al. (2016): = 67.7 Mpc-1, = 0.307, and = 0.691, ″ kpc at 4.755.
2 Observations
2.1 Target
ALESS073.1 is part of the Extended Chandra Deep Field South (Lehmer et al., 2005). It was identified as a strong sub-millimeter (Coppin et al., 2009; De Breuck et al., 2011) and X-ray source (Gilli et al., 2011, 2014) as well as Ly emitter (Vanzella et al., 2006, 2009). The presence of a narrow Ly, as well as a broader emission of Nv 1240 Å (FWHM 2000 ), and a candidate line emission of Civ 1549 Å (Vanzella et al., 2006, 2009; Coppin et al., 2009) identify the target as an AGN. This was furthermore confirmed by the detection of X-ray emission which resulted in an estimation of the column density of cm-2 (Circosta et al., 2019) that implies the presence of a Compton thick AGN (Gilli et al., 2011; Vito et al., 2013; Gilli et al., 2014; Circosta et al., 2019). The estimated intrinsic luminosity in the 2-10 keV band is 1.2 1044 erg s-1 (Luo et al., 2017) with the AGN bolometric luminosity of estimated via SED fitting (Circosta et al., 2019) classifying the target as a low-luminosity obscured quasar.
The kinematic of the host galaxy was extensively studied through high-angular resolution observations of the [Cii]158m emission line, revealing a massive, dusty disk with ordered rotation and low levels of turbulence (random, non-circular motion of the gas) (De Breuck et al., 2014; Lelli et al., 2021). The kinematics indicate the presence of a stellar bulge, which is a sign of an already-evolved galaxy. The fast evolution of the galaxy is also supported by metallicity measurements computed by exploiting the ratio between the FIR lines [Cii]158m and [Nii]205m that report an estimated gas-phase metallicity close to solar but we note that that the measurements have large uncertainties and this tracer of metallicity is less reliable than other optical diagnostics (Nagao et al., 2012; De Breuck et al., 2014). Gilli et al. (2014) suggest the presence of an outflow because of the observed km s-1 velocity shift between the Ly emission and other observed lines at sub-mm wavelengths ([Cii], CO(2-1), [CI], CO(7-6), [Nii]205 m; De Breuck et al. 2011; Nagao et al. 2012; D’Amato et al. 2020).
2.2 JWST observations and data reduction
The target was observed on the 12th of September 2022, as part of the NIRSpec GTO “Galaxy Assembly with NIRSpec IFS survey (GA-NIFS)”, under the program 1216 “Integral Field Spectroscopy in GOODS-S” (PI: Nora Lützgendorf).
The observations were carried out using a medium cycling pattern between four dithers to achieve a total exposure time of h with both G235H/F170LP and G395H/F290LP gratings/filters combinations to target the emission of the galaxy from 1.7 to 5.2 m at high spectral resolution (on average R2700).
The raw data were downloaded from the MAST archive and then processed with a modified version of the JWST Science Calibration Pipeline version 1.8.2 with the CRDS context “jwst_1068.pmap”.
The count rate maps were created by correcting at the detector level by using the module Detector1Pipeline of the pipeline. The calibration was performed by applying the Calwebb_spec2 stage of the pipeline. Finally, the cube was created by adding the individual calibrated images with a drizzle weighting and a spaxel size of 0.05″using the Calwebb_spec3 step of the pipeline.
Several corrections were made to the pipeline steps to allow for better data quality and to correct known bugs in the pipeline. These corrections are presented in detail in Perna et al. (2023), but here we mention only the major changes.
The correlated noise was subtracted from the count-rate images. The rejection of outliers was performed by using an algorithm similar to lacosmic (van Dokkum, 2001) that removes the outliers on individual 2-d exposures before combining them to create the final data cube.
2.3 ALMA observation and data reduction
In this work, we also use the Atacama Large Millimeter Array (ALMA) high-resolution observation of the [Cii] emission line.
We retrieve the [Cii] raw data from the ALMA archive (2017.1.01471.S, PI: F. Lelli), and then we use the pipeline scripts included in the datasets to calibrate the visibilities with the Common Astronomy Software Application CASA (McMullin et al., 2007).
Using the CASA task tclean, we perform the cleaning on the calibrated visibilities with a natural weighing scale and a spaxel scale of 0.05″ to create the final datacube. The resulting datacube has a beam size of .
3 Data analysis
3.1 Spectral fit of the central region
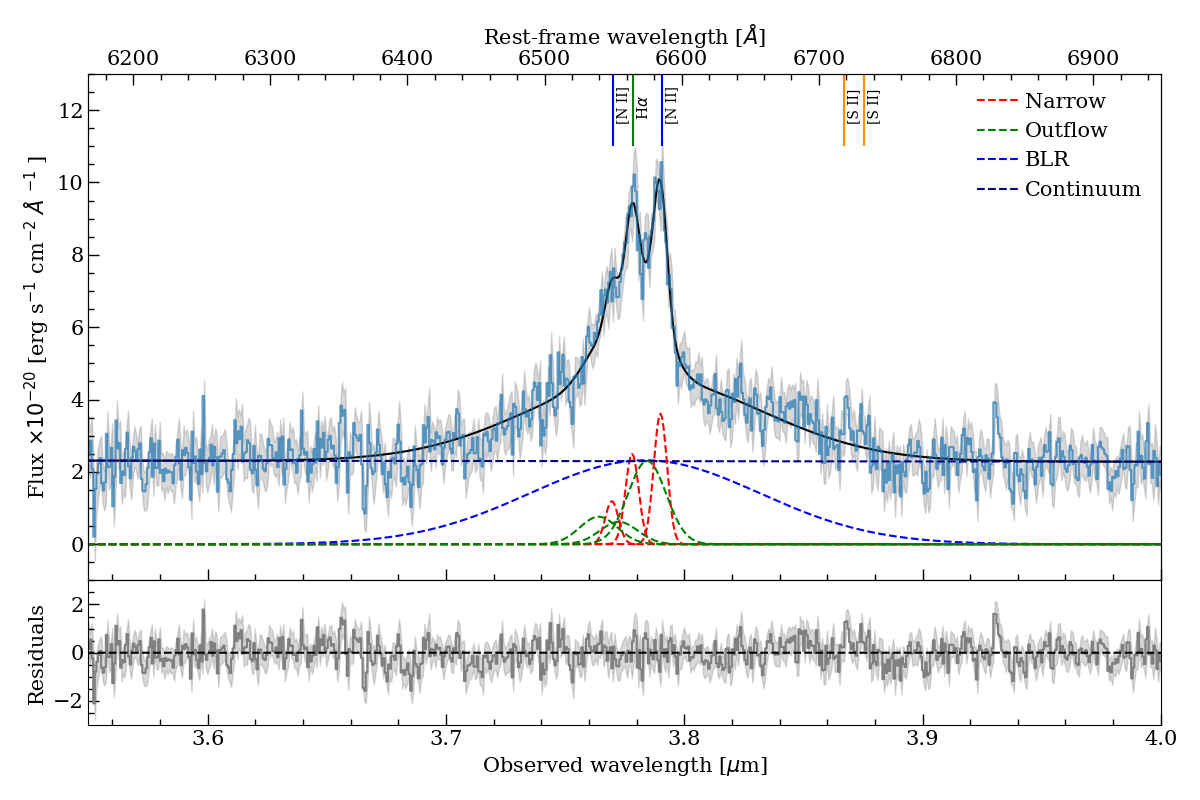
We first analyzed the emission from the nuclear region in which we expect to find emission features associated with the hidden AGN. Figure 1 illustrates the G395H/F290LP spectrum extracted from a circular aperture of radius 0.15″and centered on the central region. The errors on the spectrum were initially computed by summing in quadrature the noise from the error extension present in the data cube (“ERR”) in the spaxels of the selected region. To take into account the spatial correlations of the noise due to the PSF size, we scaled the errors to match the standard deviation in line-free regions of the spectrum (see also Übler et al., 2023). In the spectrum, we clearly see the narrow ( Å) emission lines of H and [Nii] doublets. In addition to the narrow components, it is evident the presence of a broad ( Å) line associated only with the permitted line of H that is consistent with being emission from the Broad Line Region (BLR). This confirms the presence of an AGN in ALESS073.1 and identifies the target as a Type 1 AGN, in contrast to what was expected due to the high value of .
To model the emission in the central region, we performed a least-square fitting by modeling the emission-line spectrum as a sum of Gaussian profiles. The H line profile required the addition of a broad ( ) Gaussian component to reproduce the BLR emission. The continuum emission was fitted with a linear function. The narrow components of both H and [Nii] were modeled with two Gaussian profiles each to take into account the presence of ionized outflows because using a singular Gaussian component was not sufficient to reproduce their asymmetric profiles. To disentangle between the outflow (broad) and galaxy (narrow) components of H and [Nii] doublets, we allowed the width of the narrow component to vary between , while the outflow line width was free to vary between .
For each Gaussian component, we tied the centroid and line width of the [Nii] doublet to those of H. The two emission lines of the [Nii] doublet, originating from the same upper level, were fitted with an intensity ratio I(6584)/I(6548) fixed at 2.94 (Storey & Zeippen, 2000). Finally, the model spectrum, obtained by combining all components, was convolved with a Gaussian kernel with a dispersion of to reproduce the line spread function of the instrument at the H wavelength. In Figure 1 we show the best-fit profiles for each component with dashed lines, while the best-fit values for the fluxes and the FWHMs are reported in Table 1.
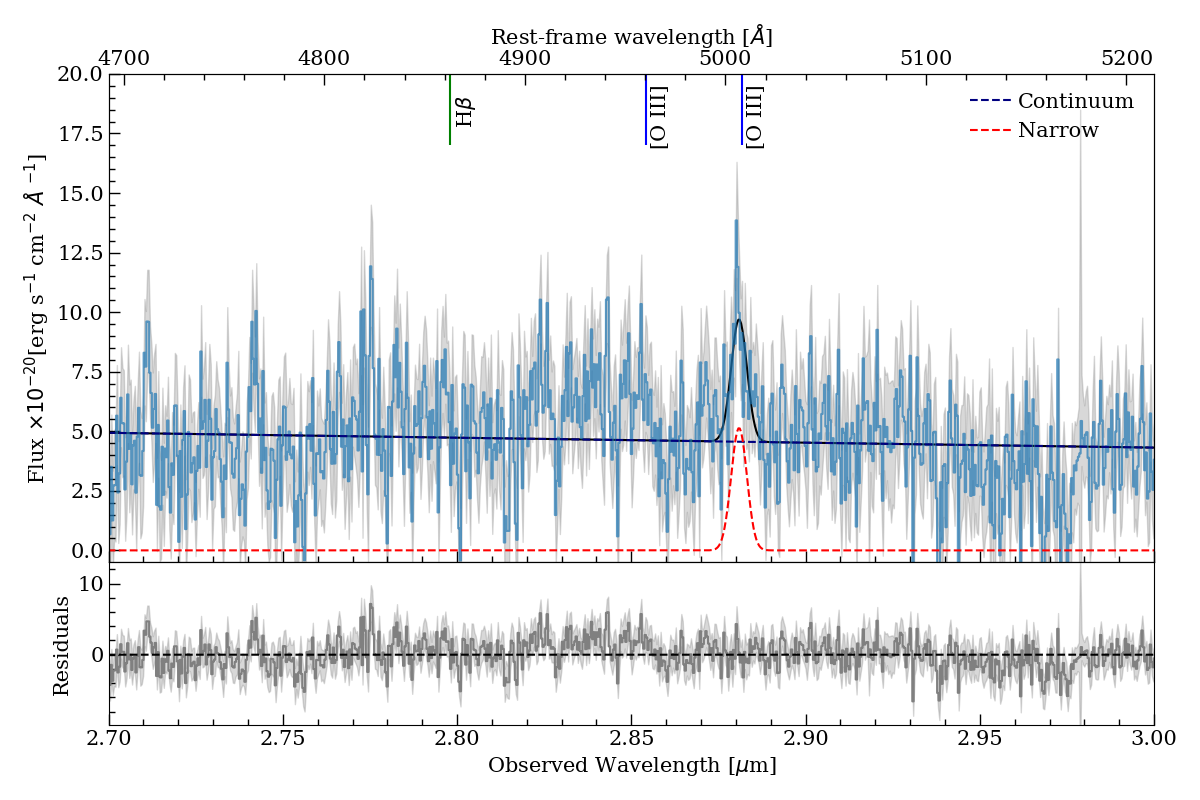
We also analyzed the spectrum from the same aperture in the G235H/F170LP cube, which covers the rest-frame wavelengths from Å to Å. The spectrum around the H - [Oiii] complex is shown in Figure 2. We did not identify any clear emission line, except for a tentative detection of the [Oiii]5007Å with a , the low S/N of the line is possibly due to high dust extinction at bluer wavelengths. We performed a single Gaussian fitting to reproduce the [Oiii]5007Å emission because the low signal-to-noise ratio (S/N) of the spectrum does not allow us to perform a multiple Gaussian fitting as performed for the H complex. We left the width of the line free to vary between 20 and 500 to allow for the possible presence of a broader line tracing an outflow, but the results of the fit are comparable with those obtained for the H narrow component. FWHM and flux of [Oiii] are reported in Table 1 together with the upper limit on the H flux derived by assuming an FWHM as large as that of H.
By using the ratio between the H flux and the upper limit on the H flux, we measure a lower limit on the Balmer decrement of . This value is higher than the theoretical value for star-forming galaxies assuming case B recombination (Osterbrock & Ferland, 2006), implying dust absorption as expected for SMG population. Assuming a Calzetti et al. (2000) curve we estimate a lower limit on the extinction , but we expect much higher extinction as found for other SMG (, Álvarez-Márquez et al. 2023).
| Measurement | [km/s] |
|---|---|
| H | 519 58 |
| Houtflow | 1491 296 |
| HBLR | 9008 407 |
| [Oiii]5007Å | 553 105 |
| H | – 441 129 |
| H | 427 201 |
| Measurement | [erg/s/cm2] |
| H | 174 34 |
| Houtflow | 123 91 |
| HBLR | 2804 198 |
| [Nii]6584Å | 252 44 |
| [Nii]6584Åoutflow | 460 150 |
| [Nii]6548Å | 83 14 |
| [Nii]6548Åoutflow | 151 49 |
| [Oiii]5007Å | 291 73 |
| H | ¡ 83 |
3.2 Spatially resolved emission
We performed a spaxel-by-spaxel fitting of the G395H/F290LP data cube by exploiting the model adopted to reproduce the spectrum from the central region. We allowed the spectral components to vary except for the BLR H, which is spatially unresolved, and thus its centroid and FWHM were fixed to the best-fit results obtained from the analysis of the circular aperture presented in the previous section.
For each spaxel, two alternative models were adopted for the narrow H and [Nii] profiles: one with the outflow component and the second without it. We then selected the most suited model for each spaxel based on the Bayesian information criterion222BIC, where k is the number of parameters in the fit, and N the number of data points used in the fit, we assumed Gaussian noise. (BIC) test (Liddle, 2007). For each spaxel, we estimated the BIC, and in those cases where the difference between BIC (without outflow) and BIC (with outflow) was larger than 2, we selected the model with two components as having a BIC is considered positive evidence in favor of the model with lower BIC value (Kass & Raftery, 1995). In the other cases, we adopted the model with one component. We note that selecting the model with the lower BIC value allows us to select the best-fit model with the highest statistical significance without overfitting the data.
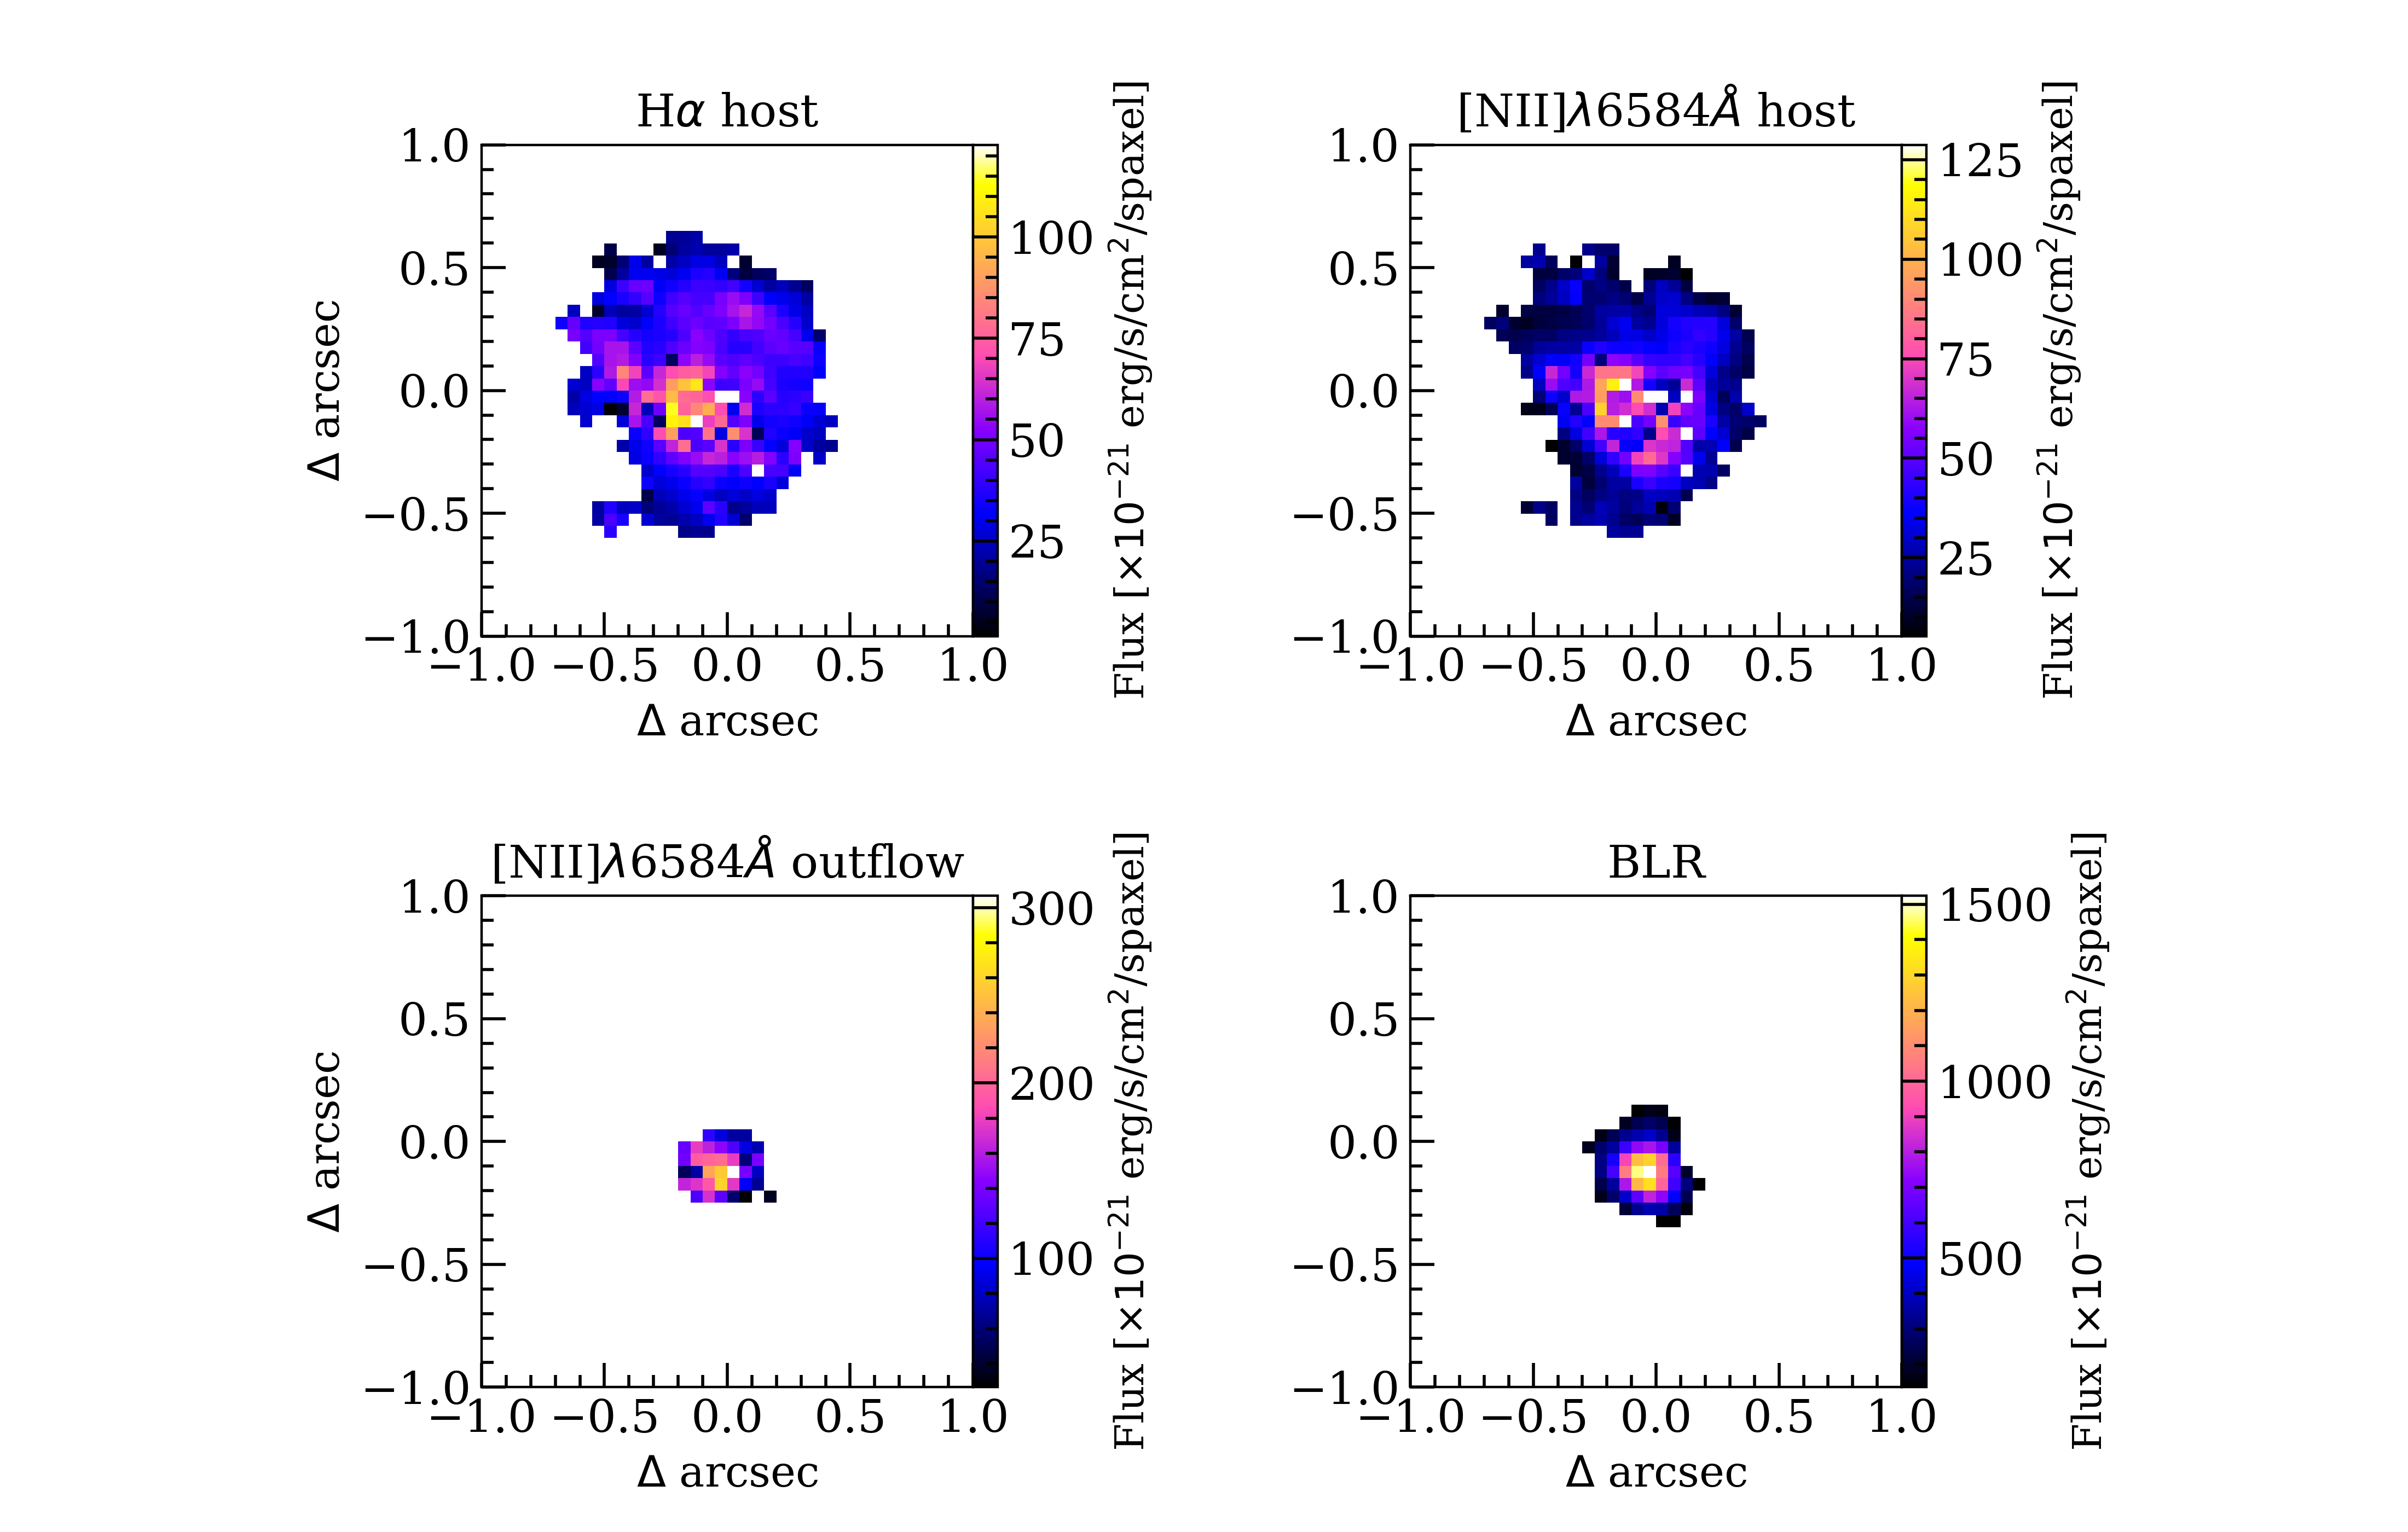
Figure 3 illustrates the flux maps for the narrower component of H and [Nii]6584Å tracing the host-galaxy, the flux map of the [Nii] 6584Å broad component associated with outflows as it is much stronger than the one traced by H (see Figure 1 and Table 1) and the flux map of the BLR component. The [Nii]6584Å-host emission is predominant in the central region reaching flux values comparable with the H-host line (see also Sec. 4). The H emission extends to a larger distance from the center compared to the [Nii]. Based on the BIC test, the additional second Gaussian profile is necessary only for the central region of the galaxy whose size is comparable to the PSF FWHM (see Appendix A). This indicates that the outflow emission is only marginally resolved by JWST and the region directly affected is limited to the central 1 kpc.
3.3 Morphology of the host galaxy
We estimated the size of the H emission directly from the flux map obtained by collapsing the data cube in the wavelength range 3.775 – 3.781 m that covers the FWHM of the H narrow emission (Figure 1) as the flux map of the narrow component created with the pixel-by-pixel fitting (see Section 3.2) has large uncertainties due to the low S/N.
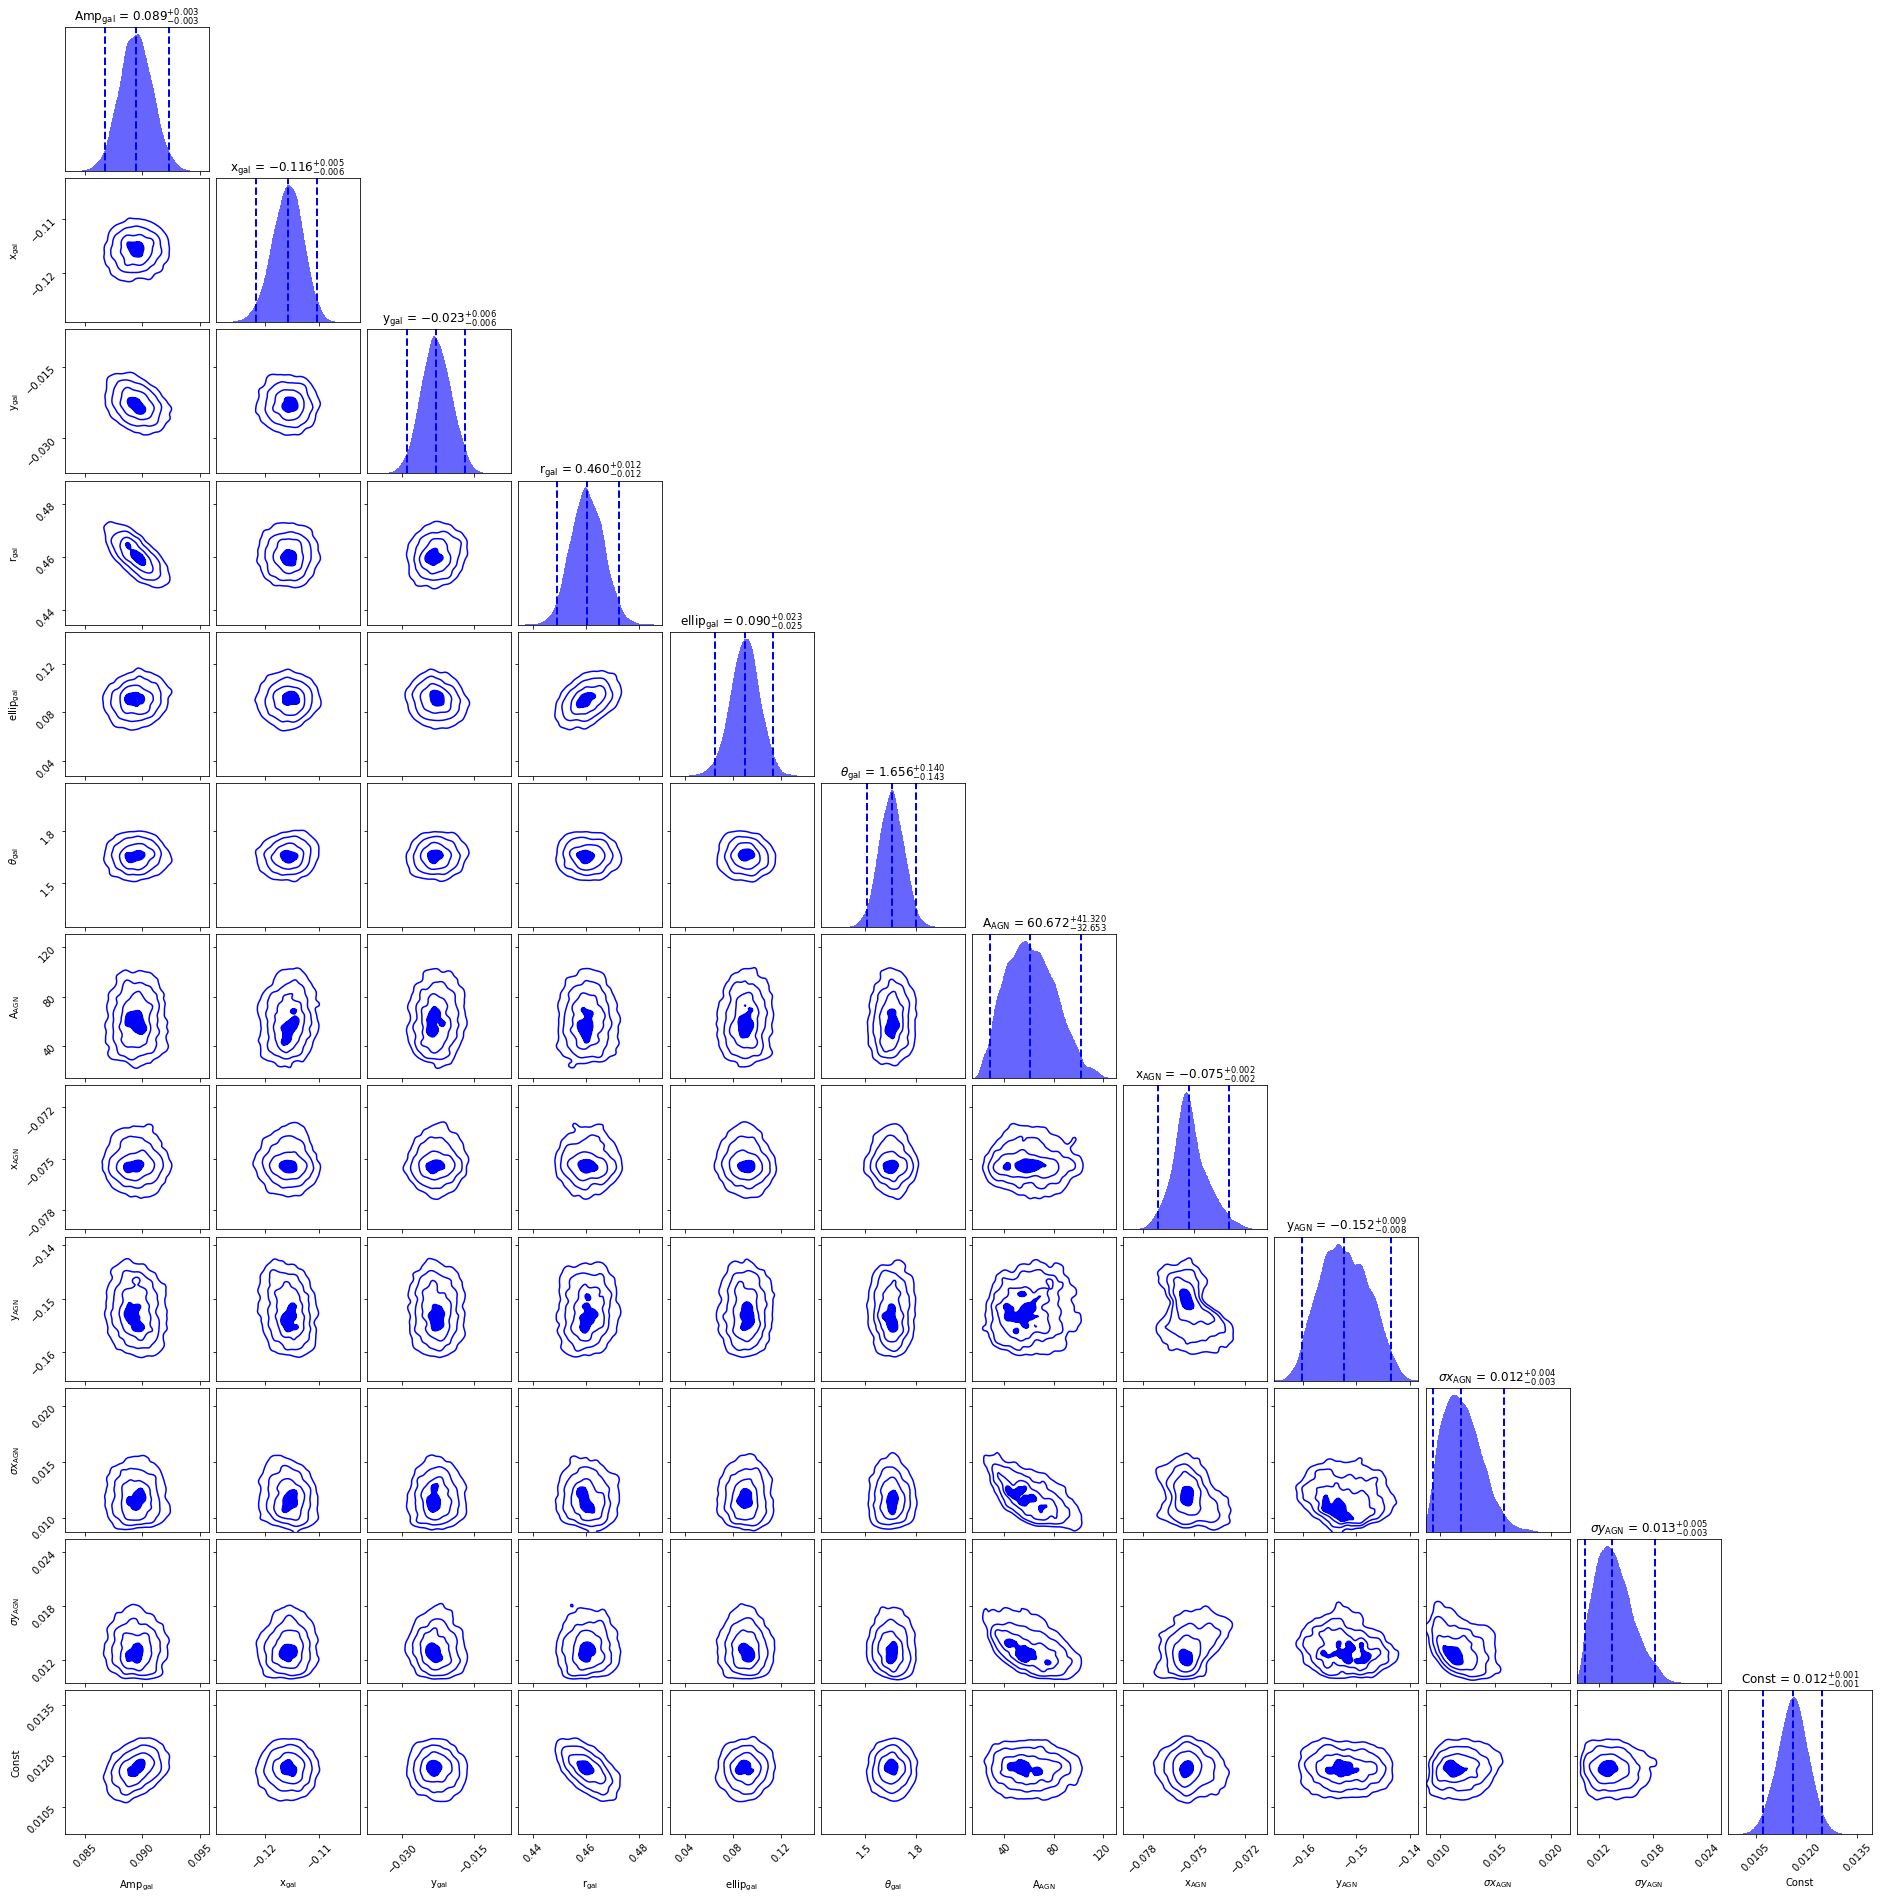
We thus performed a two-dimensional multi-component photometric decomposition of the map. In particular, we used a 2D Gaussian profile to reproduce the emission from the unresolved BLR, the marginally resolved outflows (see Figure 3) and also taking into account the possibility of an unresolved bulge (Lelli et al. 2021 find that the bulge size is less than 300 pc, hence it is unresolved in our observations) and a 2D Sérsic profile (Sérsic, 1963) with index equal to 1 (exponential disk) to describe the emission arising from the galactic disk. We also added a 2D constant to account for a possible residual of background emission. The combination of the three models was then convolved with a Gaussian point spread function of FWHM ″obtained from the BLR flux map (see Appendix A for a detailed analysis).
The fit was carried out by using Dynesty (Speagle, 2020), a Dynamic Nested Sampling Python code that allows us to estimate the Bayesian evidence and the posterior distribution of the free parameters. For the 2D Gaussian model we assumed as free parameters the centroid position, the standard deviation along the RA and Dec directions, and the amplitude. For the 2D Sérsic model the free parameters are the normalization constant, the position of the center, the effective radius, the ellipticity, and the position angle.
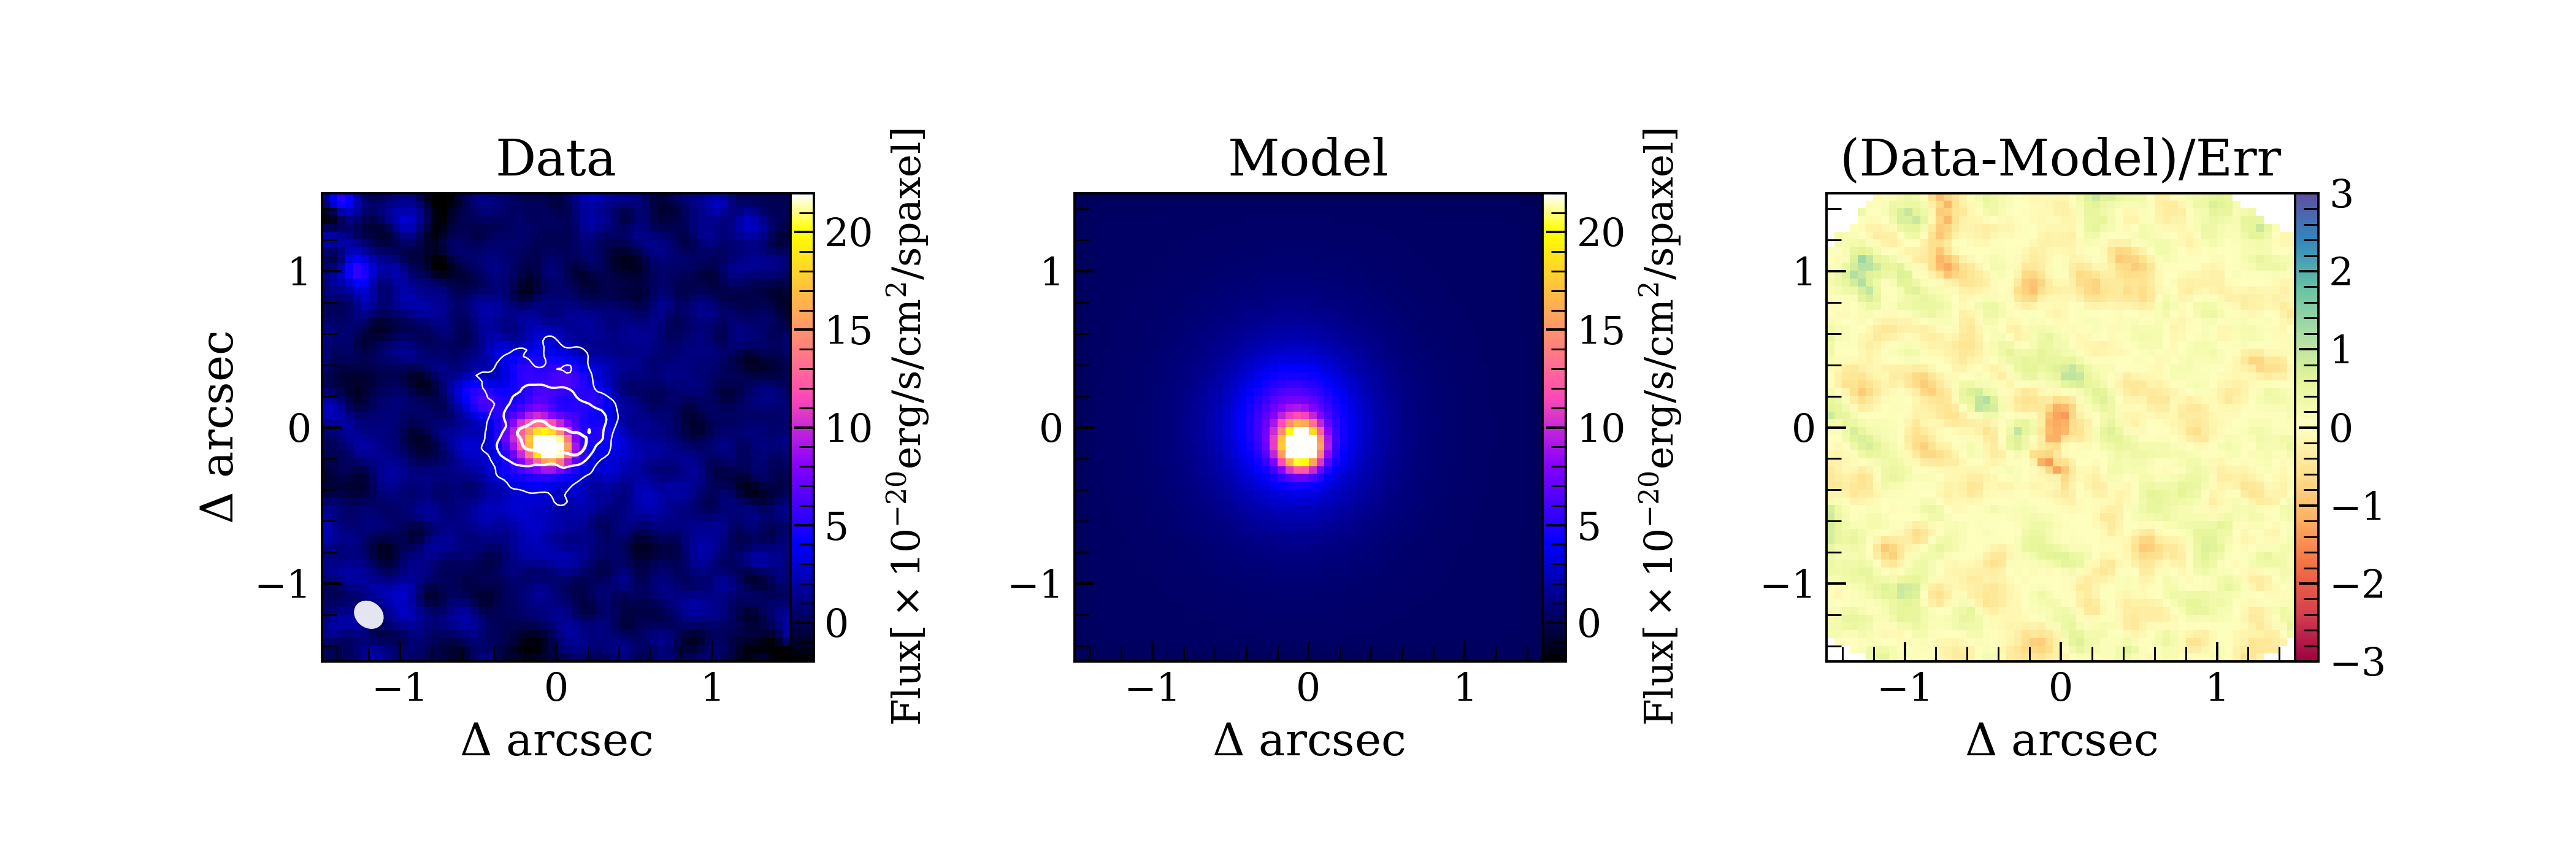
The data and best fitting model are shown in Figure 4, while the corner plots for the posterior distributions of the free parameters and their best fitting values are shown in Figure 14. The majority of the observed flux is coming from the AGN emission (BLR+outflows) with a 2D Gaussian size of ″ that is five times smaller than the size of one spaxel and thus consistent with the emission from a point-like source. The effective radius of the disk is corresponding to an exponential scale radius of kpc 333. The H disk scale radius is comparable within the errors with the disk radius measured with the [Cii] emission line ( De Breuck et al., 2014; Parlanti et al., 2023). We discuss the similarities and differences between the two tracers and the origin of such discrepancies in Section 8.
The ellipticity of the galaxy is corresponding to an inclination angle of 444Ellipticity = , where and are the semi-major and semi-minor axes, respectively. We estimate the inclination as . assuming an infinitely thin disk. We note that the centroids of the two components have different positions (see best fit results in Figure 14), with the Sérsic component being shifted northward by 0.9 kpc with respect to the BLR+outflow flux map centroid. This offset is probably caused by a central concentration of dust in the galaxy that absorbs H emission from the core (see Lelli et al., 2021, Fig. 1a).
4 Excitation mechanism
The rest-frame optical emission lines can be used to characterize the primary source of excitation of the gas in the ISM of galaxies. We thus exploit the Baldwin-Phillips-Terlevich (BPT) diagram (Baldwin et al., 1981), [Oiii]5007Å/H versus [Nii]/H, to determine the dominant source of ionizing radiation and distinguish the regions mainly excited by young stars from those where the ionization mechanism is dominated by AGN radiation.
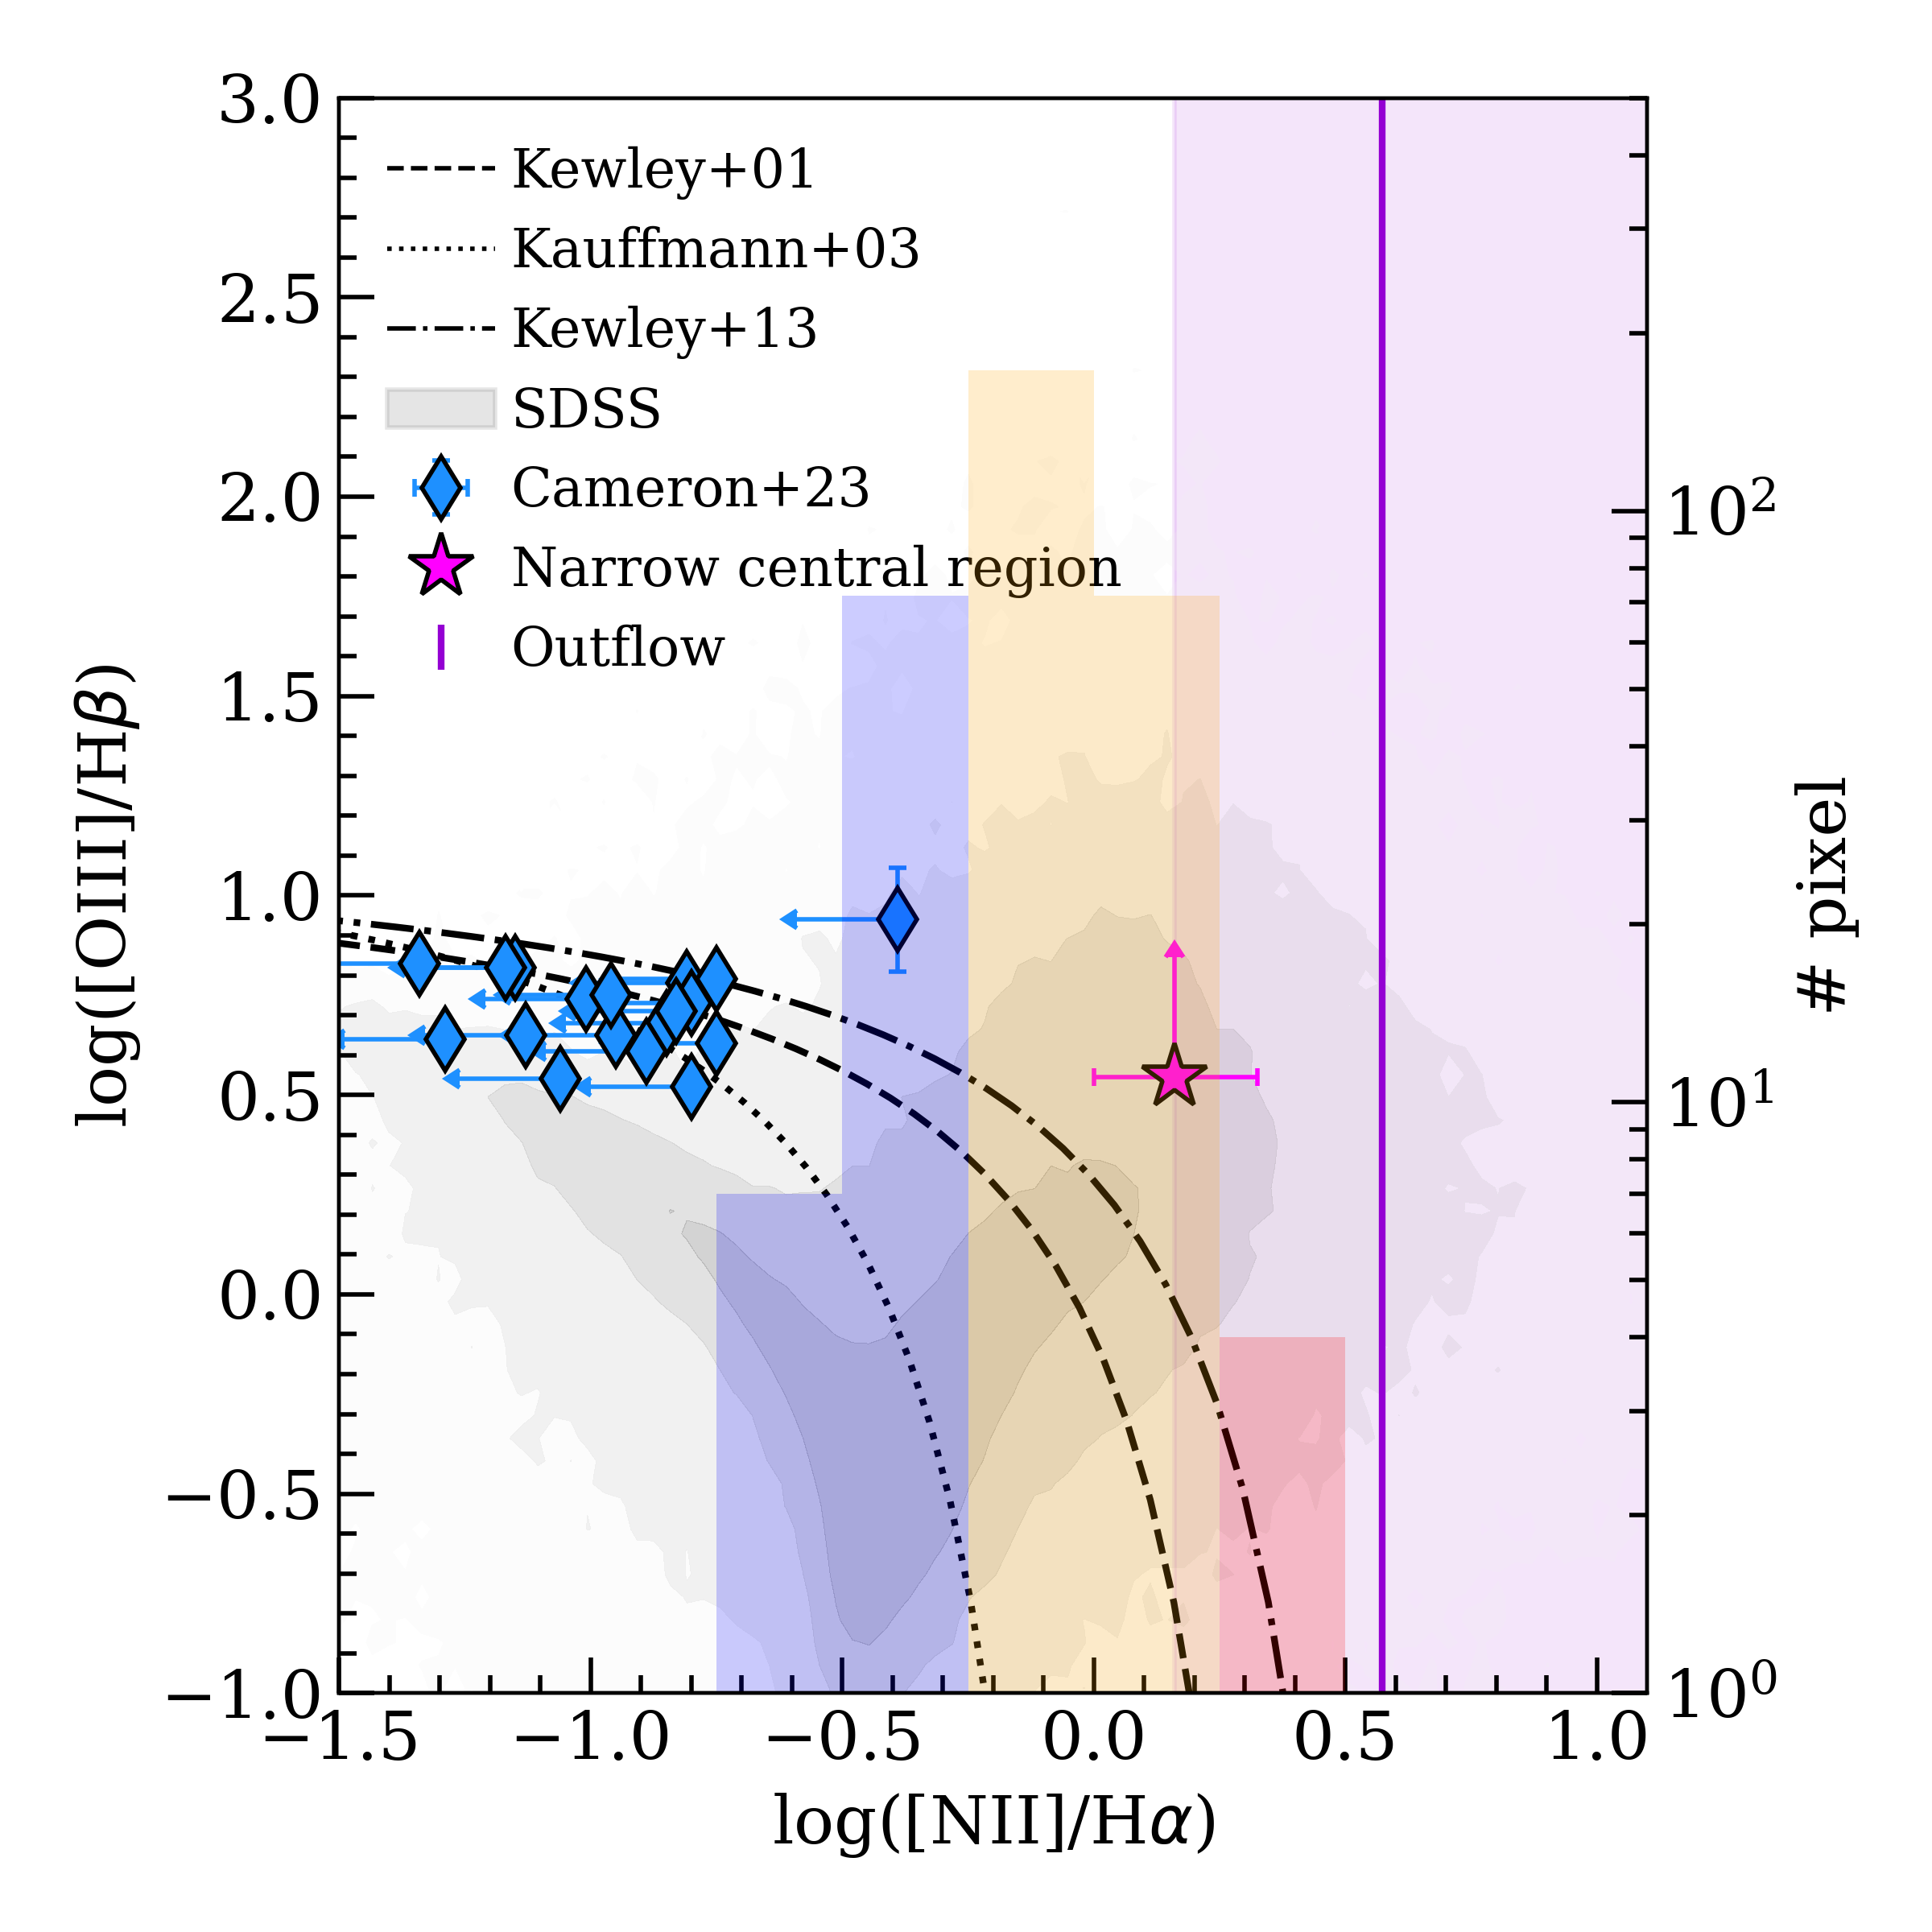
Figure 5 shows the line ratios of the narrow component for the integrated nuclear 1D spectrum, whose line fluxes are reported in Table 1. Since we do not detect the H line, we can only report a lower limit on [Oiii]5007Å/H line ratio of 3.50. This is sufficient to conclude that the gas in the nuclear region of the galaxy is excited by the AGN radiation (Kauffmann et al., 2003; Kewley et al., 2013). For the outflow component, we have upper limits for both [Oiii] and H and so we can report only a vertical line at the location of [Nii]/H line ratio in the BPT diagram. The line ratio indicates that the photoionization by the central AGN dominates the gas ionization with no obvious sign of a major contribution from young stars. This supports the fact that the outflowing gas is likely accelerated by AGN radiation. The kinematics of this gas will be discussed in detail in Section 6.
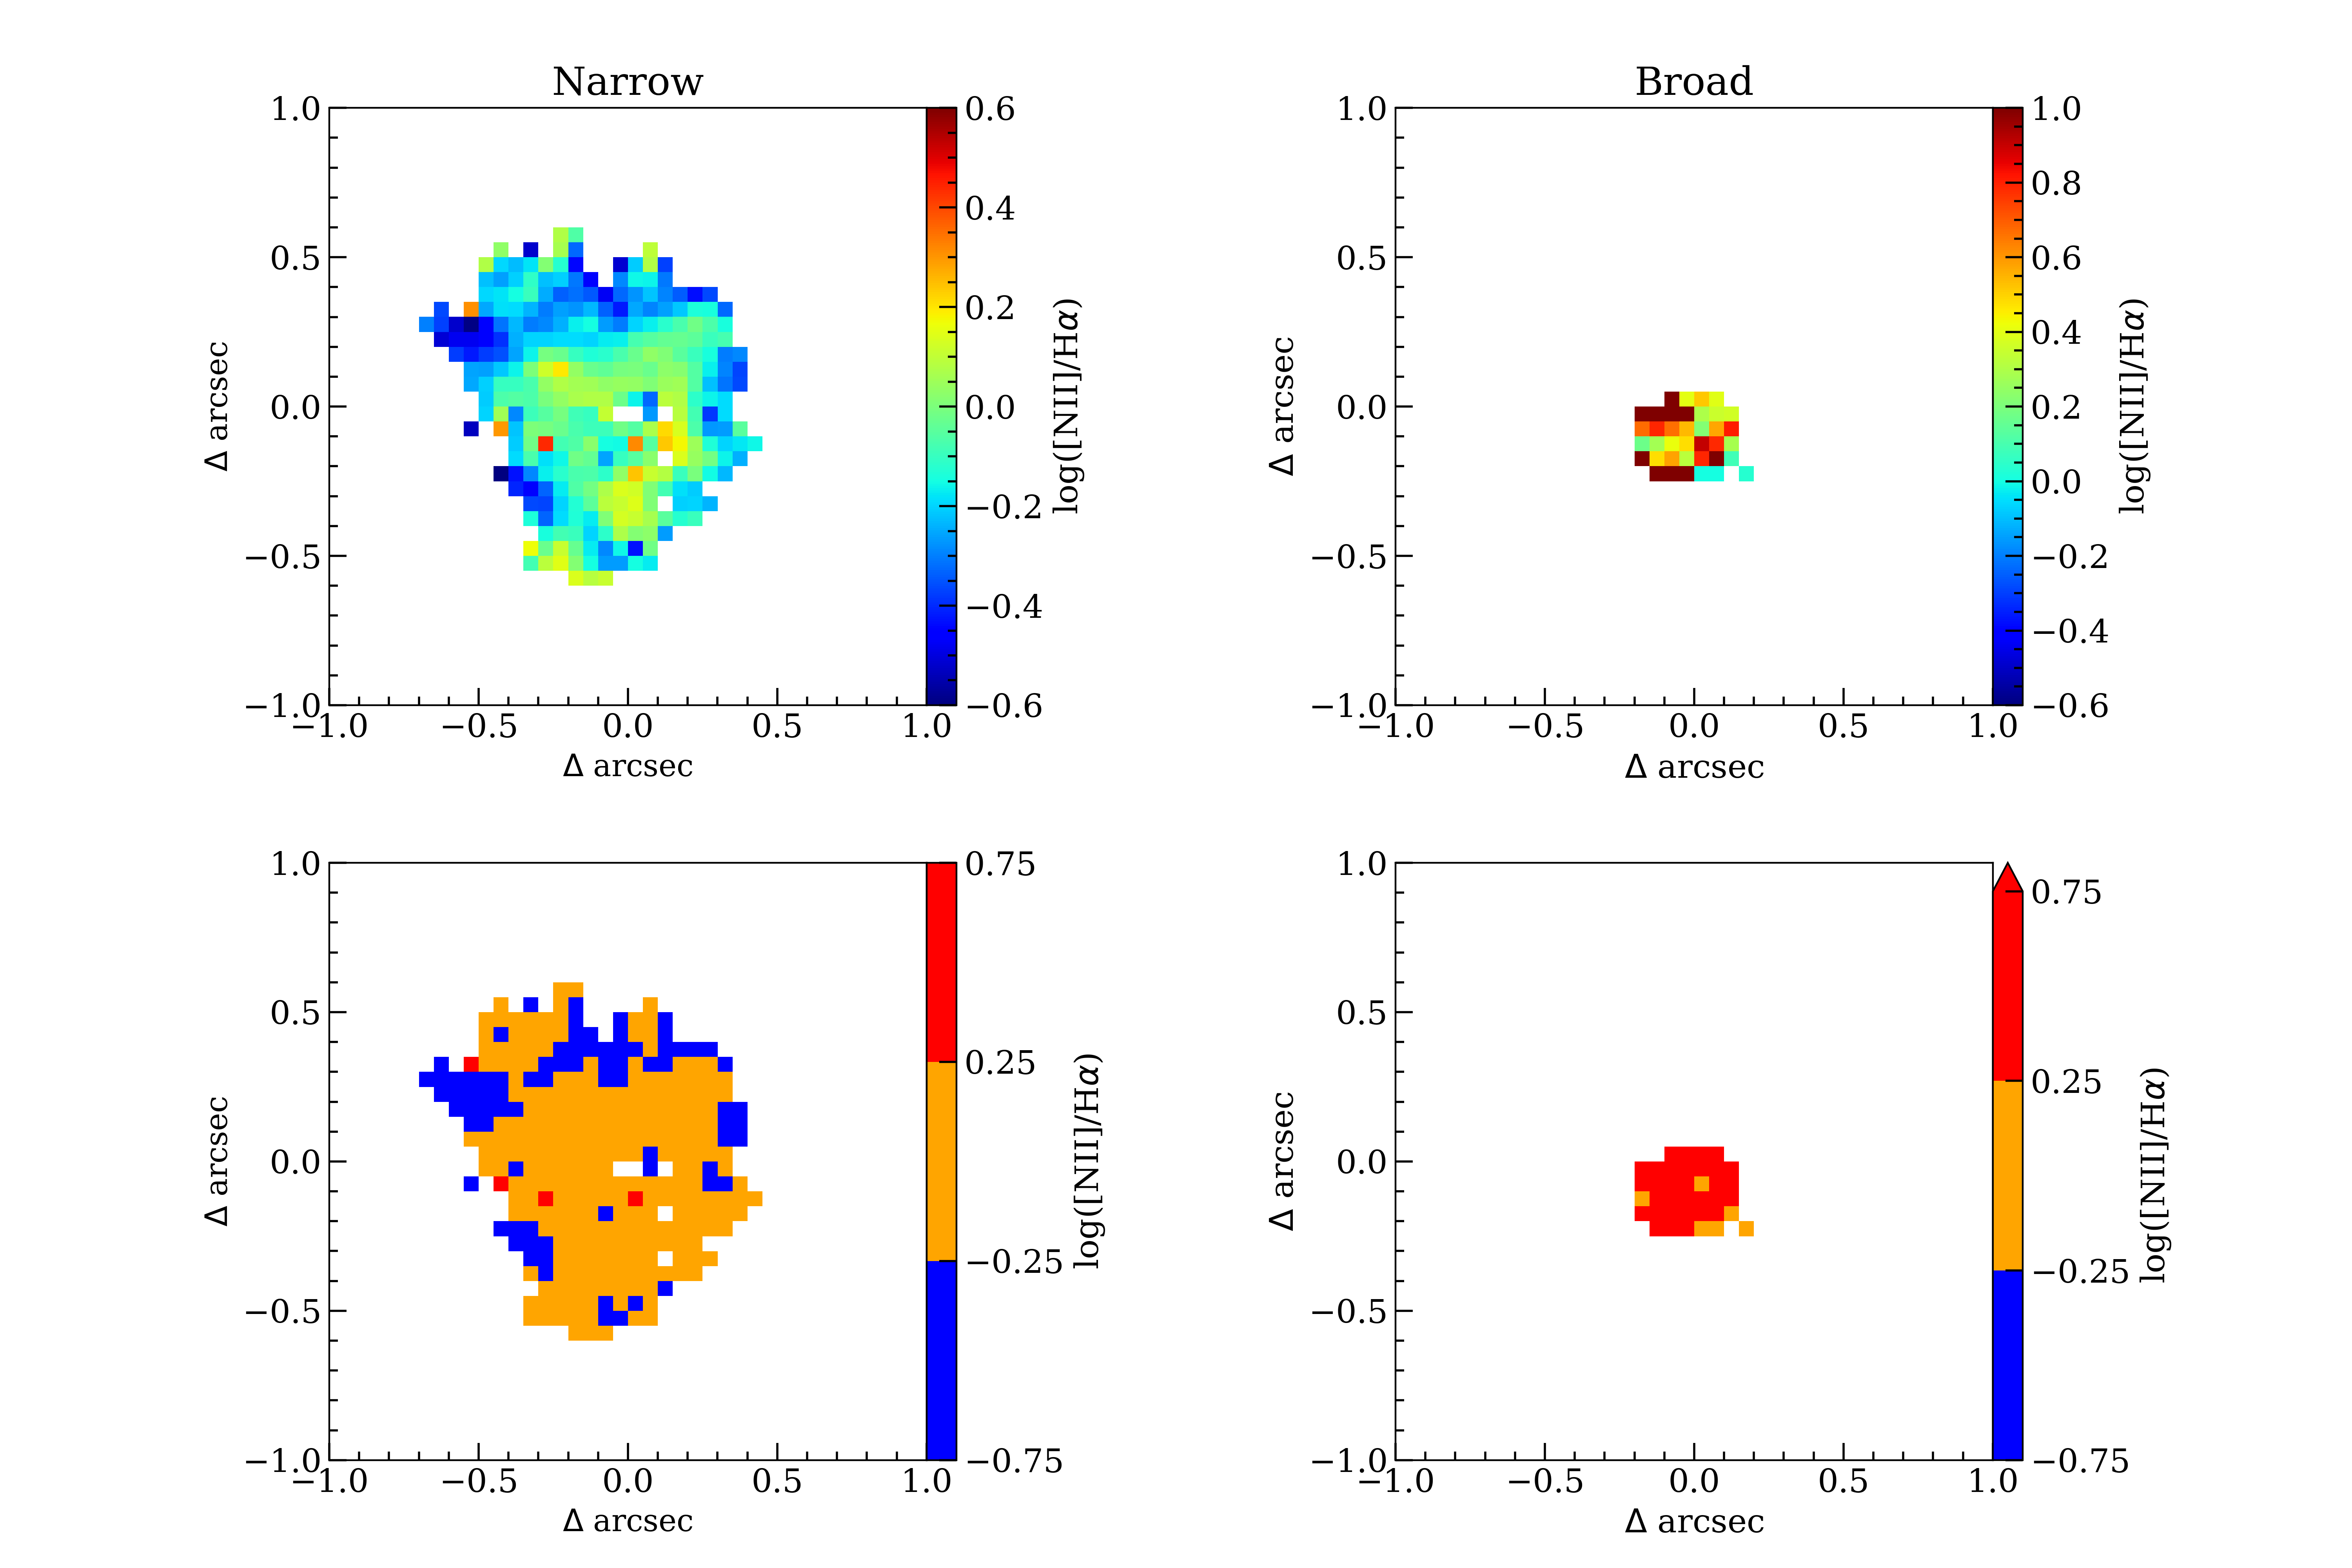
We also investigate the spatially resolved excitation properties of the ionized gas but, since we do not detect H and [Oiii] in the individual spaxels of the data cube, we can only probe the [Nii]/H line ratio. In the upper left panel of Figure 6 we report the spaxel-by-spaxel value of ([Nii]/H). We observe a gradient from the central regions to the outskirts of the galaxy where the values of ([Nii]/H) decrease at increasing radii. Since we only have this diagnostic to infer the excitation mechanism of the ISM in the galaxy, we define the three following possible ranges of ([Nii]/H) based on the demarcation lines suggested by Kewley et al. (2001, 2013) and Kauffmann et al. (2003): region likely dominated by SF excitation (([Nii]/H) ), region photoionized by AGN (([Nii]/H) ), and composite region ([Nii]/H) ). In the BPT diagram in Figure 5 we show the number of spaxels as a function of ([Nii]/H) of the host galaxy component color-coded according to the aforementioned three categories, while in the lower left panel of Figure 6 we report their spatial distribution.
The majority of the spaxels show a line ratio consistent with “composite” excitation and only a few spaxels have high enough [Nii]/H flux to end up in the AGN region, but they reside in the outer region of the galaxy where the S/N is lower, also they are non-adjacent, so consistent with being due to S/N fluctuations shifting the category from composite to AGN. At large radii from the center, there is a number of spaxels with low () [Nii]/H suggesting that in these regions the excitation mechanism is likely dominated by star-formation activity. In conclusion, the spatially resolved BPT diagram indicates that the excitation mechanism is due to both an AGN and a young stellar population. Based on the results obtained from the nuclear-integrated 1D spectrum, we speculate the central part of the galaxy is mainly AGN-dominated while the excitation by young stars dominates at large radii. On the other hand, if we compute [Nii]/H spaxel-by-spaxel for the outflow component, we find that most of the spaxels have ([Nii]/H) (upper and lower right panels of Figure 6) indicating that the outflows are likely driven by AGN activity.
5 Black Hole Properties
Assuming that the gas in the BLR is virialized, we can estimate the BH mass by using the calibration by Greene & Ho (2005):
| (1) |
where and are the dust-corrected luminosity and the FWHM of the broad H line associated with the BLR.
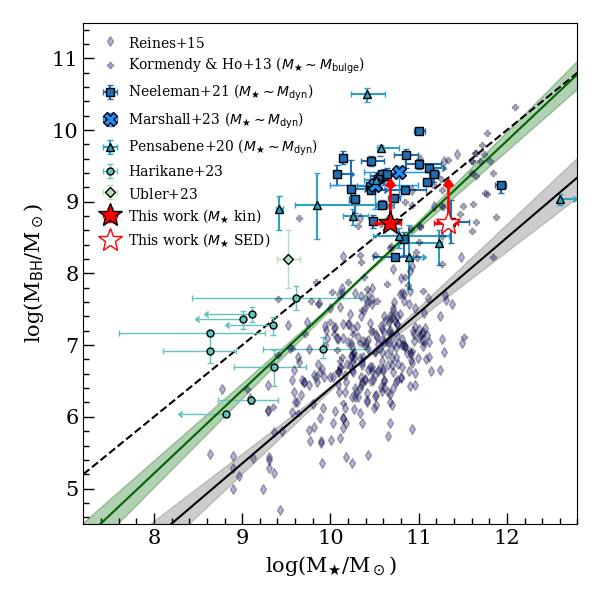
We note that the lack of detection of the H line does not allow us to correct the H for the dust extinction of the galaxy and AGN torus. Hence the inferred luminosity for the BLR component is only a lower limit and consequently, we can only determine a lower limit on the BH mass: . Figure 7 shows the relation between the stellar mass and the black hole mass for ALESS073.1, where we use the stellar mass of computed by Lelli et al. (2021) with a kinematic analysis, and computed by Circosta et al. (2019) with the SED fitting. We compare our results with those obtained from other AGN-host galaxies both at high redshift () (Pensabene et al., 2020; Neeleman et al., 2020; Harikane et al., 2023; Übler et al., 2023) and in the nearby Universe () (Reines & Volonteri, 2015), and the local massive “red-and-dead” elliptical galaxies and classical bulges (Kormendy & Ho, 2013). The estimated BH mass places ALESS073.1 above the relation by Reines & Volonteri (2015) yielding a ratio times higher than those estimated in local AGN by using the stellar mass estimated by SED and kinematical fitting, respectively. However, the inferred is consistent within the uncertainties with the relation determined for massive quiescent local galaxies and high redshift luminous quasars (Kormendy & Ho, 2013; de Nicola et al., 2019; Pensabene et al., 2020). As with other high-redshift AGN and quasars, it lies above the relation (Decarli et al., 2010; de Nicola et al., 2019; Pensabene et al., 2020; Neeleman et al., 2021). These high-redshift observations suggest that the BH growth dominated early on, with the galaxy catching up later. This requires that feedback and self-regulation are somehow different at early times with respect to what is observed in local AGN.
We can also compute a limit on the Eddington luminosity by using:
| (2) |
where is the proton mass and is the Thompson scattering cross-section. We obtain an Eddington luminosity of . Comparing it with the bolometric luminosity of the AGN of computed in Circosta et al. (2019), we obtain an Eddington ratio of implying that the BH is accreting at a much lower rate than the Eddington limit. This is consistent with an evolutionary sequence where obscured AGN, like ALESS073.1, are in an early phase of quasar evolution that lasts until the Eddington ratio reaches values close to unity and the AGN radiation is able to sweep away gas and dust from the galaxy, revealing the emission of the bright unobscured AGN (i.e, blue quasars). According to this evolutionary path, we might conclude that the outflow in ALESS073.1 is not yet energetic enough to affect the star-formation activity in the galaxy. We further investigate this possibility in Section 8.
6 Outflow
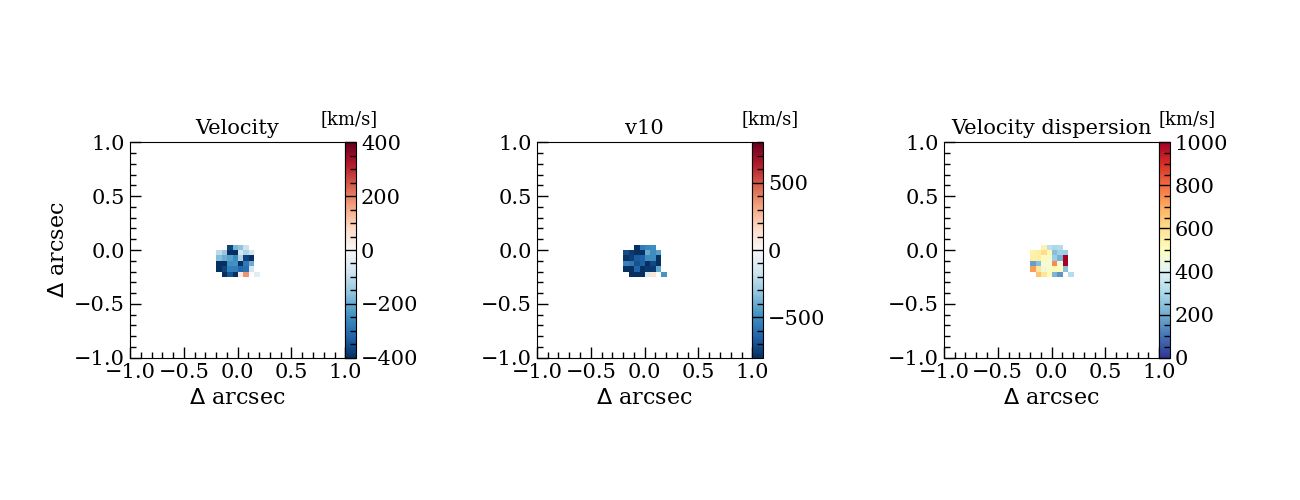
In this Section, we study the mass outflow rate and the energetics of the warm ( K) ionized gas traced by the “outflow” component of H and [Nii] identified as the broader component associated with each line in the Gaussian fit. Figure 8 shows the kinematic maps of the outflow. The maps reveal a pattern that is not compatible with a rotating disk. Most of the spaxels in the velocity map (left panel) show negative values that are consistent with gas approaching along the line of sight. As often reported for other AGN-host galaxies (Fischer et al., 2013; Bae & Woo, 2014; Perna et al., 2017), a corresponding redshifted component of the outflow is missing in ALESS073.1, probably due to dust obscuration of the receding side of the outflow. The central panel of Figure 8 shows the map, the velocity at the 10th percentile of the “outflow” component in each spaxel, which is usually adopted to trace the highest-velocity blueshifted gas in the outflows. We find regions in which the gas reaches a velocity as high as supporting the fact that this gas cannot be associated with the rotation of the disk, given that the maximum velocity of the rotating disk is 400 (Lelli et al., 2021; Parlanti et al., 2023).
The mass of gas expelled by the outflow can be estimated by following Cresci et al. (2023) as
| (3) |
where is the extinction-corrected H luminosity of the outflow and is the electron density of the outflow. To determine the intrinsic H luminosity we use the color excess estimated from the SED fitting by Circosta et al. (2019). By using the Calzetti et al. (2000) reddening curve, we thus calculate a dust extinction that is consistent with the lower limit determined by the Balmer decrement measurement. In conclusion, by using the value in Tab. 1 for the flux of the H outflow we obtain an extinction-corrected H luminosity of erg s-1. For the electron density, since the density-diagnostic [Sii]6716,31 line doublet is not detected in our observation, we have assumed the fiducial value of 1000 cm-3 (Förster Schreiber et al., 2019; Perna et al., 2023; Übler et al., 2023) and the uncertainties are computed assuming a range of densities between 200 and 2000 cm-3, based on the outflow densities of densities measured in high-redshift galaxies (Isobe et al., 2023). We thus obtain a mass of the ionized outflow of .
The ionized outflow rate is calculated as follows assuming time-averaged thin expelled shells (Lutz et al., 2020)
| (4) |
where and are the outflow velocity and radius, respectively. We adopt the prescription by Genzel et al. (2011) to estimate the velocity of the outflowing gas that takes into consideration that the emission line from the outflowing outflow is spectrally broadened due to projection effects and the velocity of the line wing traces the velocity component of the outflow directed along the line of sight, hence tracing the outflow intrinsic velocity. Thus, we obtain: where for the values of the velocity shift and the outflow velocity dispersion we use the values obtained from the fit of the spatially integrated spectrum in Sec 3.1. For the outflow extent, we use the half width at half maximum (HWHM) of the JWST PSF at 3.78 m given that the surface brightness emission of the “outflow” component is marginally resolved. We infer a mass outflow rate of . We note that the outflow radius might be smaller than the angular resolution, therefore the reported mass outflow rate may be considered a lower limit.
We also compute the upper limits on the kinetic and momentum rate of the ionized outflow as and , respectively. We obtain and with uncertainties of one order of magnitude. The outflow kinetic rate is of the bolometric luminosity. This is times smaller than the theoretical values () expected for quenching massive galaxies (Di Matteo et al., 2005; Choi et al., 2012; Costa et al., 2018; Harrison et al., 2018). This can suggest that the obscured AGN has not yet reached its maximum activity.
We then calculate the mass loading factor, defined as , where we adopt the SFR M⊙ yr-1 for ALESS073.1 obtained by Circosta et al. (2019) with a SED fitting. We obtain a mass loading factor of the order of 1%, meaning that only a minor part of the gas present in the central region is expelled compared to the gas used to create stars, and the outflow strength is probably not sufficient to remove gas and halt the vigorous, ongoing star formation in the system. We note that using other SFR estimations result in a low mass loading factor as well ( M⊙ yr-1, M⊙ yr-1; De Breuck et al. 2014).
7 Gas kinematics
In this Section, we investigate the gas kinematics traced by the H narrow component that maps warm ionized gas in the interstellar medium of the galaxy and we compare it with the results obtained by studying the [Cii] emission.
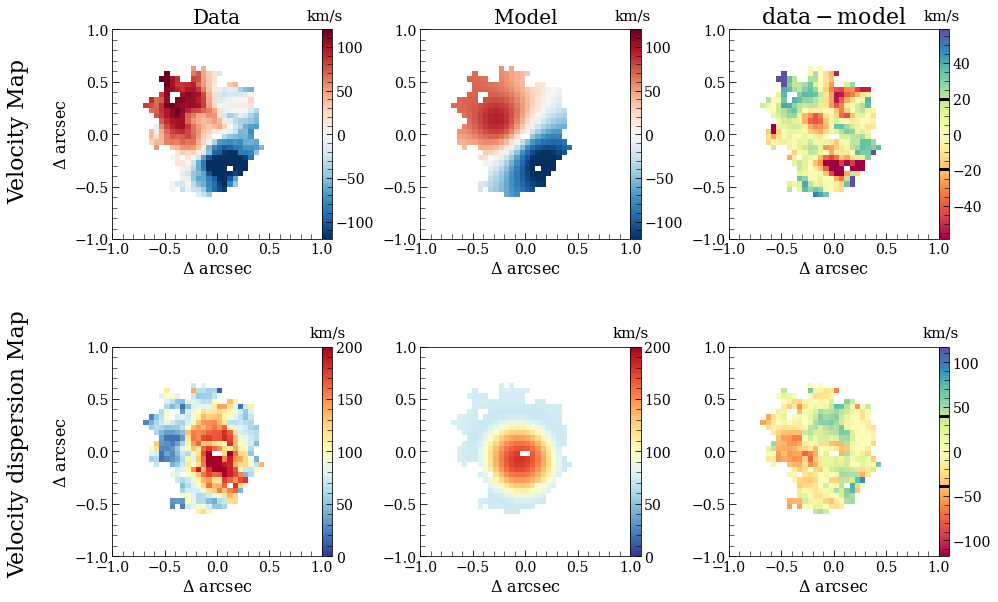
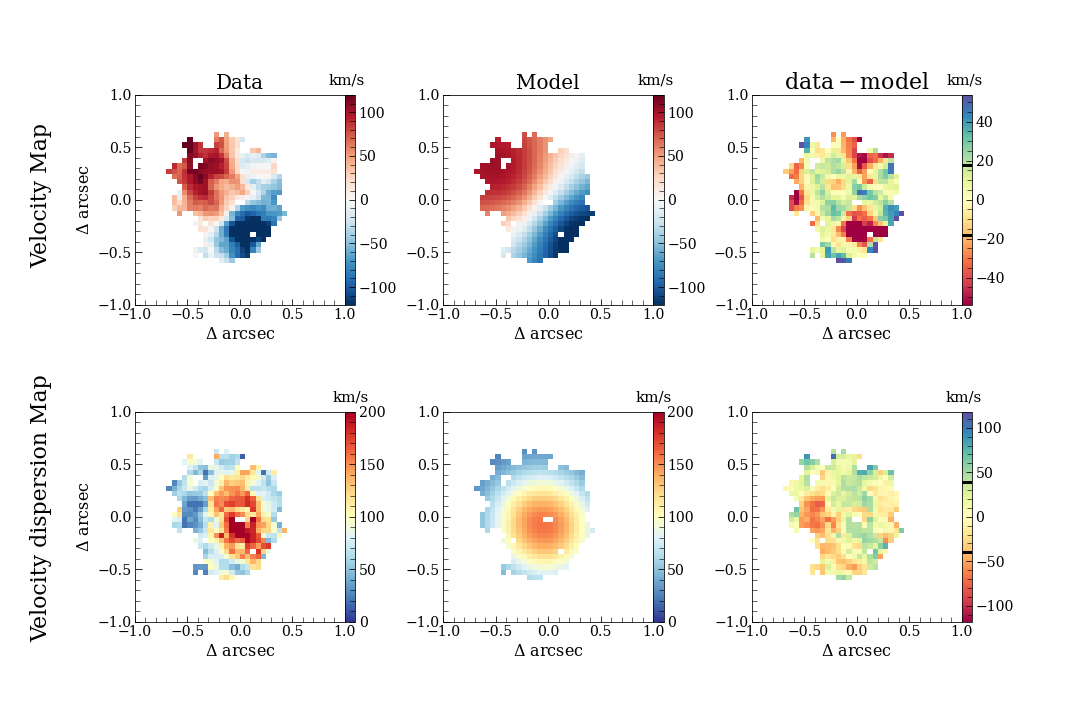
The first two panels on the left of Figure 9 illustrate the velocity and velocity dispersion maps of the H narrow component. The velocity and velocity dispersion maps are computed as the displacement between the centroid position of the line in that spaxel with respect to the centroid position computed in the central region, and the standard deviation of the emission line deconvolved of the instrumental spectral resolution computed on a spaxel-by-spaxel level (see Section 3.2), respectively. The velocity map shows a velocity gradient that spans a range of velocities between –120 and 120 with respect to the systemic redshift of the galaxy. The velocity pattern is consistent with that observed in [Cii] by Lelli et al. (2021) and indicates the presence of a regularly rotating disk. We note that the velocity gradient is not symmetric on the red-shifted and blue-shifted sides, with the blue side having higher velocities closer to the center with respect to the red-shifted one, and the blue-shifted side being less extended. On the north-western side, we also note that the velocity pattern is irregular, similar to what is found in the [Cii] kinematic analysis (Lelli et al., 2021) that might indicate the presence of a spiral arm.
Following Parlanti et al. (2023), we model the H kinematics using the publicly available python library KinMS (Davis et al., 2013) that creates mock data cubes based on flux, velocity, and velocity dispersion radial profiles. We set up KinMS to simulate our NIRSpec observations, setting an angular resolution of ″(see Appendix A) and a spectral resolution of 49 . We then generate the moment maps to compare directly with the observations and verify the accuracy of the model in reproducing the data. The best-fit parameter values for the kinematic model are found using the package emcee (Foreman-Mackey et al., 2013) that allows us to estimate the posterior probability distribution for the n-dimensional parameter space that defines our disk models by adopting a Markov Chain Monte Carlo (MCMC) algorithm. Differently from the analysis by Parlanti et al. (2023) we do not use a parametric function to reproduce the gas kinematics of ALESS073.1 as the [Cii] observations reveal a complex radial profile of the velocity curve. Lelli et al. (2021) find indeed that the de-convolved velocity is as high as in the nuclear region ( kpc) of the galaxy which is comparable with what is observed in the outskirt of the galaxy. These kinematics cannot be reproduced by the velocity curve of an exponential disk, as we show and discuss in Appendix B. The flat profile of the [Cii] velocity indeed suggests the presence of a bulge component in addition to the classic exponential kinematic component (Lelli et al., 2021; Parlanti et al., 2023).
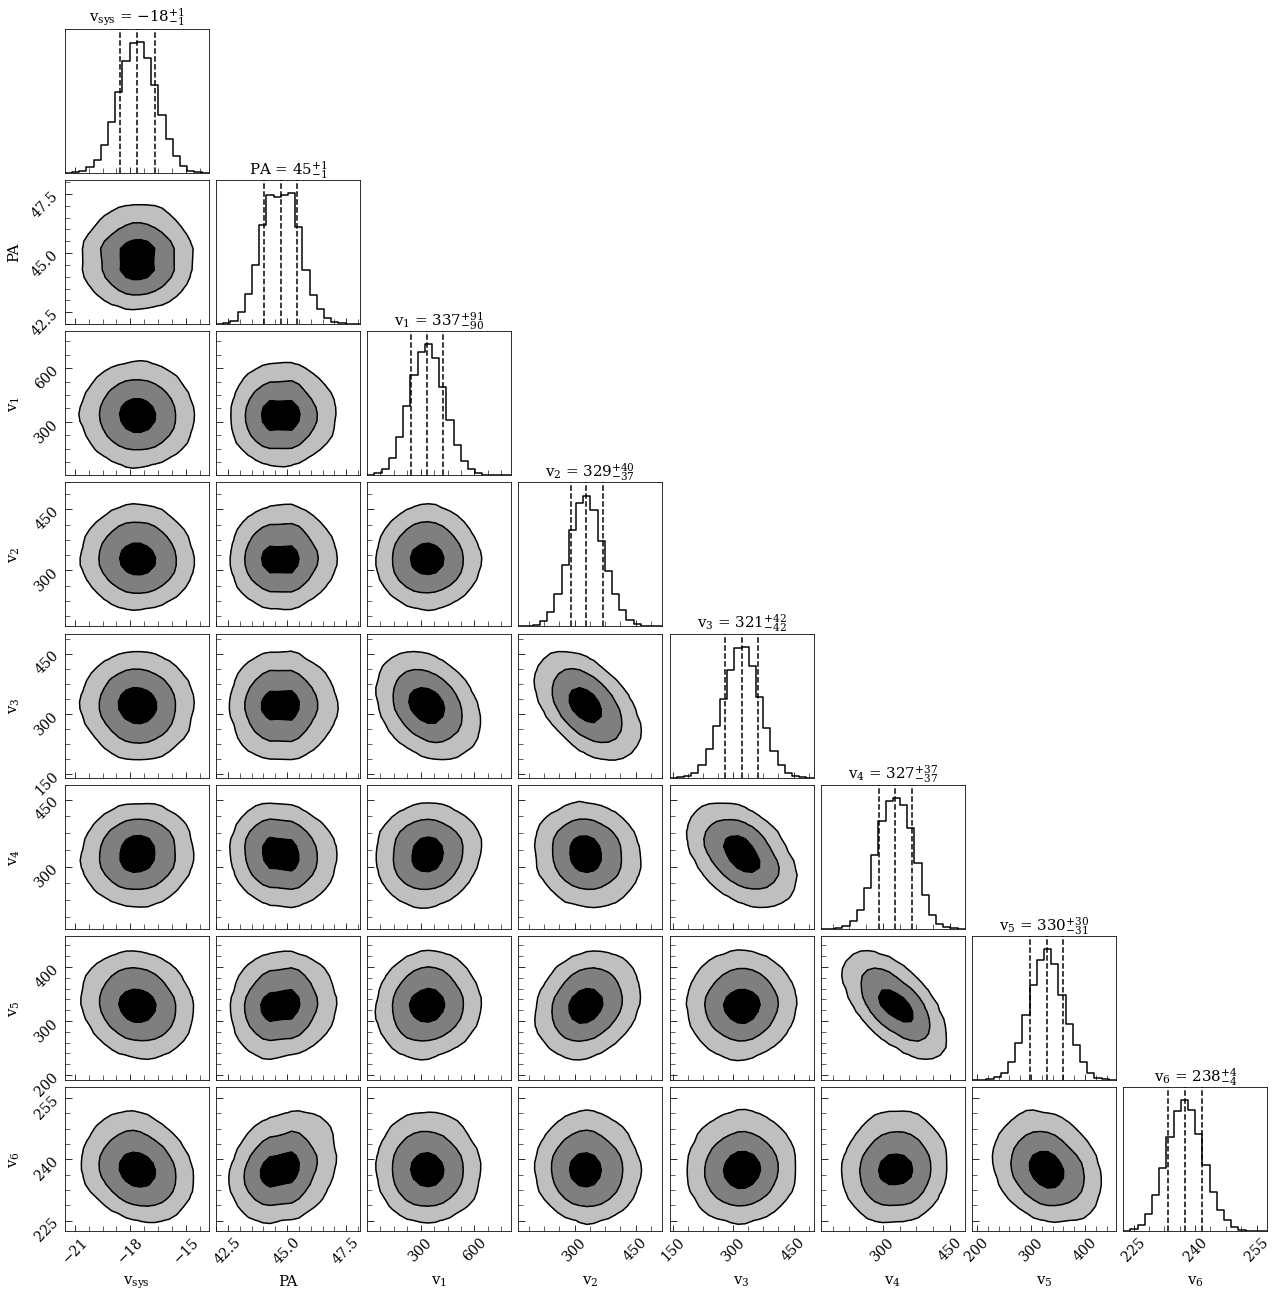
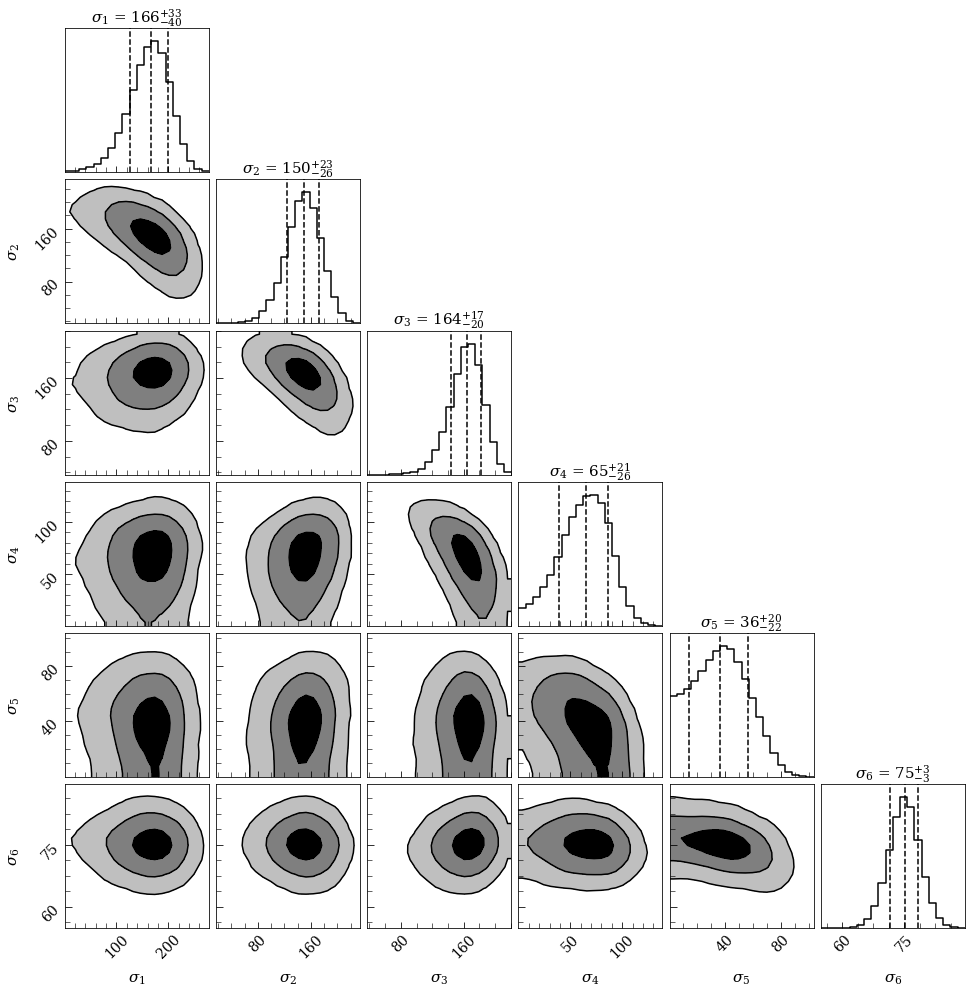
Thanks to the flexibility of KinMS, we adopt a non-parametric model to reproduce the observed velocity and velocity dispersion profile as a function of the radius. In particular, the H kinematics is modeled as a series of concentric circular rings having a width of 0.6 kpc (i.e. 0.09″), which is comparable to the HWHM of the PSF of NIRSpec IFS at the H wavelength. In each ring, we assume that the emitting clouds have the same radial velocity and velocity dispersion. For the velocity fitting we assume Gaussian priors with a standard deviation of 100 centered around the velocity of the previous ring. The velocity of the first ring was left free to vary between 0 and 1000 . Similarly, for the velocity dispersion of each ring, we assume Gaussian priors with a standard deviation of 50 centered on the velocity dispersion of the previous ring leaving the first ring free to vary between 0 and 500 . Using Gaussian priors allows us to ensure the continuity of the velocity and velocity dispersion profiles and that the discontinuities in the profiles are driven by a real increase in the likelihood. We note that assuming flat priors for each ring does not change the maps in Figure 9, but introduces discontinuities in the intrinsic profiles, that are then washed out by the beam smearing process when making the moment maps.
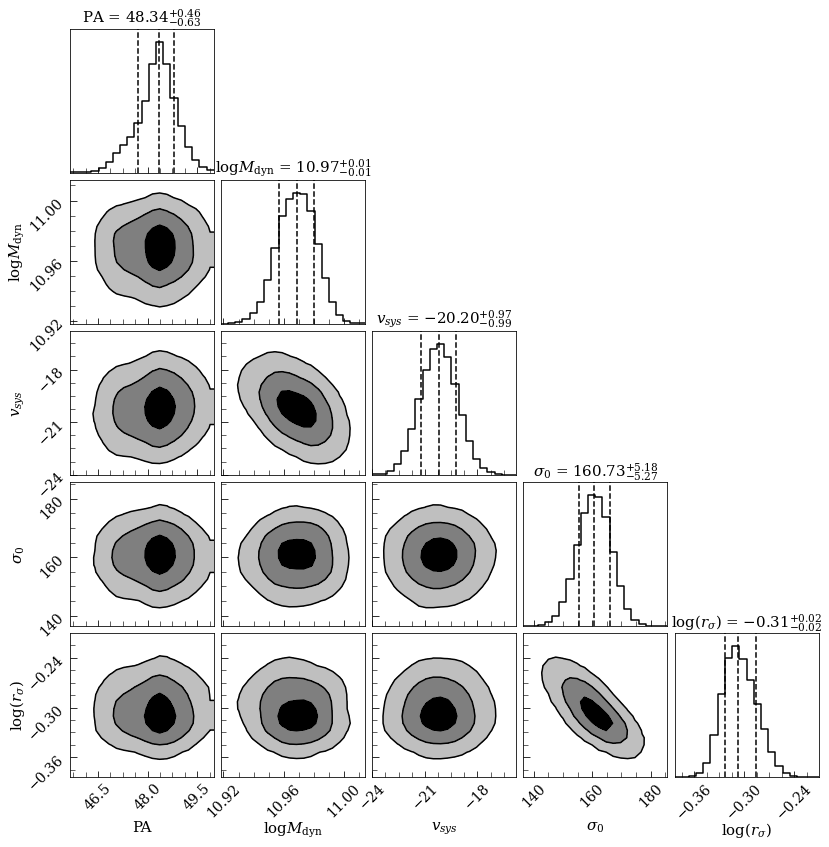
We let the disk position angle free to vary with flat priors between 0 and 90 deg, while we fixed the inclination angle of the galaxy to 22 as found by Lelli et al. (2021) and compatible within the errors with the value of inclination found in Section 3.3. The emitting clouds are distributed over the rings following the surface brightness profiles obtained from the best-fit results of the flux map (Section 3.3). We note that the resolution and sensitivity do not allow us to determine stringent constraints on the velocity and velocity dispersion profiles if we adopt a disk model with a ring size smaller than the PSF HWHM due to the beam smearing. We also observe that the last ring is only probed by the outer region of the redshifted side of the galaxy as it is more extended than the blueshifted one.
The best-fit results are reported in Table 2 and the best-fit model and residual maps of the velocity and velocity dispersion are reported in Figure 9. In Figures 15 and 16 we also report the corner plot to highlight the best-fit parameters and the posterior distributions that show degeneracy between the parameters. We note that the velocity and velocity dispersion of each ring degenerate with the ones of the previous ring. In particular if one increases the other one decreases, and vice versa. This is expected and consistent with the beam smearing that acts to average out these differences. The inferred disk position angle is in agreement with the one found for the [Cii] kinematics by Lelli et al. (2021).
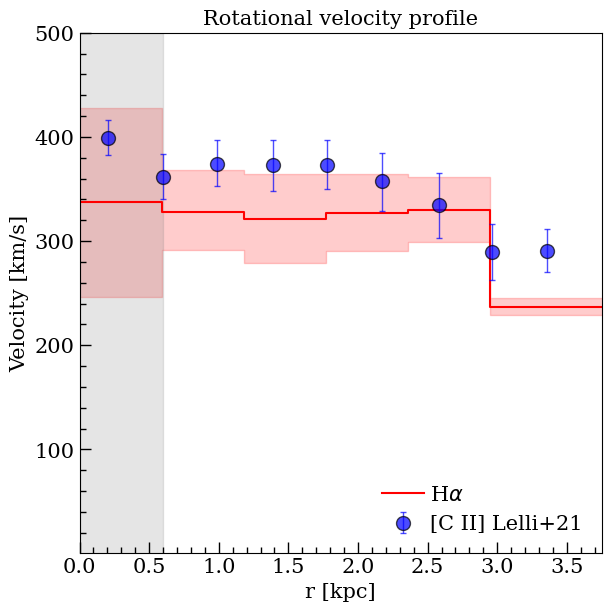
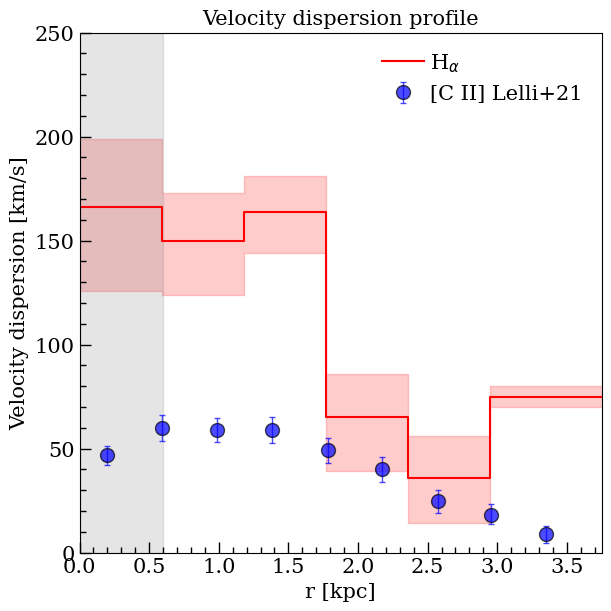
The left panel of Figure 10 shows the best-fit velocity curve of H, which is in agreement, within the errors, with the profile inferred from [Cii] observation. The velocities reach a value of at small scales and slightly decrease at large radii down to values of the order of . This result supports the scenario that ALESS073.1 has already formed a bulge at its center that dominates the dynamics of the gas.
The velocity dispersion profile is reported in the right panel of Figure 10 and spans a range between 30 and 170 . Differently from the velocity curve, here we note a discrepancy between [Cii] and H gas kinematics. The velocity dispersion of the warm ionized gas is, on average, higher than the velocity dispersion of the cold gas mapped by the carbon line. In the inner 1.5 kpc the velocity dispersion observed in H is even three times larger than the one traced by [Cii]. At larger radii, the discrepancy decreases and in the two rings between 1.5 and 3.0 kpc the velocity dispersion of [Cii] is comparable (within the uncertainties) with the one derived from H.
As the discrepancies between our results and those found by Lelli et al. (2021) might depend on the different approaches and tools used to fit the data, we compare directly the velocity dispersion maps in the same regions of the galaxy.
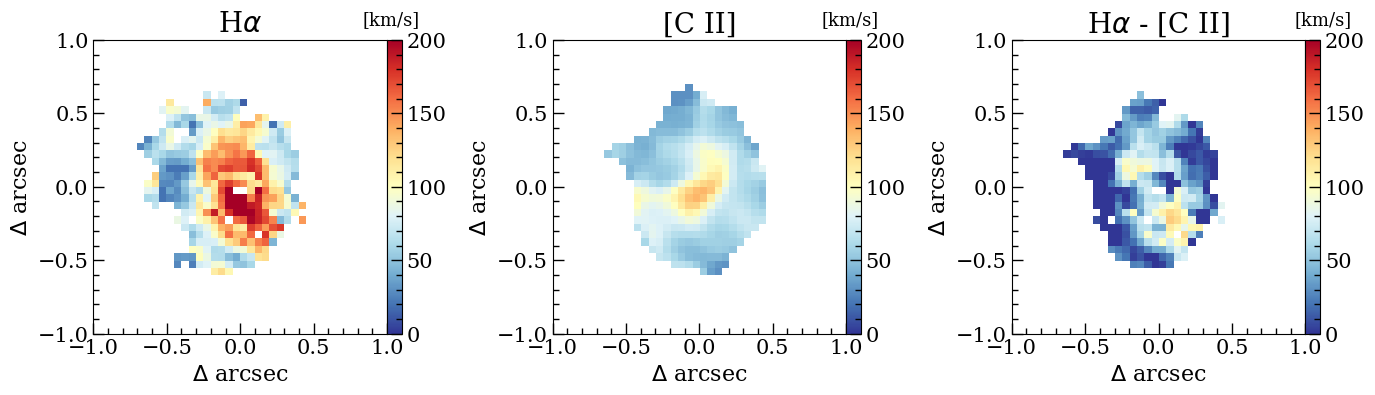
As the ALMA and NIRSpec data cubes of ALESS073.1 have a slightly different size PSF (ALMA: 0.17″ 0.14″, JWST: 0.20″ 0.17″) we used the Python library Photutils to create a matching kernel between ALMA and JWST PSFs. Hence we convolved the ALMA cube, which is the higher resolution one with the matching kernel to obtain 2 data cubes with the same PSF. After this process the two data cubes are affected by the same level of beam smearing, enabling us to compare the velocity dispersion maps directly.
The [Cii] moment maps are created by fitting spaxel-by-spaxel singular Gaussian component to the ALMA spectrum. We also try to include a second component to verify the presence of outflows in [Cii] but the double Gaussian model returns a higher in all spaxel and the BIC test supports the single component fit.
Figure 11 illustrates the velocity dispersion of the narrow H component and [Cii] emission line with the same velocity range. We stress that the line broadening due to the line spread function of NIRSpec is corrected during the H line fitting (Section 3.2) and the H velocity dispersion map does not include the broad blue-shifted H component associated with outflows. Comparing the kinematic maps, we find that the velocity dispersion mapped by the hydrogen line is on average higher than that traced by [Cii]. Both maps have high at the center ( 130 ) mainly due to beam smearing, but as shown in the map (right panel) the discrepancy between the two increases at large radii up to 0.3-0.4″. In particular, the difference in terms of velocity dispersion in the region is evident in the direction North-South from 0.1″ to 0.4″ from the center. In these regions that is more than two times larger than the uncertainties on the velocity dispersion estimates.
| Radius [kpc] | V [] | [] | |
| Ring 1 | |||
| Ring 2 | |||
| Ring 3 | |||
| Ring 4 | |||
| Ring 5 | |||
| Ring 6 | |||
| [] | |||
| PA [degree] |
8 Discussion
Investigating galaxy dynamics at high redshifts is fundamental to understand how galaxies grow their stellar mass at their early stages of formation. Measurements of small ratios between the rotational velocity and the gas velocity dispersions are usually interpreted as evidence for turbulence in the disk due to past or ongoing strong feedback mechanisms and merging processes. Conversely, observations revealing a low velocity dispersion and in the gas kinematics suggest a less turbulent gas accretion and evolution characterized by a limited number of extreme events.
The trends of velocity dispersion and the evolution with redshift at are still a matter of debate today. On one hand, a large number of kinematic studies at suggest that high redshift galaxies are more turbulent than local ones (Cresci et al., 2009; Förster Schreiber et al., 2009; Epinat et al., 2010; Gnerucci et al., 2011; Ianjamasimanana et al., 2012; Green et al., 2014; Wisnioski et al., 2015; Mogotsi et al., 2016; Di Teodoro et al., 2016; Harrison et al., 2017; Swinbank et al., 2017; Turner et al., 2017; Förster Schreiber et al., 2018; Johnson et al., 2018; Übler et al., 2019; Girard et al., 2021) with reaching values close to unity at . On the other hand, the results from kinematic studies at lead to contrasting results showing the presence of both turbulent (Herrera-Camus et al., 2022; Parlanti et al., 2023; de Graaff et al., 2023) and kinematically cold galaxies (Sharda et al., 2019; Neeleman et al., 2020; Rizzo et al., 2020; Jones et al., 2021; Fraternali et al., 2021; Lelli et al., 2021; Rizzo et al., 2021; Posses et al., 2023; Pope et al., 2023) with values of ranging from 20 to 0.1 across the redshift range . However, we note that results at high redshift are limited either by small sample sizes for galaxies observed with high angular resolution or by significant uncertainties due to the low angular resolution observations used for the larger samples of galaxies.
We also note that so far galaxies up to are principally studied by exploiting H and [Oiii] emission lines that arise from HII regions around massive and young stars and trace the warm ionized medium with a temperature of K. Studies at target mainly the [Cii] line that principally arises from Photodissociation Regions (PDR) tracing the cold neutral medium at a temperature of K and only 30% of its emission is associated with the warm diffuse ionized gas (e.g. Stacey et al., 1991, 2010; Croxall et al., 2017). Therefore, several studies have concluded that the cosmic evolution of the velocity dispersion obtained from the optical lines cannot be directly compared with that from the far-infrared [Cii] line because they are mapping different gas phases (Rizzo et al., 2022). One possible solution is to exploit the far-infrared [Oiii]m line that traces the warm ionized medium and can be observed with ALMA at . Unfortunately, long exposure times are necessary to obtain an accurate measurement of the gas velocity dispersion, and most of the current observations have coarse angular resolution resulting in large uncertainties (Parlanti et al., 2023). Moreover, [Oiii]m would still leave a gap in observations in the redshift range .
With the advent of JWST NIRSpec and in particular, thanks to the IFS mode observations, we can finally compare the kinematics determined from the rest-frame optical lines with that of [Cii] in the same galaxies and verify if there is a discrepancy between these tracers or not. ALESS073.1 is the first massive ( M⊙, Circosta et al. 2019) galaxy for which we have both ALMA and NIRSpec observations and the results presented in Section 7 show that the velocity curves of the two tracers are consistent within the errors. The data however highlight a difference between H and [Cii] in terms of velocity dispersion. The velocity dispersion inferred from H is systemically larger by more than 50 in the central 1.5 kpc than the one determined from the carbon line. This difference cannot be associated only with the difference in thermal velocity dispersion of the gas mapped by the two tracers as this is of the order of 20 . The difference between the two gas kinematics is not uniform over the field of view but is higher at the center and reaches values comparable with the errors ( 30 ) at larger radii.
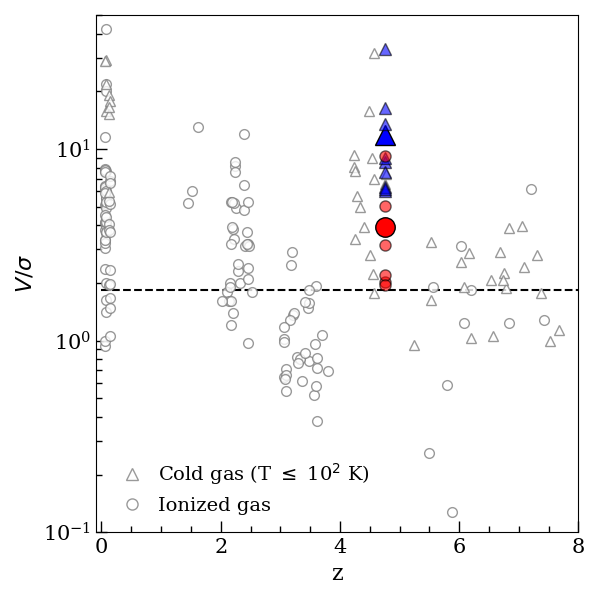
To understand whether the galaxy is rotation or dispersion-supported we compute the ratio between the rotational velocity and the velocity dispersion. When the ratio is larger than the galaxy is considered supported by rotation, on the contrary, is supported by the turbulent random motion of the gas (Förster Schreiber et al., 2018). In Figure 12 we report the ratio computed for each ring for the H (red) and [Cii] (blue) as small symbols along with other high and low redshift galaxies. The big blue triangle and red circle represent the mean value of across all the rings for the [Cii] and H profiles, respectively. If we compare the value we obtain with the literature we see that the results with both tracers lie in the rotation-dominated region, even if the H and [Cii] points create two different clouds around the central value of for the [Cii], and for the H. The ratio between the rotational velocity and the velocity dispersion derived from the H line is in the outer regions as also found with the [Cii] tracer for this galaxy (Lelli et al., 2021) and other high-redshift dusty star-forming galaxies (e.g., Rizzo et al., 2020, 2021; Fraternali et al., 2021), and decreases down to values of in the central region, consistent with a thick turbulent rotating disk.
The enhanced velocity dispersion of the warm ionized gas can be caused by the outflows driven by the central AGN. Theoretical models predict that outflows might remove gas from the galaxy as well as inject energy into the interstellar medium and kinematically heat the gas. The increase in the turbulence in the ionized phases of the ISM due to the feedback effect has been recently observed in Marasco et al. (2023) at , while a correlation between the increase of the turbulence in the galaxy and the presence of a central AGN that can power a nuclear outflow has been found in Übler et al. (2019). The H gas might be affected by the galactic winds and its kinematics reflects the impact of the outflows on the host galaxy. We thus compare the kinetic energy of the gas with that injected by the outflows into the galaxy. We estimate the kinetic energy of the warm gas traced by the narrow H component, , by employing the H flux and velocity dispersion in the region with that is the region where the difference between the velocity dispersions in the third panel of Figure 11 is two times larger than the median error. We compare the inferred kinetic energies with the outflow energy, erg, where we assume that the outflow kinetic rate is constant over time and the feedback mechanism started 10 Myr ago ( Myr). We find that the ratio between the energy provided by the outflow, and the energy necessary to increase the turbulence of the ISM is . The result suggests that the energy of the outflows is powerful enough to provide the kinetic energy of the ionized gas observed in the line-width enhancement region. In the outer regions of the galaxy, instead, the warm and cold gas are coupled as the velocity dispersion of both tracers reaches values of 30 and we do not find evidence of the feedback from the weak outflow or the accreting BH enhancing the turbulence at larger radii. The level of turbulence in the outskirts of the galaxy can easily be sustained by star-formation feedback, gravitational instabilities due to the accretion of gas on the disk or due to the transport of gas from outer to inner radii (Krumholz & Burkhart, 2016; Krumholz et al., 2018; Ginzburg et al., 2022).
9 Conclusions
In this work, we have presented the JWST/NIRSpec Integral Field Spectrograph (IFS) observation of the AGN-host galaxy ALESS073.1 at . The observations of the high-resolution gratings have allowed us to study for the first time the rest-frame optical emission lines of a dusty-obscured SMG hosting an AGN. In particular, we exploited the H and [Nii] emission lines to trace the host galaxy kinematics, determine the presence of a BLR, and investigate the properties of ionized outflows. Our main results are the following:
-
•
We observe a broad H component with a FWHM of 9000 arising from the BLR around the accreting supermassive black hole. The presence of the BLR unambiguously classifies the target as a type 1 AGN, in contrast to what was believed before due to the high observed column density of . The broad line emission implies a BH mass of that is slowly accreting at a smaller rate than the Eddington rate (¡0.15).
-
•
On the plane, the target lies on the relation for massive quiescent local ellipticals, classic bulges, and luminous quasar at high redshift. But is more than one order of magnitude higher with respect observed in local AGN with similar stellar masses.
-
•
We find hints of a weak, marginally resolved, ionized outflow with a mass loading factor of , implying that the outflow is not able to eject away a large amount of gas to halt the star formation ongoing in the galaxy.
-
•
By measuring the ratio between [Nii] and H we have found that the AGN hard radiation is the dominant source of ionization of the ISM, especially in the central region of the galaxy and for the outflow component. At larger radii we find, instead, softer radiation, compatible with emission from young, bright stars.
-
•
Despite the low mass loading factor, the ionized outflow seems to be sufficiently energetic to increase the turbulence in the system. In fact, the kinematic analysis of the H line shows that gas turbulence in the central region is 2-3 times higher than the rest of the galaxy. This increase in turbulence might be the initial effect of the outflow on the host galaxy. However, as such high-velocity dispersion is observed only in the H kinematics and not in the map of [Cii], we conclude that the outflow is injecting turbulence in the warm and diffuse ionized gas, but it is not sufficiently powerful to disrupt the dense gas and quench star formation.
The complex scenario of galaxy-black hole co-evolution is still far from being constrained and firmly established. In this work, we have highlighted how JWST with its high spatial resolution, spatially-resolved spectroscopy capability, and an infrared wavelength range probed with unprecedented sensitivity, significantly enhance previous studies based on observations at various wavelengths. In particular, its ability to probe the rest frame optical emission lines at high redshift with high spectral and spatial resolution has allowed us to study the first phases of the interplay between the accreting black hole and the host galaxy and connect kinematic measurements of high- tracers ([Cii]) with the more traditional rest-frame optical emission line tracers at lower redshift. Future JWST IFS observations, alongside other ground-based facilities (e.g. ALMA) will allow us to better observe and understand the phenomena involved in the complex environment of dusty massive galaxies in the early Universe and their interaction with the massive black holes they host. ALESS073.1 observations suggest that SMGs could be the evolutionary stage preceding the active quasar phase. The accreting BHs in SMG have not yet reached the Eddington limit and outflows are not powerful enough to remove gas from the galaxy, but they are injecting energy into the system and increasing the turbulence of less dense gas.
Acknowledgements.
EP is grateful to Fabio Vito for useful comments and discussions. SC and GV acknowledge support from the European Union (ERC, WINGS,101040227). FDE, RM and JS and acknowledge support by the Science and Technology Facilities Council (STFC), by the ERC Advanced Grant 695671 “QUENCH”, and by the UKRI Frontier Research grant RISEandFALL. RM is further supported by a research professorship from the Royal Society. SA, BRdP, MP acknowledge grant PID2021-127718NB-I00 funded by the Spanish Ministry of Science and Innovation/State Agency of Research (MICIN/AEI/ 10.13039/501100011033). MP acknowledges the Programa Atracción de Talento de la Comunidad de Madrid via grant 2018-T2/TIC-11715. IL acknowledges support from PID2022-140483NB-C22 funded by AEI 10.13039/501100011033 and BDC 20221289 funded by MCIN by the Recovery, Transformation and Resilience Plan from the Spanish State, and by NextGenerationEU from the European Union through the Recovery and Resilience Facility. GC acknowledges the support of the INAF Large Grant 2022 ”The metal circle: a new sharp view of the baryon cycle up to Cosmic Dawn with the latest generation IFU facilities”. AJB, AJC, GCJ and JC acknowledge funding from the ”FirstGalaxies” Advanced Grant from the European Research Council (ERC) under the European Union’s Horizon 2020 research and innovation programme (Grant agreement No. 789056). HÜ gratefully acknowledges support by the Isaac Newton Trust and by the Kavli Foundation through a Newton-Kavli Junior Fellowship. This paper makes use of the following ALMA data: ADS/JAO.ALMA#2017.1.01471.S ALMA is a partnership of ESO (representing its member states), NSF (USA) and NINS (Japan), together with NRC (Canada), MOST and ASIAA (Taiwan), and KASI (Republic of Korea), in cooperation with the Republic of Chile. The Joint ALMA Observatory is operated by ESO, AUI/NRAO and NAOJ.References
- Álvarez-Márquez et al. (2023) Álvarez-Márquez, J., Crespo Gómez, A., Colina, L., et al. 2023, A&A, 671, A105
- Bae & Woo (2014) Bae, H.-J. & Woo, J.-H. 2014, ApJ, 795, 30
- Baldwin et al. (1981) Baldwin, J. A., Phillips, M. M., & Terlevich, R. 1981, PASP, 93, 5
- Benson et al. (2003) Benson, A. J., Bower, R. G., Frenk, C. S., et al. 2003, ApJ, 599, 38
- Bezanson et al. (2019) Bezanson, R., Spilker, J., Williams, C. C., et al. 2019, ApJ, 873, L19
- Böker et al. (2022) Böker, T., Arribas, S., Lützgendorf, N., et al. 2022, A&A, 661, A82
- Calzetti et al. (2000) Calzetti, D., Armus, L., Bohlin, R. C., et al. 2000, ApJ, 533, 682
- Cameron et al. (2023) Cameron, A. J., Saxena, A., Bunker, A. J., et al. 2023, arXiv e-prints, arXiv:2302.04298
- Carnall et al. (2023) Carnall, A. C., McLeod, D. J., McLure, R. J., et al. 2023, MNRAS, 520, 3974
- Carraro et al. (2020) Carraro, R., Rodighiero, G., Cassata, P., et al. 2020, A&A, 642, A65
- Choi et al. (2012) Choi, E., Ostriker, J. P., Naab, T., & Johansson, P. H. 2012, ApJ, 754, 125
- Circosta et al. (2019) Circosta, C., Vignali, C., Gilli, R., et al. 2019, A&A, 623, A172
- Coppin et al. (2009) Coppin, K. E. K., Smail, I., Alexander, D. M., et al. 2009, MNRAS, 395, 1905
- Costa et al. (2018) Costa, T., Rosdahl, J., Sijacki, D., & Haehnelt, M. G. 2018, MNRAS, 473, 4197
- Cresci et al. (2009) Cresci, G., Hicks, E. K. S., Genzel, R., et al. 2009, ApJ, 697, 115
- Cresci et al. (2023) Cresci, G., Tozzi, G., Perna, M., et al. 2023, A&A, 672, A128
- Croxall et al. (2017) Croxall, K. V., Smith, J. D., Pellegrini, E., et al. 2017, ApJ, 845, 96
- da Cunha et al. (2015) da Cunha, E., Walter, F., Smail, I. R., et al. 2015, ApJ, 806, 110
- D’Amato et al. (2020) D’Amato, Q., Gilli, R., Vignali, C., et al. 2020, A&A, 636, A37
- Davis et al. (2013) Davis, T. A., Alatalo, K., Bureau, M., et al. 2013, MNRAS, 429, 534
- De Breuck et al. (2011) De Breuck, C., Maiolino, R., Caselli, P., et al. 2011, A&A, 530, L8
- De Breuck et al. (2014) De Breuck, C., Williams, R. J., Swinbank, M., et al. 2014, A&A, 565, A59
- de Graaff et al. (2023) de Graaff, A., Rix, H.-W., Carniani, S., et al. 2023, arXiv e-prints, arXiv:2308.09742
- de Nicola et al. (2019) de Nicola, S., Marconi, A., & Longo, G. 2019, MNRAS, 490, 600
- Debuhr et al. (2012) Debuhr, J., Quataert, E., & Ma, C.-P. 2012, MNRAS, 420, 2221
- Decarli et al. (2010) Decarli, R., Falomo, R., Treves, A., et al. 2010, MNRAS, 402, 2453
- Delvecchio et al. (2014) Delvecchio, I., Gruppioni, C., Pozzi, F., et al. 2014, MNRAS, 439, 2736
- D’Eugenio et al. (2023) D’Eugenio, F., Perez-Gonzalez, P., Maiolino, R., et al. 2023, arXiv e-prints, arXiv:2308.06317
- Di Matteo et al. (2005) Di Matteo, T., Springel, V., & Hernquist, L. 2005, Nature, 433, 604
- Di Teodoro et al. (2016) Di Teodoro, E. M., Fraternali, F., & Miller, S. H. 2016, A&A, 594, A77
- Epinat et al. (2010) Epinat, B., Amram, P., Balkowski, C., & Marcelin, M. 2010, MNRAS, 401, 2113
- Fabian (2012) Fabian, A. C. 2012, ARA&A, 50, 455
- Fischer et al. (2013) Fischer, T. C., Crenshaw, D. M., Kraemer, S. B., & Schmitt, H. R. 2013, ApJS, 209, 1
- Foreman-Mackey et al. (2013) Foreman-Mackey, D., Hogg, D. W., Lang, D., & Goodman, J. 2013, PASP, 125, 306
- Förster Schreiber et al. (2009) Förster Schreiber, N. M., Genzel, R., Bouché, N., et al. 2009, ApJ, 706, 1364
- Förster Schreiber et al. (2018) Förster Schreiber, N. M., Renzini, A., Mancini, C., et al. 2018, ApJS, 238, 21
- Förster Schreiber et al. (2019) Förster Schreiber, N. M., Übler, H., Davies, R. L., et al. 2019, ApJ, 875, 21
- Fraternali et al. (2021) Fraternali, F., Karim, A., Magnelli, B., et al. 2021, A&A, 647, A194
- Gallagher et al. (2019) Gallagher, R., Maiolino, R., Belfiore, F., et al. 2019, MNRAS, 485, 3409
- Genzel et al. (2011) Genzel, R., Newman, S., Jones, T., et al. 2011, ApJ, 733, 101
- Giallongo et al. (2019) Giallongo, E., Grazian, A., Fiore, F., et al. 2019, ApJ, 884, 19
- Gilli et al. (2014) Gilli, R., Norman, C., Vignali, C., et al. 2014, A&A, 562, A67
- Gilli et al. (2011) Gilli, R., Su, J., Norman, C., et al. 2011, ApJ, 730, L28
- Ginzburg et al. (2022) Ginzburg, O., Dekel, A., Mandelker, N., & Krumholz, M. R. 2022, MNRAS, 513, 6177
- Girard et al. (2021) Girard, M., Fisher, D. B., Bolatto, A. D., et al. 2021, ApJ, 909, 12
- Glazebrook et al. (2017) Glazebrook, K., Schreiber, C., Labbé, I., et al. 2017, Nature, 544, 71
- Gnerucci et al. (2011) Gnerucci, A., Marconi, A., Cresci, G., et al. 2011, A&A, 528, A88
- Green et al. (2014) Green, A. W., Glazebrook, K., McGregor, P. J., et al. 2014, MNRAS, 437, 1070
- Greene & Ho (2005) Greene, J. E. & Ho, L. C. 2005, ApJ, 630, 122
- Harikane et al. (2023) Harikane, Y., Zhang, Y., Nakajima, K., et al. 2023, arXiv e-prints, arXiv:2303.11946
- Harrison et al. (2018) Harrison, C. M., Costa, T., Tadhunter, C. N., et al. 2018, Nature Astronomy, 2, 198
- Harrison et al. (2017) Harrison, C. M., Johnson, H. L., Swinbank, A. M., et al. 2017, MNRAS, 467, 1965
- Heckman & Best (2014) Heckman, T. M. & Best, P. N. 2014, Annual Review of Astronomy and Astrophysics, 52, 589
- Herrera-Camus et al. (2022) Herrera-Camus, R., Förster Schreiber, N. M., Price, S. H., et al. 2022, arXiv e-prints, arXiv:2203.00689
- Hopkins et al. (2008) Hopkins, P. F., Hernquist, L., Cox, T. J., & Kereš, D. 2008, ApJS, 175, 356
- Ianjamasimanana et al. (2012) Ianjamasimanana, R., de Blok, W. J. G., Walter, F., & Heald, G. H. 2012, AJ, 144, 96
- Isobe et al. (2023) Isobe, Y., Ouchi, M., Nakajima, K., et al. 2023, arXiv e-prints, arXiv:2301.06811
- Jakobsen et al. (2022) Jakobsen, P., Ferruit, P., Alves de Oliveira, C., et al. 2022, A&A, 661, A80
- Johnson et al. (2018) Johnson, H. L., Harrison, C. M., Swinbank, A. M., et al. 2018, MNRAS, 474, 5076
- Jones et al. (2021) Jones, G. C., Vergani, D., Romano, M., et al. 2021, MNRAS, 507, 3540
- Kass & Raftery (1995) Kass, R. E. & Raftery, A. E. 1995, Journal of the American Statistical Association, 90, 773
- Kauffmann et al. (2003) Kauffmann, G., Heckman, T. M., Tremonti, C., et al. 2003, MNRAS, 346, 1055
- Kewley et al. (2013) Kewley, L. J., Dopita, M. A., Leitherer, C., et al. 2013, ApJ, 774, 100
- Kewley et al. (2001) Kewley, L. J., Dopita, M. A., Sutherland, R. S., Heisler, C. A., & Trevena, J. 2001, ApJ, 556, 121
- King & Pounds (2015) King, A. & Pounds, K. 2015, ARA&A, 53, 115
- Kocevski et al. (2023) Kocevski, D. D., Onoue, M., Inayoshi, K., et al. 2023, arXiv e-prints, arXiv:2302.00012
- Kormendy & Ho (2013) Kormendy, J. & Ho, L. C. 2013, ARA&A, 51, 511
- Krumholz & Burkhart (2016) Krumholz, M. R. & Burkhart, B. 2016, MNRAS, 458, 1671
- Krumholz et al. (2018) Krumholz, M. R., Burkhart, B., Forbes, J. C., & Crocker, R. M. 2018, MNRAS, 477, 2716
- Lehmer et al. (2005) Lehmer, B. D., Brandt, W. N., Alexander, D. M., et al. 2005, ApJS, 161, 21
- Lelli et al. (2021) Lelli, F., Di Teodoro, E. M., Fraternali, F., et al. 2021, Science, 371, 713
- Liddle (2007) Liddle, A. R. 2007, MNRAS, 377, L74
- Luo et al. (2017) Luo, B., Brandt, W. N., Xue, Y. Q., et al. 2017, ApJS, 228, 2
- Lutz et al. (2020) Lutz, D., Sturm, E., Janssen, A., et al. 2020, A&A, 633, A134
- Madau & Dickinson (2014) Madau, P. & Dickinson, M. 2014, ARA&A, 52, 415
- Maiolino et al. (2017) Maiolino, R., Russell, H. R., Fabian, A. C., et al. 2017, Nature, 544, 202
- Maiolino et al. (2023) Maiolino, R., Scholtz, J., Curtis-Lake, E., et al. 2023, arXiv e-prints, arXiv:2308.01230
- Marasco et al. (2023) Marasco, A., Belfiore, F., Cresci, G., et al. 2023, A&A, 670, A92
- Marshall et al. (2023) Marshall, M. A., Perna, M., Willott, C. J., et al. 2023, arXiv e-prints, arXiv:2302.04795
- Matthee et al. (2023) Matthee, J., Naidu, R. P., Brammer, G., et al. 2023, arXiv e-prints, arXiv:2306.05448
- McDermid et al. (2015) McDermid, R. M., Alatalo, K., Blitz, L., et al. 2015, MNRAS, 448, 3484
- McMullin et al. (2007) McMullin, J. P., Waters, B., Schiebel, D., Young, W., & Golap, K. 2007, in Astronomical Society of the Pacific Conference Series, Vol. 376, Astronomical Data Analysis Software and Systems XVI, ed. R. A. Shaw, F. Hill, & D. J. Bell, 127
- Mogotsi et al. (2016) Mogotsi, K. M., de Blok, W. J. G., Caldú-Primo, A., et al. 2016, AJ, 151, 15
- Muratov et al. (2015) Muratov, A. L., Kereš, D., Faucher-Giguère, C.-A., et al. 2015, MNRAS, 454, 2691
- Nagao et al. (2012) Nagao, T., Maiolino, R., De Breuck, C., et al. 2012, A&A, 542, L34
- Neeleman et al. (2021) Neeleman, M., Novak, M., Venemans, B. P., et al. 2021, ApJ, 911, 141
- Neeleman et al. (2020) Neeleman, M., Prochaska, J. X., Kanekar, N., & Rafelski, M. 2020, Nature, 581, 269
- Nelson et al. (2019) Nelson, D., Pillepich, A., Springel, V., et al. 2019, MNRAS, 490, 3234
- Osterbrock & Ferland (2006) Osterbrock, D. E. & Ferland, G. J. 2006, Astrophysics of gaseous nebulae and active galactic nuclei
- Padovani et al. (2017) Padovani, P., Alexander, D. M., Assef, R. J., et al. 2017, A&A Rev., 25, 2
- Parlanti et al. (2023) Parlanti, E., Carniani, S., Pallottini, A., et al. 2023, A&A, 673, A153
- Peng et al. (2015) Peng, Y., Maiolino, R., & Cochrane, R. 2015, Nature, 521, 192
- Pensabene et al. (2020) Pensabene, A., Carniani, S., Perna, M., et al. 2020, A&A, 637, A84
- Perna et al. (2023) Perna, M., Arribas, S., Marshall, M., et al. 2023, arXiv e-prints, arXiv:2304.06756
- Perna et al. (2017) Perna, M., Lanzuisi, G., Brusa, M., Mignoli, M., & Cresci, G. 2017, A&A, 603, A99
- Perrin et al. (2014) Perrin, M. D., Sivaramakrishnan, A., Lajoie, C.-P., et al. 2014, in Society of Photo-Optical Instrumentation Engineers (SPIE) Conference Series, Vol. 9143, Space Telescopes and Instrumentation 2014: Optical, Infrared, and Millimeter Wave, ed. J. Oschmann, Jacobus M., M. Clampin, G. G. Fazio, & H. A. MacEwen, 91433X
- Planck Collaboration et al. (2016) Planck Collaboration, Ade, P. A. R., Aghanim, N., et al. 2016, A&A, 594, A13
- Pope et al. (2023) Pope, A., McKinney, J., Kamieneski, P., et al. 2023, ApJ, 951, L46
- Posses et al. (2023) Posses, A. C., Aravena, M., González-López, J., et al. 2023, A&A, 669, A46
- Puchwein & Springel (2013) Puchwein, E. & Springel, V. 2013, MNRAS, 428, 2966
- Reines & Volonteri (2015) Reines, A. E. & Volonteri, M. 2015, ApJ, 813, 82
- Rizzo et al. (2022) Rizzo, F., Kohandel, M., Pallottini, A., et al. 2022, A&A, 667, A5
- Rizzo et al. (2021) Rizzo, F., Vegetti, S., Fraternali, F., Stacey, H. R., & Powell, D. 2021, MNRAS, 507, 3952
- Rizzo et al. (2020) Rizzo, F., Vegetti, S., Powell, D., et al. 2020, Nature, 584, 201
- Sanders et al. (1988) Sanders, D. B., Soifer, B. T., Elias, J. H., et al. 1988, ApJ, 325, 74
- Santini et al. (2010) Santini, P., Maiolino, R., Magnelli, B., et al. 2010, A&A, 518, L154
- Sérsic (1963) Sérsic, J. L. 1963, Boletin de la Asociacion Argentina de Astronomia La Plata Argentina, 6, 41
- Shankar et al. (2009) Shankar, F., Bernardi, M., & Haiman, Z. 2009, ApJ, 694, 867
- Sharda et al. (2019) Sharda, P., da Cunha, E., Federrath, C., et al. 2019, MNRAS, 487, 4305
- Shin et al. (2019) Shin, J., Woo, J.-H., Chung, A., et al. 2019, ApJ, 881, 147
- Speagle (2020) Speagle, J. S. 2020, MNRAS, 493, 3132
- Stacey et al. (1991) Stacey, G. J., Geis, N., Genzel, R., et al. 1991, ApJ, 373, 423
- Stacey et al. (2010) Stacey, G. J., Hailey-Dunsheath, S., Ferkinhoff, C., et al. 2010, ApJ, 724, 957
- Storey & Zeippen (2000) Storey, P. J. & Zeippen, C. J. 2000, MNRAS, 312, 813
- Suh et al. (2020) Suh, H., Civano, F., Trakhtenbrot, B., et al. 2020, ApJ, 889, 32
- Swinbank et al. (2017) Swinbank, A. M., Harrison, C. M., Trayford, J., et al. 2017, MNRAS, 467, 3140
- Swinbank et al. (2014) Swinbank, A. M., Simpson, J. M., Smail, I., et al. 2014, MNRAS, 438, 1267
- Swinbank et al. (2004) Swinbank, A. M., Smail, I., Chapman, S. C., et al. 2004, ApJ, 617, 64
- Thomas et al. (2005) Thomas, D., Maraston, C., Bender, R., & Mendes de Oliveira, C. 2005, ApJ, 621, 673
- Toft et al. (2014) Toft, S., Smolčić, V., Magnelli, B., et al. 2014, ApJ, 782, 68
- Tozzi et al. (2006) Tozzi, P., Gilli, R., Mainieri, V., et al. 2006, A&A, 451, 457
- Turner et al. (2017) Turner, O. J., Cirasuolo, M., Harrison, C. M., et al. 2017, MNRAS, 471, 1280
- Übler et al. (2019) Übler, H., Genzel, R., Wisnioski, E., et al. 2019, ApJ, 880, 48
- Übler et al. (2023) Übler, H., Maiolino, R., Curtis-Lake, E., et al. 2023, arXiv e-prints, arXiv:2302.06647
- Valentino et al. (2020) Valentino, F., Tanaka, M., Davidzon, I., et al. 2020, ApJ, 889, 93
- van Dokkum (2001) van Dokkum, P. G. 2001, PASP, 113, 1420
- Vanzella et al. (2006) Vanzella, E., Cristiani, S., Dickinson, M., et al. 2006, A&A, 454, 423
- Vanzella et al. (2009) Vanzella, E., Giavalisco, M., Dickinson, M., et al. 2009, ApJ, 695, 1163
- Vito et al. (2013) Vito, F., Vignali, C., Gilli, R., et al. 2013, MNRAS, 428, 354
- Wandel et al. (1999) Wandel, A., Peterson, B. M., & Malkan, M. A. 1999, ApJ, 526, 579
- Williams et al. (2021) Williams, C. C., Spilker, J. S., Whitaker, K. E., et al. 2021, ApJ, 908, 54
- Wisnioski et al. (2015) Wisnioski, E., Förster Schreiber, N. M., Wuyts, S., et al. 2015, ApJ, 799, 209
- Zhao et al. (2020) Zhao, Y., Lu, N., Díaz-Santos, T., et al. 2020, ApJ, 892, 145
- Zubovas & King (2014) Zubovas, K. & King, A. R. 2014, MNRAS, 439, 400
Appendix A IFS Point Spread Function
The fitting of the moment maps to recover the galaxy size and kinematic parameters requires adequate modeling of the telescope Point Spread Function (PSF) that allows us to correct and take into account the beam smearing effect. The beam smearing is introduced when the light from a point in the sky plane is spread over a larger area on the detector. This effect has a consequence both in the spatial and the spectral axis due to the reconstruction of the final cubes. In particular, on the moment maps the flux map will have a larger extension, the velocity map will have a shallower velocity gradient, and emission lines will be artificially broadened resulting in a larger velocity dispersion, especially in the central region of the galaxy. To correct these artifacts and recover the intrinsic model parameters we convolve our kinematic model with the telescope PSF, in that way, we can directly compare the model and observations.
The webbpsf python tool (Perrin et al. 2014) generates the theoretical PSF by taking into account instrumental properties and the optics based on test results. Since JWST has wavelength-dependent PSF (see also D’Eugenio et al. 2023) we simulated the PSF at the wavelength at which we observe the H line (3.778 m). The generated PSF presents spikes and irregularities and fitting it with a 2D Gaussian we obtain a FWHM of ″.
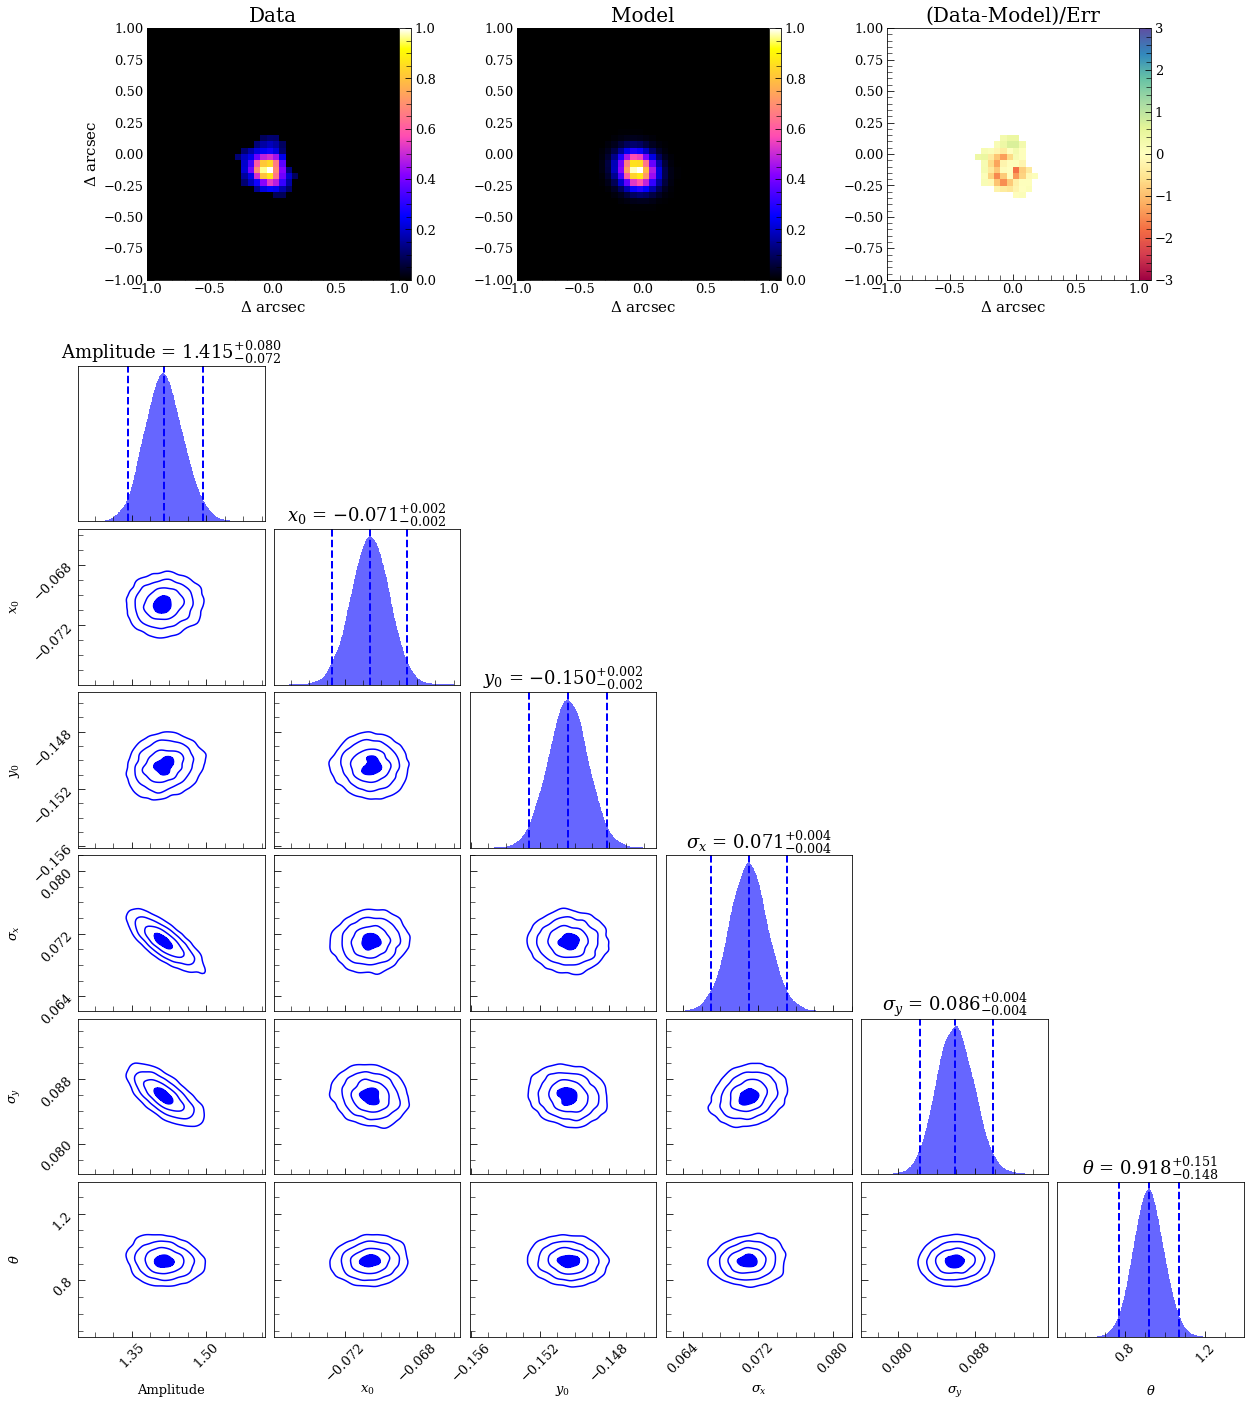
Since webbpsf only simulates the NIRSpec PSF if used in imaging mode without taking into account the IFS optics, the dithering schemes, and the cube reconstruction processes, we also have fitted with a Gaussian function the BLR flux map. The broad line emission arises from a region close to the black hole (Wandel et al. 1999), hence it will not be spatially resolved and its shape should reflect the instrumental PSF. The results of the fitting are shown in Figure 13. The results of the fitting provide an elliptical PSF with a FWHM of ″where the major axis is rotated counterclockwise in respect to the x-y axis of an angle . The resulting PSF is elongated in the cross-dispersion direction (i.e. slices direction).
As the BLR emission should reflect the real telescope PSF we assumed the BLR best fitting results as our fiducial model for the PSF to use in our kinematic analysis.
Appendix B Morphological and kinematic fitting
In this Section, we present the outputs and corner plot for the morphological and kinematic fitting discussed in Sections 3.3 and 7 and we also present an alternative kinematic fitting including only an exponential disk to show that the non-parametric approach is the best model to reproduce this galaxy kinematics.
B.1 Posterior distributions
In figure 14 we present the corner plot distribution for the fitting of the flux map where we model the emitted flux as a sum of a 2D Sèrsic profile to take into account the extended emission from the galaxy and a 2D Gaussian to reproduce the emission from the marginally resolved and unresolved source of emission (BLR, outflow, bulge) which parameters are marked as “AGN” as it is the dominant contribution source. In Figure 15 and 16 we present the posterior distribution for the kinematic fitting parameters presented in Section 7.
B.2 Alternative kinematic fitting
To understand if the velocity and velocity dispersion map fitting really require a non-parametric model to reproduce the observed galaxy kinematic, we also tried a more conservative approach adopting a parametric modeling of the velocity and velocity dispersion curves.
To model the velocity curve we assume that velocity contribution was only due to the exponential disk component that can be described as a function of radius:
| (5) |
where , while , , , and are modified Bessel functions. We fixed the value of as the value of the exponential disk scale radius found in the morphological fitting, and we left the disk mass computed within a radius kpc, which corresponds to 2-3 disk scale lengths: free to vary.
The velocity dispersion curve was instead modeled as Gaussian:
| (6) |
where is the velocity dispersion in the center of the galaxy and is a measure of how quickly the velocity dispersion of the galaxy decreases with radius.
We fixed the inclination at the value of 22 , and we left the PA, disk mass, systemic velocity, , and free to vary. The best-fit model and residuals are shown in Figure 17, and the best-fit values and the posterior distribution are reported in Figure 18.
In Figure 17 the model velocity map is not able to reproduce the blue-shifted side. As the velocity in that side of the galaxy increases faster with radius than the red one, the exponential disk is not able to reproduce that fast growth, indicating the presence of an extra component in the central region of the galaxy to reproduce that fast rise in the velocity. The BIC test for the velocity map extremely favors the non-parametric modeling ().
The Gaussian decreasing velocity dispersion model is also disfavoured by the BIC test in comparison to the non-parametric modeling (), as it is not able to reproduce the very high central velocity dispersions and the sharp decrease around 1.5 kpc.