Hidden Little Monsters: Spectroscopic Identification of Low-Mass, Broad-Line AGN at with CEERS
Abstract
We report on the discovery of two low-luminosity, broad-line active galactic nuclei (AGN) at identified using JWST NIRSpec spectroscopy from the Cosmic Evolution Early Release Science (CEERS) Survey. We detect broad H emission in the spectra of both sources, with FWHM of and km s-1, resulting in virial black hole (BH) masses that are 1-2 dex below that of existing samples of luminous quasars at . The first source, CEERS 1670 at , is 2–3 dex fainter than known quasars at similar redshifts and was previously identified as a candidate low-luminosity AGN based on its morphology and rest-frame optical spectral energy distribution (SED). We measure a BH mass of , confirming that this AGN is powered by the least-massive BH known in the universe at the end of cosmic reionization. The second source, CEERS 3210 at , is inferred to be a heavily obscured, broad-line AGN caught in a transition phase between a dust-obscured starburst and an unobscured quasar. We estimate its BH mass to be in the range of , depending on the level of dust obscuration assumed. We perform SED fitting to derive host stellar masses, , allowing us to place constraints on the BH-galaxy mass relationship in the lowest mass range yet probed in the early universe. The ratio for CEERS 1670, in particular, is consistent with or higher than the empirical relationship seen in massive galaxies at . We examine the narrow emission-line ratios of both sources and find that their location on the BPT and OHNO diagrams is consistent with model predictions for moderately low-metallicity AGN with . The spectroscopic identification of low-luminosity, broad-line AGN at with demonstrates the capability of JWST to push BH masses closer to the range predicted for the BH seed population and provides a unique opportunity to study the early stages of BH-galaxy assembly.
1 Introduction
With the advent of wide-field quasar surveys such as those carried out by the Sloan Digital Sky Survey (SDSS; Fan et al., 2001; Jiang et al., 2016) and the Panoramic Survey Telescope & Rapid Response System 1 (Pan-STARRS1; Bañados et al. 2016; Mazzucchelli et al. 2017), hundreds of quasars have been discovered and characterized at (Inayoshi et al., 2020; Fan et al., 2022), with the most distant found a mere 670 million years after the Big Bang (Wang et al., 2021). The super massive black holes (SMBHs) that power these sources have masses of order , raising the question of how such systems were built in such a short amount of cosmic time. Most theories involve Eddington-limited or possibly super-Eddington accretion onto seed BHs that are predicted to form at and have masses that range from (so called “light seeds”) to over (“heavy seeds”) with a continuous distribution (e.g., Inayoshi et al., 2020; Volonteri et al., 2021). The relative contribution of each seed type remains largely unconstrained by observations (Miller et al., 2015; Trump et al., 2015).
Most quasar surveys, which observe deg2 down to mag, are sensitive to only the most luminous quasar populations ( erg s-1 in bolometric luminosity; ). These ultra-rare systems, which formed in biased regions of the early universe, place limited constraints on the BH seed population as they would have undergone sustained episodes of exponential growth, even for the most massive predicted seeds, thereby erasing the imprint of the initial seed mass distribution (e.g., Tanaka & Haiman, 2009; Volonteri, 2010). A complementary approach is to search for lower-luminosity quasars hosting SMBHs with masses closer to the predicted seed mass range at the earliest epochs possible (Somerville et al., 2008; Valiante et al., 2016; Ricarte & Natarajan, 2018; Yung et al., 2021; Li et al., 2022). Several deep optical surveys have attempted to do this by reaching a dex fainter in luminosity (e.g., Willott et al., 2007, 2010a; Matsuoka et al., 2016, 2022; Kim et al., 2018, 2020; Fujimoto et al., 2022); however, these samples are still far more luminous than what is observed in the nearby universe ( erg s-1; e.g., Greene & Ho 2007, Liu et al. 2018, 2019), biasing our understanding of early SMBHs toward the most massive and active populations (however, see also Mezcua et al. 2018).
Additional constraints on the seed mass distribution can be obtained by comparing the masses of high-redshift SMBHs to that of their host galaxies. In the local universe, well established scaling relationships exist between the mass of SMBHs and the bulge properties of their hosts (e.g., Magorrian et al., 1998; Gebhardt et al., 2000; Ferrarese & Merritt, 2000; McConnell & Ma, 2013; Sun et al., 2015). However, offsets from this relationship at higher redshift can help constrain models of early BH growth and their co-evolution with galaxies (Hirschmann et al., 2010; Habouzit et al., 2022; Hu et al., 2022). Observational studies have produced mixed results in this regard, with several reporting that SMBHs become increasingly overmassive relative to their hosts with increasing redshift (e.g., Trakhtenbrot & Netzer, 2010; Bennert et al., 2011; Park et al., 2015; Shimasaku & Izumi, 2019; Ding et al., 2020; Neeleman et al., 2021), while other studies report no evolution in the local scaling relationship (e.g., Willott et al., 2017; Izumi et al., 2019; Suh et al., 2020). Pushing such studies to lower SMBH and host masses at high redshifts is expected to provide additional insight into the earliest seeds. Not only are lower-luminosity AGN more representative of the normal BH population (Habouzit et al., 2022), lower mass hosts have a relatively quiet merger history and so represent a robust “fossil record” of the initial BH-seed mass distribution (Volonteri et al., 2008; Volonteri & Natarajan, 2009).
JWST is expected to be a game changer on both fronts, allowing for the detection of lower luminosity quasars and the light of their host galaxies out to the epoch of cosmic reionization. Since its launch, JWST has already revealed the host morphologies of X-ray and optically selected AGN out to (Kocevski et al., 2022; Ding et al., 2022a), detected the host light of a quasar at for the first time (Ding et al., 2022b), and identified a candidate faint quasar at (Furtak et al., 2022). Recently, Onoue et al. (2023, hearafter O23) reported a candidate low-luminosity AGN at by exploiting the first NIRCam images of the CEERS program. This AGN candidate, CEERS-AGN-z5-1, has a compact morphology and shows a rest-frame UV-to-optical spectral energy distribution (SED) that can be well explained by an unobscured quasar with erg s-1 and strong Balmer and [O iii] emission lines. In addition, Carnall et al. (2023) recently reported the detection of broad H emission from a quiescent galaxy at using JWST, from which they measure the central SMBH mass of .
Here we report on the detection of broad H emission from two galaxies, including CEERS-AGN-z5-1, using NIRSpec data obtained as part of the second epoch of CEERS observations. The first source, CEERS 1670 at , was identified as a result of targeted follow-up of CEERS-AGN-z5-1, while the second source, CEERS 3210 at , was found serendipitously while inspecting the spectra of galaxies with photometric redshifts of in the literature.
We show that the SMBHs at the heart of these low-luminosity AGN have masses 1-2 dex lower than existing samples of luminous quasars with BH mass estimates at . We also examine the emission line ratios of both sources and place constraints on the relationship between SMBH and host mass in the lowest mass range yet probed in the early universe. Our analysis is presented as follows: in Section 2, we describe the near-infrared imaging and spectroscopy used for this study, while in Section 3, we discuss the properties of our sample. In Section 4, we outline our methodology for measuring the emission line properties of our sample. Section 5 describes our results, and the implications of our findings are discussed in Section 6. We use vacuum wavelengths for all emission-line features and, when necessary, the following cosmological parameters are used: , , and .
2 Observations & Data Reduction
The Cosmic Evolution Early Release Science Survey (CEERS) is an early release science program that covers 100 arcmin2 of the Extended Groth Strip (EGS) with imaging and spectroscopy using coordinated, overlapping parallel observations by most of the JWST instrument suite (Finkelstein et al., in prep). CEERS is based around a mosaic of 10 NIRCam pointings, with six NIRSpec and eight MIRI pointings observed in parallel. Here we make use of NIRCam pointings 3 and 6 obtained on 21 June 2022, as well as NIRSpec pointing 4, obtained on 21 December 2022. In each NIRCam pointing, data were obtained in the short-wavelength (SW) channel F115W, F150W, and F200W filters, and long-wavelength (LW) channel F277W, F356W, F410M, and F444W filters. The total exposure time for pixels observed in all three dithers was typically 2835 s per filter.
The NIRSpec observations were taken with the G140M/F100LP, G235M/F170LP and G395M/F290LP grating/filter pairs as well as with the prism, providing a complete coverage of the m range with both configurations. The observation adopted a three-nod pattern, each of the nods consisting of a single integration of 14 groups (1036 s). The coadded spectra have a total exposure time of 3107 s in each spectral configuration. Targets for the microshutter array (MSA) configuration included sources selected using the NIRCam imaging in the field from CEERS epoch one (June 2022), especially prioritizing targets with photometric redshifts of . Each target was observed using a “slitlet” aperture of three microshutters, and the design also included empty shutters for background subtraction. The shutter configuration for observations taken with the medium resolution gratings and the prism are identical.
We performed an initial reduction of the NIRCam images in all four pointings, using version 1.5.3 of the JWST Calibration Pipeline111http://jwst-pipeline.readthedocs.io/en/latest/ with some custom modifications. We used the current (15 July 2022) set of NIRCam reference files222http://jwst-crds.stsci.edu, http://jwst_nircam_0214.imap, though we note that the majority were created pre-flight, including the flats and photometric calibration references. We describe our reduction steps in greater detail in Finkelstein et al. (2022) and Bagley et al. (2022). Coadding the reduced observations into a single mosaic was performed using the drizzle algorithm with an inverse variance map weighting (Fruchter & Hook, 2002; Casertano et al., 2000) via the Resample step in the pipeline. The output mosaics have pixel scales of 003/pixel.
| Source Name | R.A. | Dec. | ||
|---|---|---|---|---|
| (deg) | (deg) | (mag) | ||
| CEERS 1670 | 214.823453 | 52.830281 | 5.242 | |
| CEERS 3210 | 214.809142 | 52.868484 | 5.624 |
Photometry was computed on PSF-matched images using SExtractor (Bertin & Arnouts, 1996) v2.25.0 in two-image mode, with an inverse-variance weighted combination of the PSF-matched F277W and F356W images as the detection image. Photometry was measured in all seven of the NIRCam bands observed by CEERS, as well as the F606W, F814W, F105W, F125W, F140W, and F160W HST bands using data obtained by the CANDELS and 3D-HST surveys (Grogin et al., 2011; Koekemoer et al., 2011; Brammer et al., 2012; Momcheva et al., 2016).
The CEERS NIRSpec observations (Arrabal Haro et al., in prep.) were reduced using version 1.8.5 of the JWST Science Calibration Pipeline with the Calibration Reference Data System (CRDS) mapping 1027, starting from the Level 0 uncalibrated data products (“_uncal.fits” files) available on MAST. Custom parameters were used for the jump step at the detector-level calibration for a better treatment of the “snowballs”333https://jwst-docs.stsci.edu/data-artifacts-and-features/snowballs-and-shower-artifacts produced by high-energy cosmic ray events, and a nodded background subtraction was adopted.
The reduced two-dimensional (2D) spectra (“s2d”) have a rectified trace with a flat slope. The current version (1.8.5) of the pipeline does not correctly identify source locations in the 2D spectra for one-dimensional (1D) spectra extraction. For the sources presented in this work, the 1D spectra were extracted using custom boxcar apertures centered on the visually identified continuum trace. Any remaining artifacts in the extracted spectra were masked after a detailed visual analysis. The flux uncertainties of the reduced 1D spectra appear to be underestimated by a factor of 2, as estimated from the normalized median absolute deviation (NMAD) of the flux in line-free regions, and so we rescale the flux uncertainty of each spectrum by a factor equal to the ratio of the line-free NMAD to the median pipeline uncertainty.
The current (version 1.8.5) of the NIRSpec MSA data reduction uses a flux calibration that relies on pre-flight knowledge of the instrument, which is known to differ from the post-launch performance (see Figure 20 of Rigby et al. 2022). The pipeline applies a correction for “slit losses” outside the MSA aperture using a pathloss reference file based on a pre-launch model for point sources that has not yet been fully verified on orbit. This correction may be inaccurate for extended sources or non-default spectral extraction apertures, and indeed by comparing spectroscopic fluxes to NIRCam photometry we find some evidence that further corrections are required (see, e.g., section 3). While this may impact our interpretation of individual line fluxes or luminosities, the relative spectrophotometry of the reduced spectra is measured to be reliable, with line ratios of doublets ([O iii] 4960, 5008; Storey & Zeippen 2000) and Balmer lines (Osterbrock, 1989) that match physical expectations (see additional discussion in Trump et al. 2022, Arrabal Haro et al., in prep.).
3 Sample Description
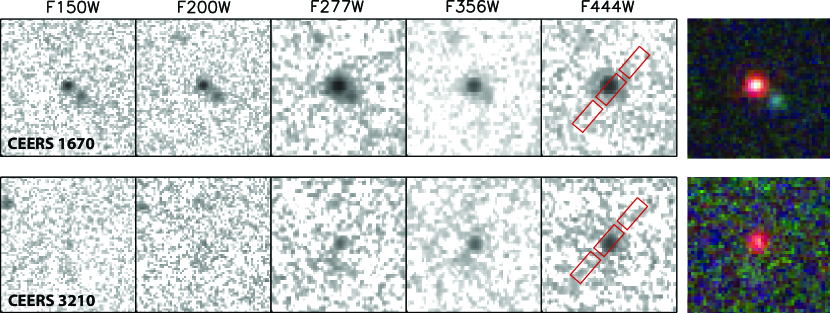
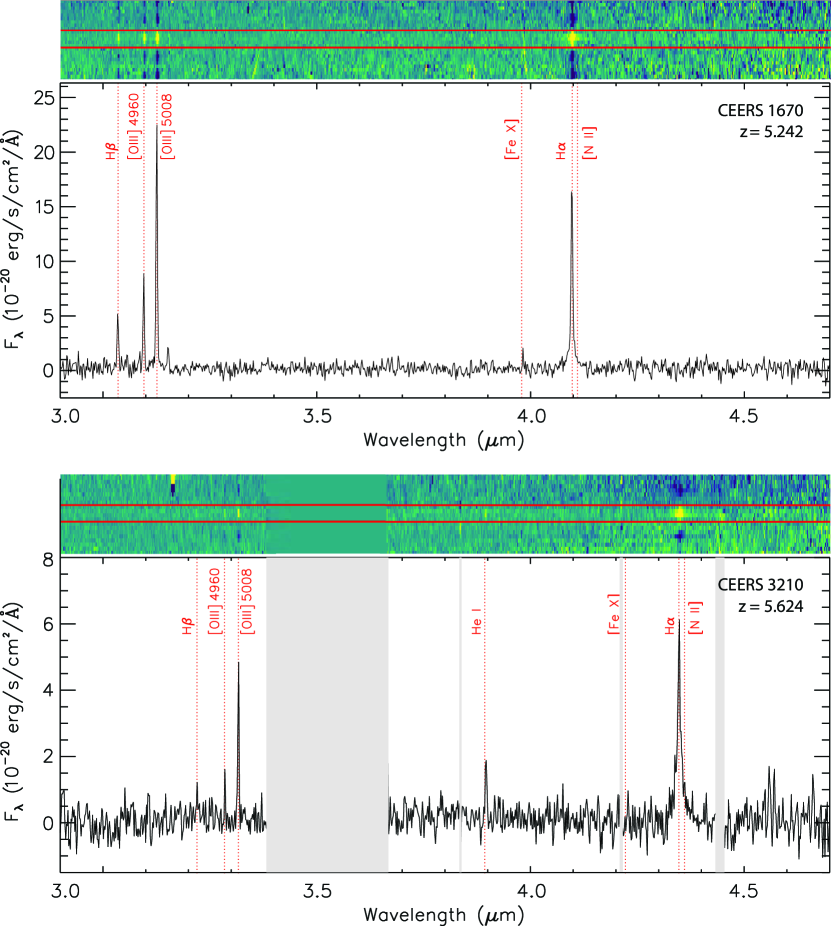
During the initial inspection of our reduced NIRSpec data, we identified two sources with broad H emission. Information on these sources, referred to as CEERS 1670 and CEERS 3210, is listed in Table 1. CEERS 1670 was observed as a result of targeted follow-up of the AGN candidate CEERS-AGN-z5-1 identified by O23. CEERS 3210 was selected for observation as it was previously identified as a candidate massive galaxy at by Labbe et al. (2022) and a potential strong-line emitter at by Pérez-González et al. (2022). NIRCam images of both sources are shown in Figure 1, while their 1D and 2D spectra from the G395M grating are shown in Figure 2. Our derived redshifts, based on the [O iii] 4960, 5008 narrow lines, for CEERS 1670 and CEERS 3210 are and , respectively.
Neither source is directly detected in the deep (800 ksec) Chandra X-ray observations of the CEERS field from the AEGIS-XD survey (Nandra et al., 2015). However, the shape of their SEDs, coupled with the existence of broad-line emission in their spectra, suggest both sources host low-luminosity AGN.
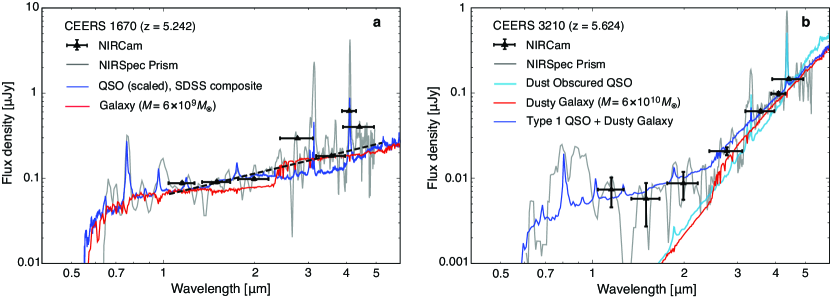
In Figure 3, we show the NIRCam photometry and NIRSpec prism spectrum of both CEERS 1670 and CEERS 3210. In the case of CEERS 1670, we find the prism spectrum must be scaled by a factor of to match the NIRCam broad-band photometry. This may be due to potential slit losses, as CEERS 1670 sits near the edge of its microshutter slit, the outline of which can be seen in Figure 1. We find no such correction is needed for the CEERS 3210 prism spectrum.
As discussed by O23, the broad-band photometry of CEERS 1670 is well reproduced by a continuum model with a single power-law function, with the exception of filters that are affected by strong line emission, namely F277W, F410M, and F444M. A single power-law fit to the other four filters yields the best-fit power-law slope (), which is consistent with a typical value for unobscured quasars (e.g., Fan et al., 2001; Vanden Berk et al., 2001). This power-law model yields the absolute magnitude at rest-frame 1450 Å of mag. Likewise, the monochromatic luminosity at rest-frame 3000 Å and 5100 Å is erg s-1 and erg s-1, respectively. We find that a low-redshift composite spectrum of quasars (the blue model in Figure 3a) from Vanden Berk et al. (2001, hereafter VB01) scaled to match the photometry can explain the observed spectral shape of CEERS 1670 well.
The SED of CEERS 3210 shows more complexity. The source has a blue continuum spectrum with a UV slope of at m and a very steep continuum spectrum () with strong Balmer and [O iii] emission lines at longer wavelengths. This steep spectral slope, coupled with the broad H emission we detect, suggests that this source is a heavily obscured, broad-line AGN (e.g., Gregg et al., 2002). In Figure 3b, we overlay the composite SED of low-redshift broad-line AGN (VB01) reddened assuming a color excess of and the extinction law discussed in Calzetti et al. (2000). Note that this model shown with the cyan curve is essentially the same as the QSO2 SED template provided in Polletta et al. (2006). This model traces the observed prism continuum at m well; however, the obscured broad-line AGN model does not explain the blue side of the observed spectrum, requiring additional components at these shorter wavelengths. We discuss more complex SED models, including fits using hybrid galaxy plus AGN models, in Section 6.3.
4 Line Fitting Analysis
The NIRSpec spectra of CEERS 1670 and CEERS 3210 include several prominent emission lines. The G395M/F290LP spectrum of both sources includes strong H, H, and [O iii] 4960, 5008 emission, and CEERS 3210 also features a He I line. Both sources exhibit a weak line near the expected wavelength of the [Fe x] 6376 coronal emission line. The G235M/F170LP spectrum of both sources includes the [Ne iii] line, while CEERS 3210 also exhibits the H and auroral [O iii] lines.
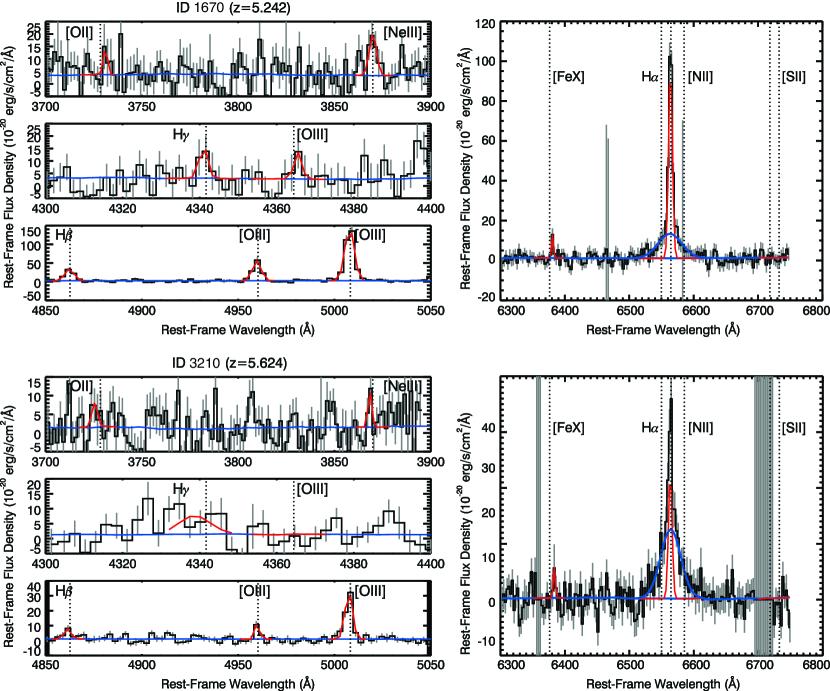
We measure line fluxes and uncertainties with a Levenberg-Marquardt least-squares method implemented by the mpfit IDL code444https://pages.physics.wisc.edu/craigm/idl/fitting.html. We fit isolated lines with single Gaussians and simultaneously fit multiple Gaussians for features in the Balmer line regions. The results of our line fits are shown in Figure 4.
To account for potential broad components, we fit the H line with two Gaussians: one narrow with width km s-1 and one broad with width km s-1. We also attempted to include additional Gaussian components for the [N ii] 6550, 6585 doublet, constraining the line widths and relative line centers to narrow H, but found that the [N ii] lines are not significantly (3) detected and their inclusion does not improve the of the fit. We report the upper limit for [N ii] 6585 but do not include it in the fits for broad and narrow H.
We also performed a simultaneous fit of the H emission-line region with components for narrow H and the [O iii] 4960,5008 doublet. In both systems we tested a fit that included an additional broad ( km s-1) H component but found that this component is only marginally (1) detected and including it increases the of the fit. We report 1 upper limits for putative broad H emission that assume the same width as the broad H component applied to the local noise of the H region.
Finally, we fit single narrow Gaussians for the [O ii] (the 3727+3729 doublet is blended in the medium-resolution NIRSpec grating), [Ne iii] , H , and [O iii] . The [Ne iii] line is significantly (3) detected in CEERS 1670 and all the other lines are only marginally (3) detected.
5 Results
5.1 Emission Line Properties
Our two AGN are identified from their broad H emission. As described above, we use a two-component fit with both narrow and broad Gaussian components in which the line centers, widths, and fluxes are free parameters. These broad+narrow fits have significantly lower than single-Gaussian fits for the H lines. Both objects have best-fit narrow H components that are unresolved in the NIRSpec spectra, with narrow-H widths of km s-1 and km s-1 for CEERS 1670 and CEERS 3210, respectively. The best-fit broad H components have km s-1 and km s-1 for CEERS 1670 and km s-1 and km s-1 for CEERS 3210 (fitting and FWHM independently).
In contrast, the H emission lines of both objects are best-fit by single narrow Gaussians, with no statistical improvement from including a broad component. Both H lines appear to be unresolved, with best-fit single-Gaussian widths of km s-1 for CEERS 1670 and km s-1 for CEERS 3210. We compute upper limits for a potential (undetected) broad H component by assuming a Gaussian of the same width as the measured H broad lines with the noise properties of the H region in the spectrum. In both cases the upper limit for potential H broad emission is statistically consistent with a broad (Osterbrock, 1989): CEERS 1670 has a lower limit of broad (3) and CEERS 3210 has a lower limit of (3). In other words, both CEERS 1670 and CEERS 3210 are consistent with (undetected) broad H emission that matches typical Type 1 AGN H/H ratios, and the lack of observed broad H in CEERS 1670 and CEERS 3210 cannot be used to classify them as intrinsic Type 1.5 AGN.
The narrow Balmer emission lines imply modest dust attenuation in both objects. CEERS 1670 has a measured narrow-line Balmer decrement of and CEERS 1670 has a narrow-line . We use these Balmer decrements as priors to inform the SED fitting in Section 6.2 and 6.3.
Intriguingly, both AGN have weak emission-line features that are consistent with marginally-detected [Fe x] 6376, as seen in Figures 2 and 4. [Fe x] is a coronal emission line with an ionization potential of 262 eV that is observed in low-mass AGN in the local universe (e.g., Molina et al., 2021). The putative [Fe x] emission lines are marginally detected with SNR=2.4 for CEERS 1670 and only SNR=1.5 for CEERS 3210. Both lines are best-fit to be slightly redder than the other narrow-line features: if the marginal detections represent genuine emission lines then they may indicate a kinematic offset between the extreme-ionization coronal gas and the narrow-line region.
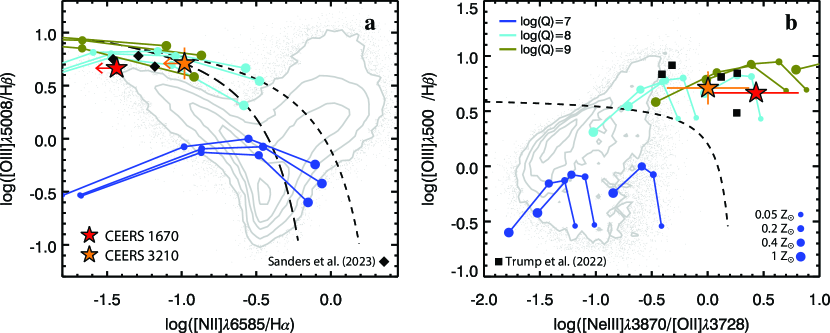
Finally, in Figure 5 we plot the narrow emission-line ratios of both sources on the BPT ([O iii]/H versus [N ii]/H; Baldwin et al. 1981) and OHNO ([Ne iii]/[O ii] versus [O iii]/H; Backhaus et al. 2022) line-ratio diagnostics that are commonly used to classify galaxies as dominated by emission from AGN or star formation. The colored curves in Figure 5 indicate MAPPINGS V photoionization models from Kewley et al. (2019), with different colored curves for different ionization ( increasing left to right), metallicity along each curve ( as indicated in the legend), and curves shown for each of three thermal pressures (). The MAPPINGS V models use -enhanced abundances as described in Nicholls et al. (2017), such that low metallicities include enhanced relative abundances of O and Ne (and a lower relative abundance of N). Figure 5 also includes comparison samples of high-redshift galaxy line ratios from early JWST spectroscopy: stacked CEERS measurements from Sanders et al. (2023) in the BPT and SMACS ERO galaxies from Trump et al. (2022) in the OHNO diagram.
At low redshift (), AGN typically have higher [N ii]/H, [O iii]/H, and [Ne iii]/[O ii] ratios due to harder ionizing radiation from the AGN accretion disk, and line-ratio diagnostics shown in Figure 5 can be used to separate AGN from star-forming galaxies. However, high-redshift galaxies show systematic offsets relative to galaxies and AGN at , with higher ionization and lower metallicity in both AGN and from star-forming H ii regions (Shapley et al., 2005; Erb et al., 2006; Liu et al., 2008; Kewley et al., 2013b, a; Sanders et al., 2023). Both CEERS 1670 and CEERS 3210 have high [O iii]/H, low [N ii]/H, and high [Ne iii]/[O ii] line ratios that are consistent with MAPPINGS V photoionization models for high ionization () and moderately low metallicity ().
The AGN line ratios and interstellar medium conditions implied in Figure 5 are virtually indistinguishable from star-forming galaxies observed at similar redshifts, since high-redshift H ii regions have similarly high ionization and low metallicity to these AGN narrow-line regions. Photoionization models show that low-metallicity AGN can have similar [O iii]/H and [N ii]/H ratios and lie within or even below the star-forming branch (Groves et al., 2006; Feltre et al., 2016). Although low-metallicity AGN are rare in the local universe (e.g., Storchi-Bergmann et al., 1998; Groves et al., 2006), recent simulations that make use of the AGN photoionization models presented in Feltre et al. (2016) predict that high-redshift, low-metallicity AGN should primarily occupy the top portion of the local star-forming branch (Hirschmann et al., 2019, 2022), in agreement with our findings. The fact that neither source is X-ray detected and that their BPT line ratios are similar to that of star-forming galaxies observed at the same redshift means that their broad-line emission may be one of the few ways to detect these high-redshift low-luminosity AGN. Other possible approaches include diagnostics with high-ionziation and extreme-ionization lines (e.g., He ii and [Ne v]; Feltre et al. 2016; Nakajima & Maiolino 2022; Cleri et al. 2023). Preselection with photometric colors may also be useful to select fast-growing BHs with in metal-poor environments (Inayoshi et al., 2022b).
| ID | (broad) | FWHMHα,broad | ||||||
| (mag) | () | () | () | () | () | |||
| 1670 | ||||||||
| 3210 | See text | |||||||
| 3210 | See text | |||||||
5.2 Virial BH Mass Estimates
In this section, we estimate the virial BH masses of the two broad-line AGN assuming that their broad H emission traces the kinematics of gas in the broad-line-region. The single-epoch BH mass estimation method is best calibrated against the width of the broad H emission line and the rest-frame 5100 Å continuum luminosity () using the reverberation mapping technique (e.g., Kaspi et al., 2000). However, since we do not detect a broad H component in our spectra, we instead employ the BH mass relationship proposed by Greene & Ho (2005, hereafter GH05), which relies entirely on H emission. This method has been widely used in, for example, BH mass estimates for AGN in dwarf galaxies (e.g., Reines et al., 2013; Baldassare et al., 2015). This recipe is based on empirical correlations between Balmer emission-line luminosities and and between the line widths of H and H.
In terms of the broad H line width and , the BH mass formula is expressed as:
| (1) |
This equation is based on the formula of Kaspi et al. (2000) for H with the H line width substituted with that of H (Equation 3 of GH05, ). It is important to note that this equation assumes that the 5100 Å continuum luminosity is dominated by light from the AGN. Alternatively, we can directly apply the virial BH mass recipe of GH05, which is based on the broad H line width and luminosity:
| (2) |
First, we use the line width of the broad H component detected in our NIRSpec spectroscopy, corrected for the instrumental resolution, and derived from the photometric SEDs to estimate the virial BH masses of CEERS 1670. Using Equation 1 results in a BH mass of , with the Eddington ratio of . We use the bolometric luminosity inferred from to be consistent with other BH mass estimates in the literature. We apply a bolometric correction of (Richards et al., 2006) to derive erg s-1. Using instead the H line width and luminosity, Equation 2 yields . This value is more systematically uncertain than our first estimate, although consistent within the 1 error, owing to potential slit losses (see Section 2).
The BH mass estimate for CEERS 3210 is complicated because of its potentially obscured nature. Taking the observed H luminosity at face value and applying Equation 2, we derive a mass of . We caution that this value is likely a lower limit since the H emission is likely affected by dust extinction. If we assume that a dust-reddened AGN continuum dominates the observed rest-optical spectrum with (see Section 6.3), the inferred BH mass could be as high as . A careful decomposition of the AGN/host components, and, if the AGN is dust-reddened, measurements of AGN continuum luminosity at rest-frame infrared wavelengths (Greene et al., 2014; Kim et al., 2015) are required to better estimate the intrinsic continuum luminosity and subsequently the virial mass for this AGN.
6 Discussion
6.1 The Distribution
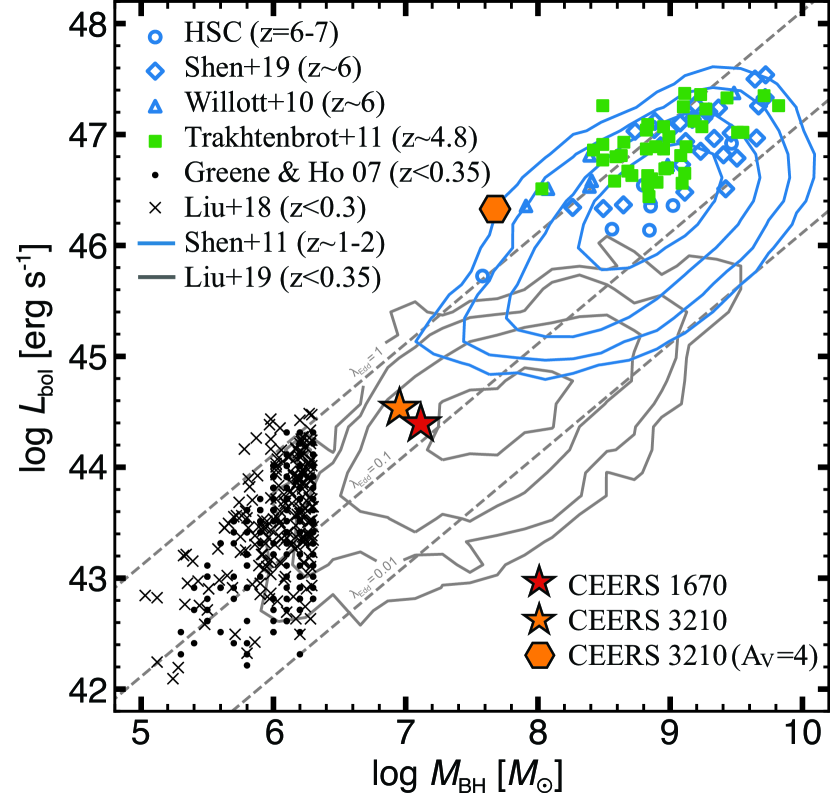
The successful spectroscopic identification of two low-luminosity broad-line AGN at opens up a new parameter space for high-redshift AGN studies, thanks to the unprecedented infrared sensitivity of JWST and the multiwavelength photometric dataset available in the EGS field. Figure 6 shows the distribution of AGN in the BH mass - bolometric luminosity plane with the two new low-luminosity AGN shown in red and orange.
As is discussed in O23, CEERS 1670 is 2–3 dex fainter than known quasars at (e.g., Willott et al., 2010b; Trakhtenbrot et al., 2011; Shen et al., 2019; Onoue et al., 2019; Matsuoka et al., 2019; Kato et al., 2020) and more comparable to those of typical nearby AGN (e.g., Liu et al., 2019). The virial BH mass estimate we present above now shows that this low-luminosity AGN is by far the least-massive BH known in the universe at the end of cosmic reionization. The modest Eddington ratio of CEERS 1670 suggests that this AGN has been identified after its rapid accretion mode has ended, although it is possible the system will experience future bursts of heavy accretion (Li et al., 2022).
For CEERS 3210, if we use the observed H luminosity without an extinction correction, then the BH powering this AGN may be comparably low-mass as CEERS 1670. However, if we assume heavy dust attenuation (), it becomes a BH accreting at a rate above the Eddington limit. In Figure 6, we show our results assuming both no extinction for the H luminosity and with the bolometric luminosity converted from estimated from the Hα luminosity. Adopting a more moderate level of dust extinction inferred from the observed Balmer decrement in the NIRSpec spectrum (; ), brings the bolometric luminosity of the source closer to the Eddington value. Thus, CEERS 3210 is likely in its most active mode of accretion and on the way to expelling the material that currently obscures it. Fujimoto et al. (2022) report a dust-reddened AGN at , the BH mass of which is estimated to be based on the upper limit of its X-ray luminosity. Although not confirmed, their AGN and CEERS 3210 may be drawn from the same population of high-redshift dust-reddened AGN. We discuss this scenario in greater detail in Section 6.3 below.
6.2 Constraints on the Host Galaxy Mass of CEERS 1670
Figure 3a shows the prism spectrum and NIRCam photometric flux densities of CEERS 1670. As discussed in Section 3, the continuum spectral shape can be explained by the low-redshift composite quasar spectrum of VB01. Since the observed spectrum is dominated by the central AGN contribution, it is challenging to estimate the stellar mass of the host galaxy in a plausible way. O23 conducted the SED fitting analysis for the photometric data using templates of metal-poor galaxies (Inoue, 2011). The best-fit model with pure galaxy SEDs, where the quasar contribution is neglected, suggests a case with metallicity , stellar age Myr, star formation rate (SFR) , whose stellar mass is . This value is considered to be an upper bound of the stellar mass among the SED templates O23 explored, but the true upper bound depends sensitively on the properties of the assumed stellar population. In the following, we give a robust upper bound of the stellar mass built up in the host galaxy at , assuming the SED model parameters that yield a high mass for the given stellar luminosity.
One advantage of focusing on galaxies is that the stellar age is limited to the age of the Universe, e.g., Gyr at . Although the star formation history (SFH) in the galaxy is unconstrained, the mass-to-light ratio () in the rest-frame optical and near-infrared band tends to increase with time (e.g., Bell & de Jong, 2001); for instance, the ratio in the -band can be approximated as at Gyr when a constant star formation rate (or decaying with a delay time)555 One of the most extreme SFH is the case where a galaxy forms in one burst episode at . The ratio continuously decreases with time due to death of massive stars that are not a dominant population in mass for a standard initial mass function (IMF) (e.g., Kroupa, 2001; Chabrier, 2003). However, the SFH is not applicable to our targets with active star formation inferred from strong emission lines. is assumed (Into & Portinari, 2013). Therefore, for the purpose of deriving an upper bound of the stellar mass, we adopt a characteristic time of Gyr. We use the population synthesis code STARBURST99 version v7.0.1 (Leitherer et al., 1999) to generate stellar SEDs of galaxies. Here, we assume the Kroupa IMF (Kroupa 2001; ), the Padova isochrone models, and constant star formation with a duration of 1 Gyr. We consider two values of stellar metallicity ( and ) to show the metallicity dependence, while we note that the solar-metallicity case gives a higher upper bound of the stellar mass. We take into account dust attenuation by the extinction law of starburst galaxies (Calzetti et al., 2000). The color excess of the stellar continuum is fixed to , which is calculated from the Balmer decrement of the narrow emission lines we detect in the NIRSpec spectra (see Section 5.1).
This model, when scaled to the flux density in the F356W filter, results in a host mass of . This galaxy SED model is shown in Figure 3a as the red curve. Therefore, we argue that the stellar mass of the host galaxy is limited to for CEERS 1670 so that the stellar continuum flux density does not exceed the observed continuum level. We note that the upper bound depends significantly on the low-mass end () of the stellar IMF; for instance, the upper bound is reduced by a factor of for .
6.3 The Obscured Nature of CEERS 3210
Figure 3b shows the prism spectrum and NIRCam photometric flux densities of CEERS 3210. The red spectral shape with an index of at longer wavelengths can be explained either by a heavily obscured quasar (cyan) or a dusty starburst galaxy (red). Both models require the existence of obscuring material along the line of sight: a typical visual extinction of and for the obscured quasar and dusty galaxy model, respectively. We note that this dusty-galaxy SED is calculated with the same galaxy model as discussed in Section 6.2, but assuming a stellar mass of and a different level of extinction. However, neither of the SED models explains the excess of the observed spectrum at m, requiring additional blue components.
One possible explanation for the blue component is dust (and electron) scattering, which preserves the spectral shape of the intrinsic broad-line AGN component (e.g., Zakamska et al., 2005). In fact, obscured quasars at low redshifts () tend to show optical polarization levels higher than those of unobscured populations (Alexandroff et al., 2018). The fraction of the scattered flux relative to the primary component depends on the covering factor of the scattering medium and our viewing angle. For instance, assuming that 0.6% of the radiation flux of the intrinsic spectrum is scattered to our line of sight (see the Torus model in Polletta et al., 2006), the total SED is consistent with the photometric flux densities. Alternatively, the spectral shape of CEERS 3210 could be explained by the combination of quasar emission at short wavelengths and light from a heavily obscured starburst galaxy dominating at long wavelengths. This combination of AGN+galaxy light is shown as the blue curve in Figure 3b. If this is the case, CEERS 3210 would be caught in a transition stage, moving from a dust-obscured starburst to an unobscured luminous quasar by expelling gas and dust. This model hypothesis is consistent with the dust-reddened AGN at reported by Fujimoto et al. (2022), the BH mass of which is similar to that of CEERS 3210. This would make CEERS 3210 a dusty progenitor of the luminous, unobscured quasars observed by ground-based quasar surveys.
We can place a constraint on the host galaxy mass of CEERS 3210 following the same arguments used for CEERS 1670. Assuming the light at longer wavelengths is entirely dominated by stellar emission and using a dust-obscured () version of the stellar population described Section 6.2, we obtain an upper limit on the host mass of . It is worth noting that the unobscured galaxy SED is modeled so that it has the highest ratio, and thus our estimate gives a conservative upper bound. Using the hybrid quasar + dusty galaxy model does not appreciably change this upper limit as the steep spectral slope at m is dominated by the galaxy component in the second scenario.
Nevertheless, it is difficult to distinguish these two scenarios using the current data. Thus, multi-wavelength follow-up observations such as rest-frame infrared and far-infrared imaging are needed to further constrain the nature of CEERS 3210. We leave a more detailed SED analysis of this source to future work.
6.4 BH-Galaxy Coevolution at
The empirical relation between the masses of SMBHs and their host galaxies is considered to be one of the most important outcomes of their mutual evolution over the cosmic timescale (e.g., Kormendy & Ho, 2013). To constrain how and when the BH-galaxy correlations were established, the distribution at the earliest epoch of the universe needs to be unveiled. The apparent location of high- quasars and their hosts also gives us more information on the BH growth mechanisms and their seeding processes (Inayoshi et al., 2022a; Hu et al., 2022; Scoggins et al., 2023).
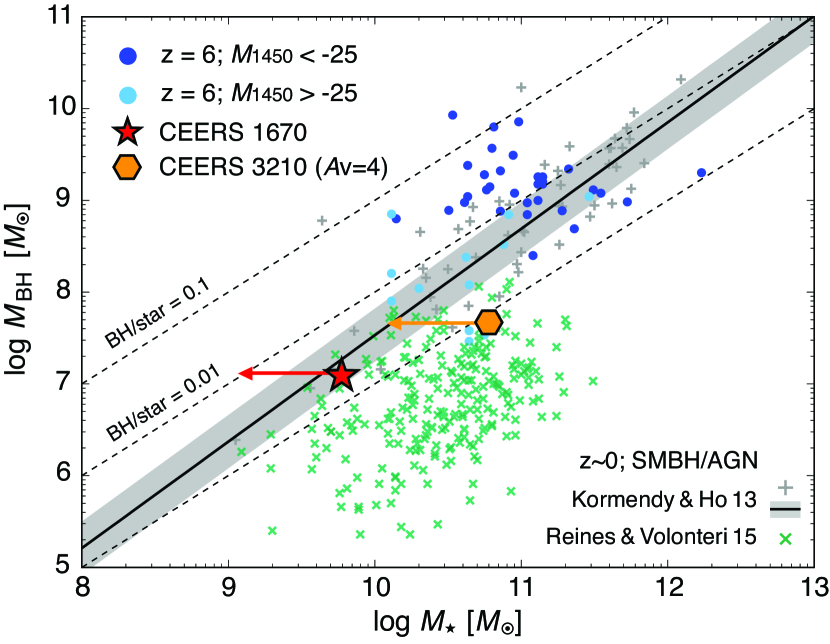
Our first source, CEERS 1670, is a broad-line AGN with a BH mass of hosted in a star-forming galaxy with a stellar mass limited below . Our second source, CEERS 3210, is inferred to be a heavily obscured broad-line AGN with a BH mass of (or unless it is obscured). The host stellar mass is possibly as high as in the case of the the hybrid quasar + dusty galaxy model.
Figure 7 shows the distribution of quasars compiled in Izumi et al. (2021) (circle) for which the stellar mass is assumed to be the [C ii]-based dynamical mass. CEERS 1670 is located at the left-bottom corner of the plane, which is uniquely separated from the quasar population already known (e.g., Wang et al., 2013; Venemans et al., 2016; Izumi et al., 2021). The mass ratio of for CEERS 1670 is consistent with or higher than that expected from the empirical relation seen in massive galaxies at (black line Kormendy & Ho, 2013), but is overmassive compared to the BH-to-galaxy mass ratio measured for nearby broad-line AGN whose virial BH masses are estimated to be as low as that of CEERS 1670 (Reines & Volonteri, 2015). On the other hand, adopting the dust-corrected BH mass and dusty-galaxy SED model, CEERS 3210 is located well below the empirical relation at . An important caveat is that the upper bound of the stellar mass can be reduced by a factor of with a different stellar population and star formation history (see discussion in Section 6.2). Further follow-up observations would give a better estimate of the stellar mass. The existence of such an overmassive BH, if confirmed, provides us with a unique opportunity to study the early stage of the BH-galaxy assembly.
6.5 Update of AGN Luminosity Function
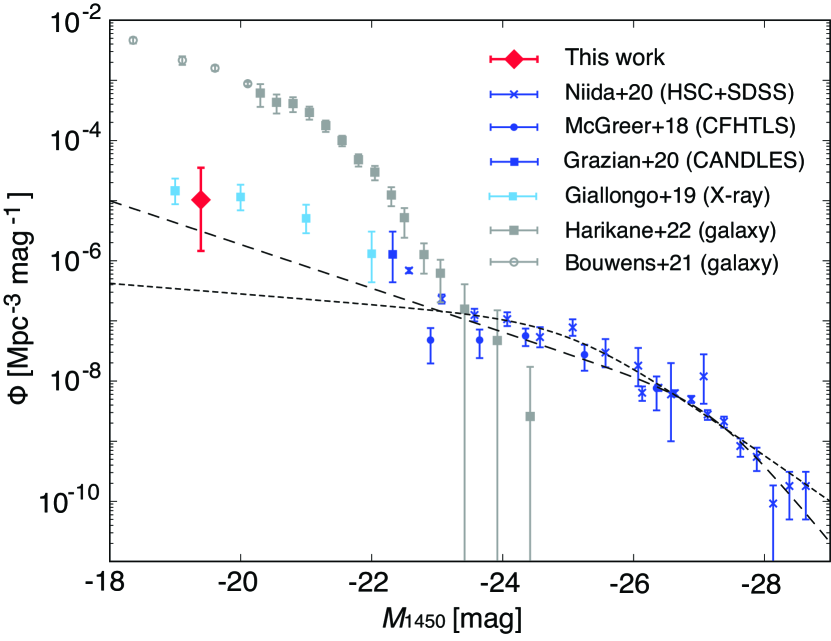
We update the UV luminosity function of AGN from O23, based on the spectroscopic redshift of CEERS 1670. We do not include CEERS 3210 in our discussion, because of its unconstrained intrinsic UV luminosity. Following O23, we do not aim to provide statistical constraints on the luminosity function based on our small and incomplete sample, but we rather quantify the serendipity of our discovered low-luminosity AGN at in the 34.5 arcmin2 of the first NIRCam pointings of the CEERS survey. Adopting the spectroscopic redshift of and the redshift interval of , we derive the AGN number density of Mpc-3 mag-1 at the UV magnitude of mag. The difference from O23 ( Mpc-3 mag-1) is tiny, because the central redshift of only slightly changes from their work (). The updated luminosity function is presented in Figure 8.
The faint end of the AGN/quasar luminosity function is a matter of debate, because low-luminosity AGN produce more ionizing photons in a certain cosmic volume than do much rarer luminous AGN, and thus its steepness is critical to infer the relative role in the cosmic reionization with respect to star-forming galaxies (e.g., Giallongo et al., 2015; Onoue et al., 2017; McGreer et al., 2018a; Matsuoka et al., 2018; Giallongo et al., 2019; Finkelstein et al., 2019; Grazian et al., 2020, 2022; Niida et al., 2020; Kim et al., 2020; Kim & Im, 2021; Jiang et al., 2022; Finkelstein & Bagley, 2022a; Yung et al., 2021). The space density that we infer suggests that low-luminosity AGN such as CEERS 1670 may in fact be common, in agreement with previous studies that have identified candidate faint quasars in relatively small survey areas (e.g., Fujimoto et al., 2022). However, a complete survey of low-luminosity AGN with a well-defined selection function as well as a careful analysis of host galaxy contribution to the UV magnitudes (Bowler et al., 2021; Adams et al., 2022; Harikane et al., 2022) is required to statistically argue the AGN abundance at the faint end, and subsequently the relative contribution of AGN to the cosmic hydrogen/helium reionization.
7 Conclusions
We make use of JWST NIRSpec spectroscopy from the CEERS Survey to identify two low-luminosity AGN at with broad H emission in their spectra. The first source, CEERS 1670 at , has a UV magnitude of , making it 2–3 dex fainter than known quasars at similar redshifts. The source was previously identified as a candidate low-luminosity AGN based on broad-band photometry by O23. We measure a FWHM of km s-1 for the broad H component, resulting in a BH mass of , making this the least-massive BH known in the universe at the end of cosmic reionization.
The second source, CEERS 3210 at , has a blue continuum spectrum at short wavelengths (m) and a steep spectral slope at longer wavelengths. The SED shape suggests that this source is a broad-line AGN possibly caught in a transition phase between a dust-obscured starburst and an unobscured quasar. We measure a FWHM of km s-1 for the broad H component, resulting in a BH mass in the range of , depending on the level of dust obscuration assumed.
We derive upper limits on the host mass of each AGN and place constraints on the - relationship in the lowest mass range yet probed in the early universe. We find the host of CEERS 1670 is limited to , while the host mass of CEERS 3210 can be an order of magnitude larger () if we assume a visual extinction of , as inferred from our SED fitting. The ratio for CEERS 1670, in particular, is consistent with or higher than the empirical relationship seen in massive galaxies at , but is overmassive compared to the BH-to-galaxy mass ratio measured for nearby broad-line AGN whose virial BH masses are estimated to be as low as that of CEERS 1670.
We examine the narrow emission-line ratios of both sources and find that their location on the BPT and OHNO diagrams is consistent with model predictions for moderately low-metallicity AGN with . The fact that neither source is X-ray detected and their emission line ratios in the BPT diagram are virtually indistinguishable from star-forming galaxies observed at similar redshifts means that their broad-line emission may be one of the few ways to detect these AGN. Other possible approaches include diagnostics with high-ionziation lines (e.g., He and Ne) (Feltre et al., 2016; Nakajima & Maiolino, 2022). Preselection with photometric colors may also be useful to select fast-growing BHs with in metal-poor environments (Inayoshi et al., 2022b).
The spectroscopic discovery of two low-luminosity, low-mass AGN at demonstrates the capabilities of JWST to push the BH mass limit closer to the range predicted for the BH seed population. Future work to uncover these low-luminosity AGN, which are the dominant BH population at high redshift, will be the key to further constraining their abundance and the early growth history of SMBHs and their host galaxies.
8 Acknowledgments
This work is supported by NASA grants JWST-ERS-01345 and JWST-AR-02446 and based on observations made with the NASA/ESA/CSA James Webb Space Telescope. The data were obtained from the Mikulski Archive for Space Telescopes at the Space Telescope Science Institute, which is operated by the Association of Universities for Research in Astronomy, Inc., under NASA contract NAS 5-03127 for JWST. This work also made use of the Rainbow Cosmological Surveys Database, which is operated by the Centro de Astrobiología (CAB/INTA), partnered with the University of California Observatories at Santa Cruz (UCO/Lick,UCSC).
We also acknowledge support from the National Natural Science Foundation of China (12073003, 12150410307, 12003003, 11721303, 11991052, 11950410493), and the China Manned Space Project Nos. CMS-CSST-2021- A04 and CMS-CSST-2021-A06. PGP-G acknowledges support from Spanish Ministerio de Ciencia e Innovación MCIN/AEI/10.13039/501100011033 through grant PGC2018-093499-B-I00.
AG acknowledges financial contribution from the grant PRIN INAF 2019 (RIC) 1.05.01.85.09: “New light on the Intergalactic Medium (NewIGM)” and support from PRIN MIUR project “Black Hole winds and the Baryon Life Cycle of Galaxies: the stone-guest at the galaxy evolution supper”, contract 2017-PH3WAT.
References
- Adams et al. (2022) Adams, N. J., Bowler, R. A. A., Jarvis, M. J., Varadaraj, R. G., & Häußler, B. 2022, arXiv e-prints, arXiv:2207.09342. https://arxiv.org/abs/2207.09342
- Alexandroff et al. (2018) Alexandroff, R. M., Zakamska, N. L., Barth, A. J., et al. 2018, MNRAS, 479, 4936, doi: 10.1093/mnras/sty1685
- Bañados et al. (2016) Bañados, E., Venemans, B. P., Decarli, R., et al. 2016, ApJS, 227, 11, doi: 10.3847/0067-0049/227/1/1110.48550/arXiv.1608.03279
- Backhaus et al. (2022) Backhaus, B. E., Trump, J. R., Cleri, N. J., et al. 2022, ApJ, 926, 161, doi: 10.3847/1538-4357/ac3919
- Bagley et al. (2022) Bagley, M. B., Finkelstein, S. L., Koekemoer, A. M., et al. 2022, arXiv e-prints, arXiv:2211.02495. https://arxiv.org/abs/2211.02495
- Baldassare et al. (2015) Baldassare, V. F., Reines, A. E., Gallo, E., & Greene, J. E. 2015, ApJ, 809, L14, doi: 10.1088/2041-8205/809/1/L14
- Baldwin et al. (1981) Baldwin, J. A., Phillips, M. M., & Terlevich, R. 1981, PASP, 93, 5, doi: 10.1086/130766
- Bell & de Jong (2001) Bell, E. F., & de Jong, R. S. 2001, ApJ, 550, 212, doi: 10.1086/319728
- Bennert et al. (2011) Bennert, V. N., Auger, M. W., Treu, T., Woo, J.-H., & Malkan, M. A. 2011, ApJ, 742, 107, doi: 10.1088/0004-637X/742/2/10710.48550/arXiv.1102.1975
- Bertin & Arnouts (1996) Bertin, E., & Arnouts, S. 1996, A&AS, 117, 393, doi: 10.1051/aas:1996164
- Bouwens et al. (2021) Bouwens, R. J., Oesch, P. A., Stefanon, M., et al. 2021, AJ, 162, 47, doi: 10.3847/1538-3881/abf83e
- Bowler et al. (2021) Bowler, R. A. A., Adams, N. J., Jarvis, M. J., & Häußler, B. 2021, MNRAS, 502, 662, doi: 10.1093/mnras/stab038
- Brammer et al. (2012) Brammer, G. B., van Dokkum, P. G., Franx, M., et al. 2012, ApJS, 200, 13, doi: 10.1088/0067-0049/200/2/13
- Calzetti et al. (2000) Calzetti, D., Armus, L., Bohlin, R. C., et al. 2000, ApJ, 533, 682, doi: 10.1086/308692
- Carnall et al. (2023) Carnall, A. C., McLure, R. J., Dunlop, J. S., et al. 2023, arXiv e-prints, arXiv:2301.11413. https://arxiv.org/abs/2301.11413
- Casertano et al. (2000) Casertano, S., de Mello, D., Dickinson, M., et al. 2000, AJ, 120, 2747, doi: 10.1086/316851
- Chabrier (2003) Chabrier, G. 2003, Publications of the Astronomical Society of the Pacific, 115, 763, doi: 10.1086/376392
- Cleri et al. (2023) Cleri, N. J., Olivier, G. M., Hutchison, T. A., et al. 2023, arXiv e-prints, arXiv:2301.07745, doi: 10.48550/arXiv.2301.07745
- Ding et al. (2022a) Ding, X., Silverman, J. D., & Onoue, M. 2022a, ApJ, 939, L28, doi: 10.3847/2041-8213/ac9c02
- Ding et al. (2020) Ding, X., Silverman, J., Treu, T., et al. 2020, ApJ, 888, 37, doi: 10.3847/1538-4357/ab5b90
- Ding et al. (2022b) Ding, X., Onoue, M., Silverman, J. D., et al. 2022b, arXiv e-prints, arXiv:2211.14329. https://arxiv.org/abs/2211.14329
- Erb et al. (2006) Erb, D. K., Shapley, A. E., Pettini, M., et al. 2006, ApJ, 644, 813, doi: 10.1086/503623
- Fan et al. (2022) Fan, X., Banados, E., & Simcoe, R. A. 2022, arXiv e-prints, arXiv:2212.06907. https://arxiv.org/abs/2212.06907
- Fan et al. (2001) Fan, X., Narayanan, V. K., Lupton, R. H., et al. 2001, AJ, 122, 2833, doi: 10.1086/324111
- Feltre et al. (2016) Feltre, A., Charlot, S., & Gutkin, J. 2016, MNRAS, 456, 3354, doi: 10.1093/mnras/stv2794
- Ferrarese & Merritt (2000) Ferrarese, L., & Merritt, D. 2000, ApJ, 539, L9, doi: 10.1086/312838
- Finkelstein & Bagley (2022a) Finkelstein, S. L., & Bagley, M. B. 2022a, ApJ, 938, 25, doi: 10.3847/1538-4357/ac89eb
- Finkelstein & Bagley (2022b) —. 2022b, arXiv e-prints, arXiv:2207.02233. https://arxiv.org/abs/2207.02233
- Finkelstein et al. (2019) Finkelstein, S. L., D’Aloisio, A., Paardekooper, J.-P., et al. 2019, ApJ, 879, 36, doi: 10.3847/1538-4357/ab1ea8
- Finkelstein et al. (2022) Finkelstein, S. L., Bagley, M. B., Arrabal Haro, P., et al. 2022, arXiv e-prints, arXiv:2207.12474. https://arxiv.org/abs/2207.12474
- Fruchter & Hook (2002) Fruchter, A. S., & Hook, R. N. 2002, PASP, 114, 144, doi: 10.1086/338393
- Fujimoto et al. (2022) Fujimoto, S., Brammer, G. B., Watson, D., et al. 2022, Nature, 604, 261, doi: 10.1038/s41586-022-04454-1
- Furtak et al. (2022) Furtak, L. J., Zitrin, A., Plat, A., et al. 2022, arXiv e-prints, arXiv:2212.10531, doi: 10.48550/arXiv.2212.10531
- Gebhardt et al. (2000) Gebhardt, K., Bender, R., Bower, G., et al. 2000, ApJ, 539, L13, doi: 10.1086/312840
- Gehrels (1986) Gehrels, N. 1986, ApJ, 303, 336, doi: 10.1086/164079
- Giallongo et al. (2015) Giallongo, E., Grazian, A., Fiore, F., et al. 2015, A&A, 578, A83, doi: 10.1051/0004-6361/201425334
- Giallongo et al. (2019) —. 2019, ApJ, 884, 19, doi: 10.3847/1538-4357/ab39e1
- Grazian et al. (2020) Grazian, A., Giallongo, E., Fiore, F., et al. 2020, ApJ, 897, 94, doi: 10.3847/1538-4357/ab99a3
- Grazian et al. (2022) Grazian, A., Giallongo, E., Boutsia, K., et al. 2022, ApJ, 924, 62, doi: 10.3847/1538-4357/ac33a4
- Greene & Ho (2005) Greene, J. E., & Ho, L. C. 2005, ApJ, 630, 122, doi: 10.1086/431897
- Greene & Ho (2007) —. 2007, ApJ, 670, 92, doi: 10.1086/522082
- Greene et al. (2014) Greene, J. E., Alexandroff, R., Strauss, M. A., et al. 2014, ApJ, 788, 91, doi: 10.1088/0004-637X/788/1/91
- Gregg et al. (2002) Gregg, M. D., Lacy, M., White, R. L., et al. 2002, ApJ, 564, 133, doi: 10.1086/324145
- Grogin et al. (2011) Grogin, N. A., Kocevski, D. D., Faber, S. M., et al. 2011, ApJS, 197, 35. https://arxiv.org/abs/1105.3753
- Groves et al. (2006) Groves, B. A., Heckman, T. M., & Kauffmann, G. 2006, MNRAS, 371, 1559, doi: 10.1111/j.1365-2966.2006.10812.x
- Habouzit et al. (2022) Habouzit, M., Onoue, M., Bañados, E., et al. 2022, MNRAS, 511, 3751, doi: 10.1093/mnras/stac225
- Harikane et al. (2022) Harikane, Y., Ono, Y., Ouchi, M., et al. 2022, ApJS, 259, 20, doi: 10.3847/1538-4365/ac3dfc
- Hirschmann et al. (2019) Hirschmann, M., Charlot, S., Feltre, A., et al. 2019, MNRAS, 487, 333, doi: 10.1093/mnras/stz1256
- Hirschmann et al. (2010) Hirschmann, M., Khochfar, S., Burkert, A., et al. 2010, MNRAS, 407, 1016, doi: 10.1111/j.1365-2966.2010.17006.x
- Hirschmann et al. (2022) Hirschmann, M., Charlot, S., Feltre, A., et al. 2022, arXiv e-prints, arXiv:2212.02522, doi: 10.48550/arXiv.2212.02522
- Hu et al. (2022) Hu, H., Inayoshi, K., Haiman, Z., et al. 2022, ApJ, 935, 140, doi: 10.3847/1538-4357/ac7daa
- Inayoshi et al. (2022a) Inayoshi, K., Nakatani, R., Toyouchi, D., et al. 2022a, ApJ, 927, 237, doi: 10.3847/1538-4357/ac4751
- Inayoshi et al. (2022b) Inayoshi, K., Onoue, M., Sugahara, Y., Inoue, A. K., & Ho, L. C. 2022b, ApJ, 931, L25, doi: 10.3847/2041-8213/ac6f01
- Inayoshi et al. (2020) Inayoshi, K., Visbal, E., & Haiman, Z. 2020, ARA&A, 58, 27, doi: 10.1146/annurev-astro-120419-014455
- Inoue (2011) Inoue, A. K. 2011, MNRAS, 415, 2920, doi: 10.1111/j.1365-2966.2011.18906.x
- Into & Portinari (2013) Into, T., & Portinari, L. 2013, MNRAS, 430, 2715, doi: 10.1093/mnras/stt071
- Izumi et al. (2019) Izumi, T., Onoue, M., Matsuoka, Y., et al. 2019, PASJ, 71, 111, doi: 10.1093/pasj/psz096
- Izumi et al. (2021) Izumi, T., Matsuoka, Y., Fujimoto, S., et al. 2021, ApJ, 914, 36, doi: 10.3847/1538-4357/abf6dc
- Jiang et al. (2016) Jiang, L., McGreer, I. D., Fan, X., et al. 2016, ApJ, 833, 222, doi: 10.3847/1538-4357/833/2/222
- Jiang et al. (2022) Jiang, L., Ning, Y., Fan, X., et al. 2022, Nature Astronomy, 6, 850, doi: 10.1038/s41550-022-01708-w
- Kaspi et al. (2000) Kaspi, S., Smith, P. S., Netzer, H., et al. 2000, ApJ, 533, 631, doi: 10.1086/308704
- Kato et al. (2020) Kato, N., Matsuoka, Y., Onoue, M., et al. 2020, PASJ, 72, 84, doi: 10.1093/pasj/psaa074
- Kauffmann et al. (2003) Kauffmann, G., Heckman, T. M., Tremonti, C., et al. 2003, MNRAS, 346, 1055, doi: 10.1111/j.1365-2966.2003.07154.x
- Kewley et al. (2013a) Kewley, L. J., Dopita, M. A., Leitherer, C., et al. 2013a, ApJ, 774, 100, doi: 10.1088/0004-637X/774/2/100
- Kewley et al. (2013b) Kewley, L. J., Maier, C., Yabe, K., et al. 2013b, ApJ, 774, L10, doi: 10.1088/2041-8205/774/1/L10
- Kewley et al. (2019) Kewley, L. J., Nicholls, D. C., Sutherland, R., et al. 2019, ApJ, 880, 16, doi: 10.3847/1538-4357/ab16ed
- Kim et al. (2015) Kim, D., Im, M., Glikman, E., Woo, J.-H., & Urrutia, T. 2015, ApJ, 812, 66, doi: 10.1088/0004-637X/812/1/66
- Kim & Im (2021) Kim, Y., & Im, M. 2021, ApJ, 910, L11, doi: 10.3847/2041-8213/abed58
- Kim et al. (2018) Kim, Y., Im, M., Jeon, Y., et al. 2018, ApJ, 855, 138, doi: 10.3847/1538-4357/aaadae
- Kim et al. (2020) —. 2020, ApJ, 904, 111, doi: 10.3847/1538-4357/abc0ea
- Kocevski et al. (2022) Kocevski, D. D., Barro, G., McGrath, E. J., et al. 2022, arXiv e-prints, arXiv:2208.14480. https://arxiv.org/abs/2208.14480
- Koekemoer et al. (2011) Koekemoer, A. M., Faber, S. M., Ferguson, H. C., et al. 2011, ApJS, 197, 36. https://arxiv.org/abs/1105.3754
- Kormendy & Ho (2013) Kormendy, J., & Ho, L. C. 2013, ARA&A, 51, 511, doi: 10.1146/annurev-astro-082708-101811
- Kroupa (2001) Kroupa, P. 2001, MNRAS, 322, 231, doi: 10.1046/j.1365-8711.2001.04022.x
- Labbe et al. (2022) Labbe, I., van Dokkum, P., Nelson, E., et al. 2022, arXiv e-prints, arXiv:2207.12446. https://arxiv.org/abs/2207.12446
- Leitherer et al. (1999) Leitherer, C., Schaerer, D., Goldader, J. D., et al. 1999, ApJS, 123, 3, doi: 10.1086/313233
- Li et al. (2022) Li, W., Inayoshi, K., Onoue, M., & Toyouchi, D. 2022, arXiv e-prints, arXiv:2210.02308. https://arxiv.org/abs/2210.02308
- Liu et al. (2018) Liu, D., Daddi, E., Dickinson, M., et al. 2018, ApJ, 853, 172, doi: 10.3847/1538-4357/aaa600
- Liu et al. (2019) Liu, H.-Y., Liu, W.-J., Dong, X.-B., et al. 2019, ApJS, 243, 21, doi: 10.3847/1538-4365/ab298b
- Liu et al. (2008) Liu, X., Shapley, A. E., Coil, A. L., Brinchmann, J., & Ma, C.-P. 2008, ApJ, 678, 758, doi: 10.1086/529030
- Magorrian et al. (1998) Magorrian, J., Tremaine, S., Richstone, D., et al. 1998, AJ, 115, 2285, doi: 10.1086/300353
- Matsuoka et al. (2016) Matsuoka, Y., Onoue, M., Kashikawa, N., et al. 2016, ApJ, 828, 26, doi: 10.3847/0004-637X/828/1/26
- Matsuoka et al. (2018) Matsuoka, Y., Strauss, M. A., Kashikawa, N., et al. 2018, ApJ, 869, 150, doi: 10.3847/1538-4357/aaee7a
- Matsuoka et al. (2019) Matsuoka, Y., Onoue, M., Kashikawa, N., et al. 2019, ApJ, 872, L2, doi: 10.3847/2041-8213/ab0216
- Matsuoka et al. (2022) Matsuoka, Y., Iwasawa, K., Onoue, M., et al. 2022, ApJS, 259, 18, doi: 10.3847/1538-4365/ac3d31
- Mazzucchelli et al. (2017) Mazzucchelli, C., Bañados, E., Venemans, B. P., et al. 2017, ApJ, 849, 91, doi: 10.3847/1538-4357/aa918510.48550/arXiv.1710.01251
- McConnell & Ma (2013) McConnell, N. J., & Ma, C.-P. 2013, ApJ, 764, 184, doi: 10.1088/0004-637X/764/2/184
- McGreer et al. (2018a) McGreer, I. D., Fan, X., Jiang, L., & Cai, Z. 2018a, AJ, 155, 131, doi: 10.3847/1538-3881/aaaab4
- McGreer et al. (2018b) —. 2018b, AJ, 155, 131, doi: 10.3847/1538-3881/aaaab4
- Mezcua et al. (2018) Mezcua, M., Civano, F., Marchesi, S., et al. 2018, MNRAS, 478, 2576, doi: 10.1093/mnras/sty1163
- Miller et al. (2015) Miller, B. P., Gallo, E., Greene, J. E., et al. 2015, ApJ, 799, 98, doi: 10.1088/0004-637X/799/1/98
- Molina et al. (2021) Molina, M., Reines, A. E., Latimer, L. J., Baldassare, V., & Salehirad, S. 2021, ApJ, 922, 155, doi: 10.3847/1538-4357/ac1ffa
- Momcheva et al. (2016) Momcheva, I. G., Brammer, G. B., van Dokkum, P. G., et al. 2016, ApJS, 225, 27, doi: 10.3847/0067-0049/225/2/27
- Nakajima & Maiolino (2022) Nakajima, K., & Maiolino, R. 2022, MNRAS, 513, 5134, doi: 10.1093/mnras/stac1242
- Nandra et al. (2015) Nandra, K., Laird, E. S., Aird, J. A., et al. 2015, ApJS, 220, 10, doi: 10.1088/0067-0049/220/1/10
- Neeleman et al. (2021) Neeleman, M., Novak, M., Venemans, B. P., et al. 2021, ApJ, 911, 141, doi: 10.3847/1538-4357/abe70f
- Nicholls et al. (2017) Nicholls, D. C., Sutherland, R. S., Dopita, M. A., Kewley, L. J., & Groves, B. A. 2017, MNRAS, 466, 4403, doi: 10.1093/mnras/stw3235
- Niida et al. (2020) Niida, M., Nagao, T., Ikeda, H., et al. 2020, ApJ, 904, 89, doi: 10.3847/1538-4357/abbe11
- Onoue et al. (2017) Onoue, M., Kashikawa, N., Willott, C. J., et al. 2017, ApJ, 847, L15, doi: 10.3847/2041-8213/aa8cc6
- Onoue et al. (2019) Onoue, M., Kashikawa, N., Matsuoka, Y., et al. 2019, ApJ, 880, 77, doi: 10.3847/1538-4357/ab29e9
- Onoue et al. (2023) Onoue, M., Inayoshi, K., Ding, X., et al. 2023, ApJ, 942, L17, doi: 10.3847/2041-8213/aca9d3
- Osterbrock (1989) Osterbrock, D. E. 1989, Astrophysics of gaseous nebulae and active galactic nuclei (University Science Books)
- Park et al. (2015) Park, D., Woo, J.-H., Bennert, V. N., et al. 2015, ApJ, 799, 164, doi: 10.1088/0004-637X/799/2/16410.48550/arXiv.1411.6334
- Pérez-González et al. (2022) Pérez-González, P. G., Barro, G., Annunziatella, M., et al. 2022, arXiv e-prints, arXiv:2211.00045, doi: 10.48550/arXiv.2211.00045
- Polletta et al. (2006) Polletta, M. d. C., Wilkes, B. J., Siana, B., et al. 2006, ApJ, 642, 673, doi: 10.1086/500821
- Reines et al. (2013) Reines, A. E., Greene, J. E., & Geha, M. 2013, ApJ, 775, 116, doi: 10.1088/0004-637X/775/2/116
- Reines & Volonteri (2015) Reines, A. E., & Volonteri, M. 2015, ApJ, 813, 82, doi: 10.1088/0004-637X/813/2/82
- Ricarte & Natarajan (2018) Ricarte, A., & Natarajan, P. 2018, MNRAS, 481, 3278, doi: 10.1093/mnras/sty2448
- Richards et al. (2006) Richards, G. T., Lacy, M., Storrie-Lombardi, L. J., et al. 2006, ApJS, 166, 470, doi: 10.1086/50652510.48550/arXiv.astro-ph/0601558
- Rigby et al. (2022) Rigby, J., Perrin, M., McElwain, M., et al. 2022, arXiv e-prints, arXiv:2207.05632. https://arxiv.org/abs/2207.05632
- Sanders et al. (2023) Sanders, R. L., Shapley, A. E., Jones, T., et al. 2023, ApJ, 942, 24, doi: 10.3847/1538-4357/aca46f
- Scoggins et al. (2023) Scoggins, M. T., Haiman, Z., & Wise, J. H. 2023, MNRAS, 519, 2155, doi: 10.1093/mnras/stac3715
- Shapley et al. (2005) Shapley, A. E., Coil, A. L., Ma, C.-P., & Bundy, K. 2005, ApJ, 635, 1006, doi: 10.1086/497630
- Shen et al. (2019) Shen, Y., Wu, J., Jiang, L., et al. 2019, ApJ, 873, 35, doi: 10.3847/1538-4357/ab03d9
- Shimasaku & Izumi (2019) Shimasaku, K., & Izumi, T. 2019, ApJ, 872, L29, doi: 10.3847/2041-8213/ab053f
- Somerville et al. (2008) Somerville, R. S., Hopkins, P. F., Cox, T. J., Robertson, B. E., & Hernquist, L. 2008, MNRAS, 391, 481, doi: 10.1111/j.1365-2966.2008.13805.x
- Storchi-Bergmann et al. (1998) Storchi-Bergmann, T., Schmitt, H. R., Calzetti, D., & Kinney, A. L. 1998, AJ, 115, 909, doi: 10.1086/300242
- Storey & Zeippen (2000) Storey, P. J., & Zeippen, C. J. 2000, MNRAS, 312, 813, doi: 10.1046/j.1365-8711.2000.03184.x
- Suh et al. (2020) Suh, H., Civano, F., Trakhtenbrot, B., et al. 2020, ApJ, 889, 32, doi: 10.3847/1538-4357/ab5f5f
- Sun et al. (2015) Sun, M., Trump, J. R., Brandt, W. N., et al. 2015, ApJ, 802, 14, doi: 10.1088/0004-637X/802/1/14
- Tanaka & Haiman (2009) Tanaka, T., & Haiman, Z. 2009, ApJ, 696, 1798, doi: 10.1088/0004-637X/696/2/1798
- Trakhtenbrot & Netzer (2010) Trakhtenbrot, B., & Netzer, H. 2010, MNRAS, 406, L35, doi: 10.1111/j.1745-3933.2010.00876.x10.48550/arXiv.1005.2408
- Trakhtenbrot et al. (2011) Trakhtenbrot, B., Netzer, H., Lira, P., & Shemmer, O. 2011, ApJ, 730, 7, doi: 10.1088/0004-637X/730/1/7
- Trump et al. (2015) Trump, J. R., Sun, M., Zeimann, G. R., et al. 2015, ApJ, 811, 26, doi: 10.1088/0004-637X/811/1/26
- Trump et al. (2022) Trump, J. R., Arrabal Haro, P., Simons, R. C., et al. 2022, arXiv e-prints, arXiv:2207.12388. https://arxiv.org/abs/2207.12388
- Valiante et al. (2016) Valiante, R., Schneider, R., Volonteri, M., & Omukai, K. 2016, MNRAS, 457, 3356, doi: 10.1093/mnras/stw225
- Vanden Berk et al. (2001) Vanden Berk, D. E., Richards, G. T., Bauer, A., et al. 2001, AJ, 122, 549, doi: 10.1086/321167
- Venemans et al. (2016) Venemans, B. P., Walter, F., Zschaechner, L., et al. 2016, ApJ, 816, 37, doi: 10.3847/0004-637X/816/1/37
- Volonteri (2010) Volonteri, M. 2010, A&A Rev., 18, 279, doi: 10.1007/s00159-010-0029-x
- Volonteri et al. (2021) Volonteri, M., Habouzit, M., & Colpi, M. 2021, Nature Reviews Physics, 3, 732, doi: 10.1038/s42254-021-00364-9
- Volonteri et al. (2008) Volonteri, M., Lodato, G., & Natarajan, P. 2008, MNRAS, 383, 1079, doi: 10.1111/j.1365-2966.2007.12589.x10.48550/arXiv.0709.0529
- Volonteri & Natarajan (2009) Volonteri, M., & Natarajan, P. 2009, MNRAS, 400, 1911, doi: 10.1111/j.1365-2966.2009.15577.x10.48550/arXiv.0903.2262
- Wang et al. (2021) Wang, F., Yang, J., Fan, X., et al. 2021, ApJ, 907, L1, doi: 10.3847/2041-8213/abd8c6
- Wang et al. (2013) Wang, R., Wagg, J., Carilli, C. L., et al. 2013, ApJ, 773, 44, doi: 10.1088/0004-637X/773/1/44
- Willott et al. (2017) Willott, C. J., Bergeron, J., & Omont, A. 2017, ApJ, 850, 108, doi: 10.3847/1538-4357/aa921b
- Willott et al. (2007) Willott, C. J., Delorme, P., Omont, A., et al. 2007, AJ, 134, 2435, doi: 10.1086/522962
- Willott et al. (2010a) Willott, C. J., Albert, L., Arzoumanian, D., et al. 2010a, AJ, 140, 546, doi: 10.1088/0004-6256/140/2/546
- Willott et al. (2010b) —. 2010b, AJ, 140, 546, doi: 10.1088/0004-6256/140/2/546
- York et al. (2000) York, D. G., Adelman, J., Anderson, John E., J., et al. 2000, AJ, 120, 1579, doi: 10.1086/301513
- Yung et al. (2021) Yung, L. Y. A., Somerville, R. S., Finkelstein, S. L., et al. 2021, MNRAS, 508, 2706, doi: 10.1093/mnras/stab2761
- Zakamska et al. (2005) Zakamska, N. L., Schmidt, G. D., Smith, P. S., et al. 2005, AJ, 129, 1212, doi: 10.1086/427543