The High-redshift Universe with Spitzer
Abstract
When did galaxies start forming stars? What is the role of distant galaxies in galaxy formation models and the epoch of reionization? What are the conditions in typical star-forming galaxies at ? Why is galaxy evolution dependent on environment? The Spitzer Space Telescope has been a crucial tool for addressing these questions. Accurate knowledge of stellar masses, ages, and star formation rates (SFRs) requires measuring rest-frame optical (and UV) light, which only Spitzer can probe at high-redshift for a sufficiently large sample of typical galaxies. Many of these science goals are the main science drivers for James Webb Space Telescope, and Spitzer afforded us their first exploration.
Department of Physics, University of California, Davis, CA 95616, USA
Very little was known about the high-redshift universe when the Spitzer Space Telescope [1] was being planned in the 90’s. The then optimistic science cases that were put forward were predicting Spitzer could observe ordinary galaxies at [2, Chapter 15]. Given that the highest-redshift galaxy discovered at that time was [3], this was quite an extraordinary claim. It was not until 1998 that the redshift five barrier was broken [4]. While spectroscopic searches with Lyman- were proposed in the 1960’s, and radio galaxies were discovered beyond in the late 1980’s [5, 6], it was the powerful new photometric method [7] to search for “Lyman Break Galaxies” (LBGs) that opened a new window for efficient discoveries of high-redshift galaxies. This meant that high redshift galaxies were being discovered in large numbers, in particular with Hubble Space Telescope (HST).
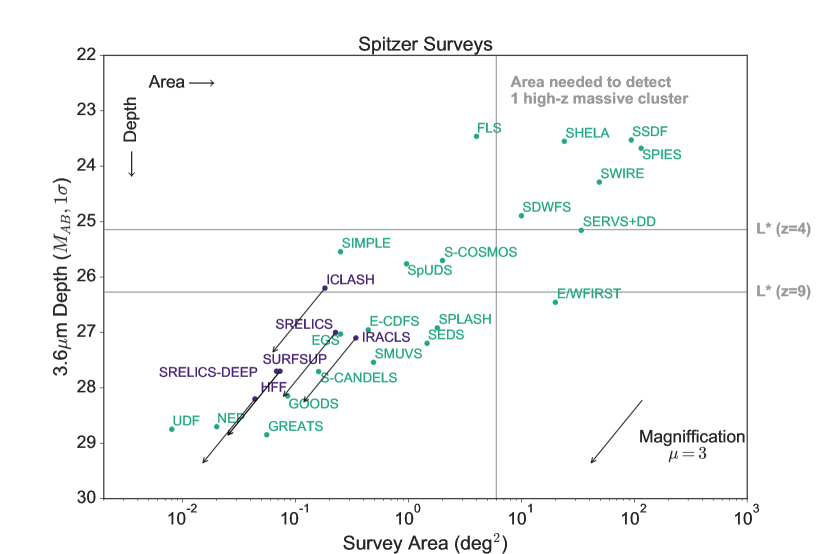
Spitzer, after its launch, soon followed these discoveries. While ordinary galaxies at (i.e., those with characteristic luminosities ) needed large time investment before they could be detected, there are now many surveys that are deep enough to observe those galaxies and study their properties (Fig. 1). Among the first studies of galaxies with Spitzer were observations with Spitzer’s Infrared Array Camera (IRAC, 8) of objects gravitationally lensed by foreground clusters. This allowed early detection of galaxies at [9] and [10]. This was only possible through the considerable magnification of these galaxies afforded by the presence of the massive cluster. Gravitational lensing resulted in a significant increase in depth and resolution, a feature that Spitzer has continued to benefit from ever since. Larger samples at were discovered concurrently by virtue of deep observations of the HUDF [11, 12]. The exposure time needed to reach the required depth was many hours and for the first time this was achieved with Spitzer Great Observatories Origins Deep Survey (GOODS, PI Dickinson) program for a large enough area.
The present landscape has changed considerably since early Spitzer observations. While HST is still the prime telescope to search for and identify the highest redshift galaxies, Spitzer has allowed us to study these galaxies in detail. For cosmic dawn sources (i.e., galaxies at ) Spitzer became a key telescope not only to help establish redshifts, but also in the study of stellar masses, star formation rates, optical emission line strengths, and the identification of old stellar populations.
For intermediate redshift sources ( in this review), Spitzer has also been crucial in robustly determining their stellar masses. In addition, although not discussed in detail here (but see Comment to Nature Astronomy by Daniela Calzetti), at observations with the Multiband Imaging Photometer for Spitzer (MIPS, 13) have been central to measurements of cosmic star formation history. Finally, Spitzer was not only succesful in finding high redshift galaxy clusters (), but also in studying the stellar properties of their cluster members. In this review, we give a brief overview of how Spitzer has provided measurements confirming our expectations, as well as of new puzzles that are changing the paradigm of galaxy formation at high redshifts.
1 Cosmic Dawn
Tracing star formation to the earliest times has been a long-standing goal of extragalactic astronomy. In particular, studying the onset of star formation is of importance not only for galaxy formation models, but also for studies of the early universe. The cosmic Dark Ages - when the Universe was filled with neutral hydrogen that was opaque to ultraviolet (UV) light - are thought to have ended around 500 million years after the Big Bang, when early light sources produced enough energetic photons to ionize the neutral hydrogen [14]. This phase is referred to as the epoch of reionization, and is also the era of the formation of the first galaxies. It is now clear that the process was completed by [15, 16, 17]. However, a direct link between early light sources and reionization requires a detailed understanding of when and how galaxies first formed and built up their stellar content.
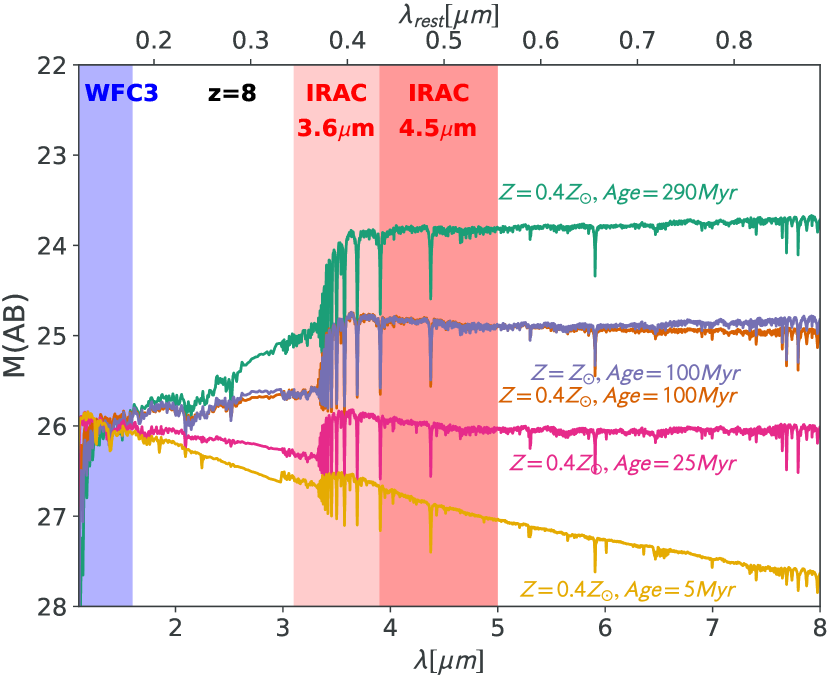
Spitzer played (and is continuing to do so with the archival data) a unique role in advancing our understanding of the formation and evolution of galaxies at . Deep observations at and with IRAC probe rest-frame optical properties of these galaxies, hence Spitzer data is critical for age (Fig. 2) and stellar mass determination at high-redshift. While observations with HST measure UV light emitted by young stars, Spitzer IRAC measures the rest-frame optical light from long-lived stars in galaxies. In addition, light from some of the most prominent rest-frame optical emission lines (e.g., [O iii]4959, 5007Å+H) enter Spitzer and bands at , allowing us to measure their contributions.
Deep observations with Spitzer were first undertaken in the HST deep fields. Of the most ambitious projects with Spitzer designed (in part) for the purposes of observing high-redshift () galaxies was the deep IRAC imaging of the HUDF field (IRAC Ultradeep Field IUDF program PI Labbé, 18). Many large Spitzer surveys followed, the deepest blank-field survey to date being GREATS [19], with a near-homogeneous observing depth of 200 hours over (see also Fig. 3). Results quickly revealed that the galaxies at these redshifts have different rest-frame optical properties from their lower-redshift counterparts.
From the very beginning Spitzer benefited greatly from the magnification due to gravitational lensing. While lensing decreases the effective area surveyed, it more than compensates by increasing the depth and resolution (Fig. 1). Many surveys have recently been executed with this in mind. Among the largest are the Cluster Lensing And Supernova survey with Hubble (CLASH; 20), Hubble Frontier Fields (HFF; 21), Reionization Lensing Cluster Survey (RELICS; 22). Many targets for these surveys have been selected from Massive Cluster Survey (MACS; 23, 24). Each of these surveys has its Spitzer counterpart with IRAC Lensing Survey (PI Egami), iCLASH (PI Bouwens, 25), SURFSUP (PI Bradač, 26), SHFF (PI Capak), SRELICS (PI Bradac, 27). These surveys have delivered many interesting results, especially at the lower end of the galaxy stellar mass function. For the largest among them, catalogs have been published as well and stellar properties investigated [28, 29, 30, 31, 32, 33]. Perhaps the highest-redshift galaxy so far detected by Spitzer to date is a lensed galaxy. In [34] the authors report a detection of MACS0647-JD galaxy candidate strongly lensed by a cluster. It is likely a massive and rapidly star-forming galaxy.
Already the first samples of galaxies that were detected in Spitzer/IRAC images (e.g., 35, 18, 36, 37) showed stellar masses in the range from to . Galaxies with stellar masses comparable to the Milky Way masses seemed surprisingly large for a universe younger than 1 Gyr old (e.g., 11). However, it quickly became clear that at least for some of these galaxies their masses have likely been overestimated, due to their IRAC fluxes being boosted by strong nebular emission lines like [O iii]4959, 5007Å+H (38, 39, 40, 41, 42, 43).
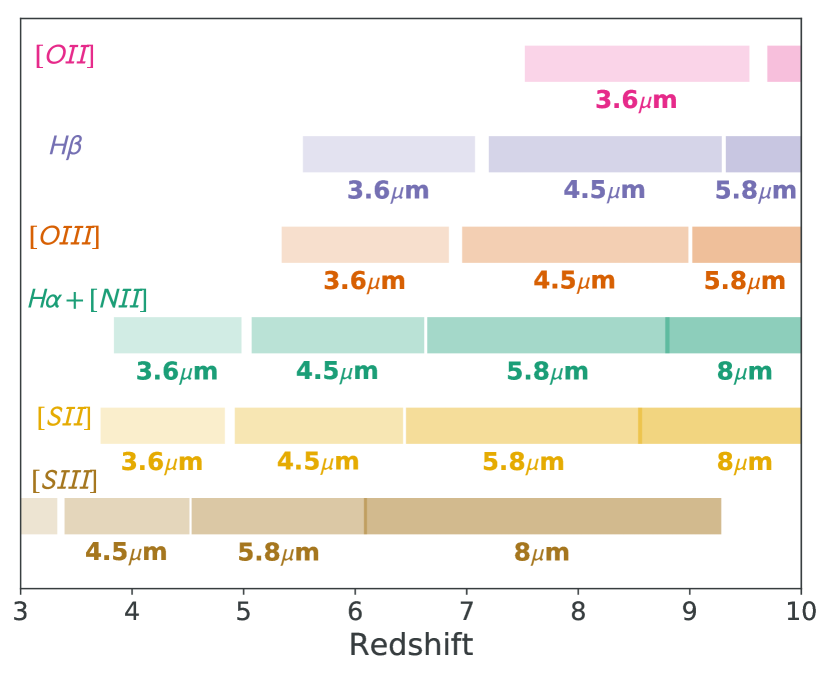
Spitzer broad-band photometry can provide indirect measurements of the nebular lines. For example, Spitzer/IRAC colors can be used to measure strengths of [O iii]+H lines for galaxies, for which these lines are expected to fall in the band while the band is relatively free of line contamination (Fig. 4; 44, 45, 41, 46). Similarly, [O iii]+H lines land in for galaxies at [47, 43, 27, 19, 48, 27], while the band remains relatively free of strong emission lines.
The results from these works show that we are now faced with a puzzle. Taken the Spitzer colors at face value, the line strengths required to fit the data for many of these galaxies is extremely high, with rest-frame equivalent widths . But there is also a degeneracy in these measurements, as the color can also be boosted by an older stellar population in the form of a Balmer break and/or dust [49]. Thus, rest-frame optical emission lines are likely not to be the sole cause of excess flux in the rest-frame optical bands. Unfortunately, spectroscopic observations of rest-frame optical emission lines of the highest redshift galaxies are out of reach for the current instruments. The sensitivity of the InfraRed Spectrograph (IRS) on Spitzer [50] was mostly limited to observations of IR luminous galaxies [51, 52], and we will have to wait for JWST to allow us to perform efficient spectroscopic follow-up in the rest-frame optical.
However, with Spitzer we are already able to study some exceptional cases where we can mitigate or break these degeneracies. In particular, when spectroscopic redshifts are known, we can break the degeneracy by considering particular redshift ranges where lines are shifted out of the filters and/or by adding external data. For example, one can, in principle, use Lyman- fluxes to estimate the nebular emission line contribution [42] or can constrain the amount of dust using measurements using ALMA [53, 54].
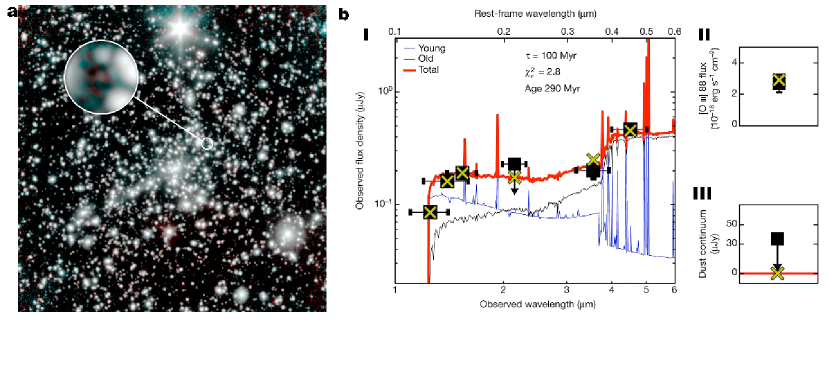
The best case where the degeneracy has been lifted is a galaxy MACS1149-JD behind the cluster MACS J1149.52223. MACS1149-JD was originally discovered in HST and shallow Spitzer data in [55]. It was later detected in both, and , Spitzer bands using deeper data (Fig. 5; 26, 46, 56) and its redshift was spectroscopically measured by [53]. For this galaxy the nebular emission lines are redshifted out of these Spitzer bands, yet it has a strong color excess. In addition, the cold dust content of the galaxy was constrained to be modest from observations taken with ALMA, making at least cold dust an unlikely cause of the red Spitzer color [53]. It is therefore highly likely the old () stellar population is causing the red rest-frame optical color (53, 57, 46). This is surprising, given the galaxies would need to start forming significant amounts of stars shortly after the Big Bang. At , when the Universe is only old, the presence of a strong Balmer break can thus provide the timing of the first star formation. In the case of MACS1149-JD the dominant stellar component formed about 250 million years after the Big Bang, corresponding to a redshift of about 15.
There are several other objects with Spitzer detections at where this experiment can be repeated. The highest spectroscopically confirmed galaxy detected by Spitzer (GN-z11, 58) does not show a red color. There are others that do, e.g. GN-z10-3 and GN-z9-1 [59] and Abell1763-1434 [27]. They all have excesses that are consistent with an evolved stellar population, but unfortunately they currently lack spectroscopic confirmations. If their redshifts are confirmed, it is likely that a re-analysis of these galaxies would indicate that their star formation occurred within of the Big Bang.
While the sample is still small, observations of galaxies at with Spitzer nonetheless show that galaxies have unexpected properties. A large fraction of high-redshift galaxies have either unusually strong nebular emission lines, pronounced Balmer breaks indicating old stellar populations, or the large amounts of dust. All three possibilities are difficult to reconcile given the age of the Universe. E.g., old stellar population in MACS1149-JD puts formation redshift of the majority of stellar population () at which is high given that simulations predict first stars only started forming at [60]. Other objects are routinely showing large rest-frame equivalent widths () of nebular emission lines, these have not been observed at lower redshifts except for in some extreme cases (e.g., 61, 62). IRAC color excess could also be explained by the presence of dust, but it is difficult to produce a significant amount of dust needed to explain the observations [49]. While more precise answers await the James Webb Space Telescope (JWST), it is clear even at present, the star formation models used in simulations at the highest redshift are being constrained as a result of observations by Spitzer.
2 Cosmic Morning
Studies of intermediate redshift () have also thrived thanks to Spitzer observations. One of the main diagnostics in galaxy evolution models is the evolution of the Star Formation Rate Density (SFRD, 63). However, robust determination of dust attenuation is essential to transform FUV luminosity densities into total SFRDs. Prior to Spitzer observations star formation history was determined out to using mostly HST data [64, 65, 66]. It was only after Spitzer data (along with Herschel) was obtained, that the history of cosmic star formation could be robustly measured, and the finding that the majority of star formation density comes from dust-obscured sources was established (63 and references therein). MIPS also played an important role in these discoveries at lower redshifts (e.g., [67, 68]).
The true power of Spitzer comes with robust measurements of stellar masses at these redshifts. The stellar-mass function measurements were first undertaken for SCANDELS, SCOSMOS, SPLASH, and UDF fields (e.g., 69, 70, 71, 72, 73, 74). But the largest of surveys to explore this are The Spitzer Matching Survey of the UltraVISTA Ultra-deep Stripes (SMUVS, PI Caputi, 75, 76) and Euclid/WFIRST Spitzer Legacy Survey (Moneti et al. in prep.). With SMUVS, a large fraction of galaxies () which were previously detected in the optical, were, for the first time, also detected with Spitzer. This allowed for a precise measurement of the stellar mass function. The latest results indicate that massive and intermediate-mass galaxies have different evolutionary paths in the early universe [77].
One of the key properties to describe galaxy growth is the ratio between star formation rate (SFR) and stellar mass (), also known as specific star formation rate (; 78, 63). This ratio depends heavily on good estimates of both stellar masses and SFR. In addition, sSFR is particularly well-determined in the lensing fields, as its value is independent of magnification, and yet gravitational lensing allows us to study sub- galaxies at high redshift [31]. Its evolution with redshift is one of the key questions in galaxy formation studies and we are still unclear as to exactly how sSFR evolves. While pioneering studies predicted a constant sSFR at high redshifts [79, 80], the later results, which included nebular emission lines in SED fitting [81] and better Spitzer data find an increase at and beyond (e.g., 82, 31, 73, 71, 83, 84, 85, 86, 87).
With Spitzer also SFR using H was investigated in detail for the first time at , which is regarded as one of the most reliable among the easily accessible nebular SFR tracers (e.g.,88). Just like with [O iii], at intermediate redshifts there are ranges where emission line strength of H can be measured with Spitzer (44, Fig. 4). One of the caveats is that H is blended with N ii. Still, this has been used to indirectly measure the H strength at and deduce the star formation rates [87, 73, 89, 90, 91, 92, 76]. More recently, in [93] authors measured burstiness of star formation by comparing ultra-violet, H luminosity, and H equivalent-width of main sequence galaxies, indicating that for at least half of their sample the star formation history is not smooth. Access to H also allows modelling of Lyman-continuum photon production efficiency . In [94] the authors used stacking of 300 galaxies to estimate H equivalent widths and found that is not strongly dependent on luminosity and is thus similar to the values derived for brighter galaxies. This has important implications, in particular for establishing that faint galaxies are able to produce the Lyman-continuum photons needed for cosmic reionization.
While Spitzer has improved our knowledge of stellar masses and SFRs considerably, several issues remain. In particular, the evolution of sSFR is still not a completely solved problem. The situation will likely improve soon with the data taken from Spitzer in the last year, as well as in the future with missions like JWST, Euclid and the Wide-field Infrared Survey Telescope (WFIRST).
3 Cosmic Dusk
The present epoch is one of a rapid decline in the global star formation rate, but clusters experience an evolution in star formation activity over this time that is even stronger than in the field. Identifying the processes that trigger and terminate star formation in cluster galaxies (e.g. ram-pressure stripping, starvation, merging, harassment; 95, 96), and contrasting them to those operating in the field is key to understanding the causes of the general decline. Furthermore, studying clusters at earlier times provides new constraints on both the evolution of the cluster abundance and the evolution of early-type galaxies over a substantial look-back time [97]. Spitzer plays a large role in identifying both high-redshift () clusters and protoclusters. Red-sequence overdensities and color searches can efficiently be done with Spitzer and have been utilized in both high-redshift cluster and protocluster searches. In particular, the inclusion of Spitzer data dramatically increases the accuracy/precision of photometric redshifts at , which is crucial for finding structures and to robustly estimate the environment (e.g., 98).
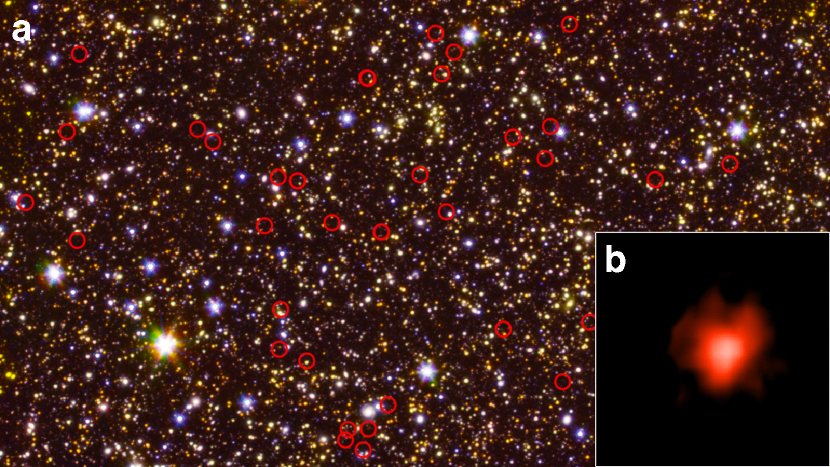
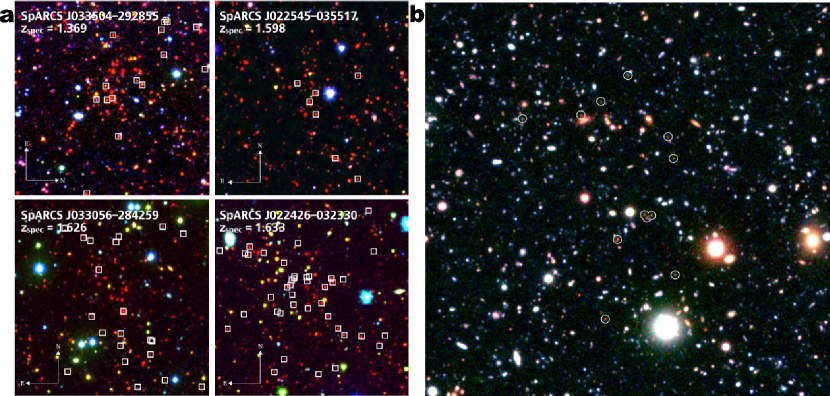
Early on, Spitzer helped in discoveries of the protoclusters. In [99] the authors present the discovery of a protocluster that dates back to after the Big Bang (Fig. 6). The field contains a luminous quasar as well as a large galaxy rich in molecular gas. The Clusters Around Radio-Loud AGN (CARLA) survey used this fact, as CARLA targeted radio-loud quasars with Spitzer at , discovering several proto-clusters surrounding them [100, 101]. Spitzer data is used to improve redshift information, as well as to estimate stellar masses, SFR and ages as these are the only bands available that probe the optical/NIR rest-frame for high-redshift protoclusters.
Spitzer played an even more prominent role in finding the highest redshift galaxy clusters. Shallow yet wide surveys, in particular the IRAC Shallow Survey, enabled detections of many high-redshift clusters (102, 103, 104). More discoveries were made in the Spitzer Wide-Area Infrared Extragalactic (SWIRE) Survey using a simple color excess in Spitzer bands [105]. The large area is needed as clusters of galaxies are extremely rare, and one requires such a survey to find the most massive examples (using numbers from [106] are needed to detect one high-redshift , massive cluster; Fig. 1).
The Spitzer Adaptation of the Red-sequence Cluster Survey (SPARCS; 107, 108; Fig. 6) was the first to perform a comprehensive study of galaxy clusters with all IRAC and MIPS bands. At , the 1.6 micron bump [109], due to infrared emission of stars, is shifted into Spitzer band, making it a useful tool to detect cluster members. Finally, surveys like IRAC Distant Cluster Survey [110], MaDCoWS (using WISE, but utilizing Spitzer for confirmation; 106) and Spitzer South Pole Telescope Deep Field [111, 112] have also detected many rich clusters at . Even more importantly, both IRAC and MIPS enabled the study the stellar properties of cluster members [113, 114]. The main conclusion from these surveys is that while low-redshift clusters are considered mostly star formation graveyards, at the earlier times (), galaxies in galaxy clusters were star forming and active [113]. This is thus the star-forming epoch of galaxy clusters, the study of which was enabled by Spitzer.
4 Thank You Spitzer
When Spitzer was first planned, nobody was expecting it to do the groundbreaking discoveries at the cosmic dawn. This was mostly due to the mirror size, yet the 85cm diameter mirror (only slightly larger than a wine-barrel) has surpassed a lot of predictions. It was meant to explore “the Old, the Cold, and the Dusty”, and yet it also explored the starry, the many, and the first. Spitzer let us study early star formation in the first galaxies at the epoch of reionization, it delivered new insights on star formation at high-redshift, and allowed us to find and study the earliest galaxy clusters and protoclusters. While the next space telescope (JWST) will revolutionize these fields in many ways, it will not surpass Spitzer in its ability to do survey science thanks to Spitzer’s combination of a large field of view, excellent sensitivity, and long life. So long Spitzer, and thanks for all the photons.
Based on observations made with the Spitzer Space Telescope, which is operated by the Jet Propulsion Laboratory, California Institute of Technology under a contract with NASA. Support for this work was provided by NASA through ADAP grant 80NSSC18K0945, NSF grant AST 1815458 and through an award issued by JPL/Caltech. The author would like to thank Brian Lemaux and Victoria Strait for their help with the manuscript.
The authors declare no competing financial interests.
Correspondence should be addressed to M.B.
References
- [1] Werner, M. W. et al. The Spitzer Space Telescope Mission. ApJS 154, 1–9 (2004). astro-ph/0406223.
- [2] Werner, M. & Eisenhardt, P. More Things in the Heavens: How Infrared Astronomy is Expanding our View of the Universe (Princeton University Press, 2019).
- [3] Schneider, D. P., Schmidt, M. & Gunn, J. E. PC 1158+4635: an Optically Selected Quasar with a Redshift of 4.73. AJ 98, 1951 (1989).
- [4] Dey, A., Spinrad, H., Stern, D., Graham, J. R. & Chaffee, F. H. A Galaxy at z=5.34. ApJ 498, L93 (1998). arXiv:astro-ph/9803137.
- [5] Lilly, S. J. Discovery of a Radio Galaxy at a Redshift of 3.395. ApJ 333, 161 (1988).
- [6] Chambers, K. C., Miley, G. K. & van Breugel, W. J. M. 4C 41.17: A Radio Galaxy at a Redshift of 3.8. ApJ 363, 21 (1990).
- [7] Steidel, C. C., Giavalisco, M., Pettini, M., Dickinson, M. & Adelberger, K. L. Spectroscopic Confirmation of a Population of Normal Star-forming Galaxies at Redshifts Z 3. ApJ 462, L17+ (1996). arXiv:astro-ph/9602024.
- [8] Fazio, G. G. et al. The Infrared Array Camera (IRAC) for the Spitzer Space Telescope. ApJS 154, 10–17 (2004). astro-ph/0405616.
- [9] Egami, E. et al. Spitzer and Hubble Space Telescope Constraints on the Physical Properties of the Galaxy Strongly Lensed by A2218. ApJ 618, L5–L8 (2005).
- [10] Chary, R.-R., Stern, D. & Eisenhardt, P. SpitzerConstraints on the z= 6.56 Galaxy Lensed by Abell 370. The Astrophysical Journal 635, L5–L8 (2005).
- [11] Yan, H. et al. Rest-Frame Ultraviolet-to-Optical Properties of Galaxies at z ~6 and z ~5 in the Hubble Ultra Deep Field: From Hubble to Spitzer. ApJ 634, 109–127 (2005). astro-ph/0507673.
- [12] Eyles, L. P. et al. Spitzer imaging of i’-drop galaxies: old stars at z 6. MNRAS 364, 443–454 (2005). astro-ph/0502385.
- [13] Rieke, G. H. et al. The Multiband Imaging Photometer for Spitzer (MIPS). ApJS 154, 25–29 (2004).
- [14] Planck Collaboration et al. Planck 2015 results. XIII. Cosmological parameters. A&A 594, A13 (2016). 1502.01589.
- [15] Fan, X., Carilli, C. L. & Keating, B. Observational Constraints on Cosmic Reionization. ARA&A 44, 415–462 (2006). astro-ph/0602375.
- [16] Robertson, B. E., Ellis, R. S., Furlanetto, S. R. & Dunlop, J. S. Cosmic Reionization and Early Star-forming Galaxies: A Joint Analysis of New Constraints from Planck and the Hubble Space Telescope. ApJ 802, L19 (2015). 1502.02024.
- [17] Mason, C. A. et al. Inferences on the timeline of reionization at z 8 from the KMOS Lens-Amplified Spectroscopic Survey. MNRAS 485, 3947–3969 (2019). 1901.11045.
- [18] Labbé, I. et al. Ultradeep Infrared Array Camera Observations of Sub-L* z 7 and z 8 Galaxies in the Hubble Ultra Deep Field: the Contribution of Low-Luminosity Galaxies to the Stellar Mass Density and Reionization. ApJ 708, L26–L31 (2010). 0910.0838.
- [19] Stefanon, M. et al. The Brightest z 8 Galaxies over the COSMOS UltraVISTA Field. ApJ 883, 99 (2019). 1902.10713.
- [20] Postman, M. et al. The Cluster Lensing and Supernova Survey with Hubble: An Overview. ApJS 199, 25 (2012). 1106.3328.
- [21] Lotz, J. M. et al. The Frontier Fields: Survey Design and Initial Results. ApJ 837, 97 (2017).
- [22] Coe, D. et al. RELICS: Reionization Lensing Cluster Survey. ApJ 884, 85 (2019). 1903.02002.
- [23] Ebeling, H. et al. A Complete Sample of 12 Very X-Ray Luminous Galaxy Clusters at . ApJ 661, L33–L36 (2007). arXiv:astro-ph/0703394.
- [24] Repp, A. & Ebeling, H. Science from a glimpse: Hubble SNAPshot observations of massive galaxy clusters. MNRAS 479, 844–864 (2018). 1706.01263.
- [25] Bouwens, R. J. et al. A Census of Star-forming Galaxies in the Universe based on HST+Spitzer Observations over 19 Clash Clusters: Three Candidate Galaxies and Improved Constraints on the Star Formation Rate Density at . ApJ 795, 126 (2014). 1211.2230.
- [26] Bradač, M. et al. Spitzer Ultra Faint SUrvey Program (SURFS UP). I. An Overview. ApJ 785, 108 (2014). 1402.2352.
- [27] Strait, V. et al. Stellar properties of z 8 galaxies in the reionization lensing cluster survey. The Astrophysical Journal 888, 124 (2020).
- [28] Merlin, E. et al. The ASTRODEEP Frontier Fields catalogues. I. Multiwavelength photometry of Abell-2744 and MACS-J0416. A&A 590, A30 (2016). 1603.02460.
- [29] Castellano, M. et al. The ASTRODEEP Frontier Fields catalogues. II. Photometric redshifts and rest frame properties in Abell-2744 and MACS-J0416. A&A 590, A31 (2016). 1603.02461.
- [30] Di Criscienzo, M. et al. The ASTRODEEP Frontier Fields catalogues. III. Multiwavelength photometry and rest-frame properties of MACS-J0717 and MACS-J1149. A&A 607, A30 (2017). 1706.03790.
- [31] Santini, P. et al. The Star Formation Main Sequence in the Hubble Space Telescope Frontier Fields. ApJ 847, 76 (2017). 1706.07059.
- [32] Shipley, H. V. et al. HFF-DeepSpace Photometric Catalogs of the 12 Hubble Frontier Fields, Clusters, and Parallels: Photometry, Photometric Redshifts, and Stellar Masses. ApJS 235, 14 (2018). 1801.09734.
- [33] Bradač, M. et al. Hubble Frontier Field photometric catalogues of Abell 370 and RXC J2248.7-4431: multiwavelength photometry, photometric redshifts, and stellar properties. MNRAS 489, 99–107 (2019). 1906.01725.
- [34] Lam, D. et al. Detection of a Lensed z11 Galaxy in the Rest-Optical with Spitzer/IRAC and the Inferred SFR, Stellar Mass, and Physical Size. arXiv e-prints arXiv:1903.08177 (2019). 1903.08177.
- [35] Yan, H. et al. The Stellar Masses and Star Formation Histories of Galaxies at : Constraints from Spitzer Observations in the Great Observatories Origins Deep Survey. The Astrophysical Journal 651, 24 (2006).
- [36] Capak, P. et al. Spectroscopy of Luminous Galaxy Candidates and Sources of Contamination in Galaxy Searches. ApJ 730, 68 (2011). 0910.0444.
- [37] Labbe, I. et al. The Spectral Energy Distributions of Galaxies from the IRAC Ultra Deep Fields: Emission Lines, Stellar Masses, and Specific Star Formation Rates at 650 Myr. ApJ 777, L19 (2013). 1209.3037.
- [38] Finkelstein, S. L. et al. A galaxy rapidly forming stars 700 million years after the Big Bang at redshift 7.51. Nature 502, 524–527 (2013).
- [39] Smit, R. et al. EVIDENCE FOR UBIQUITOUS HIGH-EQUIVALENT-WIDTH NEBULAR EMISSION IN GALAXIES: TOWARD A CLEAN MEASUREMENT OF THE SPECIFIC STAR-FORMATION RATE USING A SAMPLE OF BRIGHT, MAGNIFIED GALAXIES. The Astrophysical Journal 784, 58 (2014).
- [40] De Barros, S., Schaerer, D. & Stark, D. P. Properties of z 3–6 Lyman break galaxies. A&A 563, A81 (2014).
- [41] Roberts-Borsani, G. W. et al. z 7 Galaxies with Red Spitzer/IRAC [3.6]-[4.5] Colors in the Full CANDELS Data Set: The Brightest-Known Galaxies at z ~ 7-9 and a Probable Spectroscopic Confirmation at z = 7.48. ApJ 823, 143 (2016). 1506.00854.
- [42] Jiang, L. et al. Physical Properties of Spectroscopically Confirmed Galaxies at z 6. III. Stellar Populations from SED Modeling with Secure Ly Emission and Redshifts. ApJ 816, 16 (2016). 1511.01519.
- [43] De Barros, S. et al. The GREATS H + [O III] luminosity function and galaxy properties at : walking the way of JWST. MNRAS 489, 2355–2366 (2019). 1903.09649.
- [44] Shim, H. et al. H Emitters in the Great Observatories Origins Deep Survey: Tracing the Dominant Mode for Growth of Galaxies. ApJ 738, 69 (2011). 1103.4124.
- [45] Smit, R. et al. High-precision Photometric Redshifts from Spitzer/IRAC: Extreme [3.6] - [4.5] Colors Identify Galaxies in the Redshift Range . ApJ 801, 122 (2015). 1412.0663.
- [46] Huang, K.-H. et al. Detection of Lyman-alpha Emission from a Triply Imaged z = 6.85 Galaxy behind MACS J2129.40741. ApJ 823, L14 (2016). 1605.05771.
- [47] Laporte, N. et al. The first Frontier Fields cluster: 4.5 m excess in a galaxy candidate in Abell 2744. A&A 562, L8 (2014). 1401.8263.
- [48] Bridge, J. S. et al. The Super Eight Galaxies: Properties of a Sample of Very Bright Galaxies at . ApJ 882, 42 (2019). 1907.05512.
- [49] Katz, H., Laporte, N., Ellis, R. S., Devriendt, J. & Slyz, A. Probing cosmic dawn: modelling the assembly history, SEDs, and dust content of selected z 9 galaxies. MNRAS 484, 4054–4068 (2019). 1809.07210.
- [50] Houck, J. R. et al. The Infrared Spectrograph (IRS) on the Spitzer Space Telescope. ApJS 154, 18–24 (2004). astro-ph/0406167.
- [51] Teplitz, H. I. et al. Measuring PAH Emission in Ultradeep Spitzer IRS Spectroscopy of High-Redshift IR-Luminous Galaxies. ApJ 659, 941–949 (2007). astro-ph/0701409.
- [52] Pope, A. et al. Mid-Infrared Spectral Diagnosis of Submillimeter Galaxies. ApJ 675, 1171–1193 (2008). 0711.1553.
- [53] Hashimoto, T. et al. The onset of star formation 250 million years after the Big Bang. Nature 557, 392–395 (2018). 1805.05966.
- [54] Laporte, N. et al. Dust in the Reionization Era: ALMA Observations of a z = 8.38 Gravitationally Lensed Galaxy. ApJ 837, L21 (2017). 1703.02039.
- [55] Zheng, W. et al. A magnified young galaxy from about 500 million years after the Big Bang. Nature 489, 406–408 (2012). 1204.2305.
- [56] Zheng, W. et al. Young Galaxy Candidates in the Hubble Frontier Fields. IV. MACS J1149.5+2223. ApJ 836, 210 (2017). 1701.08484.
- [57] Hoag, A. et al. Spectroscopic confirmation of an ultra-faint galaxy at the epoch of reionization. Nature Astronomy 1, 0091 (2017). 1704.02970.
- [58] Oesch, P. A. et al. A Remarkably Luminous Galaxy at z=11.1 Measured with Hubble Space Telescope Grism Spectroscopy. ApJ 819, 129 (2016). 1603.00461.
- [59] Oesch, P. A. et al. The Most Luminous z ~9-10 Galaxy Candidates Yet Found: The Luminosity Function, Cosmic Star-formation Rate, and the First Mass Density Estimate at 500 Myr. ApJ 786, 108 (2014). 1309.2280.
- [60] Dayal, P. & Ferrara, A. Early galaxy formation and its large-scale effects. Phys. Rep. 780, 1–64 (2018). 1809.09136.
- [61] Du, X. et al. Searching for Analogs Near the Peak of Cosmic Star Formation. ApJ 890, 65 (2020). 1910.11877.
- [62] Li, Z. & Malkan, M. A. Extreme [O III] Emitters at . ApJ 860, 83 (2018). 1804.11309.
- [63] Madau, P. & Dickinson, M. Cosmic Star-Formation History. ARA&A 52, 415–486 (2014). 1403.0007.
- [64] Madau, P. et al. High-redshift galaxies in the Hubble Deep Field: colour selection and star formation history to z~4. MNRAS 283, 1388–1404 (1996). astro-ph/9607172.
- [65] Madau, P., Pozzetti, L. & Dickinson, M. The Star Formation History of Field Galaxies. ApJ 498, 106–116 (1998). astro-ph/9708220.
- [66] Lilly, S. J., Le Fevre, O., Hammer, F. & Crampton, D. The Canada-France Redshift Survey: The Luminosity Density and Star Formation History of the Universe to Z approximately 1. ApJ 460, L1 (1996). astro-ph/9601050.
- [67] Le Floc’h, E. et al. Infrared Luminosity Functions from the Chandra Deep Field-South: The Spitzer View on the History of Dusty Star Formation at . ApJ 632, 169–190 (2005). astro-ph/0506462.
- [68] Magnelli, B. et al. Evolution of the dusty infrared luminosity function from z = 0 to z = 2.3 using observations from Spitzer. A&A 528, A35 (2011). 1101.2467.
- [69] Davidzon, I. et al. The COSMOS2015 galaxy stellar mass function . Thirteen billion years of stellar mass assembly in ten snapshots. A&A 605, A70 (2017). 1701.02734.
- [70] Song, M. et al. The Evolution of the Galaxy Stellar Mass Function at z = 4-8: A Steepening Low-mass-end Slope with Increasing Redshift. ApJ 825, 5 (2016). 1507.05636.
- [71] Grazian, A. et al. The galaxy stellar mass function at 3.5 z 7.5 in the CANDELS/UDS, GOODS-South, and HUDF fields. A&A 575, A96 (2015). 1412.0532.
- [72] Caputi, K. I. et al. Spitzer Bright, UltraVISTA Faint Sources in COSMOS: The Contribution to the Overall Population of Massive Galaxies at z = 3-7. ApJ 810, 73 (2015). 1505.05721.
- [73] Salmon, B. et al. The Relation between Star Formation Rate and Stellar Mass for Galaxies at in CANDELS. ApJ 799, 183 (2015). 1407.6012.
- [74] Steinhardt, C. L. et al. Star Formation at from the Spitzer Large Area Survey with Hyper-Suprime-Cam (SPLASH). ApJ 791, L25 (2014). 1407.7030.
- [75] Ashby, M. L. N. et al. Spitzer Matching Survey of the UltraVISTA Ultra-deep Stripes (SMUVS): Full-mission IRAC Mosaics and Catalogs. ApJS 237, 39 (2018). 1801.02660.
- [76] Caputi, K. I. et al. Star Formation in Galaxies at z 4-5 from the SMUVS Survey: A Clear Starburst/Main-sequence Bimodality for H Emitters on the SFR-M* Plane. ApJ 849, 45 (2017). 1705.06179.
- [77] Deshmukh, S. et al. The Spitzer Matching Survey of the UltraVISTA Ultra-deep Stripes (SMUVS): The Evolution of Dusty and Nondusty Galaxies with Stellar Mass at z = 2-6. ApJ 864, 166 (2018). 1712.03905.
- [78] Guzmán, R. et al. The Nature of Compact Galaxies in the Hubble Deep Field. II. Spectroscopic Properties and Implications for the Evolution of the Star Formation Rate Density of the Universe1,. ApJ 489, 559–572 (1997). astro-ph/9704001.
- [79] Stark, D. P. et al. The Evolutionary History of Lyman Break Galaxies Between Redshift 4 and 6: Observing Successive Generations of Massive Galaxies in Formation. ApJ 697, 1493–1511 (2009). 0902.2907.
- [80] Gonzalez, A. H., Papovich, C., Bradač, M. & Jones, C. Spectroscopic Confirmation of a z = 2.79 Multiply Imaged Luminous Infrared Galaxy Behind the Bullet Cluster. ApJ 720, 245–251 (2010).
- [81] Schaerer, D. & de Barros, S. The impact of nebular emission on the ages of galaxies. A&A 502, 423–426 (2009). 0905.0866.
- [82] Davidzon, I., Ilbert, O., Faisst, A. L., Sparre, M. & Capak, P. L. An Alternate Approach to Measure Specific Star Formation Rates at . ApJ 852, 107 (2018). 1712.03959.
- [83] Tasca, L. A. M. et al. Evidence for major mergers of galaxies at in the VVDS and VUDS surveys. A&A 565, A10 (2014). 1303.4400.
- [84] de Barros, S., Schaerer, D. & Stark, D. P. Properties of Lyman break galaxies. II. Impact of nebular emission at high redshift. A&A 563, A81 (2014). 1207.3663.
- [85] Duncan, K. et al. The mass evolution of the first galaxies: stellar mass functions and star formation rates at 4 z 7 in the CANDELS GOODS-South field. MNRAS 444, 2960–2984 (2014). 1408.2527.
- [86] González, V. et al. Slow Evolution of the Specific Star Formation Rate at z 2: The Impact of Dust, Emission Lines, and a Rising Star Formation History. ApJ 781, 34 (2014). 1208.4362.
- [87] Stark, D. P. et al. Keck Spectroscopy of Faint Lyman Break Galaxies: The Importance of Nebular Emission in Understanding the Specific Star Formation Rate and Stellar Mass Density. ApJ 763, 129 (2013). 1208.3529.
- [88] Moustakas, J., Kennicutt, R. C., Jr. & Tremonti, C. A. Optical Star Formation Rate Indicators. ApJ 642, 775–796 (2006). astro-ph/0511730.
- [89] Smit, R. et al. Evidence for Ubiquitous High-equivalent-width Nebular Emission in Galaxies: Toward a Clean Measurement of the Specific Star-formation Rate Using a Sample of Bright, Magnified Galaxies. ApJ 784, 58 (2014). 1307.5847.
- [90] Bouwens, R. J. et al. The Lyman-Continuum Photon Production Efficiency ion of Galaxies from IRAC-based H Measurements: Implications for the Escape Fraction and Cosmic Reionization. ApJ 831, 176 (2016). 1511.08504.
- [91] Mármol-Queraltó, E. et al. The evolution of the equivalent width of the H emission line and specific star formation rate in star-forming galaxies at 1 < z < 5. MNRAS 460, 3587–3597 (2016). 1511.01911.
- [92] Faisst, A. L. et al. A Coherent Study of Emission Lines from Broadband Photometry: Specific Star Formation Rates and [O iii]/H Ratio at . ApJ 821, 122 (2016). 1601.07173.
- [93] Faisst, A. L., Capak, P. L., Emami, N., Tacchella, S. & Larson, K. L. The Recent Burstiness of Star Formation in Galaxies at from H Measurements. ApJ 884, 133 (2019). 1909.03076.
- [94] Lam, D. et al. The mean H EW and Lyman-continuum photon production efficiency for faint z 4-5 galaxies. A&A 627, A164 (2019). 1902.02786.
- [95] Dressler, A. et al. A Spectroscopic Catalog of 10 Distant Rich Clusters of Galaxies. ApJS 122, 51–80 (1999). arXiv:astro-ph/9901263.
- [96] Poggianti, B. M. et al. The Star Formation Histories of Galaxies in Distant Clusters. ApJ 518, 576–593 (1999). astro-ph/9901264.
- [97] Rosati, P., Borgani, S. & Norman, C. The Evolution of X-ray Clusters of Galaxies. ARA&A 40, 539 (2002).
- [98] Lemaux, B. C. et al. The VIMOS Ultra-Deep Survey: Emerging from the dark, a massive proto-cluster at z 4.57. A&A 615, A77 (2018). 1703.10170.
- [99] Capak, P. L. et al. A massive protocluster of galaxies at a redshift of z~5.3. Nature 470, 233–235 (2011). 1101.3586.
- [100] Galametz, A. et al. The Mid-infrared Environments of High-redshift Radio Galaxies. ApJ 749, 169 (2012). 1202.4489.
- [101] Noirot, G. et al. HST Grism Confirmation of 16 Structures at from the Clusters Around Radio-Loud AGN (CARLA) Survey. ApJ 859, 38 (2018). 1804.01500.
- [102] Stanford, S. A. et al. An IR-selected Galaxy Cluster at z = 1.41. ApJ 634, L129–L132 (2005). astro-ph/0510655.
- [103] Stanford, S. A. et al. The XMM Cluster Survey: A Massive Galaxy Cluster at z = 1.45. ApJ 646, L13–L16 (2006). astro-ph/0606075.
- [104] Eisenhardt, P. R. M. et al. Clusters of Galaxies in the First Half of the Universe from the IRAC Shallow Survey. ApJ 684, 905–932 (2008). 0804.4798.
- [105] Papovich, C. et al. A Spitzer-selected Galaxy Cluster at z = 1.62. ApJ 716, 1503–1513 (2010). 1002.3158.
- [106] Gonzalez, A. H. et al. The Massive and Distant Clusters of WISE Survey. I. Survey Overview and a Catalog of Galaxy Clusters at . ApJS 240, 33 (2019). 1809.06820.
- [107] Wilson, G. et al. Spectroscopic Confirmation of a Massive Red-Sequence-Selected Galaxy Cluster at z = 1.34 in the SpARCS-South Cluster Survey. ApJ 698, 1943–1950 (2009). 0810.0036.
- [108] Muzzin, A. et al. Spectroscopic Confirmation of Two Massive Red-Sequence-Selected Galaxy Clusters at in the SpARCS-North Cluster Survey. ApJ 698, 1934–1942 (2009). 0810.0005.
- [109] Sawicki, M. The 1.6 Micron Bump as a Photometric Redshift Indicator. AJ 124, 3050–3060 (2002). astro-ph/0209437.
- [110] Stanford, S. A. et al. IDCS J1426.5+3508: Discovery of a Massive, Infrared-selected Galaxy Cluster at z = 1.75. ApJ 753, 164 (2012). 1205.3786.
- [111] Rettura, A. et al. Candidate Clusters of Galaxies at Identified in the Spitzer South Pole Telescope Deep Field Survey. ApJ 797, 109 (2014). 1404.0023.
- [112] Ashby, M. L. N. et al. SEDS: The Spitzer Extended Deep Survey. Survey Design, Photometry, and Deep IRAC Source Counts. ApJ 769, 80 (2013).
- [113] Brodwin, M. et al. The Era of Star Formation in Galaxy Clusters. ApJ 779, 138 (2013). 1310.6039.
- [114] Nantais, J. B. et al. Stellar mass function of cluster galaxies at : evidence for reduced quenching efficiency at high redshift. A&A 592, A161 (2016). 1606.07832.
- [115] Bruzual, G. & Charlot, S. Stellar population synthesis at the resolution of 2003. MNRAS 344, 1000–1028 (2003). arXiv:astro-ph/0309134.