11email: lidia.tasca@oamp.fr 22institutetext: Centro de Estudios de Física del Cosmos de Aragón, Plaza San Juan 1, planta 2, 44001 Teruel, Spain 33institutetext: INAF–IASF Milano, Milano, Italy 44institutetext: INAF Osservatorio Astronomico di Bologna, via Ranzani 1, I-40127, Bologna, Italy 55institutetext: Institut de Recherche en Astrophysique et Planetologie, CNRS, 14, avenue Edouard Belin, F–31400 Toulouse, France 66institutetext: IRAP, Universite de Toulouse, UPS–OMP, Toulouse, France 77institutetext: INAF - Osservatorio Astronomico di Roma Via Frascati 33 00040 Monteporzio (RM) 88institutetext: University of Massachussetts 99institutetext: LASTRO, Ecole polytechnique fédérale de Lausanne, Suisse 1010institutetext: Max–Planck–Institut fur extraterrestrische Physik, Giessenbachstrasse, D–85748 Garching bei Munchen, Germany 1111institutetext: Research Center for Space and Cosmic Evolution, Ehime University, Bunkyo–cho, Matsuyama 790–8577, Japan 1212institutetext: INAF–IASF Bologna, Via P. Gobetti 101, I–40129 Bologna, Italy
The role of major mergers in shaping galaxies at in the VUDS and VVDS surveys
Abstract
Context. The mass assembly of galaxies can proceed through different physical processes. Here we report on the spectroscopic identification of close physical pairs of galaxies at redshifts and discuss the impact of major mergers in shaping galaxies at these early cosmological times.
Aims. We aim to identify and characterize close physical pairs of galaxies destined to merge and use their properties to infer the contribution of merging processes to the early mass assembly of galaxies.
Methods. We search for galaxy pairs with a transverse separation h-1kpc and a velocity difference km s-1 using the VIMOS VLT Deep Survey (VVDS) and early data from the VIMOS Ultra Deep Survey (VUDS) that comprise a sample of galaxies with spectroscopic redshifts measurements at redshifts in the COSMOS, ECDFS, and VVDS–02h fields. We analyse their spectra and associated visible and near–infrared photometry to assess the main properties of merging galaxies that have an average stellar mass M☉ at these redshifts.
Results. Using the 12 physical pairs found in our sample we obtain a first estimate of the merger fraction at these rdshifts, %. The pair separations indicate that these pairs will merge within 1 Gyr, on average, with each producing a more massive galaxy by the time the cosmic star formation peaks at . From the average mass ratio between galaxies in the pairs, the stellar mass of the resulting galaxy after merging will be larger than the most massive galaxy in the pair before merging. We conclude that major merging of galaxy pairs is on–going at and significantly contributing to the major assembly phase of galaxies at this early epoch.
Key Words.:
Galaxies: evolution – Galaxies: formation – Galaxies: high redshift – Galaxies: mergers1 Introduction
The contribution of different physical processes to galaxy mass assembly along cosmic time is still unknown, and a clear picture describing how galaxies assemble, supported by observational evidence, has yet to emerge. Looking back at the average history of a galaxy observed today, we are yet unable to identify how its stellar mass has been acquired and which physical processes are possible contributors.
The mass build–up of galaxies is expected to proceed through a relatively small number of processes (for a summary, see e.g. Springel et al. 2005a; Silk & Mamon, 2012). New stars can form from the gas reservoir of a galaxy, either acquired at birth or replenished from a more continuous accretion process along the galaxy lifespan since formation. Major and minor merging between galaxies is identified in numerous spectacular examples in the local universe (e.g. in the RNGC catalogue, Sulentic & Tifft, 1973; Barnes and Hernquist, 1992). Merging is efficient at assembling mass, as it produces a significant increase in mass of up to a factor of two for equal mass mergers, for each merging event. Other processes are expected to modulate the total mass gains. AGN and SNe feedback have been proposed as mechanisms capable of quenching star formation, as well as supporting winds capable at driving some mass fraction into the inter–galactic medium (IGM), hence reducing the increase in stellar mass from in–situ star formation (Silk, 1997; Murray et al. 2005; Cattaneo et al. 2009). The environment of galaxies is also expected to impact mass growth, with interactions between galaxies and the dense intra–cluster medium, like harassment or stripping, rapidly removing a significant part of the gas content of a galaxy (e.g. Moore et al. 1996). These processes are expected to ultimately combine along cosmic time to produce the mass distribution observed in the well–defined Hubble sequence of galaxy types in the nearby universe.
In recent years, cold gas accretion fuelling star formation has received a focused attention, following numerical simulations (Kereš et al. 2005). In this picture, cold gas flows along the filaments of the cosmic web into the main body of a galaxy to support vigorous star formation. This mechanism has been proposed as the main mode of galaxy assembly (Dekel et al. 2009), and is often cited in the recent literature as the preferred scenario for galaxy assembly (e.g. Kereš et al. 2009; Dijstra & Loeb, 2009; Bouché et al. 2010; di Matteo et al. 2012). However, as of today, only limited and indirect observational evidence exist in support of this picture (Cresci et al. 2010; Kacprzak et al. 2012), while detailed observational investigations have failed to identify direct supporting evidence (Steidel et al. 2010), which demonstrates the difficulty in directly identifying the accretion process at work.
The merging of galaxies is another key process that contributes to galaxy assembly. The hierarchical growth of dark matter halos is a key prediction of the model for galaxy formation (Davis et al. 1985; Springel et al. 2005b; Hopkins et al. 2006). In this picture, the merging of dark matter (DM) halos would not only lead to an increase of the DM halo masses, but also naturally lead to the merging of the galaxies associated with each of the halos (Kauffmann, White & Guiderdoni 1993). While galaxy assembly seems to produce the more massive galaxies early in a seemingly anti–hierarchical downsizing pattern (De Lucia et al. 2006), it is nonetheless expected that merging of galaxies would continue to occur as DM halos continue to merge along cosmic time. As the dynamical time–scale for halos to merge is of the order of 0.5–1 Gyr (Kitzbichler & White 2008; Lotz et al. 2010), it is expected that a massive halo today, as identified in DM halo merger trees from numerical N–body simulations, will have experienced several mergers since its formation. Documenting merging activity at different epochs can therefore shed light on the contribution of this process in assembling mass in galaxies.
Evidence for merging is direct and well documented. Mergers have been identified since early days of photographic galaxy atlases and classified alongside the Hubble sequence of morphological types (e.g. the RC3 catalogue, de Vaucouleurs et al. 1991). The merging process of two disc galaxies has been proposed as one of the mechanism for producing early–type bulge–dominated galaxies, supported from simulations (e.g. Mihos & Hernquist 1996; Bournaud et al. 2005). Although this picture may be too simplistic (Bournaud et al. 2011), it is, however, clear that mergers do occur in the low redshift universe and that major mergers may lead to large modifications of the physical properties of the galaxies involved. Mergers are identified either aposteriori morphologically from wisps, tails, or irregular shapes produced by on–going or post–merger dynamics, or apriori from the identification of pairs of physically bound galaxies destined to coalesce. Going to high redshifts, using pairs in early merging stages, rather than post–merger remnants, remains the most robust way to derive a merger fraction (e.g. Le Fèvre et al. 2000). This is because major merging pairs are easier to identify at these redshifts than the post–merger morphological signatures, which are of low surface brightness and may escape detection. The pair fraction can be transformed into a merger rate per volume or per galaxy (Patton et al. 2000; Kitzbichler & White 2008; Lin et al. 2008; de Ravel et al. 2009; Lopez–Sanjuan et al. 2011; Lopez–Sanjuan et al. 2013), using the dynamical time–scale for a pair of galaxies with a given mass ratio and projected physical separation (Kitzbichler and White 2008; Lotz et al. 2010). The integrated merging rate over the lifespan of a galaxy since formation would then give the total amount of stellar mass assembled from the merger process. The secure identification of pairs and pair fractions at different redshifts is therefore an important observational measurement to perform. Spectroscopic redshift measurements of both members of the pair are required to eliminate the risk of background or foreground contamination along the line of sight and confirm that the pair is physically bound.
At pairs have been observed from deep galaxy spectroscopic surveys (e.g. Lin et al. 2008; de Ravel et al. 2009). From the VIMOS VLT Deep Survey (VVDS), de Ravel et al. (2009) found that the merger fraction is higher by a factor at than in the local Universe and further showed that the merger rate and its evolution depends significantly on the stellar mass (luminosity) of the galaxy population. At redshifts beyond only a few direct identifications of pairs and measurements of the merger fraction and merger rate exist. Lopez–Sanjuan et al. (2013) have reported a high pair fraction of % at from 3D spectroscopy measurements in MASSIV (Mass Assembly Survey with Sinfoni in VVDS, Contini et al. 2012). At higher redshifts Conselice et al. (2003) have used the CAS (concentration, asymmetry clumpiness) methodology, which relyies on image shapes and the expected signature of on–going or past mergers, to perform a measurement of the merger fraction up to . Cooke et al. (2010) have provided spectroscopic identification of 5 pairs of galaxies in their LBG sample at , claiming that merging is triggering a significant part of the Ly emission. The number of confirmed pairs is therefore small beyond , and larger samples have to be assembled to enable measurements of the pair fraction and merger rate which is accurate to a few percent.
Here we present a sample of galaxy pairs identified at in the VUDS (VIMOS Ultra Deep Survey) and VVDS. The VUDS is an on–going survey (Le Fèvre et al. 2013b, in prep.) with ultra–deep spectroscopy obtained with VIMOS on the VLT targeting galaxies with in three well studied fields: the COSMOS, ECDFS and VVDS–02h (XMM–LSS/CFHTLS–D1). The VVDS has been extensively discussed elsewhere (Le Fèvre et al. 2005). We are using the “Final Data Release” of this survey as described in Le Fèvre et al. (2013a, in prep.). These spectroscopic redshift survey samples are searched to identify a sample of real physical pairs with redshifts , based on the observed projected separation and velocity difference v. We discuss the derived pair properties using all available spectroscopy as well as visible and near–IR imaging and photometric data. The VUDS and VVDS spectroscopic redshift surveys are described in Section 2, and the methodology to identify pairs and confirm that they are at close physical separation rather than a random projection along the line of sight is presented in Section 3. We then examine the pair properties in Section 4. We discuss the first detection of a significant number of major merging pairs at and conclude in Section 5.
Throughout this work, we adopt the “convergence cosmology” , , and . All magnitudes are given in the AB system.
2 Spectroscopic observations
To look for pairs, we have explored the VUDS, VVDS–Deep, and VVDS–UltraDeep surveys, providing a sample of galaxies with spectroscopic redshifts measured with VIMOS on the ESO–VLT (Le Fèvre et al. 2003). The VIMOS spectra have been obtained with 4.5h of integration for the VVDS–Deep survey, covering Å, and 16h and 14h integrations in each of the LRBLUE and LRRED grism settings for the VVDS-UltraDeep and VUDS surveys respectively, covering a combined wavelength range Å. The redshift accuracy with this setup is (Le Fèvre et al. 2013a).
The VVDS–deep (Le Fèvre et al. 2005; Le Fèvre et al. 2013a) and VVDS–UltraDeep (Le Fèvre et al. 2013a) surveys are based on –band magnitude selection with and , respectively. These two VVDS surveys are located in the VVDS–02h field centred at and .
The VUDS is an on–going spectroscopic survey also using VIMOS, targeting galaxies in 3 fields: COSMOS, ECDFS and VVDS–02h. The baseline target selection for spectroscopy is using photometric–redshifts measured using all the photometry available in the survey fields using the Le Phare code (Ilbert et al. 2006). The photometric redshift accuracy obtained from the multi–wavelength data and calibrated on existing spectroscopic redshifts is for magnitudes in the COSMOS field (see e.g. Ilbert et al. 2013). There is a slight degradation by a factor on the photometric redshift accuracy in the other two fields because of the lesser number of photometric bands observed. In addition, we supplemented the selection by several color–selection criteria, adding those galaxies likely to be in this redshift range, but not selected from the primary selection. Allowing for errors in , this selection provides a sample with , as described in Le Fèvre et al. (2013b, in preparation).
All VIMOS data have been processed with the VIPGI package (Scodeggio et al. 2005). Following automated measurements, each galaxy has been examined visually and independently by two persons, each assigning a spectroscopic redshift. These measurements have been compared before assigning the final redshift measurement. A reliability flag has been assigned to each redshift measurement representing the probability for the redshift to be right. As consistently shown from the VVDS (Le Fèvre et al. 2005), zCOSMOS (Lilly et al. 2007), and VIPERS (Guzzo et al. 2013) surveys, the reliability of flags reflect the statistical process of redshift assignment between independant observers and does not depend on the survey type or its intrinsic quality, with flags 1, 2, 3, 4 and 9 having a probability to be right of , respectively (flags 1x with x=1, 2, 3, 4, 9 indicate a broad line AGN; flag 2x are objects falling serendipitously in a slit next to a main target; and both have probability distributions similar to the main flag categories).
In addition to the VIMOS spectroscopic data, a large set of imaging data is available in the three fields covered by our pair search. The COSMOS field (Scoville et al. 2007) has a full coverage with the HST/ACS F814W filter (Koekemoer et al. 2007) and includes, among other data, ugriz photometry from Subaru (Taniguchi et al. 2007), and more recently YJHK photometry from the UltraVista survey (McCracken et al. 2012). Spectroscopic redshifts from the zCOSMOS survey are also available (Lilly et al. 2007). The ECDFS is covered by the MUSYC survey in UBVRIz’ (Gawiser et al. 2006) and partly by the CANDELS survey with the ACS and WFC3 on HST (Koekemoer et al. 2011). The VVDS–02h field has deep CFH12K BVRI photometry (Le Fèvre et al. 2004), and even deeper CFHTLS ugriz photometry (e.g. Ilbert et al. 2006), as well as JHK photometry from the deep survey with CFHT-WIRCAM (WIRDS, Bielby et al. 2012).
3 Pair identification
Pairs have been identified using the projected transverse separation and the velocity difference where , the normalized velocity of the galaxy, is given as . The survey samples have first been scanned for separation h-1kpc and km s-1. We chose these separations as it is expected that pairs would merge in about 1 Gyr (e.g. Kitzbichler & White, 2008), meaning that a pair observed at would have merged by the peak in star formation activity at (e.g. Cucciati et al. 2012).
Given the limitation of our ground based seeing observations, we are not able to identify pairs superimposed along the line of sight or separated spatially by less than 1 arcsec, the average image quality (FWHM) of the imaging data, corresponding to 5 h-1kpc at . In addition, pairs with larger or v could also merge, albeit on a longer timescale, and with a lower probability (Kitzbichler & White, 2008). We will expand our pair sample to these larger separations and will correct for the geometrical limitations and selection function of the observations, following e.g. de Ravel et al. (2009), when addressing the merger rate in a forthcoming paper.
We used all objects with reliability flags 2 to 9 (galaxies) and 12 to 19 (broad–line AGN) for the primary targets, including a total of 1111 galaxies, and an additional 811 galaxies with flags 1 to 9 and 11 to 19, as well as 21 to 29 (objets falling serendipitously in the slit), for the companions.
In looking for pairs, there is a possibility that the two objects identified could be two giant HII regions of the same galaxy, which would then be prominent in the UV rest–frame probed by the –band, but which would appear as a single galaxy in the or band which probes redward of the D4000 or Balmer breaks at wavelengths less sensitive to contamination by younger stellar populations. On the contrary, the persistence of separate morphological components in the redder bands is an indication of the existence of two galaxies even if these are embedded in a diffuse light background. We therefore examined the –band and –band images of the pair candidates selected from their separation. As described in the next section, all of our pairs are well separated and both galaxies are seen from bluer to redder bands. We are therefore confident that we are dealing with true physical pairs rather than double HII regions of the same galaxy.
In this process, we have identified 12 pairs with redshifts from to . All primary and companion galaxies have flags except one galaxy (ID:520478087) with a lower reliability flag 1. Our pair sample therefore benefits from reliable spectroscopic identification. The pair properties are discussed in the next section.
4 Pair properties
From the multi–wavelength dataset, we have derived the main properties of the galaxies in the identified pairs. The stellar mass of each galaxy of a pair has been derived from SED fitting of the available photometric data at the measured redshift (see e.g. Ilbert et al. 2010) and range from to M☉ (Table 2), with uncertainies by up to a factor 2 (e.g. Bolzonella et al. 2009) depending on the number of bands used, or the IMF. The stellar mass ratio are used to separate “major–merging pairs”, with a mass ratio between the two galaxies of , from “minor–merging pairs”, for which . We have checked that the SED–derived mass ratio for each pair is consistent with the –band or –band flux ratio of the two galaxies, as these fluxes probing above Å can be considered as a rough proxy for stellar mass (Bruzual and Charlot, 2003), and we have used the error on the –band or –band flux ratio as a proxy for mass ratio errors. We find that the mass ratio of the major merging pairs are in the range and therefore, given the uncertainties on stellar mass ratio estimates reported in Table 2, none of the major merger pairs could be misclassified minor mergers. Taking into account the mass ratio between the two galaxies in a pair, and the separations v and , we use the formalism of Kitzbichler and White (2008, formula 10) to compute the merging time–scale for each pair , as described in de Ravel et al. (2009). These timescales are compatible with the Lotz et al. (2010) estimates, as discussed in Lopez–Sanjuan (2011). We list the main pair properties in Table 2, including and the redshift by which the pair would have merged into a single galaxy, taking into account the redshift of the pair and . Images and spectra of each pair are presented in Figures 1 to 12. We describe the properties of each pair below.
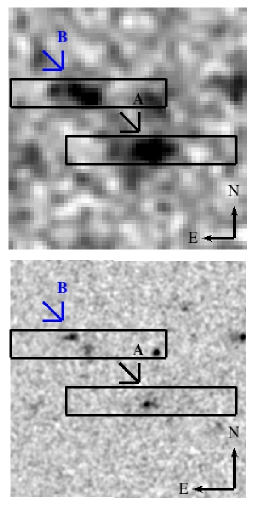
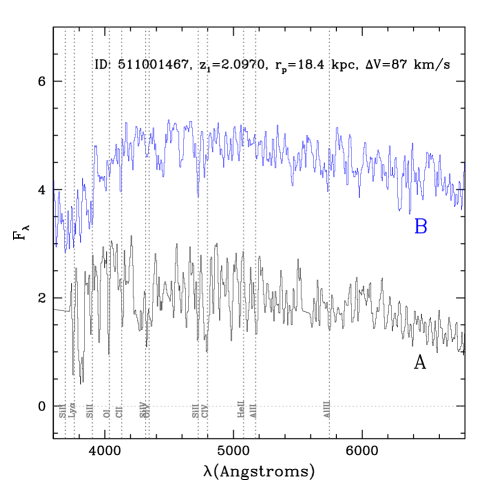
COSMOS–511001467 A/B (Figure 1): Redshifts of the two galaxies in this pair have been measured from two different VUDS observations at and , for a velocity difference of km s-1. The two galaxies are separated by 18.4 kpc, and are easily visible both in the HST/ACS F814W image and in the UltraVista near–infrared images. The most massive galaxy has a stellar mass of and the stellar mass ratio between the two galaxies is estimated to be , hence a major merger. The South–West galaxy shows a compact nucleus surrounded by a faint diffuse component, while the North–Eastern galaxy is seen as two components in both HST/ACS F814W and UltraVista images. The spectra of the two galaxies have a UV flux rising to the blue up to Ly, typical of star forming galaxies at these redshifts. Given the physical separation and mass difference, and following the prescription of Kitzbichler & White (2008), this pair is expected to merge within 2.3 Gyr.
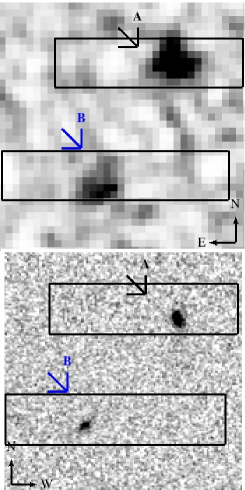
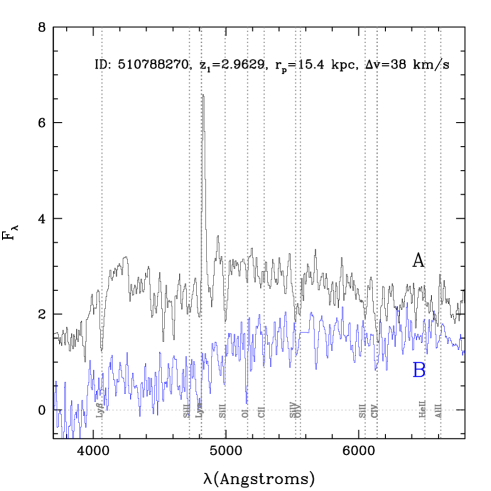
COSMOS–510788270 A/B (Figure 2): Two galaxies separated by 15.4 kpc are at a redshift , with a velocity difference km s-1, measured from two different VUDS observations. The most massive galaxy has a mass and the mass ratio between the two galaxies is estimated to be , a major merger. One of the spectra shows Ly in emission with Å, while Ly is observed in absorption for the other galaxy. Images are barely resolved at the HST/ACS resolution, showing a slightly extended and elliptical light distribution. This pair is expected to merge within 1.5 Gyr.
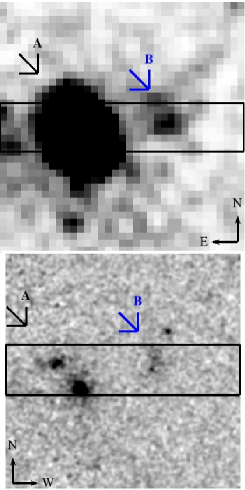
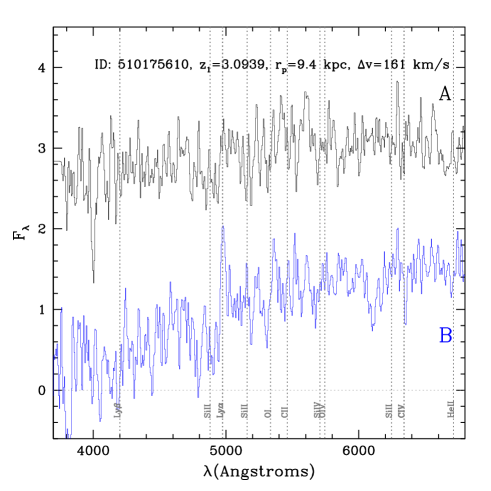
COSMOS–510175610/510778438 (Figure 3): This pair at a redshift is separated by 9.4kpc and km s-1, measured in the same slit from VUDS observations. The brightest and most massive galaxy has a compact, although irregular, morphology, while the companion to the West, which is confirmed at the same redshift, is more diffuse and has a low surface brightness. Another companion is visible about 3kpc to the North–East, and although its photometry is compatible with the redshift of the pair, no spectroscopic redshift information is available to confirm that it is physically linked to this system. Both spectra have been obtained from the VUDS survey. One of the VIMOS spectra shows a weak Ly in emission, while the other is purely in absorption. The mass of the brightest galaxy is , and the mass ratio is , considered to be a minor merger. This pair is expected to merge within 0.7 Gyr.
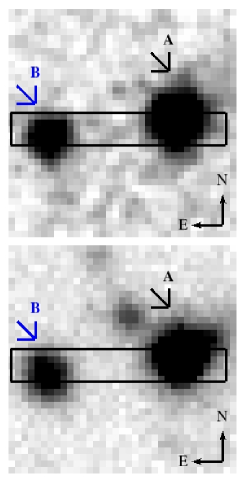
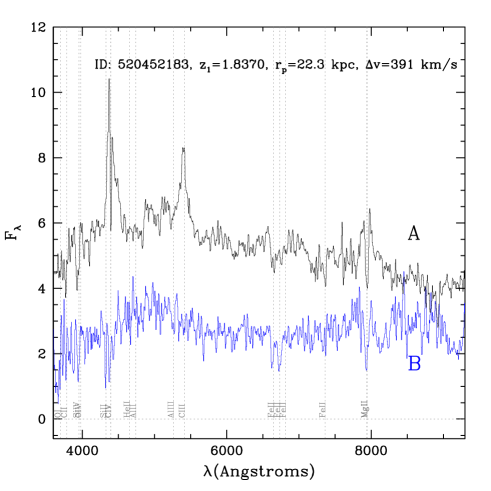
VVDS–02h–520452183/520450423 (Figure 4): The spectra of these two galaxies obtained from the same VVDS slit show a broad–line AGN with and an absorption–line galaxy with , for a velocity difference km s-1. This pair is separated by 22.3 kpc, and the estimated mass ratio is , with the most massive galaxy, the AGN host, having a stellar mass . This estimate is, however, quite uncertain given the presence of the AGN. Another object is observed in between the two main galaxies but no redshift information is available. The AGN host is compact, barely resolved at the seeing of the best CFHTLS image ( arcsec), while the companion galaxy is slightly elongated and irregular in shape. Given the physical separation and mass difference, this pair is expected to merge within 1.1 Gyr, although this estimate is affected by the uncertain mass estimate of the AGN host.
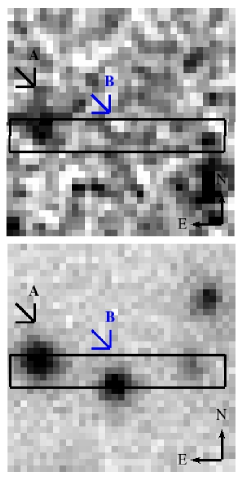
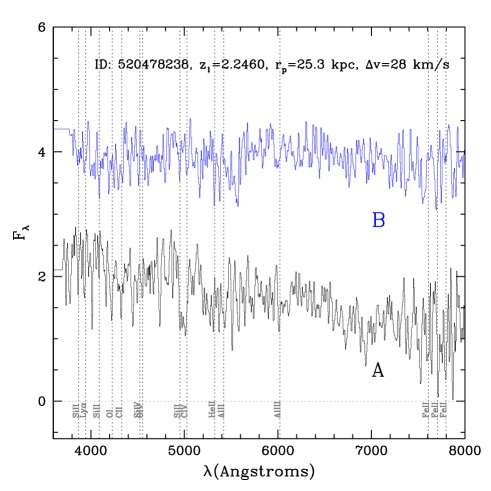
VVDS–02h–520478238/520478087 (Figure 5): The two galaxies observed spectroscopically in the same VUDS slit have , for a velocity difference km s-1, and are separated by kpc. They are part of a group of four galaxies within 5 arcsec (kpc), with photometric redshifts compatible with the redshift of the pair. The eastern component is the most massive with . The mass ratio, , indicates a major merger and results in an expected time to merge within 1.8 Gyr.
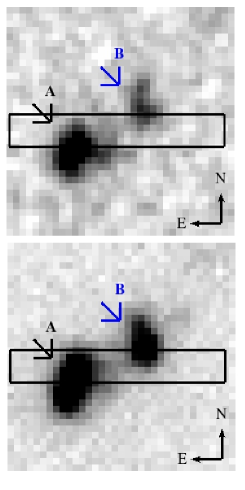
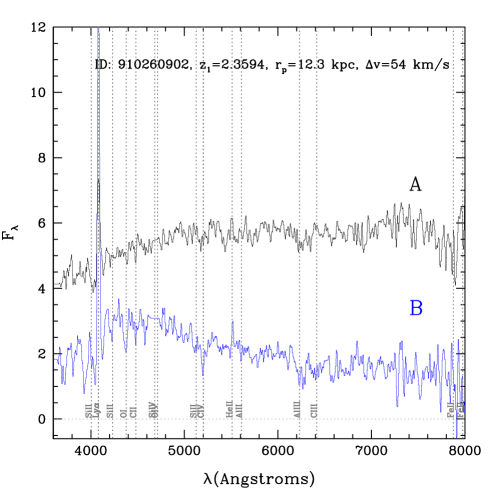
VVDS–02h–910260902/910261083 (Figure 6): The two galaxies, spectroscopically observed in the same VVDS slit with and , are identified both in the CFHTLS –band image and the –band WIRDS image, with kpc and km s-1 separation. The slit was placed on the centroid of the blended CFHTLS image of the two galaxies, but still included a significant fraction of the flux of both galaxies to yield two well separated spectra. The South–East galaxy is the most massive with and the mass ratio is , the later indicating a major merger. While the massive galaxy shows a symmetric elongated shape, the North–West galaxy shows an irregular morphology, and the two are connected by a faint bridge. Both galaxies show Ly in emission, with Å and Å, and integrated line flux and erg s-1 respectively, indicating strong star formation at the level of (see e.g. Cassata et al. 2011). Given the observed separation of this pair, it is expected that it will merge within 0.6 Gyr.
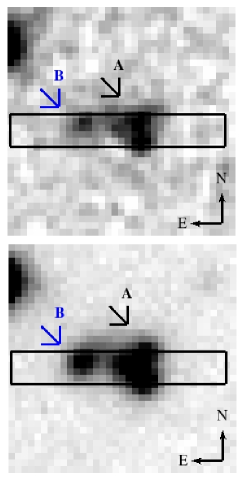
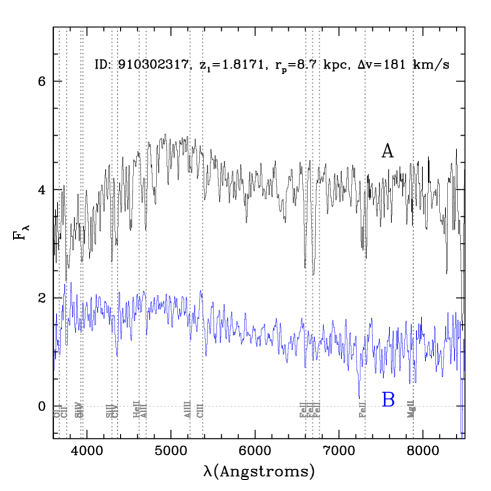
VVDS–02h–910302317/910302929 (Figure 7): The two main galaxies observed in spectroscopy in the same VVDS slit are respectively at , and , separated by 8.7 kpc along the East–West direction, and by km s-1. The brightest / most massive galaxy has a mass and is made of two main components, well visible both in the –band and –band images. The mass ratio between the two galaxies in the pair is , which indicates a major merger. This pair is expected to merge within 0.6 Gyr.
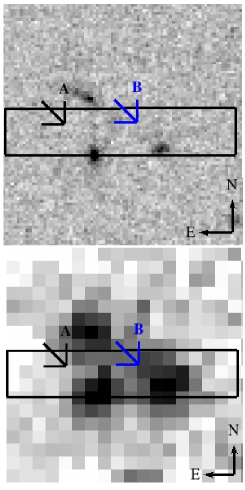
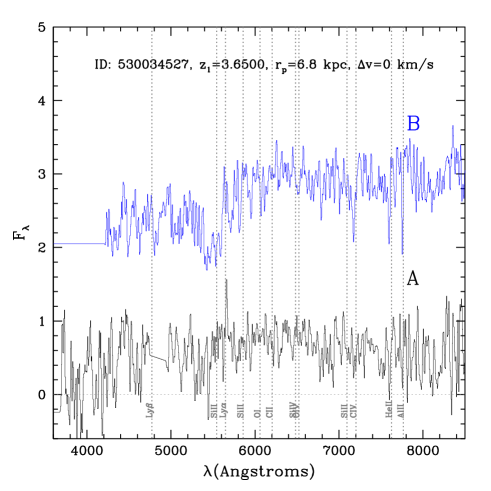
ECDFS–530034527 (Figure 8): This is the highest redshift for which we have obtained a spectroscopic confirmation of a physical pair, with both galaxies at the same redshift , separated by 6.8 kpc, as measured from the same VUDS slit. In Figure 8 another companion is observed to the North–East, but there is no confirmation of its redshift. The stellar mass of the brightest and most massive galaxy is , and the mass ratio with the companion is , which indicates a major merger. The two spectra obtained in the VUDS survey show absorption line spectra, with only a weak emission for the brighter galaxy. This pair is expected to merge within 0.5 Gyr.
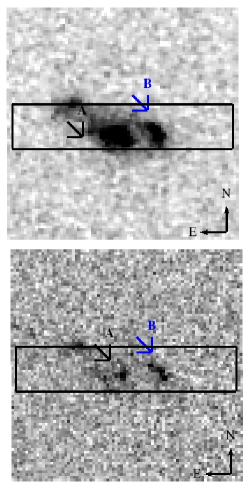
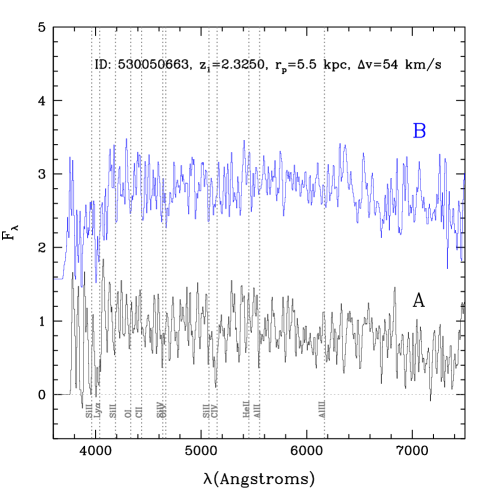
ECDFS–530050663 (Figure 9): This pair is made of 2 components identified in the –band CANDELS image, with redshifts and measured in the same VUDS slit. The stellar mass of the main component is , and the mass ratio between components is : a major merger. A third component is observed to the North–East, all three components being embedded in a low surface brightness emission. The pair identification is therefore ambiguous, as this configuration might be indeed a merger at an advanced stage surounded by tidal debris, or the result of three giant star forming regions in a single forming galaxy. Under the merger hypothesis, the two main components are expected to merge within 0.6 Gyr.
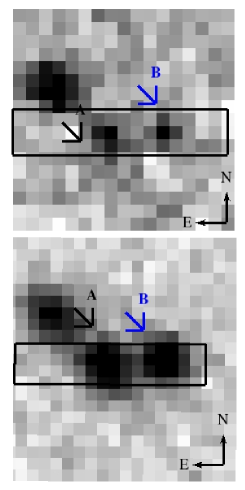
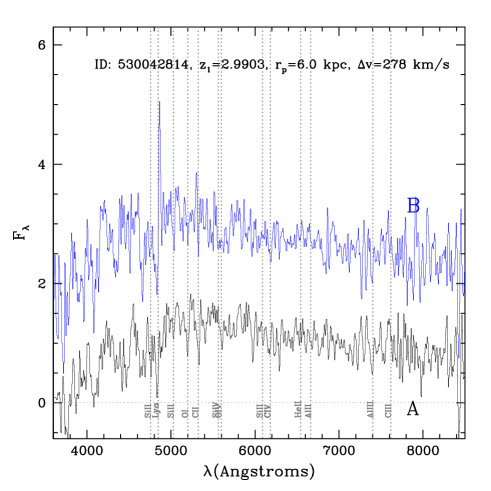
ECDFS–530042814/530042840 (Figure 10): The two galaxies are well–visible in the composite BVR MUSYC images and the –band image. These galaxies are at a mean redshift with a velocity difference km s-1 as measured in the same VUDS slit. These two main galaxies are separated by 6 kpc, and a third component is observed 6.5 kpc to the North–East. While the main galaxy shows Ly in absorption, the other galaxy measured with VIMOS shows Ly in emission, both spectra having a UV slope indicating strong star formation. The mass of the main galaxy is estimated to be , and the mass ratio is almost an equal mass major merger. This pair is expected to merge withins 1.0 Gyr.
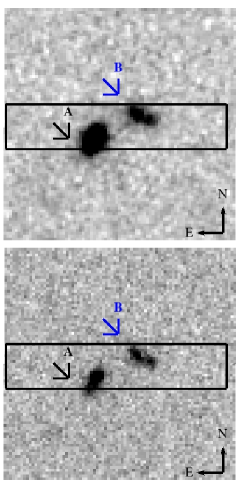
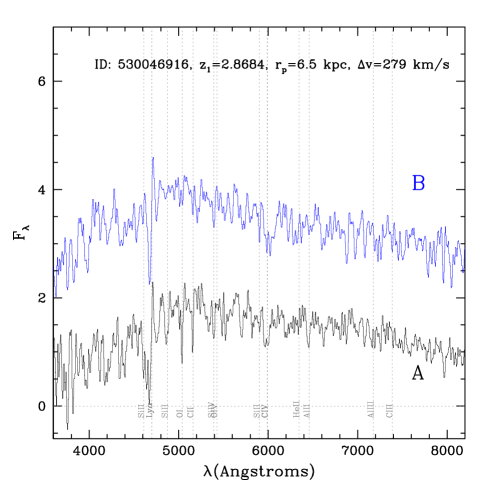
ECDFS–530046916 (Figure 11): Two close but well separated images of two galaxies are observed in both HST –band (F850W) and –band (F160W) images, with a redshift around measured in the same VUDS slit. The brightest / most massive galaxy has a regular morphology compatible with a disc, while the companion galaxy has an irregular shape. The mass of the main galaxy is estimated to be , and the mass ratio is , indicating a major merger. This pair will probably merge within 0.5 Gyr.
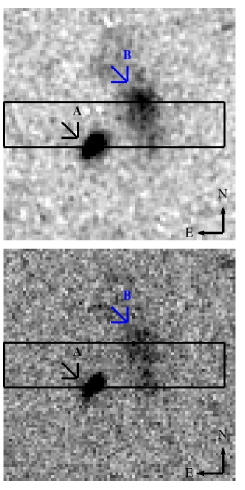
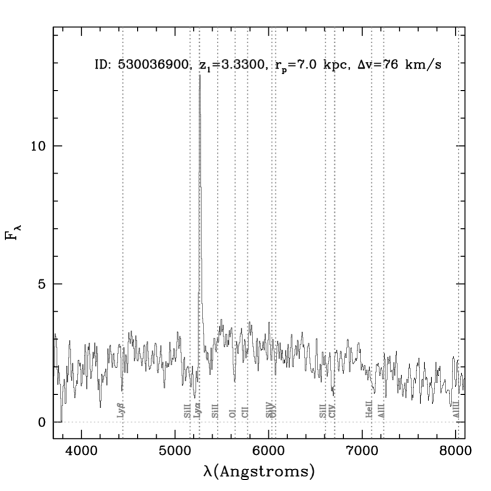
ECDFS–530036900/26931 (Figure 12): Two well separated galaxies are observed in the HST –band (F850W) and –band (F160W) images from CANDELS, with 7.0 kpc and km s-1 separation at a redshift of . One galaxy is quite compact, while the companion shows a sharp point–like component surrounded by a nebulous extension. The compact galaxy has been observed by VUDS and shows strong Ly emission, while the fainter galaxy has been observed as part of the VIMOS–GOODS survey (Popesso et al. 2009). The mass of the main galaxy is estimated to be , and the mass ratio is , an almost equal mass major merger. This pair will probably merge in less than 0.6 Gyr.
5 Discussion and conclusions: major merging pairs at
We have identified 12 pairs of galaxies with redshifts from the on–going VUDS and VVDS spectroscopic surveys. Both components of the pairs have a confirmed spectroscopic redshift obtained with VIMOS on the VLT and, therefore, comprise a unique sample of true physical pairs at these redshifts. The galaxies in our sample span a large mass range from to . The majority of galaxies in our pairs show signs of strong star formation, a common property at these redshifts, as evidenced by either strong Ly emission, strong UV continuum, or both, and with one of them showing AGN activity. The mass ratio of the merger is in the range , with 11 of 12 pairs satisfying a major merger pair criterion . The VUDS survey is still going–on, and deriving the survey selection function is beyond the scope of this paper, however, we use these pairs to derive a preliminary estimate of the major merger pair fraction. After correcting for the selection function and geometrical effects we derive a first tentative measurement for the major merger fraction of at . This value is comparable to the one observed from pair identification at in the MASSIV survey (Lopez–Sanjuan et al. 2013), and measurements obtained from CAS morphological analysis up to (Conselice et al. 2003). Our merger fraction estimate will be further refined as the VUDS survey proceeds.
Using the observed projected spatial and velocity separations, along with the prescription from Kitzbichler and White (2008), we have computed the merging timescale for each pair (Table 2). With separations from 6 to kpc and mass ratio 1/6 to 1, the average merging timescale of our sample is Gyr and the median is 0.7 Gyr. Most of these pairs will therefore have merged before the peak of star formation at (e.g. Cucciati et al. 2012). Given the average mass ratio of 1.75 for the 11 major merger pairs, the main galaxies involved in these mergers will have increased their stellar mass by from to from the merging process alone.
Our observations therefore provide unambiguous evidence of major merging occurring at . It is clear that hierarchical assembly, with massive galaxies being built from the merging of less massive ones, is at work at these redshifts and that major merging is contributing to the assembly of mass in galaxies at early times. This mass assembly simply results from the sum of the masses in each galaxy in a merging pair, a simple and effective way to increase mass at each merging event. An additional increase of stellar mass from star formation triggered by the merging process is also possible, with a range of mass production identified in the literature, ranging from relatively large (e.g. Kocevski et al. 2011) to more limited star bursts (e.g. Mullaney et al. 2012), depending on the duration and strength of the merger induced burst. Merging is therefore a clear path to move low mass galaxies towards the higher end of the mass function, which contributes to the evolution of the stellar mass function (e.g. Ilbert et al. 2012; Ilbert et al. 2013). As identified by de Ravel et al. (2009) and Lopez–Sanjuan et al. (2013), galaxies in the local universe with a mass will have assembled of their mass from major merging since . Our results demonstrate that merging was also contributing to mass assembly in galaxies at even earlier times.
These results are to be placed in the context of the currently favored picture of galaxy assembly, with cold accretion playing a key role in building–up mass in galaxies (e.g. Dekel et al. 2009). While cold accretion is observed in simulations as the primary mechanism fueling galaxies with enough gas mass to sustain the strong, continuous star formation necessary to explain the star formation rate history, the observational evidence for cold accretion at these redshifts remains elusive. While our results contribute to bring evidence that merging is at work, it is important to note that merging is not exclusive to other mass assembly processes. The high gas fraction of high redshift galaxies (Tacconi et al. 2010; Daddi et al. 2010) implies that other processes must also be at work, such as the continuous formation of stars potentially fueled by cold accretion. The total mass growth of a galaxy must therefore be coming from all these different processes at work. By precisely knowing the contribution of merging to global mass assembly, measured, e.g., by the growth of the stellar mass density, one would ultimately be able to place upper limits to the total mass growth from other processes, including cold gas accretion.
The integrated contribution of merging processes to the complete history of mass assembly requires knowledge of the evolution of the merger rate since early times (i.e., significantly beyond ). Building on the sample presented in this paper, the VUDS survey, when complete, will enable a robust measurement of the merging rate out to , and an estimate of the total amount of mass assembled by the merging process since the early universe.
Acknowledgements.
This work is supported by funding from the European Research Council Advanced Grant ERC–2010–AdG–268107–EARLY.References
- Barnes & Hernquist, (1992) Barnes, J., Hernquist, L., 1992, ARA&A, 30, 705
- Bolzonella et al. (2009) Bolzonella, M., et al. 2009, A&A, 524, 76
- Bouche et al. (2010) Bouché, N., et al. 2010, ApJ, 718, 1001
- Bournaud et al. (2005) Bournaud, F., Jog, C. J., Combes, F., 2005, A&A, 437, 69
- Bournaud et al. (2011) Bournaud, F., 2011, ApJ, 730, 4
- Brooks et al. (2009) Brooks, A.M., et al. 2009, ApJ, 694, 396
- Bruzual & Charlot (2003) Bruzual, G., and Charlot, S., 2003, MNRASS, 344, 1000
- Cassata et al. (2011) Cassata, P., et al. 2011, A&A, 525, 143
- Cattaneo et al. (2009) Cattaneo, A., et al. 2009, Nature, 460, 213
- Cooke et al. (2010) Cooke, J., Berrier, J. C., Barton, E. J., Bullock, J. S., & Wolfe, A. M., 2010, MNRAS, 403, 1020
- Conselice et al. (2003) Conselice, C. J., Bershady, M. A., Dickinson, M., & Papovich, C. 2003, AJ, 126, 1183
- Cucciati et al. (2012) Cucciati, O., et al. 2012, A&A, 539, 31
- Cresci et al. (2010) Cresci, G., et al. 2010, Nature, 467, 811
- Daddi et al. (2010) Daddi, E., et al. 2010, ApJ, 713, 686
- Davis et al. (1985) Davis, M., Efstathiou, G., Frenk, C. S., White, S. D. M., 1985, ApJ, 292, 371
- Dekel et al. (2009) Dekel, A., et al. 2009, Nature, 457, 451
- De Lucia et al. (2006) De Lucia, G., et al. 2006, MNRAS, 366, 499
- de Ravel et al. (2009) de Ravel, L., et al. 2009, 498, 379
- (19) de Vaucouleurs, G., et al. Third Reference Catalogue of Bright Galaxies, 1991.
- Dijkstra and Loeb, (2009) Dijkstra, M. & Loeb, A., 2009, MNRAS, 400, 1109
- Di Matteo et al. (2012) Di Matteo, T., et al. 2012, ApJ, 745, 29
- Hopkins et al. (2006) Hopkins, P., et al. Ap.J.S., 2006, 163, 1
- Ilbert et al. (2006) Ilbert, O., et al. 2006, A&A, 457, 841
- Kacprzak, et al. (2012) Kacprzak, Glenn G., 2012, MNRAS, 427, 3029
- Kauffmann, et al. (1993) Kauffmann, G., White, S. D. M., Guiderdoni, B., 1993, MNRAS, 264, 201
- Keres et al. (2005) Kereš, D., Katz, N., Weinberg, D.H., Davé, R., 2005, MNRAS, 363, 2
- Keres et al. (2009) Kereš, D., et al. 2009, MNRAS, 395, 160
- Kitzbichler & White, (2008) Kitzbichler, M. G., White, S. D. M., 2008, MNRAS, 391, 489
- Kocevski et al. (2011) Kocevski, D., et al. 2011, ApJ, 736, 38
- Koekemoer et al. (2007) Koekemoer, A., et al. 2007, ApJS, 172, 196
- Koekemoer et al. (2011) Koekemoer, A., et al. 2011, ApJS, 197, 36
- Le Fèvre et al. (2000) Le Fèvre, O., et al. 2000, MNRAS, 311, 565
- Le Fèvre et al. (2004) Le Fèvre, O., et al. 2004, A&A, 417, 839
- (34) Le Fèvre, O., et al. 2005, A&A, 439, 845
- Lilly et al. (2007) Lilly, S.J., et al. 2007, ApJS, 172, 70
- Lin et al. (2008) Lin, L., et al. 2008, ApJ, 681, 232
- Lopez-Sanjuan et al. (2011) Lopez-Sanjuan, C., et al. 2011, A&A, 530, 20
- Lopez-Sanjuan et al. (2013) Lopez-Sanjuan, C., et al. in press, arXiv:1208.5020
- Lotz et al. (2010) Lotz et al. 2010, ApJ, 2010, MNRAS, 404, 575
- McCracken et al. (2012) McCracken, H.J., et al. 2012, A&A, 544, 156
- Moore et al. (1996) Moore, B., Katz, N., Lake, G., Dressler, A., Oemler, A., 1996, Nature, 379, 613
- Mullaney et al. (2012) Mullaney, J.R., et al. 2012, MNRAS, 419, 95
- Murray et al. (2005) Murray, N., Quataert, E. Thompson, T., 2005, ApJ, 618, 569
- Patton et al. (2000) Patton, D., et al. 2000, ApJ, 536, 153
- Popesso et al. (2009) Popesso, P., et al. 2009, A&A, 494, 443
- Scodeggio et al. (2005) Scodeggio, M., et al. 2005, PASP, 117, 1284
- Scoville et al. (2007) Scoville, N., et al. 2007, ApJS, 172, 1
- Silk, (1997) Silk, J., 1997, ApJ, 481, 703
- Silk & Mamon, (2012) Silk, J., Mamon, G., 2012, ARAA, 12, 917
- (50) Springel, V., et al. 2005a, Nature, 435, 629
- (51) Springel, V., et al. 2005b, MNRAS, 361, 776
- Sulentic, J. W.; Tifft, W. G., (1973) Sulentic, J. W., Tifft, W. G., 1973, The Revised New Catalogue of Nonstellar Astronomical Objects, University of Arizona Press, ISBN 978-0-8165-0421-3.
- Tacconi, L.J., et al. (2010) Tacconi, L.J., et al. 2010, Nature, 463, 781
- Taniguchi, et al. (2007) Taniguchi, Y., et al. 2007, ApJS, 172, 9