2-Cavendish Laboratory, University of Cambridge, 19 JJ Thomson Avenue, Cambridge, CB3 0HE, UK
3-Kavli Institute for Cosmology, University of Cambridge, Madingley Road, Cambridge CB3 0HA, UK
4-Carnegie Observatories, Colina El Pino, Casilla 601 La Serena, Chile 5-SUPA, Institute for Astronomy, University of Edinburgh, royal Observatory. Edinburgh, EH9 3HJ, UK
6-Laboratoire AIM-Paris-Saclay, CEA/DSM/Irfu-CNRS- UniversiteṔaris-Saclay, pt courrier 131, F-91191 Gif-sur-Yvette, France
7-Observatoire astronomique de Strasbourg, Université de Strasbourg, CNRS, UMR 7550, 11 rue de l’Université, F-67000,Strasbourg, France
The ASTRODEEP Frontier Fields Catalogues
Abstract
Aims. We present the multiwavelength photometry of two Frontier Fields massive galaxy clusters MACS-J0717 and MACS-J1149 and their parallel fields, ranging from HST to ground based K and Spitzer IRAC bands, and the public release of photometric redshifts and rest frame properties of galaxies found in cluster and parallel pointings. This work was done within ASTRODEEP project and aims to provide a reference for future investigations of the extragalactic populations
Methods. To fully exploit the depth of the images and detect faint sources we used an accurate procedure which carefully removes the foreground light of bright cluster sources and the intra-cluster light thus enabling detection and measurement of accurate fluxes in crowded cluster regions. This same procedure has been successfully used to derive the photometric catalogue of MACS-J0416 and Abell-2744.
Results. The obtained multi-band photometry was used to derive photometric redshifts, magnification and physical properties of sources. In line with the first two FF catalogues released by ASTRODEEP, the photometric redshifts reach 4 accuracy. Moreover we extend the presently available samples to galaxies intrinsically as faint as H16032-34 mag thanks the magnification factors induced to strong gravitational lensing. Our analysis allows us to probe galaxy masses larger then 107 M and/or SFR=0.1-1M/yr out to redshift z.
Key Words.:
catalogs:Methods:data analysis; galaxies:distances and redshifts; galaxies:high-redshift1 Introduction
The Hubble Frontier Fields (FF) program (Lotz et al., 2017) has been conceived and designed to explore the highest redshift Universe down to the faintest rest-frame luminosities attainable ahead of JWST, by combining the capabilities of the Hubble Space Telescope (HST) with the amplification power of massive galaxy clusters. The program (PI. Lotz), started in 2012, using HST director discretionary time, has devoted 560 orbits (630 hours) to observe six clusters of galaxies. The FF target clusters were selected as six of the most powerful gravitational lenses presently known, providing lensing amplifications of typically 2 over a significant fraction of the HST/WFC3 field of view up to 10-50 in the most extreme cases.
The HST images are supplemented by a wealth of data including Spitzer and ground-based imaging and spectroscopic follow-up.
The key science driver of the FF programme is shedding light on the properties of galaxies at high redshift (z), which are critically important for our understanding of the processes involved in the reionization of the Universe and are presently constrained only from the brightest galaxies discovered in blank-field surveys (Castellano et al., 2016b; Menci et al., 2016; Bouwens et al., 2016, 2016b; McLeod et al., 2016; Vanzella et al., 2017, 2017b; Livermore et al., 2017; Wei et al., 2017).
To achieve the ambitious goal of probing the distant universe to an unprecedented depth it is important to develop accurate photometric procedures that reveal the power of the deepest images. This is the main scope of the European FP7-Space project ASTRODEEP, a coordinated and comprehensive program of i) algorithm/software development and testing; ii) data reduction/release, and iii) scientific data validation/analysis of the deepest multiwavelength cosmic surveys111For more information visit http://astrodeep.eu..
In the first two papers, Merlin et al. (2016) and Castellano et al. (2016), we described the procedures developed within this collaboration to produce multiband and photometric redshift catalogues and their application to the first two released FF Abell-2744 and MACS-J0416.
In this paper, we present the public release of the multiwavelength photometry of MACS-J0717+3745 and MACS-J1149.5+2223 (hereafter M0717 and M1149) that include both Hubble Space Telescope (HST) ACS and WFC3, Keck-MOSFIRE Ks-band and Spitzer-IRAC observations.
The paper is structured as follows: in Section 2 we describe the dataset used in this study; Section 3 gives a short description of the procedure we applied to obtain the detection catalogue and photometric measurements in optical and NIR bands. In Section 4 we present the released catalogue describing in particular the procedure used to compute the photometric redshifts, magnification and rest-frame galaxy properties. Conclusions close the paper.
In the following we adopt the -CDM concordance cosmological model(Ho = 70 km/s/Mpc, M = 0.3 and λ = =0.7). All magnitudes are in AB system unless explicitly mentioned
2 The dataset
M0717 and M1149 are the third and the fourth of a total of six twin fields observed by HST in seven optical and near-infrared bands: F435W, F606W, and F814W from ACS/WFC and F105W, F125W, F140W, and F160W from WFC3/IR. Each of these fields is observed by HST in parallel mode, i.e. cluster and a blank adjacent field.
We used the final reduced and calibrated v1.0 mosaics released by STScI, drizzled at 0.06” pixel-scale. A detailed description of the acquisition strategy and of the data-reduction pipeline can be found in the STScI data release documentation at https://archive.stsci.edu/pub/hlsp/frontier/.
We also include the MOSFIRE@Keck Ks images from Brammer et al. (2016) and the IRAC 3.6 and 4.5 data acquired by Spitzer under Director Discretionary time (PI Capak).
In Table 1 we list PSF FWHM and limiting magnitudes of the dataset. For the HST images the depths have been computed as the magnitudes within a circular aperture of two times the FWHM of 5 detections in the H160 images, as measured by SExtractor on PSF-matched images. To estimate the depths of the MOSFIRE and IRAC images, we use the corrected RMS maps (see below) computing in each pixel, where Aaper is the area of a circular region with radius equal to the PSF FWHM, and taking as final value the mode of the distributions.
| Image | PSF FWHM(”) | Limiting AB magnitude | PSF FWHM(”) | Limiting AB magnitude |
|---|---|---|---|---|
| M0717 Cluster | M0717 Parallel | |||
| ACS B435 | 0.11 | 28.64 | 0.10 | 28.71 |
| ACS V606 | 0.13 | 28.67 | 0.12 | 28.92 |
| ACS I814 | 0.16 | 28.99 | 0.14 | 29.13 |
| WFC3 Y105 | 0.16 | 29.33 | 0.17 | 28.94 |
| WFC3 J125 | 0.18 | 28.98 | 0.18 | 28.96 |
| WFC3 JH140 | 0.18 | 29.02 | 0.18 | 28.97 |
| WFC3 H160 | 0.18 | 29.06 | 0.17 | 28.97 |
| MOSFIRE Ks | 0.4 | 25.08 | 0.4 | 25.19 |
| IRAC 3.6 | 1.66 | 25.47 | 1.66 | 25.22 |
| IRAC 4.5 | 1.72 | 25.22 | 1.72 | 25.19 |
| M1149 Cluster | M1149 Parallel | |||
| ACS B435 | 0.11 | 28.30 | 0.10 | 28.26 |
| ACS V606 | 0.15 | 28.88 | 0.10 | 28.71 |
| ACS I814 | 0.15 | 29.08 | 0.13 | 28.90 |
| WFC3 Y105 | 0.15 | 29.25 | 0.17 | 29.33 |
| WFC3 J125 | 0.17 | 29.12 | 0.16 | 29.02 |
| WFC3 JH140 | 0.19 | 28.72 | 0.17 | 29.02 |
| WFC3 H160 | 0.17 | 29.18 | 0.17 | 29.09 |
| MOSFIRE Ks | 0.5 | 24.65 | 0.5 | 24.52 |
| IRAC 3.6 | 1.66 | 25.41 | 1.66 | 25.08 |
| IRAC 4.5 | 1.72 | 25.71 | 1.72 | 25.21 |
3 Multi-wavelenght photometry
3.1 Removing the ICL and bright cluster members
To fully exploit the depth of the images and detect faint sources we used an accurate procedure to remove the foreground light of bright cluster sources and the intra-cluster light (ICL). This procedure is described in details in Merlin et al. (2016) and it is even more necessary, compared to the previously studied FFs, for M0717 and M1149 in which few multiple merging and subclusters are present making the ICL bright and patchy222This step is obvioulsly unecessary in the case of parallel fields..
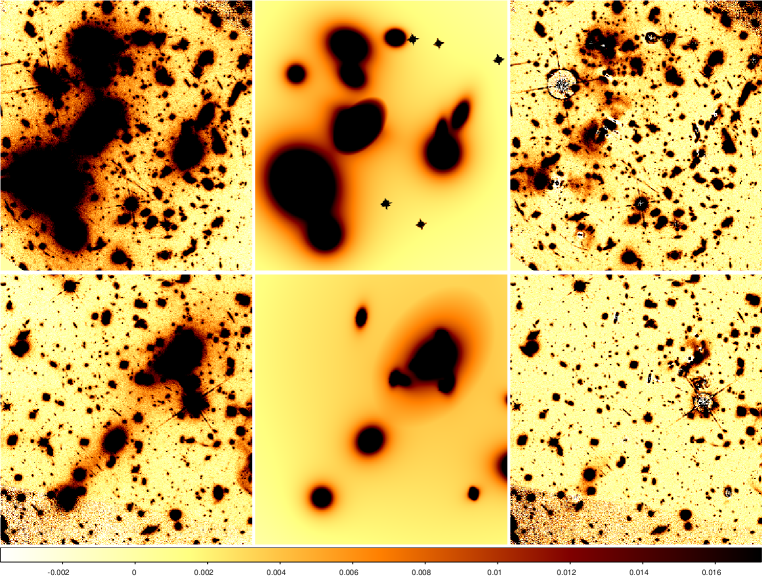
In brief, we initially estimated a first-guess model for the ICL component masking S/N10 pixels and we fitted the diffuse light with a Ferrer (Binney & Tremaine, 1987) profile centered on the mass center of the whole cluster. Then on the ICL-subtracted H160 image, with an iterative method which uses both Galapagos (Barden et al., 2012) and Galfit333Galapagos and Galfit are two public data analysis algorithms that fit 2-D analytic functions to galaxies and point sources directly to digital images. (Peng et al., 2011), we derived a one/two component fit of the brightest cluster galaxies. Finallly these fits are used to refine the model of ICL and to produce the residual image (see Fig.1) where the patchy ICL and the light from bright sources are subtracted.
Unlike in MACS-J0416 and Abell-2744, where all bright galaxies were Galfit-ed with two components to fit the central regions accurately (Merlin et al., 2016), here we found a better solution (a flatter residual image) using a single component (or very faint second one) for those bright galaxies which are located in the crowed regions (subclusters). Instead we add, during the ICL refinement fit, a second component to the ICL Ferrer profile centered on the subclusters.
In both clusters there is a saturated star in the central part of the H image whose light must be removed to produce accurate photometry of the faint galaxies. To do this we have subtracted most of the light from the saturated star using as a PSF the star itself together with three of its rotations of 90,180 and 270 degrees respectively.
Finally a median filtering was applied to remove the remaining intermediate scale background residuals. As demonstrated in Merlin et al. (2016) the detection on these residual image, as opposed to the detection on the original images, allows a more efficient recovery of the faint sources.
We apply the same procedure to all the other HST bands. For consistency and to reduce the computing times, we sequentially move from the H band to the bluer bands, adopting as first-guess parameter for both ICL and bright cluster galaxies the best-fit parameter of the band immediately redward of it (e.g. we use the H160 band parameters as first guess to fit the ICL and bright sources in the JH140 band, those of JH140 when fitting the J125 and so on).
As a final refining step we used the Galfit model image to estimate the photon noise in each pixel contributed by the bright Galfit-subtracted sourcestaking into account the image exposure time. The resulting ”photon noise image” was then added
to the original RMS map summing the variance in quadrature, to take into account the effect of the subtracted sources on the detection and the flux measurement in the innermost cluster regions.
3.2 Detection catalogue and HST photometry
The detection catalogue was produced in two steps: first using SExtractor (Bertin et al., 1996) on the processed H160 image using a revised HOT+COLD approch (Galametz et al., 2013; Guo et al., 2013) and then adding the additional objects detected in a median average of the Y105+ J125+ JH140+ H160 bands which are undetected in the H band This last step is more effective in the identification of very blue galaxies close to the detection limit of the images, that are expected to include a good fraction of those at redshift 6-8. Table 2 lists the total number of sources detected after each step. In the final catalogues these IR detected objects are identified as ID=20000+their original ID.
| Image | Nbright | NHdetect | NIRdetect |
|---|---|---|---|
| M0717cl | 14 | 3096 | 972 |
| M0717par | 0 | 2181 | 1266 |
| M01149cl | 23 | 3379 | 972 |
| M01149par | 0 | 2270 | 1133 |
The combined detection catalogue was then used to obtain the photometric measurement (both aperture and total photometry) in the other HST bands using SExtractor on processed images convolved to H160 resolution (0.18”) with a convolution kernel obtained taking the ratio of the PSFs of the two images in the Fourier space.
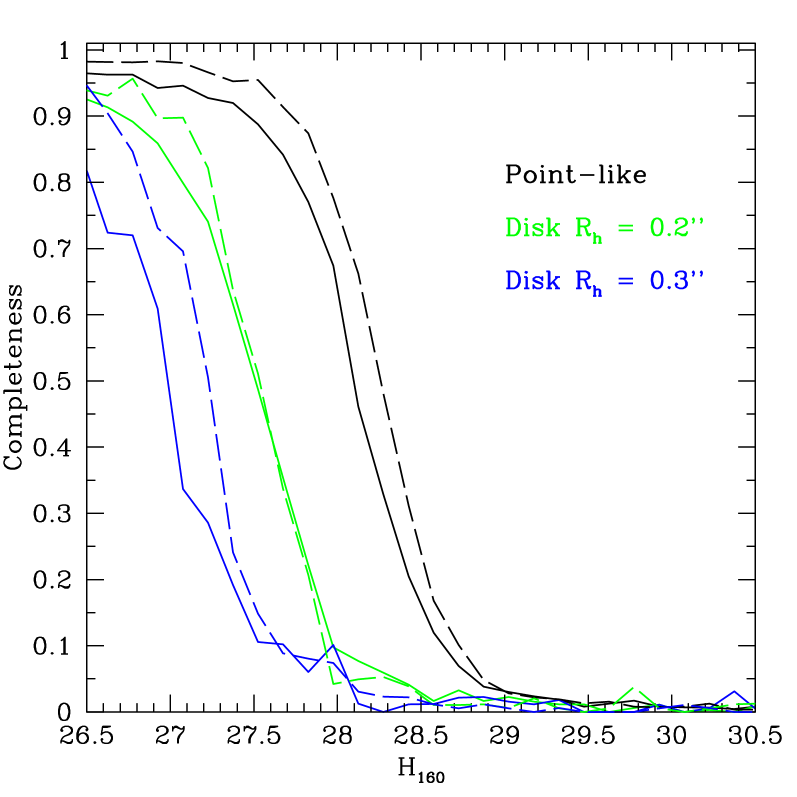
We assess the detection completeness as a function of the H-band magnitude by running simulations with synthetic sources. We first generate populations of point-like and exponential profile sources, with total H-band magnitude in the range 26.5–30.0 mag. Disc-like sources are assigned an input half-light radius randomly drawn from a uniform distribution between 0.0 and 1.0 arcsec. At each run 200 of these fake galaxies are placed at random positions in our detection image, avoiding positions where real sources are observed on the basis of the original SExtractor segmentation map. We then perform the detection on the simulated image, using the same SExtractor parameters adopted in the real case. Fig.2 shows the completeness as a function of the total input magnitude of different simulated objects (both point- and disk-like). We find that the 90% detection completeness for the point sources is at H 27.2(27.8) for M0717(M1149) and decreses to H 26.5(26.6) and H 25.7(26.3) for disk-like galaxies of arcsec and arcsec respectively.
3.3 K and IRAC Photometry with T-PHOT
K and IRAC photometry are obtained via a template-fitting technique with T-PHOT (Merlin et al., 2015, 2016b) using galaxy shapes in the detection band H160 as “priors”. In this purpose we take advantage of T-PHOT V2.0 that allows us to simultaneuosly use as templates the observed galaxy shapes (for all faint objects) and the analytic profiles for the ICL and bright cluster galaxies. In the latter case, after some test, we have decided to fix the ratio between the two components (when present) used for the analytic fits, in order to avoid possible degeneracy issues in the fitting procedure.
As discussed at length in Merlin et al. (2015), the segmentation of the objects obtained by SExtractor map may be too small to capture the whole galaxy shape, potentially leading to biases in the flux estimate with T-PHOT. In order to minimize this effect the SExtractor output map has been dilated with the same procedure described in Galametz et al. (2013) before being fed to T-PHOT, enlarging the size of the segmented area of each source by a given factor, depending on the original area.
We have then prepared the measurement image by applying to the RMS and background a corrective factor via injection of fake PSF-shaped sources in about 200 positions in empty regions without detected sources.
After having measured the flux of the fake point sources injected at the selected positions, we computed the RMS map multiplicative factor required to make the distribution of the measured S/N having standard deviation consistent with 1. Instead to derive the correcting factor for the background we measured the shift of the mean of the distribution of the fake sources on copies of the images having small constant artificial background offsets and computing the offset required to make the measured shift consistent with zero. In the case of the K band images, to take into account the noise correlation we added a further correcting factor for the background to be consistent with the magnitudes published in Brammer et al. (2016).
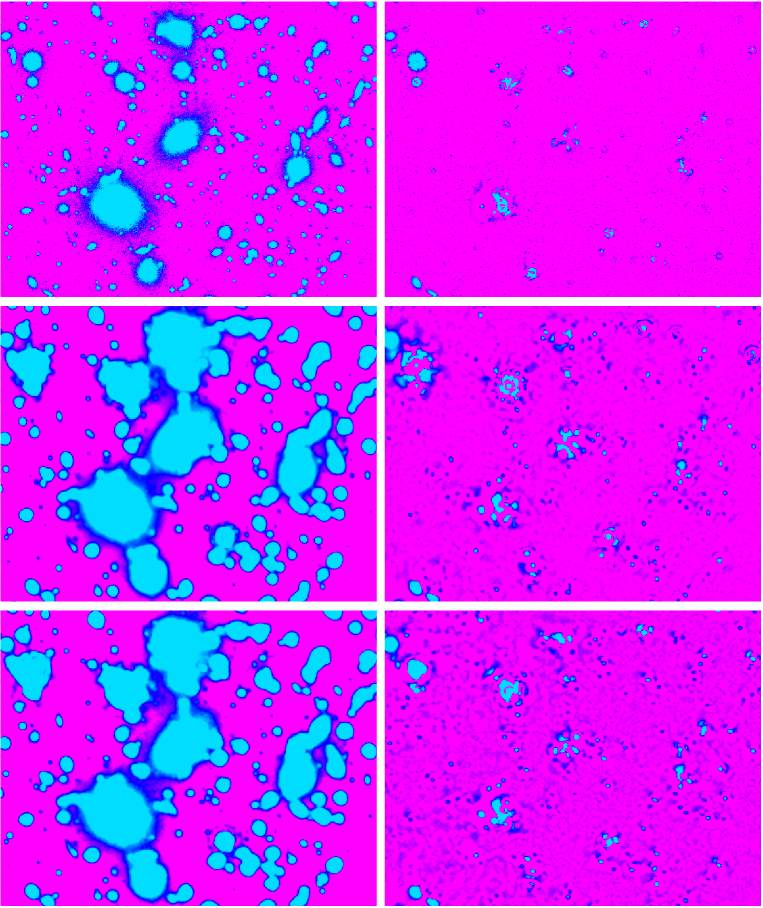
Following the procedure used to derive the photometric catalogue of MACS-J0416 and Abell-2744, we have also estimated a local background for each source and combined all the measurements to build a global background image which was then subtracted from the original image. Figure 3 shows the residual images obtained subtracting the scaled models generated by T-PHOT compared with original K and IRAC images of M0717.
We follow the same strategy to process the parallel fields, of course without the need to include any analytical model in the priors list.
4 Results
We distribute final complete multiwavelength photometric catalogues of four fields (two centered on clusters M07171 and M1149 + two parallel fields) which contains 10 bands fluxes and magnitudes, and corresponding uncertainties. All the fluxes were finally corrected for galactic exinction derived with Schlegel et al. (1998) dust emission maps. A flag (called RELFLAG) is associated to each object, that gives indication of the robustness of photometric estimates. “Good sources” have RELFLAG=1 which means they have more than 5 HST bands with reliable (Sextractor’s internal FLAGS16) flux measurement available. As in Castellano et al. (2016) we complement the publicly released catalogues with photometric redshift, stellar mass and star formation rate as described below.
4.1 Photometric redshifts and comparison with spectroscopic samples
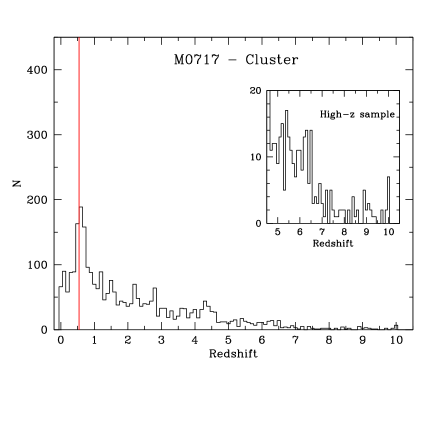
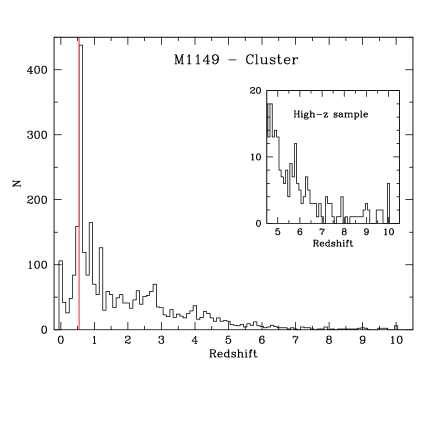
To minimize systematic effects due to the use of a single method we have measured photometric redshifts using six different algorithms: 1) OAR (Castellano et al., 2016); 2) McLure(McLure et al., 2011); 3)Mortlock (Arnouts et al., 1999; Blanton & Roweis, 2007); 4)Parsa (Arnouts et al., 1999; Ilbert et al., 2006); 5)Marmol-Queralto-1 (Brammer et al., 2008; Blanton & Roweis, 2007); 6)Marmol-Queralto-2(Brammer et al., 2008; Fioc & Rocca-Volmerange, 1997)). These techniques are described in detail in Section 3 of Castellano et al. (2016). Photometric redshifts are determined for all ”good sources” using all available bands with the exception of K and IRAC fluxes which are unreliable due to severe blending with other sources (T-PHOT parameter MaxCvRatio 1.0, see Merlin et al. 2016). In Fig. 4 we show the resulting median photometric redshifts distribution computed for all ”good sources”.
Objects having a positive match (within 1 arcsec) with reliable public spectroscopic samples are assigned the measured spectroscopic redshift. In particular, we consider the redshifts from the public dataset by Ebeling et al. (2014), GLASS (Treu et al. 2015, for sources with quality flag Q=3 and Q=4) together with the arcs from Limousin et al. (2012) in the case of M0717 and Smith et al. (2009) for M1149.
When compared with spectroscopic results, median values of photometric redshift are more accurate than the individual runs computed with the six different techniques ( 0.046 r.m.s 0.055) and for this reason we give the median value in the released catalogue. In Fig.5 we show the comparison between our median estimate of photometric redshift and spectroscopic value for all our ”good source” in the cluster’s field. Following Dahlen et al 2013 we define as outliers all sources having —z— / (1+z)=—(zspec-zphot)—/(1+zspec)0.15. In Table 3 we report the number of outliers and the statistic in each cluster. In the case of the parallel fields the final sample includes only two objects with spectroscopic redshift and it makes no sense to provide the statistics.


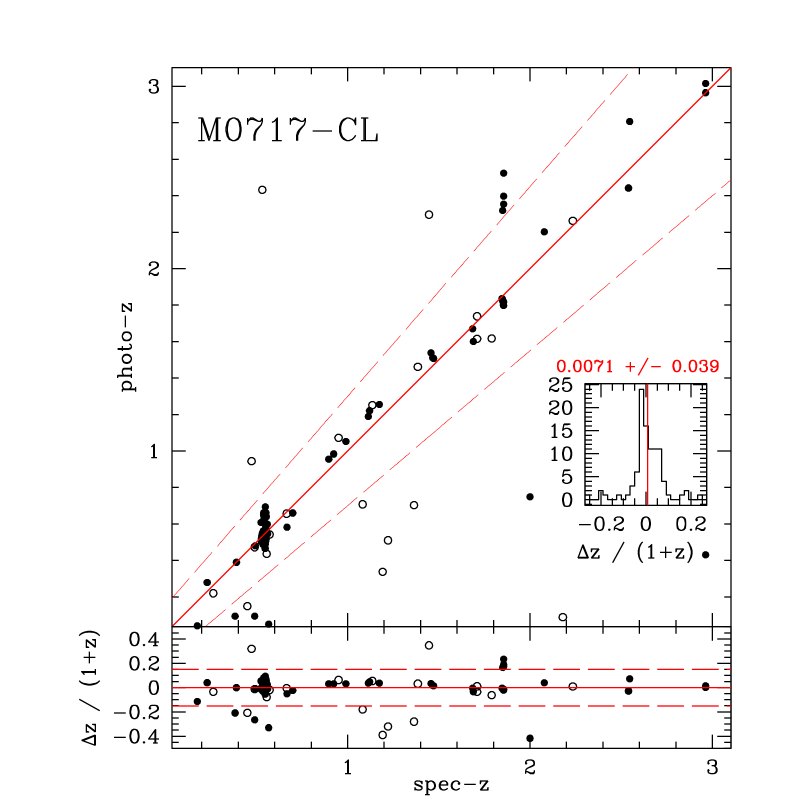
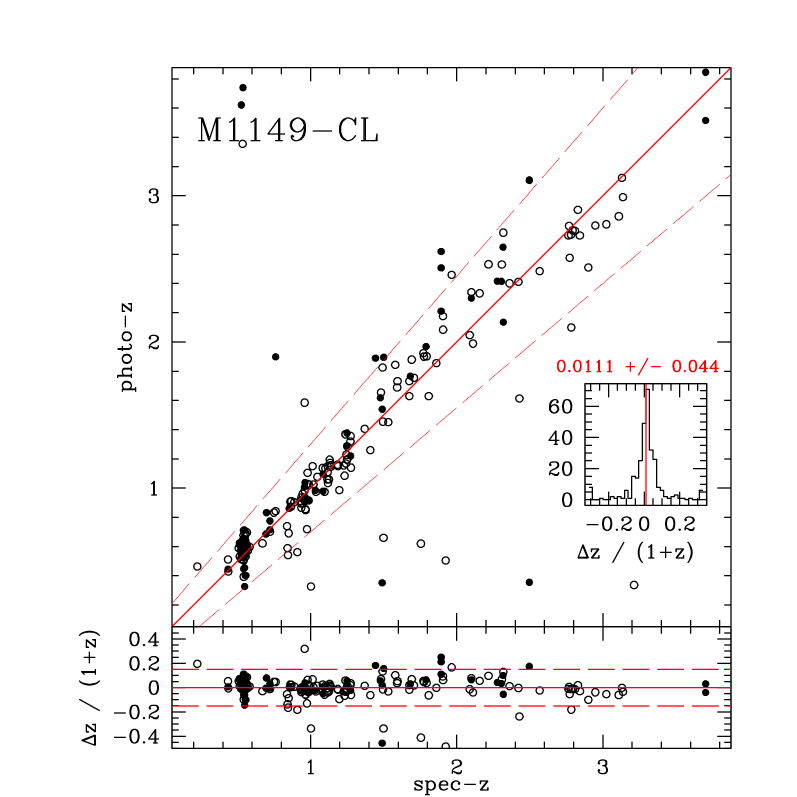
| Field | Spec. sample | outliers | z/(1+z) | |
|---|---|---|---|---|
| M0717 | 109 | 18% | 0.0071 | 0.037 |
| M1149 | 285 | 9% | 0.011 | 0.044 |
In Fig. 6 we show the distribution of photometric redshift for all objects of the first four FFs (Castellano et al. 2016 + this work).

4.2 Demagnified number counts and rest -frame physical properties
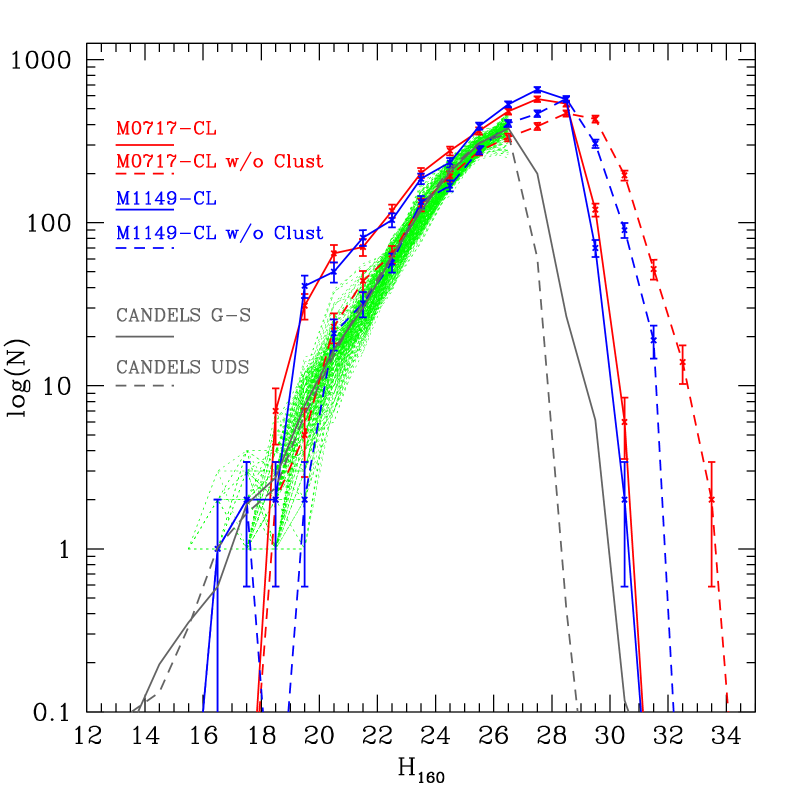
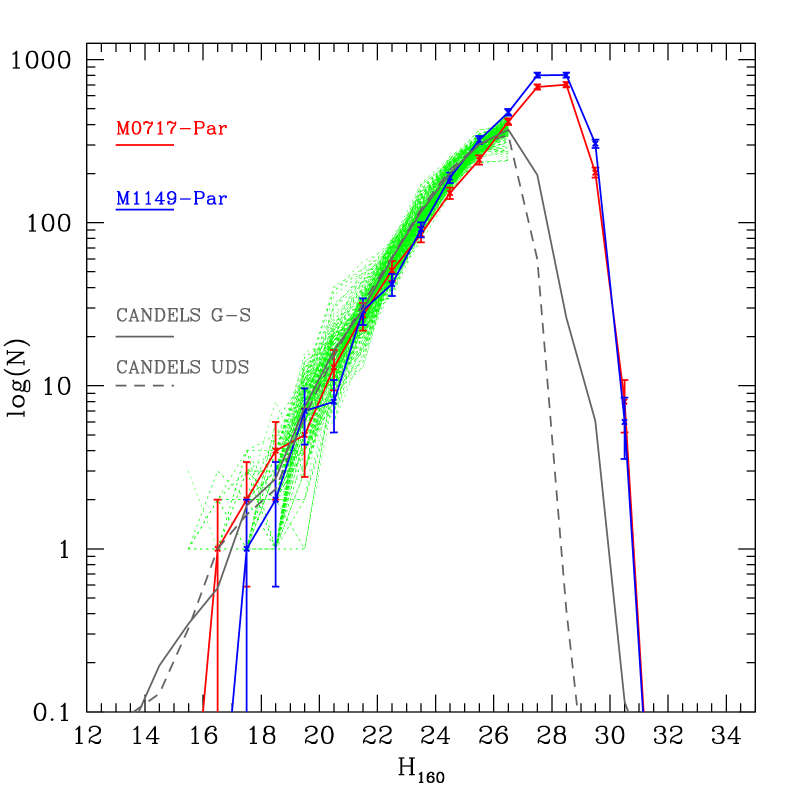
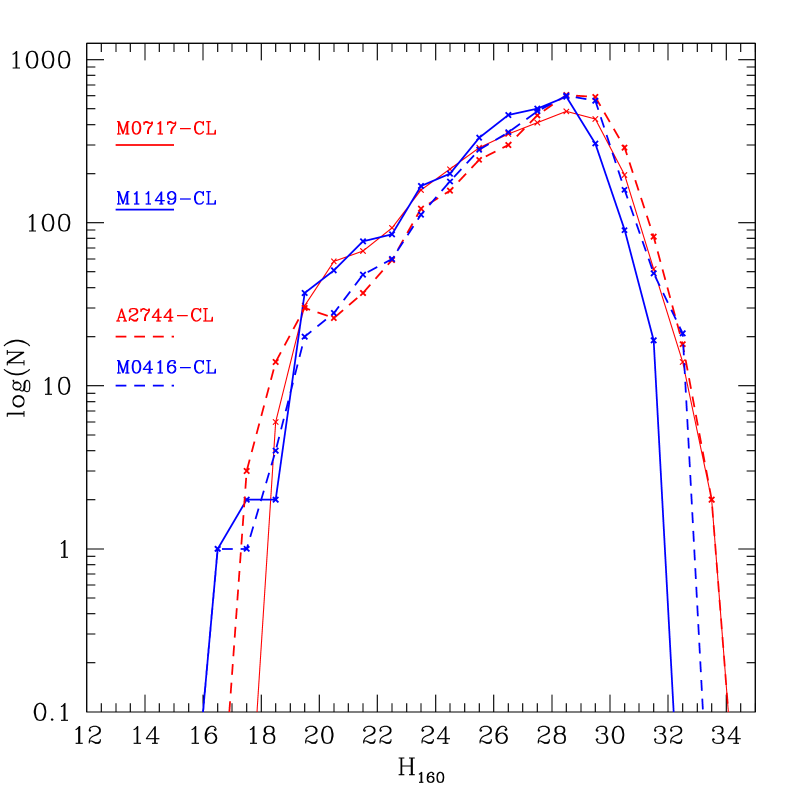
Ultra deep IR observations of the FF in combination with the strong gravitational lensing effect allow us to probe stellar masses and star formation rates at unprecedented low limits. We have first determined magnification values from all available lensing models described in detail on the FF website444http://www.stsci.edu/hst/campaigns/frontier-fields/Lensing-Models, on an object-by-object basis taking into account source position and redshifts.We assign a magnification to each source in our catalogues as the median values computed using the available lensing models. The magnified number counts are shown in Fig.7 compared with total number counts from CANDELS GOODS-South Guo et al. (2013) and UDS (Galametz et al., 2013) surveys normalized to FF area. For magnitudes brighter then H160=26mag, the number counts are consistent with the CANDELS ones once magnification is taken into accounts and when sources with zphot within 0.1 the redshift of the relative cluster are removed. At fainter magnitudes the FF cluster pointings allow us to detect sources up to 4 magnitudes intrinsically fainter than objects in the deepest areas of the CANDELS fields. Figure 8 shows the comparison with Abel-2744 and MACS-J0416.
Finally we also release de-magnified Mstar and SFRs as a function of redshift for galaxies in our catalogues obtained through SED-fitting. Galaxy properties are computed by fitting Bruzual & Charlot (2003) templates with our custom zphot.exe code (Giallongo et al., 1998; Fontana et al., 2000; Grazian et al., 2006) at the previously determined median photometric redshift. In the BC03 fit we assume exponentially decling star formation histories with e-folding time 0.1 15, a Salpeter (1955) initial mass function and we allow both Calzetti et al. (2000) and Small magellanic Cloud (Prevot et al., 1984) extinction laws. We fit all the sources both with stellar emission templates only and including the contribution from nebular continuum and line emission following Schaerer de Barros (2009) under the assumption of an escape fraction of ionizing photons fesc= 0.0 (see also Castellano et al. 2014). The Frontier Fields allow us to probe the galaxy distribution down to very low masses and SFRs, including objects with M 107 M⊙ and SFR 0.1-1 M⊙ yr-1 at , depending on magnification.
5 Conclusions
We have presented the public release of multi-wavelenght photometry of the Frontier Fields M0717 and M1149 (cluster and parallel pointings) including optical and NIR ACS and WFC3, MOSFIRE Ks and IRAC 3.6 and 4.5 IRAC bands. We have followed the same method used and described in detail in Merlin et al. 2016 for Abell-2744 and MACS-J0416 with small differences mainly due to the extreme crowding of the two investigated clusters. The catalogues also report first high-level data products such as photometric redshifts, magnification factors and rest frame properties for the detected objects, which can be downloaded from the ASTRODEEP website at http://www.astrodeep.eu/ff34 or at http://astrodeep.u-strasbg.fr//ff//index.html. This work, as it is happening the first two papers (see for example Vanzella et al. 2017a,b) aims to provide a reference for future investigations of the extragalactic populations.
Acknowledgements.
The authors acknowledge the contribution of the FP7 SPACE project ASTRODEEP (Ref.No:212725) supported by European Commission. R.A. acknowledges the support from the ERC Advanced Grant ’QUENCH’.References
- Arnouts et al. (1999) Arnouts, S., Cristiani, S., Moscardini, L., et al. 1999, MNRAS, 310, 540
- Barden et al. (2012) Barden, M., Häußler, B., Peng, C. Y., McIntosh, D. H., & Guo, Y. 2012, MNRAS, 422, 449
- Bertin et al. (1996) Bertin, E., & Arnouts, S. 1996, A&AS, 117, 393
- Binney & Tremaine (1987) Binney & Tremaine, 1987, Nature, 326, 219
- Blanton & Roweis (2007) Blanton, M. R., & Roweis, S. 2007, AJ, 133, 734
- Bouwens et al. (2016) Bouwens, R. J., Illingworth, G. D., Oesch, P. A., et al. 2016, arXiv:1608.00966
- Bouwens et al. (2016b) Bouwens, R. J., Oesch, P. A., Illingworth, G. D., Ellis, R. S., & Stefanon, M. 2016, arXiv:1610.00283
- Brammer et al. (2008) Brammer, G. B., van Dokkum, P. G., & Coppi, P. 2008, ApJ, 686, 1503-1513
- Brammer et al. (2016) Brammer, G. B., Marchesini, D., Labbé, I., et al. 2016, ApJS, 226, 6
- Calzetti et al. (2000) Calzetti, D., Armus, L., Bohlin, R. C., et al. 2000, ApJ, 533, 682
- Castellano et al. (2014) Castellano, M., Sommariva, V., Fontana, A., et al. 2014, A&A, 566, A19
- Castellano et al. (2016) Castellano, M., Amorín, R., Merlin, E., et al. 2016, A&A, 590, A31
- Castellano et al. (2016b) Castellano, M., Yue, B., Ferrara, A., et al. 2016, ApJL, 823, L40
- Fontana et al. (2000) Fontana, A., D’Odorico, S., Poli, F., et al. 2000, AJ, 120, 2206
- Fioc & Rocca-Volmerange (1997) Fioc, M., & Rocca-Volmerange, B. 1997, A&A, 326, 950
- Ebeling et al. (2014) Ebeling, H., Ma, C.-J., & Barrett, E. 2014, ApJS, 211, 21
- Galametz et al. (2013) Galametz, A., Grazian, A., Fontana, A., et al. 2013, ApJS, 206, 10
- Giallongo et al. (1998) Giallongo, E., D’Odorico, S., Fontana, A., et al. 1998, AJ, 115, 2169
- Grazian et al. (2006) Grazian, A., Fontana, A., de Santis, C., et al. 2006, A&A, 449, 951
- Guo et al. (2013) Guo, Y., Ferguson, H. C., Giavalisco, M., et al. 2013, ApJS, 207, 24
- Ilbert et al. (2006) Ilbert, O., Arnouts, S., McCracken, H. J., et al. 2006, A&A, 457, 841
- Limousin et al. (2012) Limousin et al. 2012, A&A, 544, A71
- Livermore et al. (2017) Livermore, R. C., Finkelstein, S. L., & Lotz, J. M. 2017, ApJ, 835, 113
- Lotz et al. (2017) Lotz, J. M., Koekemoer, A., Coe, D., et al. 2017, ApJ, 837, 97
- McLeod et al. (2016) McLeod, D. J., McLure, R. J., & Dunlop, J. S. 2016, MNRAS, 459, 3812
- McLure et al. (2011) McLure, R. J., Dunlop, J. S., de Ravel, L., et al. 2011, MNRAS, 418, 2074
- Menci et al. (2016) Menci, N., Merle, A., Totzauer, M., et al. 2017, ApJ, 836, 61
- Merlin et al. (2015) Merlin, E., Fontana, A., Ferguson, H. C., et al. 2015, A&A, 582, A15
- Merlin et al. (2016) Merlin, E., Amorín, R., Castellano, M., et al. 2016, A&A, 590, A30
- Merlin et al. (2016b) Merlin, E., Bourne, N., Castellano, M., et al. 2016, A&A, 595, A97
- Peng et al. (2011) Peng, C. Y., Ho, L. C., Impey, C. D., & Rix, H.-W. 2011, Astrophysics Source Code Library, ascl:1104.010
- Prevot et al. (1984) Prevot, M. L., Lequeux, J., Prevot, L., Maurice, E., & Rocca-Volmerange, B. 1984, A&A, 132, 389
- Santini et al. (2015) Santini, P., Ferguson, H. C., Fontana, A., et al. 2015, ApJ, 801, 97
- Schaerer de Barros (2009) Schaerer, D., & de Barros, S. 2009, A&A, 502, 423
- Smith et al. (2009) Smith, G. P., Ebeling, H., Limousin, M., et al. 2009, ApJL, 707, L163
- Vanzella et al. (2017) Vanzella, E., Calura, F., Meneghetti, M., et al. 2017, MNRAS, 467, 4304
- Vanzella et al. (2017b) Vanzella, E., Castellano, M., Meneghetti, M., et al. 2017, arXiv:1703.02044
- Wei et al. (2017) Zheng, W., Zitrin, A., Infante, L., et al. 2017, ApJ, 836, 210