IDCS J1426+3508: Discovery of a Massive, IR-Selected Galaxy Cluster at
Abstract
We report the discovery of an IR-selected massive galaxy cluster in the IRAC Distant Cluster Survey (IDCS). We present new data from the Hubble Space Telescope and the W. M. Keck Observatory that spectroscopically confirm IDCS J1426+3508 at . Moreover, the cluster is detected in archival Chandra data as an extended X-ray source, comprising 54 counts after the removal of point sources. We calculate an X-ray luminosity of ergs s-1 within arcsec ( Mpc diameter), which implies M M⊙. IDCS J1426+3508 appears to be an exceptionally massive cluster for its redshift.
Subject headings:
galaxies: clusters: individual — galaxies: distances and redshifts — galaxies: evolution1. Introduction
Galaxy clusters present the opportunity for addressing two main issues in astrophysics. Cosmological parameters may be constrained with knowledge of the abundance of clusters if the selection function, redshifts, and masses are adequately known (Haiman et al., 2001; Holder et al., 2001). Even individual clusters may be useful if they are sufficiently massive and at sufficiently high redshift because they trace the extreme tail of the cosmological density field (Matarrese et al., 2000; Mortonson et al., 2011).
Impressive progress has been made over the past decade in finding and characterizing galaxy clusters at . At the number of massive, high redshift clusters that have been identified and confirmed is still very limited. The accounting depends on the definitions both of what constitutes a massive cluster and what constitutes confirmation. Here we assume a high-redshift cluster massive enough to be useful for constraining cosmological parameters has an M200 mass (the mass within the region where the cluster overdensity is 200 times the critical density) of at least M☉. Such objects are the progenitors of present-day clusters with masses of M⊙. We suggest that confirmation of a cluster candidate requires at least spectroscopic redshift members within 2 Mpc.
At several systems have been published in the literature. The estimated masses of the cluster at identified by both Papovich et al. (2010) and Tanaka et al. (2010), the cluster at reported by Henry et al. (2010), and the cluster at published by Gobat et al. (2011) appear to be less than M⊙. Santos et al. (2011) and Fassbender et al. (2011) have published spectroscopically confirmed X-ray selected clusters at and , respectively, both of which appear to have cluster masses of a few M⊙, although in the former case only 3 member galaxies have spectroscopic redshifts. Thus there are only 1–2 galaxy clusters at that are massive, confirmed, and published. A number of proto–clusters have been identified and confirmed at (Pentericci et al., 2000; Venemans et al., 2007; Capak et al., 2011). While very interesting, these systems appear to be in the very early stages of cluster formation–their masses remain difficult to estimate and their natures difficult to interpret.
The other main astrophysical use for galaxy clusters is to help us understand galaxy evolution. In particular, they contain the majority of the massive early-type galaxies in the universe, so these environments offer excellent places in which to study such galaxies. To trace the evolution of massive early-type galaxies over their full lifetime, we must identify and study the precursor cluster population over a large redshift range. This kind of archaeology requires the evolutionary precursors to be identified in large, statistically useful samples, which are sensitive down to the group scale at relatively high redshift, since the massive clusters at are built from groups and low-mass clusters at .
Identifying and then characterizing cluster samples adequate to these two tasks has been challenging. Optical methods of finding clusters tend to succeed up to redshifts only slightly beyond unity. Neither X-ray nor Sunyaev-Zel’dovich (SZ) cluster surveys currently have the sensitivity to reach cluster masses down to at and above over appreciable areas.
The IRAC Shallow Cluster Survey (ISCS, Eisenhardt et al., 2008) originally was designed to create a stellar mass-selected selected sample of galaxy clusters spanning . The ISCS is drawn from the Spitzer/IRAC Shallow Survey (Eisenhardt et al., 2004), which imaged most of the Boötes field in the NOAO Deep Wide-Field Survey (Jannuzi & Dey, 1999). Clusters were identified by searching for 3-dimensional spatial overdensities in a 4.5m selected galaxy sample with robust photometric redshifts (Brodwin et al., 2006). The selection is independent of the presence of a red sequence. There are 335 clusters and groups in the ISCS sample, identified over 7.25 deg2 within the Boötes field, and 1/3 of the groups/clusters are at . We have spectroscopically confirmed over 20 clusters spanning . (Stanford et al. 2005; Brodwin et al. 2006; Elston et al. 2006; Eisenhardt et al. 2008; Brodwin et al. 2011, Brodwin et al. in prep, Zeimann et al. in prep).
We have begun extending the work of the ISCS to more effectively target the higher redshift range by making use of the deeper IRAC imaging obtained by the Spitzer Deep, Wide Field Survey (SDWFS, Ashby et al., 2009). The IRAC exposure time of SDWFS is that of the IRAC data used in the ISCS, which has allowed us to better identify cluster candidates at in the Boötes field as part of the new IRAC Distant Cluster Survey (IDCS). Here we report the first spectroscopic confirmation of one of these candidates, IDCS J1426+3508 at , which we believe to be a massive cluster. Companion papers in this volume report on the mass of this cluster (Brodwin et al. 2012) and on a gravitational arc (Gonzalez et al. 2012). We present the optical and infrared imaging in §2, the spectroscopic observations and resulting redshifts in §3 and §4, respectively, and the X-ray observations in §5. We use Vega magnitudes and a WMAP7+BAO+ CDM cosmology (Komatsu et al., 2011): , , and km s-1 Mpc-1.
2. Optical and Near-IR Imaging
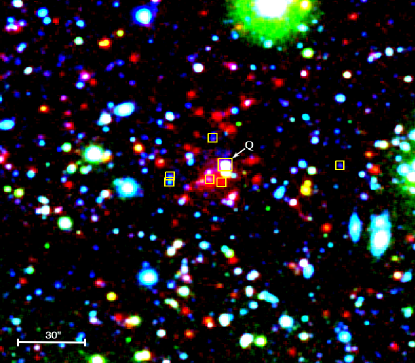
The cluster candidate was originally identified using the SDWFS data matched with the NDWFS optical data following the same procedures described in detail in Eisenhardt et al. (2008). A significant overdensity in the 3-dimensional space of (RA, Dec, and photometric redshift) was selected for further study. A color image made from the NDWFS optical IRAC data is shown in the left panel of Figure 1 where a tight red group of galaxies is visible. The photometric redshift estimate of the cluster is .
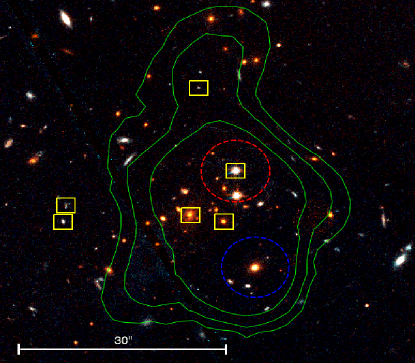
Deeper optical and NIR follow-up imaging was obtained with the Hubble Space Telescope using ACS and WFC3. F814W exposures were obtained with ACS in one pointing for s and reduced using standard procedures. The WFC3 data were obtained with the F160W filter in two slightly overlapping pointings, each comprising 700 s of integration time in dithered exposures. The WFC3 data were reduced using standard procedures with the MultiDrizzle software. A pseudo-color image constructed from the registered ACS and WFC3 imaging is shown in the right panel of Figure 1.
Photometry was measured from the HST imaging using SExtractor (Bertin & Arnouts, 1996) in dual image mode with sources detected in the WFC3 image. Colors were measured in 0.8 arcsec diameter apertures, and MAG_AUTO is used as a“total” magnitude. Our photometric uncertainties are dominated by sky shot noise. We estimated the uncertainties from the distribution of sky background measurements in 5000 randomly placed 0.8″ apertures. These sky measurements are roughly normally distributed; we estimate by fitting a Gaussian to the left-half of the distribution (which is uncontaminated by light from objects). We verified this procedure by confirming that it produces the correct scaling in photometric scatter of sources detected in the sets of dither images before making the final stack.
Morphologies of the galaxies in the WFC3 image were determined by using Galapagos (Haussler et al., 2011) to run GALFIT (Peng et al., 2010). Galapagos measures the sky around every galaxy and uses the basic isophotal parameters measured by source extractor to generate a first guess set of Sersiç parameters for each galaxy. It then uses these values to fit a single Sersiç profile to every galaxy with GALFIT, simultaneously fitting close neighbors. We use the Sersiç index to classify galaxy morphologies as being either early-type () or late-type (.
3. Spectroscopy
3.1. Keck Optical Spectra
Spectra with the Low-Resolution Imaging Spectrograph (LRIS; Oke et al. 1995) on Keck I were acquired on UT 2011 April 28 and 29 using slitlets, the G400/8500 grating on the red side, the D680 dichroic, and the 400/3400 grism on the blue side. On the first night when the seeing was 06 and conditions were mostly clear, data were obtained in one mask in six 1200 s exposures. On the second night when the seeing varied in the range arcsec with light cirrus, data were obtained in a second mask for ten 1200 s exposures. These data were split into slitlets which were separately reduced following standard procedures. The relative spectral response was calibrated via longslit (with a width of 1.0 arcsec) observations of Wolf 1346 and Feige 34 (Massey & Gronwall, 1990).
3.2. WFC3 Grism Spectra
The WFC3 data were obtained on 2010 November 6. A total exposure time of 11247 s was used for the G102 observation and 2011 s for G141; a single pointing was used in both cases. We targeted the cluster candidate with both IR prisms so as to provide continuous wavelength coverage of nearly 1 m, allowing for conclusive identifications of spectral features in the redshift range of interest. The FWHM of an unresolved emission line is 2 pixels, which corresponds to a spectral resolution of 49 Å for G102 and 93 Å for G141. The low grism resolution blends some of the more common emission lines such as H+N[II] and [OIII]5007+[OIII]4959. This typically results in a redshift uncertainty of 0.01.
In slitless spectroscopy, a direct image is a necessary companion to the grism image in order to zero-point the wavelength scale and to properly extract spectra. We chose broadband filters that closely matched the grism spectral coverage: F105W for G102 and F140W for G141. The object positions and sizes measured from the direct images are used to establish the location, wavelength zero point, and spectral extraction widths of the objects in grism images. The data were reduced using aXe (Kummel et al. 2008). The calibration files111http://www.stsci.edu/hst/wfc3/analysis/grism_obs/calibrations/ used were the best available at the time of the reductions. The steps used to extract spectra are very similar to that found in WFC3 Grism Cookbook222http://www.stsci.edu/hst/wfc3/analysis/grism_obscookbook.html and a more detailed description will be presented in Zeimann et al. (in preparation).
4. Redshift Measurements
The reduced optical spectra were visually inspected to determine redshifts. Despite the long integrations on a 10 m telescope using a spectrograph with new red-sensitive CCDs, sufficiently good LRIS spectra were obtained on only two phot-z selected objects which were found to have features such as D4000, B2640 and the MgII2800 absorption line that are characteristic of older stellar populations. These features indicate for both objects, which were confirmed by the WFC3 IR grism spectroscopy.
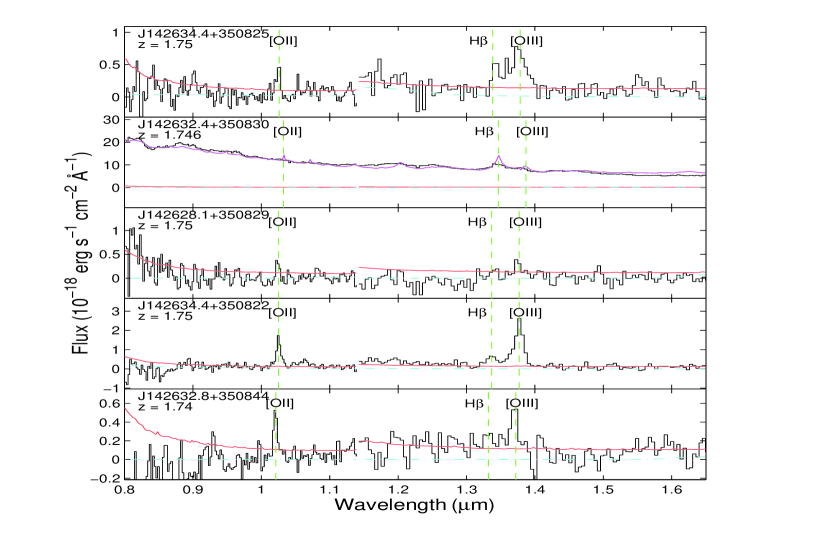
The NIR grism spectra were first visually inspected. Emission lines were identified as being blended H+[NII], [OIII]5007[OIII]4959, H, or [OII]3727. The spectra were also cross-correlated with spectral templates (taken from www.sdss.org/dr7/algorithms/spectemplates/index.html) to automatically determine redshifts where feasible (Zeimann et al., in prep). Contamination from overlapping spectra was estimated using a Gaussian emission model, scaled by the measured broadband magnitudes from the direct images (F105W or F140W; see the WFC3 Grism Cookbook for more details). This process is handled in the standard reduction package of aXe. For the ETG spectra, we experimented with a range of SDSS galaxy templates and found that the LRG template was the best match to our grism data.
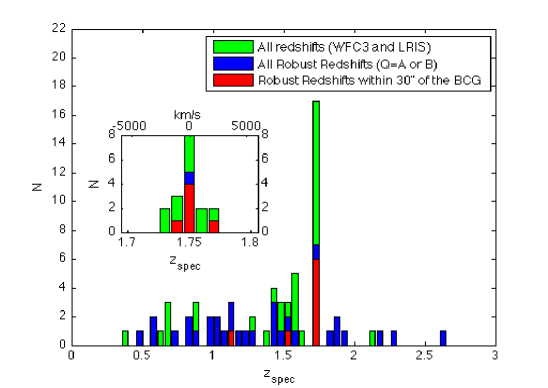
The spectra of cluster members are shown in Figure 2 and Figure 3. The latter shows in the bottom panel a simulated early-type galaxy spectrum, as observed by WFC3 with our observational parameters. aXeSim was used with an SDSS LRG template spectrum333http://www.sdss.org/dr7/algorithms/spectemplates/index.html, redshifted to , to create a mock grism image. A 1-D extraction was performed with the same reduction procedure as was used with the actual WFC3 grism observations. The redshifts determined from both the LRIS and WFC3 spectroscopy on the identified cluster members are summarized in Table 1, along with magnitudes and colors obtained from the HST images. The overall redshifts obtained in the vicinity of the cluster candidate with the LRIS and WFC3 grism data are presented in Figure 4.
| ID | R.A. (J2000) | Decl. (J2000) | z | Instrument | F160W | F814W-F160W | |
|---|---|---|---|---|---|---|---|
| J142632.9+350823aaBrightest Cluster Galaxy | 14:26:32.95 | 35:08:23.6 | 1.75 | 0.01 | WFC3/LRISbbLRIS spectrum shows a break at 2640 Å and a very red continuum consistent with | 19.25 | 4.47 |
| J142632.5+350822 | 14:26:32.55 | 35:08:22.5 | 1.75 | 0.01 | WFC3/LRISccLRIS spectrum shows a red continuum and a MgII2800 absorption feature consistent with | 20.41 | 4.16 |
| J142632.4+350830ddQSO | 14:26:32.40 | 35:08:30.8 | 1.746eeAGES redshift; WFC3 grism redshift is 1.77 | 0.01 | WFC3 | 18.59 | 1.08 |
| J142632.8+350844 | 14:26:32.85 | 35:08:44.4 | 1.74 | 0.01 | WFC3 | 22.81 | 1.20 |
| J142634.4+350825 | 14:26:34.43 | 35:08:25.1 | 1.75 | 0.01 | WFC3 | 22.63 | 1.14 |
| J142634.4+350822 | 14:26:34.47 | 35:08:22.4 | 1.75 | 0.01 | WFC3 | 22.27 | 0.90 |
| J142628.1+350829 | 14:26:28.15 | 35:08:29.7 | 1.75 | 0.01 | WFC3 | 23.00 | 1.43 |
5. X-ray Observations
The Boötes field has been surveyed previously with ACIS-I onboard the Chandra X-Ray Observatory (Murray et al., 2005; Kenter et al., 2005; Brand et al., 2006). At the position of IDCS J1426+3508, exposures totalling 9.5 ks are available from the Chandra archive. These data are split between an observation of 4.8 ks on UT 2006 July 30 (ObsID 3621) and an observation of 4.7 ks on UT 2006 August 21 (ObsID 7381). We processed the data following standard procedures using the Chandra Interactive Analysis of Observations (CIAO; V4.2) software. We initially identified good-time intervals for the exposures, yielding a total effective exposure time of 8.3 ks for IDCS J1426+3508.
The cluster is clearly detected as an extended source in both individual exposures, as well as in the stacked exposure. The cluster is approximately 6.5 arcmin off-axis in both exposures, for which the Chandra point-source 50% encircled energy radius is 2 arcsec at 1.5 keV. This complicates the X-ray analysis, as an optically bright quasar confirmed to be in the cluster (see Section 5) is only 9 arcsec from the brightest cluster galaxy (BCG). In addition, we identify an X-ray point source associated with a radio source that is 12 arcsec to the SW, at 14:26:32.2, +35:08:14.9. This source, confirmed as an emission line galaxy at in our WFC3 grism data, has an integrated 21 cm flux density of 95.3 mJy from the FIRST survey (Becker et al., 1995). Given the signal to noise ratio and the large off-axis angle of the available X-ray observations, it is challenging to disentangle the extended cluster emission from the point source contributions. However, as seen in the right panel of Figure 1, IDCS J1426+3508 is clearly associated with diffuse X-ray emission that extends beyond the point-source contributions from the two AGN. We see no evidence in the WFC3 grism spectroscopy, which covers the central 2 arcmin of the cluster, for other AGN which could contribute to the X-ray emission. We have also used the SDWFS IRAC photometry to construct a two-color diagram to search for obscured AGN (following Stern et al. 2005) which might contribute to the measured X-ray flux. In addition to the QSO and the radio source already described, there is one more object within the X-ray measurement aperture which has IRAC colors typical of obscured AGN.
To extract the X-ray counts due to the cluster, we masked the three AGN (the QSO, the radio source, and the IRAC AGN) using a conservative 5 arcsec radius aperture, corresponding to the 90% encircled energy radius at the observed off-axis-angle of the cluster. We expect that the unmasked flux from the two AGN to contribute only one photon to the measured flux. We then extracted cluster source counts in the 0.5 - 7 keV range within a 1 arcmin radius aperture centered on the cluster BCG. This aperture approximately corresponds to a radius of 500 kpc at the cluster redshift. Response matrices and effective areas were then determined for each detected source. Within the measurement aperture, there are background-corrected counts in the keV range, after masking out the two central AGN. We used XSPEC (V12.6.0) to fit the background-subtracted X-ray spectrum with the MEKAL hot, diffuse gas model (Mewe et al., 1985) using the Wisconsin photo-electric absorption cross-section (Morrison & McCammon, 1983). The temperature was fixed at 5 keV and the abundance at 0.3 M⊙, with a Galactic absorption of 1.3 at the target position. We determined a Galactic absorption-corrected flux of ergs cm-2 s-1 in the keV range, which translates to an X-ray luminosity of ergs s-1 at . The X-ray flux changes by only 7% if the X-ray temperature is varied from 4 to 6 keV.
Using the MLX relation of Vikhlinin et al. (2009), we estimate from the luminosity that . We caution that the use of this scaling relation requires a significant extrapolation in redshift. This and other systematic uncertainties (such as removal of X-ray point sources) are expected to dominate over statistical errors. To estimate a total cluster mass, we next assume an NFW density profile (Navarro et al., 1997) and the mass-concentration relation of (Duffy et al., 2008). The resulting , where the uncertainty is determined only from the statistical measurement error.
6. Galaxy Populations
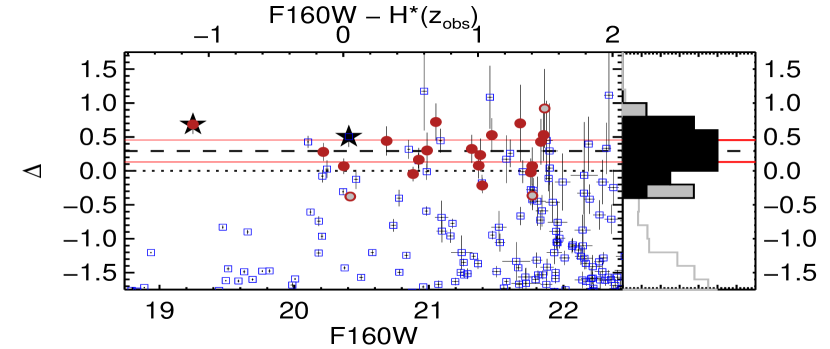
Figure 5 presents the photometric and morphological information for all the objects in the 7.7 arcmin2 area centered on the cluster where the ACS and WFC3 imaging overlap. While it is possible to see a red sequence of early-type galaxies in Figure 5, the spread and location is different from that of the red sequence in massive clusters at . To isolate a sample of probable cluster members in the color-magnitude diagram we carry out the following multi-step procedure. First, we determined the relative offset between the object colors and the expected color-magnitude relation at this redshift (based on a model for Coma with ; see Eisenhardt et al. (2007) for details). The range (corresponding to colors F814W F160W ) is the color cut used to select member galaxies on the red sequence. We initially define the cluster red sequence as galaxies brighter than that are chosen by the above color cut in , where is passively evolved from the luminosity of Coma early-type galaxies. Most of the objects in this color-selected red sequence do not have spectroscopic or photometric redshift information, and so the initial red sequence sample may suffer from interloper contamination. For the purpose of studying the cluster red sequence, we choose to restrict consideration to morphologically selected early-type galaxies, keeping objects with . We discard objects with colors more than two absolute deviations from the central red sequence color, where the deviation is the median of the absolute value of the of the potential red sequence objects. Objects removed in the latter step are shown with a gray dot in Figure 6. The remaining objects in the red sequence sample are represented by the red points in Figure 6.
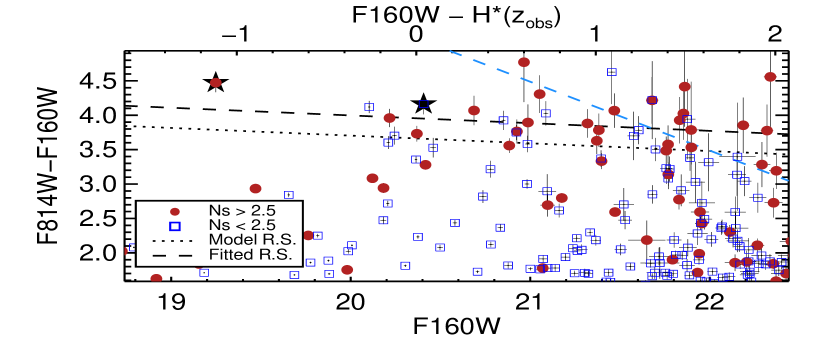
To measure the color and scatter of this red sequence sample down to F160W , we use the biweight estimates of location and scale (Beers et al., 1990). We calculate the intrinsic scatter in the red sequence sample by subtracting in quadrature the median color error from the biweight scale estimate. The red horizontal lines in Figure 6 are offset a distance above and below the median color of the red sequence. We estimate uncertainties by performing these calculations on 1000 bootstrap resamplings, from which we measure the scale of the resulting color and distributions using their median absolute deviation. The intrinsic scatter in the observed colors of the red sequence galaxies is mag; transformed to the rest frame the intrinsic scatter is . The median color of the morphologically-selected red sequence sample is F814W F160W , which is redder than the expected color, derived from a simple passive evolution model with a (Bruzual & Charlot, 2003, 2007 version). A model with an earlier formation epoch, , predicts a color which is closer to the observed F814W F160W colors of the morphologically-selected red sequence.
The cluster includes a fairly large brightest cluster galaxy. Profile fitting using GALFIT determined a Sersiç index of , kpc, and a total F160W magnitude which is approximately 2.0 magnitudes brighter than for a passively-evolving galaxy formed at (Bruzual & Charlot, 2003). From the F160W total magnitude, we determine a rest frame assuming the passive evolution model to transform to rest V-band. The size and luminosity of this BCG is similar to a BCG at , which is remarkable since it is at .
7. Discussion
IDCS J1426+3508 is a newly discovered galaxy cluster at , which places it among the few such systems currently known at , when massive clusters may be first forming. Using a combination of optical multi-object Keck spectroscopy and infrared HST/WFC3 grism spectroscopy, we have confirmed 7 cluster members in IDCS J1426+3508 within a radius of 2 Mpc, all but one of which are within a radius of 250 kpc. The extended X-ray emission described in Section 4 indicates that this cluster is gravitationally bound and already has a mass greater than M⊙.
The properties of the galaxies in the cluster indicate that the cluster is far from settled in terms of star formation. Most of the spectroscopic member galaxies are very blue (c.f. Table 1) and show emission lines in their spectra indicative of on-going star formation or AGN activity. The red sequence itself has a larger amount of scatter, mag, compared to in a similar observed color in XMMU J22352557, a slightly more massive cluster at somewhat lower redshift, (Strazzullo et al., 2010). The intrinsic scatter in IDCS J1426+3508 is reasonable for a population of galaxies whose stars formed at . The median color of these galaxies matches the prediction for simple passive evolution if the stars in the red sequence galaxies were formed at (Bruzual & Charlot, 2003, 2007 version). This is in contrast to the cluster at (Papovich et al., 2010; Tanaka et al., 2010) in which the red sequence has a younger . The red sequences may have different median colors because of the difference in the cluster masses, in that IDCS J1426+3508 is more massive and so may have formed earlier. Reddening by dust could cause the redder colors in IDCS J1426+3508, though there is no reason to suspect unusual amounts of dust in this cluster. Indeed, most of the spectroscopically confirmed members are fairly blue.
8. Conclusions
We have presented optical and NIR spectroscopy of galaxies in IDCS J1426+3508, an IRAC-selected galaxy cluster candidate, which indicate this is a bona fide cluster of galaxies at . The available Chandra data show a faint but clearly extended X-ray source at this location. Along with the centrally concentrated and regular distribution of red galaxies, the X-ray detection argues that IDCS J1426+3508 is gravitationally bound and in a relatively relaxed state.
The discovery of a cluster at with a soft X-ray flux greater than the ergs cm-2 s-1 limit of the upcoming eROSITA mission (Predehl et al., 2010), scheduled for launch in 2014, promises exciting results for that mission. However, we note that at the 28 arcsec average resolution expected for the eROSITA slew survey, and even at the 15 arcsec on-axis resolution of eROSITA, it would have been very difficult to distinguish the AGN from the cluster emission. Without the AGN masked out in our Chandra data, the derived X-ray flux for IDCS J1426+3508 would be higher. As shown by e.g. Galametz et al. (2009), the fraction of galaxy clusters that host luminous AGN increases rapidly with redshift. Such AGN will make it challenging to draw firm cosmological evolutionary results from the eROSITA cluster sample without higher resolution X-ray follow-up.
With the higher resolution Chandra data currently available from the archive, the point-source corrected X-ray luminosity ergs s-1, which implies M M⊙. This is a surprisingly large cluster mass for this redshift and survey area, as will be addressed in forthcoming papers.
References
- Ashby et al. (2009) Ashby, M. L. N., et al. 2009, ApJ, 701, 428
- Becker et al. (1995) Becker, R., et al. 1995, ApJ, 450, 559
- Beers et al. (1990) Beers, T., et al. 1990, AJ, 100, 32
- Bertin & Arnouts (1996) Bertin, E., and Arnouts, S. 1996, A&A, 117, 393
- Bower et al. (1994) Bower, R. G., Bohringer, H., Briel, U. G., Ellis, R. S., Castander, F. J., and Couch, W. J. 1994, MNRAS, 268, 345
- Brand et al. (2006) Brand, K., et al. 2006, ApJ, 641, 140
- Brodwin et al. (2006) Brodwin, M., et al. 2006, ApJ, 651, 791
- Brodwin et al. (2007) Brodwin, M., Gonzalez, A. H., Moustakas, L. A., Eisenhardt, P. R., Stanford, S. A., Stern, D., and Brown, M. J. I. 2007, ApJ, 671, L93
- Brodwin et al. (2011) Brodwin, M., et al. 2011, ApJ, 732, 33
- Bruzual & Charlot (2003) Bruzual, G., and Charlot, S. 2003, MNRAS, 344, 1000
- Capak et al. (2011) Capak, P., et al. 2011, Nature, 470, 233
- Duffy et al. (2008) Duffy, A.R., et al. 2008, MNRAS, 390, L64
- Eisenhardt et al. (2004) Eisenhardt, P. R. M., et al. 2004, ApJS, 154, 48
- Eisenhardt et al. (2007) Eisenhardt, P. R. M., et al. 2007, ApJS, 169, 225
- Eisenhardt et al. (2008) Eisenhardt, P. R. M., et al. 2008, ApJ, 684, 905
- Elston et al. (2006) Elston, R. J., et al. 2006, ApJ, 639, 816
- Fassbender et al. (2011) Fassbender, R., et al. 2011, A&A, 527, L10
- Fruscione et al. (2006) Fruscione, A., et al. 2006, Proc. SPIE, 6270
- Galametz et al. (2009) Galametz, A., et al. 2009, ApJ, 694, 1309
- Gobat et al. (2011) Gobat, G., et al. 2011, A&A, 526, 133
- Haiman et al. (2001) Haiman, Z., et al. 2001, ApJ, 553, 545
- Haussler et al. (2011) Haussler, B., et al. 2011, ASPC,442, 155
- Henry et al. (2010) Henry, J. P., et al. 2010, ApJ, 725, 615
- Holder et al. (2001) Holder, G., et al. 2001, ApJ, 560, L111
- Jannuzi & Dey (1999) Jannuzi, B. T. and Dey, A. 1999, in ASP Conf. Ser. 191 — Photometric Redshifts and the Detection of High Redshift Galaxies, p. 111
- Kenter et al. (2005) Kenter, M., et al. 2005, ApJS, 161, 9
- Komatsu et al. (2011) Komatsu, E., et al. 2011, ApJS, 192, 18
- Kubo et al. (2007) Kubo, J. M., Stebbins, A., Annis, J., Dell’Antonio, I. P., Lin, H., Khiabanian, H., and Frieman, J. A. 2007, ApJ, 671, 1466
- Kümmel et al. (2009) Kümmel, M., Walsh, J. R., Pirzkal, N., Kuntschner, H., and Pasquali, A. 2009, PASP, 121, 59
- Massey & Gronwall (1990) Massey, P., & Gronwall, C., 1990, ApJ, 358, 344
- Matarrese et al. (2000) Matarrese, S., et al. 2000, ApJ, 541, 10
- Mewe et al. (1985) Mewe, R., Gronenschild, E. H. B. M., and van den Oord, G. H. J. 1985, A&AS, 62, 197
- Morrison & McCammon (1983) Morrison, R. and McCammon, D. 1983, ApJ, 270, 119
- Mortonson et al. (2011) Mortonson, M.J., et al. 2011, PhysRevD, 83, 23015
- Murray et al. (2005) Murray, S. S., et al. 2005, ApJS, 161, 1
- Navarro et al. (1997) Navarro, J., et al. 1997, ApJ, 490, 493
- Oke et al. (1995) Oke, J. B., et al. 1995, PASP, 107, 375
- Papovich et al. (2010) Papovich, C., et al. 2010, ApJ, 716, 1503
- Peng et al. (2010) Peng, C.Y., et al. 2010, AJ, 139, 2097
- Pentericci et al. (2000) Pentericci, L., et al. 2000, A&A, 361, L25
- Predehl et al. (2010) Predehl, P., et al. 2010, arXiv:1004.5219v2
- Santos et al. (2011) Santos, J. S., et al. 2011, A&A, 531, L15
- Stanford et al. (2005) Stanford, S. A., et al. 2005, ApJ, 634, L129
- Stanford et al. (2006) Stanford, S. A., et al. 2006, ApJ, 646, L13
- Strazzullo et al. (2010) Strazzullo, V., et al. 2010, A&A, 524, 17
- Tanaka et al. (2010) Tanaka, M., Finoguenov, A., and Ueda, Y. 2010, ApJ, 716, L152
- Vanden Berk et al. (2001) Vanden Berk, B., et al. 2001, AJ, 122, 549
- Venemans et al. (2007) Venemans, B., et al. 2007, ApJ, 716, 1503
- Vikhlinin et al. (2009) Vihklinin, A., et al. 2009, ApJ, 692, 1033