The XMM Cluster Survey: A Massive Galaxy Cluster at
Abstract
We report the discovery of XMMXCS J2215.9-1738, a massive galaxy cluster at , which was found in the XMM Cluster Survey. The cluster candidate was initially identified as an extended X-ray source in archival XMM data. Optical spectroscopy shows that 6 galaxies within a 60 arcsec diameter region lie at . Model fits to the X-ray spectra of the extended emission yield keV (90% confidence); if there is an undetected central X-ray point source then keV. The bolometric X-ray luminosity is ergs s-1 over a 2 Mpc radial region. The measured , which is the highest known for a cluster at , suggests that this cluster is relatively massive for such a high redshift. The redshift of XMMXCS J2215.9-1738 is the highest currently known for a spectroscopically-confirmed cluster of galaxies.
Subject headings:
galaxies: clusters — galaxies: evolution — galaxies: formation1. Introduction
High redshift galaxy clusters provide important laboratories for the study of structure formation and galaxy evolution. They also can be used to constrain cosmological parameters independent of the Cosmic Microwave Background and supernova methods. The number of known clusters at is currently small ( with X-ray confirmation: e.g. Stanford et al. 2001, 2002; Rosati et al. 2004; Mullis et al. 2005), but growing rapidly thanks to new surveys being carried out in the X-ray (e.g. Romer et al., 2001; Mullis et al., 2005; Bremer et al., 2006; Barkhouse et al., 2006), optical (e.g. Gladders & Yee, 2005), and infrared (e.g. Stanford et al., 2005). In the near future, Sunyaev-Zel’dovich surveys should also provide large numbers of high redshift clusters (Carlstrom et al., 2002). We announce here the discovery of a high redshift cluster in the XMM Cluster Survey (XCS: Romer et al., 2001) and the measurement of its X-ray temperature. At , XMMXCS J2215.9-1738 is the most distant cluster with spectroscopic redshift confirmation to date. Unless otherwise noted, we assume , , and km s-1 Mpc-1.
2. Observations
2.1. X-ray
XMM-Newton is the most sensitive X-ray spectral-imaging telescope deployed to date. The XCS identifies cluster candidates in the XMM data archive using the signature of X-ray extent. With a projected total area of 500 deg2, the XCS is expected to catalog several thousand clusters out to a redshift of (Romer et al., 2001). To date, 1,847 XMM observations have been processed using an automated pipeline, resulting in a survey area of 168 deg2 at . This is the net area available for cluster searching and excludes the Magellanic Clouds, artifacts due to out of time events, and X-ray sources that extend over a large fraction of the field of view, such as supernova remnants, Galactic clusters, or low redshift galaxy clusters. The initial catalog contains 1764 cluster candidates (see Davidson et al. in preparation and Sabilri et al. in preparation for details). Here we focus on 5 moderately deep observations of varying length in the direction of the quasar LBQS 2212-1759, which were obtained in 2000 and 2001. An extended source was detected at the 4 or greater level by the XCS pipeline at the same location, from the center of the field of view, in 3 of the 5 observations. The combined XMM exposure time, after correction for solar flares etc., in the direction of the cluster candidate is 237 ks (MOS1). The typical point source positional uncertainty in the XCS is 3 arcsec at 9 arcmin off-axis (Davidson et al. in preparation) and we have verified this by checking the positions of three quasars in the summed X-ray data near the cluster candidate.
2.2. Optical and IR Imaging
An -band image of the area around XMMXCS J2215.9-1738 was found in the ESO Imaging Survey (Dietrich et al., 2005). This 9000 s image reaches a limiting magnitude of (Vega), and allows even early-type galaxies to be detected. On the basis of visual inspection of the -band image, XMMXCS J2215.9-1738 was selected as a possible galaxy cluster, worthy of spectroscopic followup.
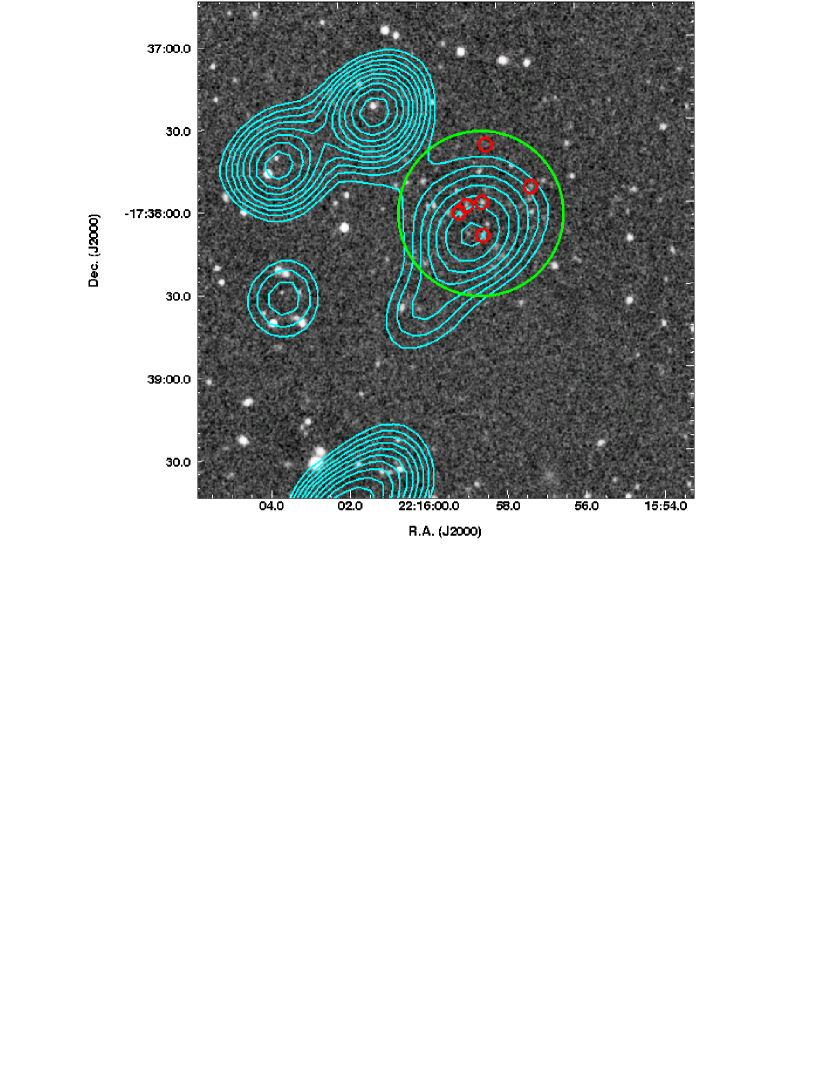
Subsequent to the first slit mask spectroscopy (see below), -band imaging was carried out on the 200 inch telescope at Palomar on 2005 October 21. A total of 3240 s of exposure time was obtained in clear conditions, and the images were reduced following standard infrared procedures. The reduced image was calibrated onto the Vega system by comparison of instrumental magnitudes for stars with the same objects in the 2MASS database. The image is shown in Figure 1, along with contours of the X-ray emission. The X-ray emission from the cluster candidate is clearly extended compared to the three nearby point sources. None of the X-ray sources in Figure 1 (the cluster, the three point sources, or the southern extension) has been cataloged previously, based on an examination of the NED and SIMBAD databases.
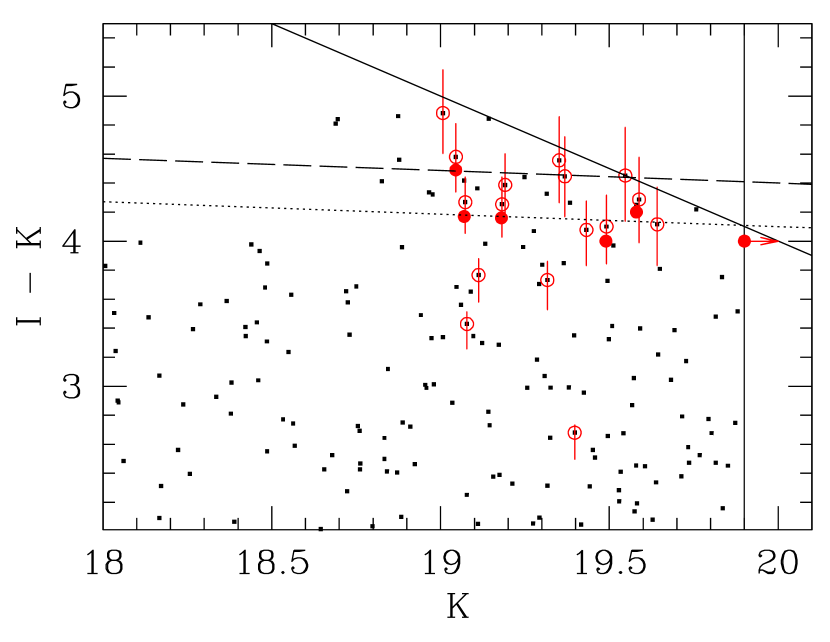
The and band images were photometered using SExtractor. Objects were detected on the image and then aperture magnitudes of diameter arcsec were measured on both images using the same SExtractor catalog. The resulting color-magnitude diagram shown in Figure 2 was used for target selection for the second mask in the spectroscopic followup program.
2.3. Keck Spectroscopy
The first spectroscopic followup was carried out using the Deep Imaging Multi-Object Spectrograph (DEIMOS: Faber et al. 2003) at the Keck II telescope on UT 2005 September 1. Targets were selected from the -band image to have and be located in the central few arcmin of the area around the X-ray candidate cluster. The slits had widths of 1.0 arcsec and minimum lengths of 5 arcsec. We used the 600ZD grating, which is blazed at 7500 Å, to cover a nominal wavelength range of 5000 to 10000 Å. The dispersion of 0.65 Å pixel-1 resulted in a spectral resolution of Å. Of particular note is that this spectral resolution is adequate for being able to detect both lines in the [O II] doublet. We obtained 5 1800 s exposures with this setup in photometric conditions with 1.1 arcsec seeing. The observations were carried out with the slitlets aligned close to the parallactic angle.
A second slit mask was observed, again using DEIMOS at the Keck II telescope, on UT 2005 November 5. For this mask, we were able to use the color information seen in Figure 2 to select targets likely to be in the cluster by choosing objects in the area of the color-magnitude diagram where the red sequence is expected for a cluster. These observations were conducted in poor conditions, with 1.5 arcsec seeing. A total of 5400 s of exposure time was obtained with the second mask.
The slitmask data for the two masks were separately reduced using the DEEP pipeline. A relative flux calibration was obtained from longslit observations of the standard stars G191B2B and Wolf 1346. One–dimensional spectra were extracted from the sum of the reduced data for each slitlet.
3. Results
3.1. X-ray Analysis
To examine the X-ray emission from the intracluster medium, we need to account for contamination from the nearby point sources. At the same time it behooves us to allow for a possible central point source, such as a galaxy with an active galactic nucleus, that would affect our attempts to extract information on e.g. the temperature of the ICM. Using SHERPA, we carried out 2-dimensional fitting of the detected nearby point sources simultaneously with fitting of the extended emission from the cluster candidate. In addition to the obvious point sources to the east of the cluster, we have included a variable strength point source fixed at the center of the extended emission. The profile of the X-ray emission is shown in Figure 3. The best fitting model combined with the point sources is shown, along with a PSF which indicates that extended emission is present. The brightest point sources are obvious as bumps in the profile at radii of 37, 60, and 75 arcsec. We find that a central point source contributes at most 10% of the counts within the central arcsec region. The best fitting model for the extended component has a core radius of kpc and .

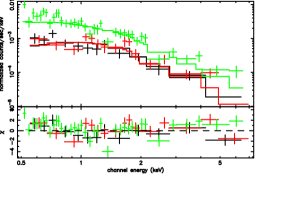
Next we used the results of this two-dimensional fitting procedure to accurately determine the spectrum of the extended emission after correction for contamination by the point sources. The appropriate counts due to the point sources were included (as fixed models normalized to the results of the spatial analysis) while carrying out the fitting of the extended source spectrum as described below. We have extracted a spectrum for the cluster candidate using photons detected within a radius of . We extracted MOS1, MOS2 and pn spectra from each XMM observation with an exposure time ks made towards the cluster. We generated a combined spectrum for each camera and these are presented in the left panel of Figure 4. Spectral fitting was carried out using XPSEC v11.3.1s (Arnaud, 1996) using the MEKAL models (Mewe et al., 1986) modified with an interstellar absorption (McCammon & Sanders, 1990) appropriate for the Galactic column density at that location. A local background correction was made using a spectrum extracted from a radius region at the same off-axis angle () as the cluster; this avoids having to carry out an energy dependent vignetting correction of the background. To find the best fit spectrum, we limited the fit to the energy range keV and grouped the data so that there were a minimum of 20 counts per bin. The number of background corrected counts in that energy range (summed across all three cameras) was 1100 in the measurement aperture, after correction for the point sources. We fixed the hydrogen column density to the Dickey & Lockman (1990) value, the metal abundance to times the Solar value and, initially, the redshift to the Keck spectroscopic value, . After accounting for all point sources including the possible central source, the best fit temperature of the extended emission was found to be keV (90% confidence limits). If there is no central point source, then the best fit temperature of the ICM would be keV. The best fit model, and its residuals, are shown in Figure 4. Using this spectrum, we have determined the cluster flux to be erg s-1 cm-2 [0.5 -2.0 keV], extrapolated to a region 2 Mpc in radius using the best fit model. For the same 2 Mpc aperture, the luminosity of the ICM is erg s-1 in the [] keV band, and erg s-1 in a bolometric band [ keV].
3.2. Optical Spectroscopy
Visual inspection of the reduced spectra from both DEIMOS masks yielded redshifts for objects. The 6 galaxies listed in Table 1 lie within 30 arcsec of the X-ray centroid and have concurrent redshifts . In 3 of the 6 spectra, the [O II] doublet is detected and clearly split. The other three objects have spectra which show features from the redshifted 4000Å and 2900Å breaks. The spectrum of one of the cluster members, ID 14339, is shown in Figure 5. In addition to these 6 galaxies we consider to be members of the cluster, three more galaxies were spectroscopically identified with redshifts at . However, they lie approximately arcmin from the X-ray centroid, so are not (yet) clearly members of the cluster.

3.3. Optical and Infrared Photometry
The color–magnitude diagram for all objects in a 3′ area at the cluster is shown in Figure 2. The objects within 30 arcsec of the X-ray centroid are circled in red. The 6 galaxies with concurrent spectroscopic redshifts are shown by the solid red points. The scatter seen in the colors of the member galaxies is dominated by the photometric uncertainties in the photometry so is not indicative of the intrinsic scatter in the red sequence in this cluster. Also plotted in Figure 2 are two estimates of the expected color of L∗ early–type galaxies. Using a simple passive evolution model calculated from the GISSEL of Bruzual & Charlot (2003) and our assumed cosmology, we calculated the expected colors for a single 100 Myr burst stellar population of solar metallicity stars formed at and , with slopes assumed to be the same as those in Coma for a similar rest frame color. As can be seen in Figure 2, the colors of the member galaxies are consistent with those exected for early-type galaxies whose stars formed at .
4. Discussion
Analyses of our combined X-ray imaging spectroscopy, optical spectroscopy, and optical-IR imaging provide strong evidence that XMMXCS J2215.9-1738 is a massive galaxy cluster at . At least 10 galaxy clusters with and keV are expected to be present in our current XCS area of 168.2 deg2, if the universe is assumed to be flat with and (WMAP - Spergel et al. 2006). This estimate requires the relation between cluster mass and X-ray temperature to be normalized so as to reproduce the local abundance of X-ray clusters (HIFLUGCS - Reiprich & Böhringer 2002). However, it should be noted that these assumptions require that a local 5 keV cluster would need to have a mass, within an overdensity of 500 with respect to the critical density, of around (Pierpaoli et al., 2003; Viana et al., 2003), about 2/3 smaller than is implied by the most recent observational data (Arnaud, Pointecouteau & Pratt, 2005; Vikhlinin et al., 2006).
With the combination of the serendipitous searches for clusters in the XMM archival data (Romer et al., 2001; Mullis et al., 2005), and the on-going wide-area surveys such as UKIDSS (Lawrence et al. in preparation) and the RCS (Gladders & Yee, 2005) the time finally is ripe for the identification of large samples of clusters. The construction of such samples will pave the way towards a better understanding of the origin of galaxy clusters and their constituent galaxy populations.
References
- Arnaud (1996) Arnaud, K. in Astronomical Data Analysis Software and Systems V, 1996, A.S.P. Conf. Ser., 101, G. Jacoby & J. Barnes, eds., 17
- Arnaud, Pointecouteau & Pratt (2005) Arnaud, M., Pointecouteau, E., Pratt, G. W., 2005, å, 441, 893
- Barkhouse et al. (2006) Barkhouse, W. et al. 2006, ApJ, in press
- Bremer et al. (2006) Bremer, W. et al. 2006, MNRAS, in press
- Bruzual & Charlot (2003) Bruzual, G. & Charlot, S. 2003, MNRAS, 344, 1000
- Carlstrom et al. (2002) Carlstrom, J. E., Holder, G. P., & Reese, E. D. 2002, ARA&A, 40, 643
- Dickey & Lockman (1990) Dickey, J.M. & Lockman, F.J., 1990, ARA&A, 28, 215
- Dietrich et al. (2005) Dietrich, J.P. et al. 2005, astro-ph/0510223
- Faber et al. (2003) Faber, S. et al. 2003, SPIE, 4841, 1657
- Gladders & Yee (2005) Gladders, M. & Yee, H. 2005, ApJS, 157, 1
- McCammon & Sanders (1990) McCammon, D. & Sanders, D.T. 1990, ARA&A, 28, 657
- Mewe et al. (1986) Mewe, R., Lemen, J.R. & van der Oord, G.H.J., 1986, A & AS, 62, 197
- Mullis et al. (2005) Mullis, C. et al. 2005, ApJ, 623, L85
- Pierpaoli et al. (2003) Pierpaoli, E., Borgani, S., Scott, D., & White, M., 2003, MNRAS, 342, 163
- Reiprich & Böhringer (2002) Reiprich, T. H. & Böhringer, H., 2002, ApJ, 567, 716
- Romer et al. (2001) Romer, K., Viana, P.T.P, Liddle, A.R., & Mann, R.G. 2001, ApJ, 547, 594
- Rosati et al. (2004) Rosati, P. et al. 2004, AJ, 127, 230
- Spergel et al. (2006) Spergel, D.N. et al., 2006, submitted to ApJ, astro-ph/0603449
- Stanford et al. (2001) Stanford, S.A., et al. 2001, ApJ, 552, L504
- Stanford et al. (2002) Stanford, S.A., Holden, B.,Rosati, P., Eisenhardt, P., Stern, D., Squires, G., & Spinrad, H. 2002, AJ, 123, 619
- Stanford et al. (2005) Stanford, S.A. et al. 2005, ApJ, 634, L129
- Viana et al. (2003) Viana, P. T. P., Kay, S. T., Liddle, A. R., Muanwong, O., Thomas, P. A., 2003, MNRAS, 346, 319
- Vikhlinin et al. (2006) Vikhlinin, A., Kravtsov, A., Forman, W., Jones, C., Markevitch, M., Murray, S. S., Van Speybroeck, L., 2006, ApJ, 640, 661
| ID | R.A.aaCoordinates are J2000. | Dec.aaCoordinates are J2000. | spec-z | ||
|---|---|---|---|---|---|
| 14651 | 22:15:58.364 | 17:37:37.5 | 19.9 | 4.0 | 1.4526 |
| 14478 | 22:15:57.233 | 17:37:53.1 | 19.58 | 4.20 | 1.4537 |
| 14378 | 22:15:58.879 | 17:37:59.6 | 19.49 | 4.00 | 1.451 |
| 14289 | 22:15:58.488 | 17:38:10.4 | 19.04 | 4.49 | 1.453 |
| 14339 | 22:15:59.057 | 17:38:02.0 | 19.18 | 4.16 | 1.4467 |
| 14389 | 22:15:58.479 | 17:37:58.6 | 19.07 | 4.17 | 1.452 |