Dust in the Reionization Era: ALMA Observations of a 8.38 Gravitationally-Lensed Galaxy
Abstract
We report on the detailed analysis of a gravitationally-lensed Y-band dropout, A2744_YD4, selected from deep Hubble Space Telescope imaging in the Frontier Field cluster Abell 2744. Band 7 observations with the Atacama Large Millimeter Array (ALMA) indicate the proximate detection of a significant 1mm continuum flux suggesting the presence of dust for a star-forming galaxy with a photometric redshift of . Deep X-SHOOTER spectra confirms the high redshift identity of A2744_YD4 via the detection of Lyman emission at a redshift =8.38. The association with the ALMA detection is confirmed by the presence of [OIII] 88m emission at the same redshift. Although both emission features are only significant at the 4 level, we argue their joint detection and the positional coincidence with a high redshift dropout in the HST images confirms the physical association. Analysis of the available photometric data and the modest gravitational magnification () indicates A2744_YD4 has a stellar mass of 2109 M⊙, a star formation rate of M⊙/yr and a dust mass of 6106 M⊙. We discuss the implications of the formation of such a dust mass only 200 Myr after the onset of cosmic reionisation.
Subject headings:
galaxies: distances and redshifts , evolution, formation, star formation – cosmology : early universe – submillimeter: galaxies – infrared: galaxies1. Introduction
The first billion years of cosmic history represents the final frontier in assembling a coherent physical picture of early galaxy formation and considerable progress has been enabled through observations from space-based telescopes and ground-based optical and near-infrared spectrographs. Early progress in the Hubble Ultra Deep and the CANDELS fields (Ellis et al. 2013, Bouwens et al. 2015, Finkelstein et al. 2015) has been complemented by surveys through lensing clusters (Postman et al. 2012), an approach culminating in Hubble Space Telescope’s (HST) flagship program, the Frontier Fields (FF) (Lotz et al., 2016). By harnessing the magnification of a foreground massive cluster, galaxies of more representative luminosities can be probed (e.g. Laporte et al. 2014, Laporte et al. 2016, Coe et al. 2015, Atek et al. 2015). Collectively, the blank field and cluster surveys have located several hundred star-forming galaxies in the redshift range corresponding to the era when it is thought hydrogen was photo-ionized (Planck Collaboration et al. 2016, Robertson et al. 2015). In addition to the population demographics analyzed through photometric data from HST and the Spitzer Space Telescope, spectroscopic diagnostics are being gathered to gauge the nature of their stellar populations and their capability for releasing the necessary number of ionizing photons (for a recent review see Stark 2016).
The completion of the Atacama Large Millimeter Array (ALMA) brings the possibility of measuring the dust content of these early systems. Dust is likely produced by the first supernovae and timing its formation would measure the extent of previous star formation. Moreover, dust can affect many of the key physical properties derived from photometric data. While early ALMA observations focused on distant 6 massive ultra-luminous galaxies, targeting the more representative lower mass systems in the reionization era brought into view by gravitational lensing is an interesting approach. An exciting early result was the detection of a significant dust mass in a 7.5 galaxy whose rest-frame UV colors indicated little or no reddening (Watson et al., 2015).
The present paper is concerned with the follow-up and analysis of an ALMA continuum detection in the FF cluster Abell 2744 close to a Y-band dropout, A2744_YD4, at a photometric redshift of 8.4. In Section 2 we introduce the ALMA 1mm continuum detection and its possible association with A2744_YD4 and justify a photometric redshift of 8 for this galaxy. In Section 3 we analyze deep X-Shooter spectra which confirms the redshift via the detection of Ly emission supported by O [III] 88 m emission within the Band 7 ALMA data. We deduce the physical properties and dust mass of A2744_YD4 in Section 4 and discuss the implications for early dust formation in 5. Throughout this paper, we use a concordance cosmology (, and km sec-1 Mpc-1 and all magnitudes are quoted in the AB system (Oke & Gunn, 1983).
2. Imaging Data
Here we describe the ALMA data in which a high- candidate is detected at 0.84mm, and the public imaging data used to constrain its Spectral Energy Distribution (SED).
2.1. Deep ALMA band 7 observations
A deep ALMA Band 7 map (ID 2015.1.00594, PI: Laporte) of the FF cluster Abell 2744 centered at 0.84mm (=356 GHz) was observed on July 2016 during 2.5hrs. The data was reduced using the CASA pipeline (McMullin et al., 2007) with a natural weighting and a pixel size of 0.04”. Figure 1 reveals a source with greater than significance with a peak flux of 9.92.3 10-5 Jy/beam (uncorrected for magnification). The uncertainty and significance level was computed from the rms measured across a representative 22 arcmin field. The signal is seen within two independent frequency ranges (center panels in Figure 1) and the significance level is comparable to that claimed for Watson et al’s 7.5 lensed system although its observed flux is six times fainter. Taking into account the different magnification factors (see later), the intrinsic (lensing-corrected) peak fluxes are similar at 510-5 Jy. Dividing the exposure into two independent halves, the significances of 3.2 and 3.4 are consistent with that of the total exposure.
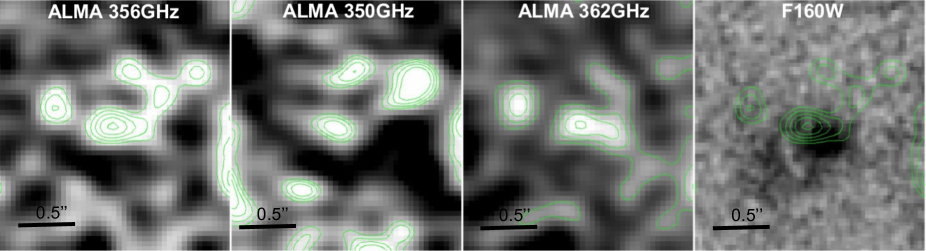
To identify the likely source, we examined the final version of the reduced HST data of Abell 2744 (ACS and WFC3) acquired between November 2013 and July 2014 as part of the Frontier Fields program (ID: 13495 – PI : Lotz), combining this with archival data from previous campaigns (ID : 11689 ; PI : Dupke – ID: 13386 ; PI : Rodney). Although there is some structure in the ALMA detection, it lies close to the source A2744_YD4 (F160W=26.3) at RA= 00:14:24.9, DEC=30:22:56.1(2000) first identified by Zheng et al. (2014). Correcting for an astrometric offset between HST positions and astrometry measured by the Gaia telescope (Gaia Collaboration, 2016), we deduce a small physical offset of 0.2 arcsec between the ALMA detection and the HST image.
2.2. Other Imaging Data
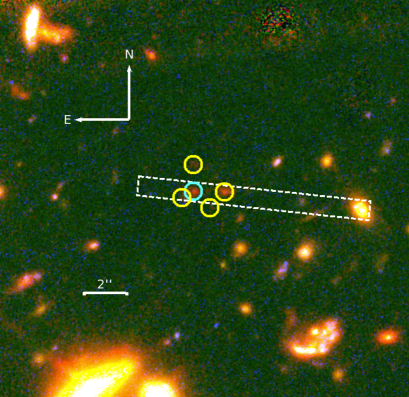
Deep data is also available from a 29.3 hrs HAWK-I image taken between October and December 2013 (092.A-0472 – PI: Brammer) which reaches a 5 depth of 26.0. Spitzer IRAC data obtained in channel 1 (3.6m) and 2 (4.5m) with 5 depths of 25.5 and 25.0 respectively carried out under DDT program (ID: 90257, PI: T. Soifer). We extracted the HST photometry on PSF-matched data using SExtractor (Bertin & Arnouts, 1996) v2.19.5 in double image mode using the F160W map for the primary detection (Figure 1). To derive the total flux, we applied an aperture correction based on the F160W MAG_AUTO measure (see e.g. Bouwens et al. 2006). The noise level was determined using several 0.2 arcsec radius apertures distributed around the source. The total magnitude of 26.45 0.33 was obtained using a 0.6 arcsec diameter aperture applying the correction estimated in Brammer et al. (2016). The uncertainty was estimated following a similar procedure to that adopted for the HST data. The Spitzer data was reduced as described in Laporte et al (2014) using corrected Basic Calibrated Data (cBCD) and the standard reduction software MOPEX to process, drizzle and combine all data into a final mosaic. As shown in Figure 2, four other galaxies are close to A2744_YD4, but only the other source within the X-shooter slit is comparably bright to A2744_YD4. We used GALFIT (Peng et al., 2002) to deblend the two sources and to measure their IRAC fluxes. We fitted both IRAC ch1 and ch2 images assuming fixed positions, those measured from the F160W image. Our photometry of A2744_YD4 is consistent with that published previously by the AstroDeep team (Merlin et al. 2016, Zheng et al. 2014 and Coe et al. 2015).
2.3. SED Fitting
We used several SED fitting codes to estimate the photometric redshift of A2744_YD4 and hence its implied association with the ALMA detection. In each case we fit all the available photometric data (HST-ACS, HST-WFC3, VLT HAWKI, Spitzer).
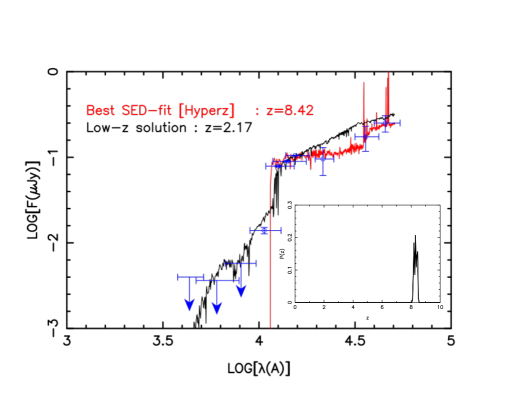
Firstly, we used an updated version of Hyperz (Bolzonella et al., 2000) with a template library drawn from Bruzual & Charlot (2003), Chary & Elbaz (2001), Coleman et al. (1980), and Leitherer et al. (1999) including nebular emission lines as described by Schaerer & de Barros (2009). We permitted a range in redshift (0 10) and extinction (0 3) and found the best solution at =8.42 (1), with no acceptable solution at lower redshift. Restricting the redshift range to 0 and increasing the extinction interval to (0 10), we found a low redshift solution at =2.17 but with a significantly worse 9.
We also made use of the Easy and Accurate Zphot from Yale (EAZY; Brammer et al. 2008) software. The SED fits adopted the standard SED templates from EAZY, as well as those from the Galaxy Evolutionary Synthesis Models (GALEV; Kotulla et al. 2009) including nebular emission lines as described by Anders & Fritze-v. Alvensleben (2003). Adopting a large redshift range (0 10) with no prior assumptions on the extinction, the best-fit has =8.38 in excellent agreement with that from Hyperz.
In summary, the photometry strongly supports a solution. A low solution is unlikely given the F814W - F125W 3mag break as well as the low statistical likelihood.
3. Spectroscopic Follow-up
3.1. X-Shooter Observations
Given the importance of confirming the presence of dust emission beyond 8, we undertook a spectroscopic campaign using X-Shooter/VLT (ID: 298.A-5012 – PI: Ellis). Between 24-27 November 2016, we secured 7.5 hours on-source integration with excellent seeing (0.6 arcsec ). We used a 5 arcsec dither to improve the sky subtraction and aligned the slit so that a brighter nearby source could verify the blind offset (see Fig. 2). The data was reduced using v2.8 of the ESO Reflex software combined with X-Shooter pipeline recipes v2.8.4.
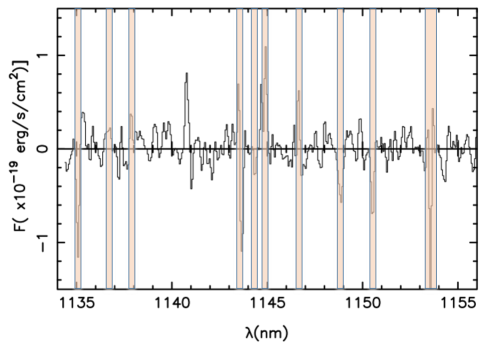
We visually inspected all 3 arms of the X-Shooter (UVB, VIS, NIR) spectrum and identified one emission line at =11408.4 Å with an integrated flux of =1.820.4610-18erg s-1 cm-2. By measuring the rms at adjacent wavelengths we measure the significance as 4.0. We checked the reliability of the line by confirming its presence on two independent spectral subsets spanning half the total exposure time (Figure 4). These half exposures show the line with significances of 2.7 and 3.0, consistent with that of the total exposure. No further emission lines of comparable significance were found. We explore two interpretations of this line at 11408 Å . It is either (1) one component of the [OII] doublet at a redshift 2.06, or (2) Ly at =8.38.
For (1), depending on which component of the [OII]3727,3730 doublet is detected, we expect a second line at either 11416.9 Å or 11399.8 Å . No such emission is detected above the 1 flux limit of 4.610-19 cgs. This would imply a flux ratio for the two components of 3.95 (2.02) at 1(2) , greater than the range of 0.35-1.5 from theoretical studies (e.g. Pradhan et al. 2006).
For (2) although the line is somewhat narrow for Ly (rest-frame width 20km s-1), its equivalent width deduced from the line flux and the F125W photometry is 10.7 2.7 Å , consistent with the range seen in other spectroscopically-confirmed sources (Stark et al., 2017). We detect no flux above the noise level at the expected position of either the CIV and [OIII] doublets at this redshift. However, at the expected position of the CIII] doublet, we notice a very marginal (2) feature at =17914.7Å (7.50.3510-19erg s-1 cm-2) seen on two individual sub-exposures. If this is CIII]1907Å (normally the brighter component ) at =8.396, the Ly- offset of 3383 km s-1 would be similar to that for a =7.73 galaxy (Stark et al., 2017). The other component would be fainter than 5.010-19erg s-1 cm-2 consistent with theoretical studies of this doublet (e.g. Rubin et al. 2004).
Previous spectroscopy of A2774_YD4 was undertaken by the GLASS survey (Schmidt et al., 2016) who place a 1 upper limit on any Lyman- detection at 4.410-18 erg s-1 cm-2, 2.4 times above our X-Shooter detection.
3.2. ALMA Observations
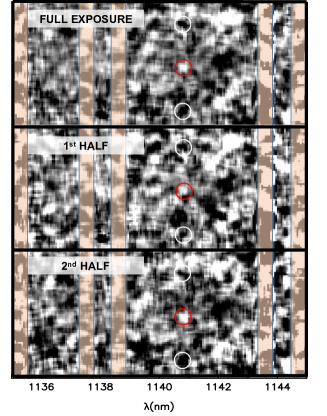
Only a few far infrared emission lines lines are detectable for sources in the reionization era (see eg. Combes 2013). Only the [OIII] 88m line at the =8.38 redshift of Ly- would be seen in the frequency range covered by our ALMA observations. Given the recent detection of this line in a 7.2 Lyman alpha emitter (Inoue et al., 2016), we examined our ALMA data for such a possibility. Searching our data in frequency space, we find a 4.0 narrow emission line offset by 0.35 arcsec from the astrometric position of A2744_YD4 at a frequency of 361.641 GHz. Dividing the exposure time in half, the line is detected with independent significances of 2.8 and 3.2, consistent with that of the total exposure. Assuming this line is [OIII] 88m, the redshift would be =8.382 (see Figure 5), leading to a Lyman- velocity shift of 70km s-1 in good agreement with that observed in a 7.2 galaxy (Inoue et al., 2016). Fitting the emission line with a Gaussian profile we derive a modest FWHM=49.8 4.2 km s-1 implying an intrinsic width of 43 km s-1. The emission line luminosity is estimated at 1.400.35108L⊙ without correction for magnification, which is 7 times fainter than that detected in Inoue et al’s 7.2 source. The peak line flux of A2744_YD4 is consistent with that computed from simulations in Inoue et al. (2014) (see their Fig. 3). Compared to the aforementioned lower mass source at 7.2, the narrower line width is perhaps surprising but may indicate its formation outside the body of the galaxy as inferred from the offset and recent simulations (Katz et al., 2016).
.
4. Physical Properties
One of the main objectives of this study is to utilize the spectroscopic redshift as well as the ALMA band 7 detection to estimate accurate physical properties for A27744_YD4, and particularly to constrain the dust mass for an early star forming galaxy.
4.1. Magnification
Estimating the magnification is critical to determine the intrinsic properties of any lensed source. Several teams have provided mass models for each of the six clusters. Moreover a web tool111https:archive.stsci.eduprepdsfrontierlensmodels#magcalc enables us to estimate the magnification for Abell2744_YD4 from parametric high resolution models, i.e. version 3.1 of the CATS model (Richard et al., 2014), version 3 of Johnson et al. (2014), version 3 of Merten et al. (2011) and version 3 of GLAFIC (Ishigaki et al., 2015). We took the average value with error bars corresponding to the standard deviation: =1.80.3.
4.2. The Star Formation Rate and Stellar and Dust Masses
The detection of dust emission in a =8.38 galaxy provides an unique opportunity to evaluate the production of dust, presumably from early supernovae in the first few 100 Myr since reionization began. The key measures are the dust and stellar masses and the likely average past star formation rate.
We first estimate some physical properties based on the ALMA continuum detection using a simple modified black body SED with the dust temperatures ranging from 35 to 55K and the dust emissivity fixed at 2. We found a total FIR luminosity ranging from 7.1 to 18.2 1010 L⊙ and a dust mass ranging from 1.8 to 10.4106 M⊙. These values are corrected for magnification and CMB heating.
We also ran an updated version of MAGPHYS (da Cunha et al., 2008) adapted for high- galaxies (da Cunha et al., 2015). The code estimates the properties of A2744_YD4 in two steps. First, it generates a library of model SEDs at the redshift of our source (8.38) in our 11 bands (7 from HST, the deep HAWKI Ks band, the two first IRAC channels and a synthetic filter of the ALMA band 7) for a wide range of variables including the star formation rate (SFR) and dust content. We generated a total of about 9 million models, including 25,000 IR dust emission models. MAGPHYS then derives the likelihood distribution of each physical parameter by comparing the observed SED with all the models in the library. In this way we derived the following properties: SFR=20.4 M⊙ yr-1; a stellar mass M⋆=(1.97)109 M⊙; a dust mass Mdust=(5.5)106 M⊙, and an extinction Av=0.74 with a dust temperature ranging from 37 to 63 K. The error bars are refer to 1 uncertainties. These values estimated with MAGPHYS using the full SED are consistent with those deduced solely from the ALMA continuum flux.
Although the uncertainties in these physical properties are large, our target is similar to the lensed source A1689-zD1 at 7.5 studied by Watson et al. (2015). Watson et al. 2015 reports M⋆=1.7109 M⊙ and SFRs 9 M⊙/yr. Their specific star formation rates (sSFR) are thus similar (1.0410-8 yr-1 for A2744_YD4 and 0.610-8 yr-1 for A1689-zD1) implying a mean lifetime for a constant SFR of 100 Myr. However, A1689-zD1 has a significantly larger dust mass of Mdust=4 107 M⊙. Possibly this is a consequence of continuous star formation over a longer period together with more advanced chemical enrichment.
5. Discussion
Zheng et al. (2014) identified A2744_YD4 as one member of a group composed of 5 galaxies with similar colors and photometric redshifts. Although there is no spectroscopic information for the others members, conceivably this group is contained within a single ionized bubble, which may explain the detection of the Lyman- emission in what is currently considered to be an epoch when the IGM is fairly neutral(Robertson et al., 2015). The putative group is contained within an area of 1.7 arcsec radius or 8.1 kpc. (Figure 2). A second group member was included on the X-shooter slit; although no emission was seen, it is over 1 mag fainter in continuum luminosity than A2744_YD4.
We finally turn to the implications of dust emission at such a high redshift. According to the most recent analyses of the history of cosmic reionization (Robertson et al. 2015, Planck Collaboration et al. 2016, Mesinger et al. 2016), significant star formation began at 10-12, about 200 Myr before the epoch at which A2744_YD4 is being observed. The dust output and rate of early supernovae is of course highly uncertain but, for a past average star formation rate of 20 yr-1, assuming a popular stellar initial mass function (e.g. Salpeter 1955) with a high mass power law slope of 7/3, we expect 0.2% of newly-born stars to exceed 8 and produce Type II SNe. Assuming each SN produces around 0.5 M⊙ of dust in its core (Matsuura et al., 2015), over 200 Myr this would yield around 4 106 M⊙ of dust in apparent agreement with the observations. However, this would not account for any dust lost to the system given typical velocities of ejection could be 102-3 km s-1.
These speculations are as far as we can proceed given the current uncertainties. The most important conclusion is that ALMA clearly has the potential to detect dust emission within the heart of the reionization era and thus further measures of this kind, in conjuction with spectroscopic verification both using ALMA and soon the James Webb Space Telescope, offers the exciting prospect of tracing the early star formation and onset of chemical enrichment out to redshifts of 10 and beyond.
References
- Anders & Fritze-v. Alvensleben (2003) Anders, P. & Fritze-v. Alvensleben, U. 2003, A&A, 401, 1063
- Atek et al. (2015) Atek, H., Richard, J., Jauzac, M., et al. 2015, ApJ, 814, 69
- Bertin & Arnouts (1996) Bertin, E. & Arnouts, S. 1996, A&AS, 117, 393
- Bolzonella et al. (2000) Bolzonella, M., Miralles, J.-M., & Pelló, R. 2000, A&A, 363, 476
- Bouwens et al. (2006) Bouwens, R. J., Illingworth, G. D., Blakeslee, J. P., & Franx, M. 2006, ApJ, 653, 53
- Bouwens et al. (2015) Bouwens, R. J., Illingworth, G. D., Oesch, P. A., et al. 2015, ApJ, 803, 34
- Brammer et al. (2016) Brammer, G. B., Marchesini, D., Labbé, I., et al. 2016, ApJS, 226, 6
- Brammer et al. (2008) Brammer, G. B., van Dokkum, P. G., & Coppi, P. 2008, ApJ, 686, 1503
- Bruzual & Charlot (2003) Bruzual, G. & Charlot, S. 2003, MNRAS, 344, 1000
- Chary & Elbaz (2001) Chary, R. & Elbaz, D. 2001, ApJ, 556, 562
- Coe et al. (2015) Coe, D., Bradley, L., & Zitrin, A. 2015, ApJ, 800, 84
- Coleman et al. (1980) Coleman, G. D., Wu, C.-C., & Weedman, D. W. 1980, ApJS, 43, 393
- Combes (2013) Combes, F. 2013, in Astronomical Society of the Pacific Conference Series, Vol. 476, New Trends in Radio Astronomy in the ALMA Era: The 30th Anniversary of Nobeyama Radio Observatory, ed. R. Kawabe, N. Kuno, & S. Yamamoto, 23
- da Cunha et al. (2008) da Cunha, E., Charlot, S., & Elbaz, D. 2008, MNRAS, 388, 1595
- da Cunha et al. (2015) da Cunha, E., Walter, F., Smail, I. R., et al. 2015, ApJ, 806, 110
- Dunlop et al. (2016) Dunlop, J. S., McLure, R. J., Biggs, A. D., et al. 2016, ArXiv e-prints
- Ellis et al. (2013) Ellis, R. S., McLure, R. J., Dunlop, J. S., et al. 2013, ApJ, 763, L7
- Finkelstein et al. (2015) Finkelstein, S. L., Ryan, Jr., R. E., Papovich, C., et al. 2015, ApJ, 810, 71
- Gaia Collaboration (2016) Gaia Collaboration and Brown, A. G. A. and Vallenari, A. and Prusti, T. and de Bruijne, J. H. J. and Mignard, F. and Drimmel, R. and Babusiaux, C. and Bailer-Jones, C. A. L. and Bastian, U. and , et al. 2016, A&A, 595, A2
- Inoue et al. (2014) Inoue, A. K., Shimizu, I., Tamura, Y., et al. 2014, ApJ, 780, L18
- Inoue et al. (2016) Inoue, A. K., Tamura, Y. , Matsuo, H., et al. 2016, Science, 352, 1559
- Ishigaki et al. (2015) Ishigaki, M., Kawamata, R., Ouchi, M., et al. 2015, ApJ, 799, 12
- Johnson et al. (2014) Johnson, T. L., Sharon, K., Bayliss, M. B., et al. 2014, ApJ, 797, 48
- Katz et al. (2016) Katz, H. and Kimm, T. and Sijacki, D. and Haehnelt, M. et al. 2016, arXiv, 1612, 01786
- Kinney et al. (1996) Kinney, A. L., Calzetti, D., Bohlin, R. C., et al. 1996, ApJ, 467, 38
- Kotulla et al. (2009) Kotulla, R., Fritze, U., Weilbacher, P., & Anders, P. 2009, MNRAS, 396, 462
- Laporte et al. (2016) Laporte, N., Infante, L., Troncoso Iribarren, P., et al. 2016, ApJ, 820, 98
- Laporte et al. (2014) Laporte, N., Streblyanska, A., Clement, B., et al. 2014, A&A, 562, L8
- Leitherer et al. (1999) Leitherer, C. and Schaerer, D. and Goldader, J. D. and Delgado, R. M. G. and Robert, C., et al. 1999, ApJS, 123, 3
- Lotz et al. (2016) Lotz, J. M., Koekemoer, A., Coe, D., et al. 2016, ArXiv e-prints
- Matsuura et al. (2015) Matsuura, M., Dwek, E., Barlow, M. J., et al. 2015, ApJ, 800, 50
- McMullin et al. (2007) McMullin, J. P., Waters, B., Schiebel, D., Young, W., & Golap, K. 2007, in Astronomical Society of the Pacific Conference Series, Vol. 376, Astronomical Data Analysis Software and Systems XVI, ed. R. A. Shaw, F. Hill, & D. J. Bell, 127
- Merlin et al. (2016) Merlin, E., Amorín, R., Castellano, M., et al. 2016, A&A, 590, A30
- Merten et al. (2011) Merten, J., Coe, D., Dupke, R., et al. 2011, MNRAS, 417, 333
- Mesinger et al. (2016) Mesinger, A., Greig, B., & Sobacchi, E. 2016, MNRAS, 459, 2342
- Oke & Gunn (1983) Oke, J. B. & Gunn, J. E. 1983, ApJ, 266, 713
- Peng et al. (2002) Peng, C. Y. and Ho, L. C. and Impey, C. D. and Rix, H.-W. 2002, AJ, 124, 266
- Planck Collaboration et al. (2016) Planck Collaboration, Ade, P. A. R., Aghanim, N., et al. 2016, A&A, 594, A13
- Postman et al. (2012) Postman, M., Coe, D., Benítez, N., et al. 2012, ApJS, 199, 25
- Pradhan et al. (2006) Pradhan, A. K., Montenegro, M., Nahar, S. N., & Eissner, W. 2006, MNRAS, 366, L6
- Richard et al. (2014) Richard, J., Jauzac, M., Limousin, M., et al. 2014, MNRAS, 444, 268
- Robertson et al. (2015) Robertson, B. E., Ellis, R. S., Furlanetto, S. R., & Dunlop, J. S. 2015, ApJ, 802, L19
- Rubin et al. (2004) Rubin, R. H., Ferland, G. J., Chollet, E. E., & Horstmeyer, R. 2004, ApJ, 605, 784
- Salpeter (1955) Salpeter, E. E. 1955, ApJ, 121, 161
- Schaerer & de Barros (2009) Schaerer, D. and de Barros, S., 2009, A&A, 502, 423
- Schmidt et al. (2016) Schmidt, K. B., Treu, T., Bradač, M., et al. 2016, ApJ, 818, 38
- Stark (2016) Stark, D.-P. 2016, ARA&A, 54, 761
- Stark et al. (2017) Stark, D. P., Ellis, R. S., Charlot, S., et al. 2017, MNRAS, 464, 469
- Watson et al. (2015) Watson, D., Christensen, L., Knudsen, K. K., et al. 2015, Nature, 519, 327
- Zheng et al. (2014) Zheng, W., Shu, X., Moustakas, J., et al. 2014, ApJ, 795, 93