Measuring PAH Emission in Ultradeep Spitzer1 IRS2 Spectroscopy of High Redshift IR Luminous Galaxies
Abstract
The study of the dominant population of high redshift IR-luminous galaxies ( - L⊙ at ), requires observation of sources at the mJy level in the mid-IR. We present the deepest spectra taken to date with the Infrared Spectrograph (IRS) on the Spitzer Space Telescope. We targeted two faint ( mJy) sources in the Southern GOODS field at and . Spectra of the lower redshift target were taken in the observed-frame 8–21 micron range, while the spectrum of the higher redshift target covered 21–37 microns. We also present the spectra of two secondary sources within the slit. We detect strong PAH emission in all four targets, and compare the spectra to those of local galaxies observed by the IRS. The source appears to be a typical, star-formation dominated IR-luminous galaxy, while the source is a composite source with strong star formation and a prominent AGN. The IRAC colors of this source show no evidence of rest-frame near-infrared stellar photospheric emission. We demonstrate that an AGN which contributes only a small (%) fraction of the bolometric luminosity can produce enough hot dust emission to overwhelm the near-IR photospheric emission from stars. Such sources would be excluded from photometric surveys which rely on the near-IR bump to identify starbursts, leading to an underestimate of the star formation rate density.
1 Introduction
More than 70% of present day stars were formed at redshifts in galaxies undergoing an infrared luminous phase (Elbaz et al., 2002), identifiable as LIRGs ( L⊙) and ULIRGs ( L⊙). These sources are responsible for the peak of the faint 24 micron number counts (Papovich et al., 2004; Marleau et al., 2004). LIRGs are particularly important at , beyond which ULIRGs may dominate (Lagache et al., 2004; Chary et al., 2004; Pérez-González et al., 2005; Le Floc’h et al., 2005). As much as 85% of their luminosity may be generated by star formation (Bell et al., 2005; Brand et al., 2006), although that fraction is still uncertain.
IR luminous galaxies are rare in the present epoch, even though they may represent a generic phase typical of star formation activity in distant galaxies. Locally, 95% of ULIRGs and % of LIRGs are driven by mergers (e.g. Bushouse et al., 2002), which provide the primary means of triggering the required amounts of star formation and AGN activity. At higher redshifts, however, more gas rich systems may produce stars at high rates under less extreme conditions (e.g. Marcillac et al., 2006; Sajina et al., 2006). This evolution is seen in the optical morphologies of LIRGs (Bell et al., 2005), which span a range of Hubble types, from ellipticals to irregulars.
High redshift IR luminous galaxies are easily detected by Spitzer Space Telescope imaging surveys such as the Great Observatories Origins Deep Survey (GOODS; Giavalisco et al., 2004; Dickinson & GOODS Team, 2004) and the SIRTF Wide-Area Infrared Extragalactic Survey (SWIRE; Lonsdale et al., 2003). These sources have been beyond the reach of most large Spitzer spectroscopy programs of high redshift sources, which have been limited to mJy and IRS exposures of hour (Houck et al., 2005; Yan et al., 2005; Lutz et al., 2005), and typically sample only the most extreme ULIRGs ( L⊙).
MIR spectra of starbursts are dominated by emission from polycyclic aromatic hydrocarbons (PAHs) at 6.2, 7.7, 8.6, 11.3, 12.7, and 17 m and broad ( m) silicate absorption at 9.7 and 18 m (Genzel & Cesarsky, 2000, and the references therein). In local sources, the presence of PAH features, combined with the shape of the continuum, can be used to determine the nature of the emission (AGN vs. star formation) that dominates the bolometric luminosity of a source (e.g. Laurent et al., 2000; Peeters et al., 2004; Armus et al., 2006; Spoon et al., 2007). The reliability of these same diagnostics at high redshift requires further demonstration.
LIRGs at and ULIRGs at are likely to have flux densities on the order of 0.1 mJy at m, based on the bolometric corrections of Chary & Elbaz (2001). In principle, such sources should be observable with the Spitzer Infrared Spectrograph (IRS; Houck et al., 2004) in several hours, assuming that the noise characteristics do not change at faint fluxes and the signal-to-noise ratio scales with the square root of observing time. In order to push the limits of MIR spectroscopy with Spitzer, we targeted two faint (0.15 mJy) galaxies at , using 32 hours of Director’s discretionary time. In this paper, we present the results of those observations, demonstrating for the first time the capability of the IRS to detect continuum emission at such faint flux levels. Throughout, we assume a -dominated flat universe, with km s-1 Mpc-1, and .
2 Target Selection
We selected targets from the southern GOODS field. GOODS, by virtue of being the target of the deepest Spitzer, Hubble, Chandra, and ground-based imaging and spectroscopy provides the richest, most homogeneous dataset yet compiled to understand the formation and evolution of galaxies and AGN. While the Northern field offers certain advantages, the Southern field was better positioned for the available Spitzer scheduling window. Amongst the unique components of the Southern field are: the Hubble Ultra-Deep Field (UDF; Beckwith et al., 2006), which provides high resolution ACS imaging; extensive spectroscopic redshifts (Le Fèvre et al., 2004); ultradeep 24 m (Chary et al., 2006, in prep.) and shallow 16 m photometry (Teplitz et al., 2005); and ultradeep (1 Ms) Chandra 2–10 keV X-ray observations which provide the most complete census of AGN activity (Giacconi et al., 2002).
The goal of the observations was to examine relatively faint IR-luminous galaxies at high redshift. We estimate the IR luminosity from the observed 24 m flux. The MIR luminosity of local galaxies in the IRAS bright galaxy sample (Soifer et al., 1987) has been found to correlate strongly with their far-infrared luminosity, which is dominated by large, cool dust grains (Chary & Elbaz, 2001). This correlation has been applied to develop a library of model templates of the mid- and far-infrared SEDs of galaxies. The library consists of template SEDs across a range of luminosities, which can be redshifted to predict the MIR flux of a source with given luminosity at a redshift of interest. For each source in UDF, we select the template for which the library predicts the closest 24 m flux density at the appropriate redshift to apply a bolometric correction; we do not use the shorter wavelength IRAC measurements. The corrections based on the Chary & Elbaz (2001) and Dale & Helou (2002) template are used to derive an infrared luminosity ( m). The use of to predict using these templates is supported by the observation of sub-millimeter galaxies (SMGs) in GOODS-North by Pope et al. (2006).
We chose two sources in the UDF, one with a Chandra detection and one without. We chose each source to have a ratio (or upper limit) of X-ray to infrared luminosity of /, consistent with many SMGs (Alexander et al., 2005). We avoided sources that are only marginally resolved in HST imaging, which might indicate strong AGN contributions, and selected instead from those with fully resolved morphologies. A final criterion was the spectroscopically-confirmed redshift, which we selected to place the strongest PAH features in the center of one of the IRS passbands. By selecting one source at and one at , we were able to obtain spectra covering the 6.2, 7.7 and 8.6 m PAH features in just one or two slits.
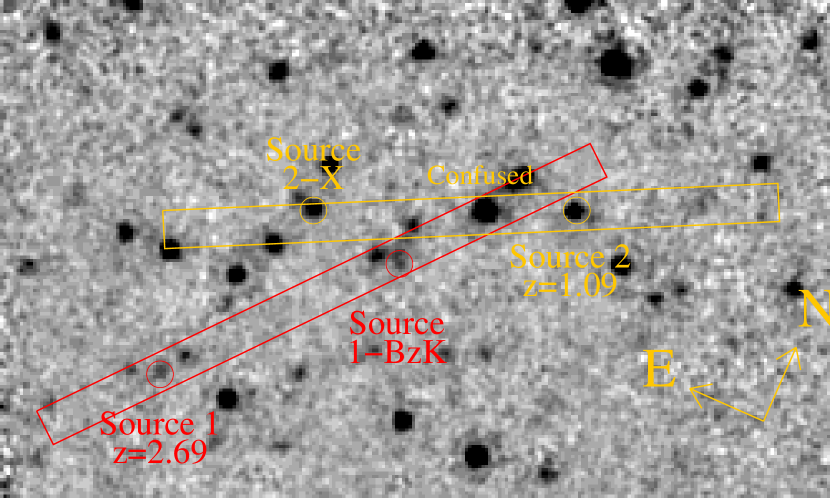
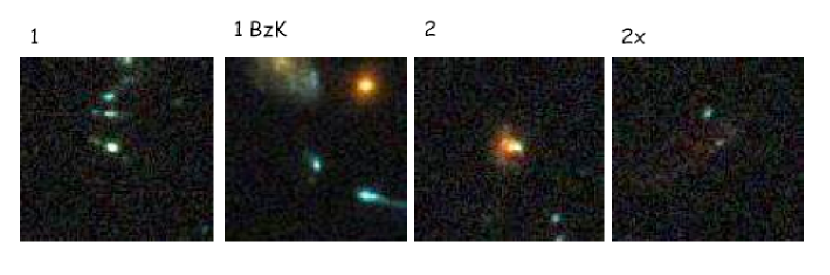
To meet these criteria, we selected a Chandra-detected source with 24 m flux density of mJy, hereafter Source 1, and a z=1.09 object with a 16 m flux density of mJy and no X-ray detection, hereafter Source 2. The infrared luminosity of these sources is approximately and , respectively, based on the Chary & Elbaz (2001) templates. The Chandra detection of Source 1 is only in the soft-band (0.5-2 keV), which does not immediately rule out star-formation as the origin of the X-ray emission. Given the experimental nature of the observations, we were given more than usual latitude to arrange the precise scheduling of the observations. Thus, we were able to choose observation dates which were favorable for including additional sources in the slit. Figure 1 shows the position of the slit overlayed on the 16 m map of the field. Two of the secondary objects in the slits are of great interest, and are indicated in the figure: (1) an X-ray source detected by Chandra in the soft-band only, but lacking an optical redshift, referred to hereafter as Source 2-x; and (2) a source lacking an optical redshift but selected to be at high redshift by the BzK selection technique (Daddi et al., 2004), referred to hereafter as Source 1-BzK. Figure 2 shows the ACS images of each source. Table 1 gives the photometry for the four sources of interest. Both LL slits also include a somewhat brighter object ( mJy) which appears to be a single source in the 16 m map, but IRAC imaging reveals it to be a blend of three sources. The slits were oriented to include this source in case the sensitivity proved worsen than predicted and the primary targets were not detected. Given its blended nature, it is not discussed further in the present paper.
The 16 m map shows that Sources 1 and 1-BzK have close, but clearly separated, companions of comparable brightness. They lie ″ from the targets, which is less than two pixels in LL-1 (5.1″ pixels). Although we do not know that the companions lie at different redshifts than the targets, we have no evidence that they do; we expect that they will not affect the detection of emission features, though they will make the measurement of equivalent widths less certain. The companion sources are of comparable brightness to the targets, so, if half of the companion light were to fall into the extraction aperture, the continuum would be overestimated by about 50%.
3 Observations and Data Reduction
We chose integration times that would likely achieve signal to noise ratios of in the continuum, so that the results could be evaluated even if no emission or absorption features were detected. We obtained the observations using a different observing mode (Staring or Mapping) for each object, in order to compare the effectiveness of the modes.
For the target, Source 2, we obtained a spectrum using the second order of the Long-Low module (LL-2, m). The spectrum was taken in Staring Mode, in which the target is placed at two “nod” positions within the slit. The observation was broken into two separate Astronomical Observing Requests (AORs), each of which contained 4.5 hours of on-source integration divided between the two nod positions. At each nod position we took 70 spectra of 120 sec ramp duration. The total on-source integration time was 9.4 hours, and the total AOR time with overhead was 11.9 hours. We also observed this target in the short-wavelength low-resolution slit, in the first order (SL-1), in a single AOR for three hours on source in Staring Mode.
For the higher redshift target, Source 1, we used the first order of the Long-Low module (LL-1, m). These observations were obtained in Mapping Mode, wherein the target is placed at multiple positions along the slit; we selected six map positions. The observations were broken into three AORs, each with 20 spectra of 120 sec ramp duration at each of the six map positions. The total on-source integration time of 12 hours, and the total AOR time with overhead was 15.4 hours. The observations are summarized in Table 2.
Observations were obtained on 06 August 2005 (SL-1), 10 August 2005 (LL-2), and 12 September 2005 (LL-1). The LL-2 AORs were executed consecutively. Two of the LL-1 AORs were consecutive, but there was a gap of more than 12 hours between the second and third observation. We observe no degradation in signal to noise resulting from the gap. All observations were scheduled immediately after the “skydark” calibrations in order to maximize the sensitivity by reducing the change of latent images from a preceding bright target.
To guard against the unlikely event of large deviations in telescope pointing, we obtained high accuracy peak-ups in the blue filter, using a star selected from the 2MASS catalog. During observation planning, we examined the MIPS 24 m image of the star prior to submitting the AORs to ensure that its flux was accurately predicted and that it had no bright neighbors. We inspected the PU data, to check that the centroid was reasonable and that the pointing was as expected. No problems were identified.
3.1 Data Reduction
The Basic Calibrated Data (BCD) were produced by the S13 pipeline at the Spitzer Science Center (SSC), which includes ramp fitting, dark sky subtraction, droop correction, linearity correction, flat fielding, and wavelength calibration (see the IRS Pipeline Handbook111http://ssc.spitzer.caltech.edu/irs/dh/). Further processing of the two dimensional dispersed frames is required before spectral extraction. In addition to the pipeline processing, we performed the following reductions: latent charge removal, rogue pixel interpolation, and residual sky subtraction.
A small fraction (1-2%) of charge on the detector persists between frames despite the resetting of the detector that occurs prior to every integration. This latent charge decays slowly over time and is removed by the annealing process. In the case of very faint sources, the source of latent charge is the zodiacal background. Over the course of a six hour AOR, this charge can build up to a significant level. We removed the latent signal by fitting the slope of the background with time. We measured the median background independently for each row of each frame, fitted the slope of these median values, and then subtracted this fit row-by-row from each frame. The background in BCD images is the residual after “skydark” subtraction in 3D. In the deep observations, the residual sky level was electrons per second, and the latent charge built up to electrons per second by the end of the AOR.
Unstable, or “rogue”, pixels are those which are usable in some AORs and not in others, depending on the recent history of the detector. A mask of known rogue pixels is provided by the SSC, and we identified further suspect pixels from the data themselves. We used the IRSCLEAN program provided by SSC to find rogue pixels in the 2D data, using its default settings. We further searched for pixels with abnormally high variance () with time. All pixels identified as rogue were interpolated over using IRSCLEAN.
Once the BCD data were “cleaned”, we created residual sky images from the data. In staring mode, we used the other nod position, and in mapping mode we used the other five map positions. In both cases, we used a resistant mean (removing outliers before calculating the mean) with time to calculate the sky value in each pixel.
The individual reduced frames were coadded to produce final 2D spectra at each nod or map position. One dimensional spectra were extracted using the SPICE software provided by the SSC. To minimize the noise contribution from the background, we used narrower extraction windows than the default. We used a window which expanded with wavelength and had a width of pixels at the blue end of each order. The “slit losses” introduced by the narrow window were estimated by extracting the spectrum of the standard star HR 7341 (taken in the same campaign) using both the standard and the new width. The correction factor varied with wavelength by % and had a mean value of 1.4. The spectra of HR 7341 were taken at the standard Staring Mode nod positions, so the Mapping Mode spectra may not be perfectly corrected (at the % level), due to flat field variation or pixel undersampling.
3.2 Noise Measurement
The signal to noise ratio (SNR) in the IRS spectra was measured using the variance of each pixel from frame to frame. We measured the variance in the sky frame for each pixel, scaled by e.g. for the nodded frames, and created two dimensional noise frames for input into SPICE. The uncertainties were then propagated by the extraction process. These uncertainties were checked against the standard deviation in the continuum of the 1D spectra at, for example, m in LL-1.
The SNR at 16 m in LL-2 and 24 m in LL-1 is generally consistent with the predictions of the SSC website (SPEC-PET). The predictions do not include noise introduced by the pipeline processing or spectral extraction. They also assume the spectra are smoothed to a resolution of , which we have not done. A 12 hour integration in LL-1 is expected to yield a uncertainty of 0.12 mJy at 24 m with spectral resolution smoothed to . Our measured uncertainty is mJy. SPEC-PET suggests a 9 hour integration in LL-2 will yield a uncertainty of 0.08 mJy at 16 m and . Our measured uncertainty is mJy. While both spectra achieve sensitivity close to the estimates, the Mapping Mode observation gives noticeably better results. Many factors may contribute to the difference between the modes, including better sky estimation in Mapping Mode, as well as an averaging over low level variation in the flat field.
The SNR varies strongly with wavelength, with noise rising sharply at the red end of each order. The shape of the error array measured in our data agrees well with the predictions of SPEC-PET, independent of the overall level.
4 Results
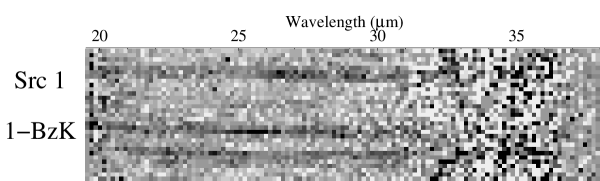
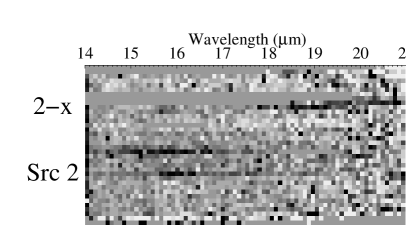
Figure 3 shows the 2D spectra of the sources. Both primary sources and secondary targets discussed above (Source 1-BzK and Source 2-x) are detected. Figures 4–7 show the extracted spectra of the primary and secondary targets. The continuum level is in good agreement with the estimate from the broad-band photometry at 16 and 24 m. Broad emission features, identified as polycyclic aromatic hydrocarbon (PAH) emission, are detected at rest wavelengths of 6.2, 7.7, and 8.6 m, along with the continuum at the blue end of LL-2 and LL-1 (except in Source 2-x).
The PAH features in Source 1-BzK confirm that it is at high redshift, indicating . The uncertainty here is based upon the narrower 6.2 m PAH emission feature, and excludes the broader 7.7 m feature. This redshift is consistent with the expectation from the optical photometry. The other secondary source, Source 2-x, shows a single definite emission line at an observed wavelength of m, and possibly broad enhanced emission at m. If the isolated line were identified with the 6.2 m PAH feature and the broad emission with the 7.7 m PAH feature, the object would lie at ,. Identification of the isolated emission line as the 7.7 m PAH feature (indicated ) is less likely, as that would center the broad emission at rest-frame 9.5 m, which might only be explained by strong silicate emission, which is unusual in a source with PAH emission.
Many infrared luminous sources show deep absorption troughs at rest-frame m from silicates. This rest-frame wavelength is at the red end of the order for all target spectra and thus the presence of the absorption is difficult to establish.
We present estimates of the equivalent width (EQW) of the PAH emission lines in each object in Table 3. The continuum was measured on both sides of the line, when detected, and assumed to have negligible slope across the line. The continuum in all four objects is similar, showing shallow or no slope across the modest restframe wavelength range covered by each order.
5 Discussion
Sources 1, 2, and 1-BzK all show strong PAH emission. Source 2-x has emission that may arise from PAHs as well. Figure 8 compares the spectra of each source with the starburst template spectrum of Brandl et al. (2006). The PAH features in all four sources are broadly similar to the template. Local starbursts and star-forming ULIRGs typically have rest-frame equivalent widths between and m for both the 6.2 and 7.7 m features, and equivalent width ratios between these features of around unity (Brandl et al., 2006; Armus et al., 2006). Our UDF sources show slightly lower rest-frame EQW(6.2), and the ratio of EQW(7.7)/EQW(6.2) appears larger by a factor of about two in the sources and a factor of about 1.5 for the source. This difference is largely attributable to the low continuum near the 7.7 m feature in the high redshift objects. The continuum is detected only at 3–4 confidence, so this result is hard to quantify. The presence of close companions to the sources also contributes to the lower EQW (see section 2).
At low redshift, PAH emission is usually associated with star formation. Sources with strong AGN generally have very weak or absent PAH emission. The strength of the PAH emission can thus be used to estimate the relative contribution of star formation to the bolometric luminosity (e.g. Laurent et al., 2000; Peeters et al., 2004), so these spectra are suggestive of starburst sources. It is not surprising that Source 1-BzK or Source 2, a LIRG, show prominent PAH emission. However, one might have expected Source 1, which is detected in X-rays, to have weaker emission.
The wavelength coverage of the present observations is quite limited. We can extend the SED by considering additional observations of the GOODS fields: Spitzer IRAC data at 3.6, 4.5, 5.8, and 8 m; the 16 m IRS photometry (Teplitz et al. 2007, in prep.); and the HST/ACS and ground-based NIR imaging (Giavalisco et al., 2004). These extended SEDs are shown in Figures 9. The figure inset shows the wavelength region around the m opacity minimum in the stellar atmospheres of AGB stars. This photospheric emission “bump” is commonly observed in galaxies with large evolved stellar populations and is often used to identify potential massive starbursts (e.g. Lonsdale et al., 2005), as it is sensitive to a lack of hot dust emission, which would drown out the “bump.” However, the feature may also be prominent in relatively modest star-forming galaxies if they lack significant dust emission.
The extended SED shows that Source 2, at , appears indeed to be a typical, stellar-dominated LIRG, as predicted by its other properties. A clear emission peak is seen in the IRAC photometry at 1.6 m in the rest-frame.
Source 1 at , on the other hand, does not show this “bump.” In fact, its SED appears relatively featureless at all wavelengths shortward of 6.2 m, extending into the NIR and optical. This featureless SED is consistent with the expectation for an X-ray source at high redshift. Source 1, therefore, is likely to be a composite object containing an AGN which dominates the emission in the near-IR, swamping the 1.6 m bump, together with significant ongoing star formation which is responsible for the PAH emission in the rest-frame MIR. We also find that source 1-BzK has a MIR SED similar to that of Source 1, lacking a prominent 1.6 m bump.
If Source 1 is, indeed, a composite object, then our estimate of its luminosity, L⊙ based on a starburst template, may be too high. We can refine this estimate by scaling the luminosity of a local composite source. UGC 5101 is a local ULIRG that shows significant PAH emission, but also has optical line ratios consistent with an AGN which contributes less than 10% of the bolometric luminosity, but deep silicate absorption leaves open the possibility of a larger contribution (Armus et al., 2004). Normalizing the SED of UGC 5101 at 24 m to Source 1, we estimate the bolometric luminosity of Source 1 to be L⊙, a factor of about 2.5 less than using a pure starburst template. If we attribute all of the flux in Source 1 at restframe 5 m to an AGN, and scale a representative AGN template (05189-2524; Armus et al., 2006) to that flux, we find a contribution of L⊙ from the AGN to .
Using the UGC 5101 template suggests ratio of in Source 1, consistent with the ratio observed for radio-detected SMGs with significant AGN contribution (Alexander et al., 2005). The Chandra non-detection of Source 1-BzK and Source 2 sets limits on their ratios of about 0.001, which does not rule out the presence of a weak AGN in those objects. Source 2-x has a ratio of (similar to that of an AGN-dominated SMG) if it is at the adopted redshift.
5.1 The 1.6 m Bump vs. PAH emission
Source 1 likely includes a significant AGN contribution, combined with strong PAH features but lacks a 1.6 m bump. To quantify the sensitivity of the bump to the strength of an AGN contribution, we construct a simple model of composite objects by mixing the SEDs of a local starburst (NGC 7714) and a pure QSO (PG 0804+761), both of which are first normalized to have unit 1–1000 m luminosity. We find that even a weak (10% of the mixture) AGN may produce enough hot dust emission in the NIR to hide the 1.6 m bump, while leaving the PAH features easily detectable. This hot dust continuum does, however, noticeably reduce the EQW of the PAH emission. We plot a 10% AGN composite in comparison to Source 1 in Figure 8.
We can compare the PAH emission with the stellar bump in a variety of other objects. We can quantify the strength of the 1.6 m bump using the ratio of the rest-frame near-IR to slopes:
| (1) |
This parameter is large when the slopes show an inflection, as expected for a strong 1.6 m bump, but it is small when the slope of the SED is constant. In Figure 10 we show the strength of the parameter versus the equivalent width of the 6.2 m PAH emission feature for the UDF sources compared to the local ULIRGs and other high redshift targets. The value of was obtained by interpolating the observed SED to get the rest-frame photometry. In the figure, we indicate the average strength of the bump in a sample selected on the basis of that feature, by plotting the average value of for objects observed by Weedman et al. (2006), who obtained IRS spectra of sources in SWIRE fields with strong 1.6 m bumps. Note that the plotted value is not a selection limit, merely an indicative value. The local sources used for comparison are local ULIRGS observed by Armus et al. (2006). The near-IR photometry is taken from 2MASS (Skrutskie et al., 2006), using the Large Galaxy Atlas (Jarrett et al., 2003) where available and the Extended Objects catalog otherwise. We also plot the ratio that would be expected given the NGC 7714 plus QSO model for composite objects. We find that there is a general trend of high PAH EQW for objects with large 1.6 m bumps. While the uncertainties are large, the trend is about what is expected from the composite spectrum.
A number of factors complicate Figure 10. First, the model assumes that there is little extinction at 1.6 m. Strong dust reddening will reduce the value of by lowering the -band flux relative to the -band. The effect of additional reddening is shown in the figure. Secondly, the strength of the bump depends on the fraction of old stars in the source while the PAH emission depends on the number of young stars. In a sense, the average age of the population and the amount of dust determines an object’s location in Figure 10. Thus a source with a much older underlying population than NGC 7714 would have a higher ratio of to EQW(6.2) than the composite model. Conversely, a very young object lacking significant old stars could have a much lower ratio. Finally, we have implicitly assumed that the geometry of all sources is similar. Both the Spitzer photometry and spectroscopy of high redshift sources capture the light of the entire source, because high redshift sources are unresolved and fall within the entrance slit of the IRS. For local ULIRGs, on the other hand, the IRS entrance slit usually includes most of the MIR flux (Soifer et al., 2000; Armus et al., 2006; Surace et al., 2007), but is much smaller than the near-IR extent (Scoville et al., 2000). Therefore, for the local ULIRGs in Fig. 10 we have used the total NIR light instead of an aperture matched to the size of the IRS slit, simply to make comparison to the high-z sources less problematic.
5.2 Comparison with Other Surveys
The set of high redshift IRS spectra considered here is small, but we examine if it is typical of other objects targeted in this flux range.
First, we compare the properties of the faint, high- starbursts with more luminous high-z objects previously observed with the IRS. The largest samples were selected either using optical-to-MIR color properties or by selection at a longer wavelength, e.g. the sub-millimeter (Lutz et al., 2005). Houck et al. (2005) selected objects based on very faint () optical magnitudes and detectable ( mJy) 24 m flux densities. Yan et al. (2005) used a less severe selection function and also included the requirement of blue 8 to 24 m color.
The sources in the present sample are brighter in the optical than the Houck et al. sources, being detected at while the latter were undetected at the same brightness. The UDF sources are much bluer, as the Houck et al. sources are 5-10 times brighter at 24 m. This difference is not surprising given the rarity of the Houck et al. sources (33 in 8 square degrees). The sources in the present sample meet the Yan et al. selection criteria, but the lower redshift sources are bluer in color. The Houck et al. and Yan et al. samples find substantial numbers of objects with spectra showing little PAH emission, likely indicating AGN-dominated sources. These objects are brighter than those in the current data by a factor of , suggesting bolometric luminosities in excess of L⊙ if starburst-dominated templates are used; if the sources were AGN-dominated, a smaller bolometric correction would be appropriate and they might be closer in luminosity to the UDF sources. Two sources in the Yan et al. sample have measured PAH emission; the EQW(6.2) in one object is consistent with the UDF sources while the other has significantly weaker PAH emission.
The GOODS-South region has not been observed at submm wavelengths, so a direct comparison with SMGs is not possible. Lutz et al. (2005) obtained IRS spectra of two SMGs at , one of which shows strong PAH emission while the other is dominated by a red AGN continuum over the same rest-frame wavelength region covered by the UDF spectra. Lutz et al. place the AGN-dominated SMG in the same region of the / plane identified by Alexander et al. (2005). Menéndez-Delmestre et al. (2006) have also observed SMGs with the IRS. They find the SMG spectra to be consistent with that of a composite of a strongly star-forming galaxy and weak AGN. The EQW of the 7.7 m PAH feature in their spectra is consistent with that of the UDF sources.
As discussed above, Source 1 at provides a striking example of an object that would be excluded by a “bump” survey but nonetheless may have star formation contributing the majority of its bolometric luminosity. Sources of this kind may be an important contribution to the cosmic star formation density. However, based on current data, it is difficult to estimate how many such sources will be missed in IRAC surveys. This uncertainty demonstrates the need for wider use of deep MIR spectroscopy of high redshift sources.
6 Summary
We have obtained the longest exposure-time spectra to date using the the Spitzer IRS, demonstrating the power of the IRS to trace the properties of LIRGs/ULIRGs at . The spectra of four high redshift sources in the Hubble UDF show prominent PAH emission, comparable to local starbursts. The combination of IRAC photometry, IRS spectroscopy and X-ray data on these sources place constraints on the physical properties which dominate their luminosities. These sources follow the rough correlation in ULIRGs between the strength of PAH emission (arising from young stars) and the 1.6 m bump (arising from older stars).
References
- Alexander et al. (2005) Alexander, D. M., Bauer, F. E., Chapman, S. C., Smail, I., Blain, A. W., Brandt, W. N., & Ivison, R. J. 2005, ApJ, 632, 736
- Armus et al. (2004) Armus, L., et al. 2004, ApJS, 154, 178
- Armus et al. (2006) Armus, L., et al. 2006, ApJ, in press; astro-ph/0610218
- Beckwith et al. (2006) Beckwith, S. V. W., et al. 2006, AJ, in press; astro-ph/0607632
- Bell et al. (2005) Bell, E. F., et al. 2005, ApJ, 625, 23
- Brand et al. (2006) Brand, K. et al. 2006, in press; astro-ph/0602198
- Brandl et al. (2004) Brandl, B. R., et al. 2004, ApJS, 154, 188
- Brandl et al. (2006) Brandl, B. R., et al. 2006, ApJ in press; astro-ph/0609024
- Bushouse et al. (2002) Bushouse, H. A., et al. 2002, ApJS, 138, 1
- Chary & Elbaz (2001) Chary, R. & Elbaz, D. 2001, ApJ, 556, 562
- Chary et al. (2004) Chary, R., et al. 2004, ApJS, 154, 80
- Chary et al. (2006, in prep.) Chary, R., et al. 2006, in preparation
- Daddi et al. (2004) Daddi, E., Cimatti, A., Renzini, A., Fontana, A., Mignoli, M., Pozzetti, L., Tozzi, P., & Zamorani, G. 2004, ApJ, 617, 746
- Dale & Helou (2002) Dale, D. A., & Helou, G. 2002, ApJ, 576, 159
- Dickinson & GOODS Team (2004) Dickinson, M., & GOODS Team 2004, Bulletin of the American Astronomical Society, 36, 701
- Elbaz et al. (2002) Elbaz, D., Cesarsky, C. J., Chanial, P., Aussel, H., Franceschini, A., Fadda, D., & Chary, R. R. 2002, A&A, 384, 848
- Genzel & Cesarsky (2000) Genzel, R., & Cesarsky, C. J. 2000, ARA&A, 38, 761
- Giacconi et al. (2002) Giacconi, R., et al. 2002, ApJS, 139, 369
- Giavalisco et al. (2004) Giavalisco, M., et al. 2004, ApJ, 600, L93
- Houck et al. (2004) Houck, J. R., et al. 2004, ApJS, 154, 18
- Houck et al. (2005) Houck, J. R., et al. 2005, ApJ, 622, L105
- Jarrett et al. (2003) Jarrett, T. H., Chester, T., Cutri, R., Schneider, S. E., & Huchra, J. P. 2003, AJ, 125, 5
- Kennicutt et al. (2003) Kennicutt, R. C., et al. 2003, PASP, 115, 928
- Lagache et al. (2004) Lagache, G., et al. 2004, ApJS, 154, 112
- Laurent et al. (2000) Laurent, O., Mirabel, I. F., Charmandaris, V., Gallais, P., Madden, S. C., Sauvage, M., Vigroux, L., & Cesarsky, C. 2000, A&A, 359, 887
- Le Fèvre et al. (2004) Le Fèvre, O., et al. 2004, A&A, 428, 1043
- Le Floc’h et al. (2005) Le Floc’h, E., et al. 2005, ApJ, 632, 169
- Lonsdale et al. (2003) Lonsdale, C. J., et al. 2003, PASP, 115, 897
- Lonsdale et al. (2005) Lonsdale, C. J., et al. 2005, Bulletin of the American Astronomical Society, 37, 1253
- Lutz et al. (2005) Lutz, D., Valiante, E., Sturm, E., Genzel, R., Tacconi, L. J., Lehnert, M. D., Sternberg, A., & Baker, A. J. 2005, ApJ, 625, L83
- Marcillac et al. (2006) Marcillac, D., Elbaz, D., Charlot, S., Liang, Y. C., Hammer, F., Flores, H., Cesarsky, C., & Pasquali, A. 2006, A&A, 458, 369
- Marleau et al. (2004) Marleau, F. R., et al. 2004, ApJS, 154, 66
- Menéndez-Delmestre et al. (2006) Menéndez-Delmestre, K., et al. 2006 ApJL, submitted; astro-ph/0610915
- Papovich et al. (2004) Papovich, C., et al. 2004, ApJS, 154, 70
- Peeters et al. (2004) Peeters, E., Spoon, H. W. W., & Tielens, A. G. G. M. 2004, ApJ, 613, 986
- Pérez-González et al. (2005) Pérez-González, P. G., et al. 2005, ApJ, 630, 82
- Pope et al. (2006) Pope, A., et al. 2006, MNRAS, 370, 1185
- Ptak et al. (2003) Ptak, A., Heckman, T., Levenson, N. A., Weaver, K., & Strickland, D. 2003, ApJ, 592, 782
- Sajina et al. (2006) Sajina, A., Scott, D., Dennefeld, M., Dole, H., Lacy, M., & Lagache, G. 2006, MNRAS, 369, 939
- Scoville et al. (2000) Scoville, N. Z., et al. 2000, AJ, 119, 991
- Skrutskie et al. (2006) Skrutskie, M. F., et al. 2006, AJ, 131, 1163
- Soifer et al. (1987) Soifer, B. T., Sanders, D. B., Madore, B. F., Neugebauer, G., Danielson, G. E., Elias, J. H., Lonsdale, C. J., & Rice, W. L. 1987, ApJ, 320, 238
- Soifer et al. (2000) Soifer, B. T., et al. 2000, AJ, 119, 509
- Spoon et al. (2007) Spoon, H. W. W., Marshall, J. A., Houck, J. R., Elitzur, M., Hao, L., Armus, L., Brandl, B. R., & Charmandaris, V. 2007, in press; astro-ph/0611918
- Surace et al. (2007) Surace, J., et al. 2007, in prep.
- Teplitz et al. (2005) Teplitz, H. I., Charmandaris, V., Chary, R., Colbert, J. W., Armus, L., & Weedman, D. 2005, ApJ, 634, 128
- Vignati et al. (1999) Vignati, P., et al. 1999, A&A, 349, L57
- Weedman et al. (2006) Weedman, D., et al. 2006, ApJ in press; astro-ph/0608609
- Yan et al. (2005) Yan, L., et al. 2005, ApJ, 628, 604
| Obj. | R.A. | Dec. | ||||
|---|---|---|---|---|---|---|
| (J2000) | (J2000) | (mag.) | (mJy) | (mJy) | (mJy) | |
| 1 | 3:32:44.00 | -27:46:35.0 | 24.47 | |||
| 1-BzK | 3:32:38.52 | -27:46:33.5 | 24.65 | |||
| 2 | 3:32:34.85 | -27:46:40.4 | 23.30 | |||
| 2-x | 3:32:39.72 | -27:46:11.3 | 24.96 |
| Obj. | Sub-slit | Mode | Ramp | Cycles | AORs | |
|---|---|---|---|---|---|---|
| Time (s) | per AOR | |||||
| 1 | 2.69 | LL-1 | map | 120 | 20 6 pos. | 3 |
| 2 | 1.09 | SL-1 | Staring | 240 | 25 2 nods | 1 |
| LL-2 | Staring | 120 | 70 2 nods | 2 |
| Obj. | log(/L⊙)aafootnotemark: | Flux(6.2)bbThe infrared luminosity inferred from the use of local templates as discussed in Section 5. As only one local template is used per object, the uncertainty is not given. Typical uncertainties using a suite of templates is % (Chary & Elbaz, 2001). | (EQW)ccEW given in m. In most cases, the uncertainty is dominated by the uncertainty in the continuum. | Flux(7.7)bbThe infrared luminosity inferred from the use of local templates as discussed in Section 5. As only one local template is used per object, the uncertainty is not given. Typical uncertainties using a suite of templates is % (Chary & Elbaz, 2001). | (EQW)ccEW given in m. In most cases, the uncertainty is dominated by the uncertainty in the continuum. | Flux(8.6)bbThe infrared luminosity inferred from the use of local templates as discussed in Section 5. As only one local template is used per object, the uncertainty is not given. Typical uncertainties using a suite of templates is % (Chary & Elbaz, 2001). | (EQW)ccEW given in m. In most cases, the uncertainty is dominated by the uncertainty in the continuum. | |
|---|---|---|---|---|---|---|---|---|
| 1 | 2.69 | 12.6 | () | () | () | |||
| 1-BzK | 2.55 | 12.6 | () | () | ||||
| 2 | 1.09 | 11.5 | ()ddThe continuum level is only marginally detected in the SL spectrum, so this measurement is uncertain | () | () | |||
| 2-x | eeThe redshift estimate is based on the identification of an isolated emission line as the 6.2 m PAH line. The continuum is not well detected, so EQW values are not given. | 12.3 |
.