Can the soft excess in AGN originate from disc reflection?
Abstract
The soft excess seen in many AGN is most probably due to partially ionized material moving at relativistic speeds close to the black hole. There are currently two potential geometries for this material, one where it is out of the line of sight, seen via reflection, e.g. the accretion disc, the other where it is in the line of sight, seen in absorption e.g. a wind above the disc. Both models require apparent fine tuning of the ionization parameter of this material in order to produce the large jump in opacity at keV associated with OVII/VIII, as required to make the soft excess. However, Chevalier et al (2006) show that these states rather naturally dominate the absorption spectrum for soft X-ray spectra if the illuminated material is (at least approximately) in pressure balance. Here we explore whether hydrostatic pressure equilibrium in a disc can likewise naturally select the required ionization states in reflection. We find the opposite. The soft excess X-ray excess is much weaker in the hydrostatic models than it is in the constant density models. Since even the constant density models cannot fit the largest soft excesses seen without the intrinsic continuum being hidden from view, this means that reflection from a hydrostatic disc cannot realistically match the data. Even if the disc structure is instead more like a constant density atmosphere, the required fine–tuning of the ionization parameter still remains a problem for reflection models.
keywords:
accretion, accretion discs – atomic processes – X-rays: galaxies1 Introduction
The X-ray spectra of Active Galactic Nuclei commonly show a ’soft excess’, a smoothly rising increase in emission below 1 keV (e.g. Porquet et al 2004). This is unlikely to represent a true continuum component as it has a remarkably fixed ’temperature’ of keV in all high mass accretion rate AGN despite a wide range in black hole mass from (Czerny et al 2003; Gierlinski & Done 2004, hereafter GD04; Crummy et al 2006). Instead, a fixed energy for the emergence of this component is easier to produce in atomic rather than continuum processes. In particular, there is a strong jump in opacity at keV from partially ionized material, where OVII/OVIII (and the Fe M shell UTA) combine to produce much more absorption above this energy than below. However, the observed soft excess is smooth, with no discernible strong characteristic edge and line features expected from atomic processes. Thus if this is the origin of the soft excess, the partially ionized material must have strong velocity gradients so that Doppler shifts smear these out.
There are two ways in which such partial ionisation could produce a soft excess, either with optically thick material seen in reflection or optically thin material seen in absorption. These lead to two different geometries for the material: a disc out of the line of sight for reflection, and material above the disc in the line of sight for absorption.
A reflection geometry sets limits on the size of the soft X-ray excess to only a factor 2 above the extrapolation of the higher energy spectrum (assuming an isotropic source above a smooth disc surface) as the maximum reflected flux is set by the level of the illuminating flux. However, some sources (predominantly Narrow Line Seyfert 1’s) are observed to have soft excesses which are much stronger than this, leading to the requirement for anisotropic illumination and/or a corrugated disc surface which hides most of the intrinsic flux from sight (Fabian et al 2002; Ballantyne, Turner & Blaes 2004; Fabian et al 2005; Merloni et al 2006). An alternative way to implement this is via a ’lamppost’ source geometry, where the height of the source above the black hole is rather small. Light bending then preferentially illuminates the inner disc, giving strong velocity smearing and enhancing the reflected fraction (Fabian et al 2004; Miniutti & Fabian 2004; Crummy et al 2006).
The alternative absorption geometry can equally well produce an apparent soft excess which can fit the XMM–Newton spectra (GD04; Chevallier et al 2006; Sobolewska & Done 2007; Schurch & Done 2006) and variability (Gierlinski & Done 2006; Ponti et al 2006). However, here there is no clear limit on the size of the soft excess, so no special geometry is required to produce a large fraction of soft flux above the extrapolation of the higher energy spectrum (Sobolewska & Done 2007).
Both atomic models for the origin of the soft X-ray excess require the same basic ionization conditions i.e. partially ionised Oxygen to produce the big jump in opacity at 0.7 keV (equivalently where is the photoionisation parameter) and large (relativistic) velocity smearing (but see Pounds & Reeves 2007). The large velocity smearing is naturally produced in both models if the material is close to the black hole, but the requirement on the ionization state appears arbitrary. However, Chevallier et al (2006) show that this may arise rather naturally in an absorption geometry if the material is in some sort of pressure balance. This is linked to the ionization instability which results from X-ray illumination, where the material makes a very rapid switch between almost completely ionized to almost completely neutral (Krolik, McKee & Tarter 1981, hereafter KMT81). This transition may disrupt the absorbing cloud beyond this point, so that the neutral material is strongly clumped. A line of sight though the cloud includes only the highly ionized front edge (invisible) and the partially ionized transition region, which has an average value of across a region with column of cm-2 (Chevallier et al 2006).
The true instability is only present for hard illuminating spectra (KMT81). However, the rapid transition through the partially ionized zone is generic, so even soft illuminating spectra such as those that are more typical of NLS1’s (Brandt et al 1997) produce the required absorption properties (Chevallier et al 2006).
Here we investigate this fine-tuning in the reflection model, to see if the constraints of hydrostatic pressure balance in the disc can likewise lead to a rather natural selection of this ionisation state. We find instead the converse. The rapid transition due to the ionization instability generically limits the partially ionised zone to a small range in optical depth ( cm-2 corresponds to ) so it cannot dominate over the entire reflecting photosphere of 0–1 (Nayakshin, Kazanas & Kallman 2000 hereafter NKK00, Nayakshin & Kallman 2001 hereafter NK01; Ballantyne, Ross & Fabian 2001; Rozanska et al 2002). Either the disc is very far from hydrostatic equilibrium, or the soft excess is not from reflection from the disc.
2 Reflection from disks in hydrostatic equilibrium
The vertical density structure of an X-ray illuminated disc in hydrostatic equilibrium is rather complex. External X-ray illumination heats the top layer of the to the Compton temperature (Compton heating balanced by Compton cooling). This temperature is higher then the initial disc photosphere so it expands, becoming less dense and so the photoionisation parameter, , is large, and the material is highly ionized. Further down in the disc the pressure necessarily increases if the disc is in hydrostatic equilibrium. The illumination is slightly weaker due to scattering in the upper layer so the pressure increase can only be produced by increasing the density, which increases the importance of bremsstrahlung cooling ( whereas the Compton heating and cooling ). Stronger cooling and weaker heating means that the equilibrium temperature falls with depth, so the density increases, and the photoionisation parameter drops. Eventually this means that not all species are completely stripped and bound electrons give rise to a dramatic increase in cooling due to recombination lines, so to a correspondingly rapid increase in density decrease in photoionisation parameter. This thermal runaway only stops when the ions are mostly neutral, stopping the dramatic increase in new cooling transitions available, since the ion states cannot decrease below the ground state (NKK00).
The sudden increase in cooling efficiency at the onset of line transitions happens exactly at the range of ion states which are required for the soft X-ray excess i.e. OVIII/OVII. To produce the soft excess from reflection requires that these ion states predominate over the photosphere of the disc, i.e. that these extend over 0–1. Yet the rapid transition means that these states only occupy a small range in . In the limit of very hard illuminating spectra, the transition is a true instability, with widely differing ion states co–existing at the same pressure (KMT81), though thermal conduction smooths this out into a rapid transition in a disc ( see Appendix A of NKK00). However, for softer X-ray illuminating spectra this is no longer a true instability. The transition is still rapid, but these partially ionized states may extend over a somewhat larger range of . Given that the soft excess appear strongest in the Narrow Line Seyfert 1 Galaxies (NLS1), which generally have steep X-ray spectra and strong intrinsic disc emission (e.g. Czerny et al. 2003), it is clearly important to investigate the nature of the instability under these conditions.
3 Hydrostatic balance models with steep X-ray illumination
 |
 |
 |
 |
 |
 |
We use the code of NKK00 to calculate the self-consistent structure of an X-ray illuminated, hydrostatic disc described by the standard Shakura & Sunyaev (1973) prescription for the viscous stresses where is the total (gas plus radiation) pressure. This code makes a number of simplifying assumptions, such as setting the effective temperature as a lower limit and calculating line transfer via an escape probability (see Rozanska et al 2002; Dumont et al 2003). However, it gives similar results in general (though not in detail) to the two other codes which can handle this problem using different assumptions (see Pequignot et al 2001, Rozanska et al 2002). We take parameters corresponding to NLS1 galaxies i.e. a steep illuminating X-ray spectrum with (with an exponential rollover at 150 keV) and strong intrinsic disk flux, .
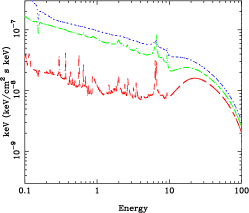
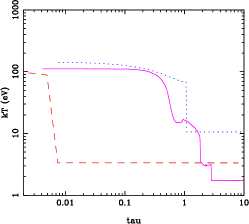
Fig. 1a shows a sequence of reflected spectra at calculated with . The three curves are plotted for the dimensionless accretion rates of and 0.003, from top to bottom. There is simply no soft X-ray excess in the reflected spectrum at the highest accretion rate (blue), which is the one which should be most applicable to luminous AGN such as Narrow Line Seyferts. However, the effective viscosity in radiation pressure dominated discs is not well understood. The stresses could instead scale more like (Merloni 2003), making the disc denser for a given . The effect of this is similar to simply reducing in our standard Shakura–Sunyaev disc, but the two models with smaller accretion rates have soft excesses that are only marginally larger than that for . None of these models produce a strong soft excess in reflection.
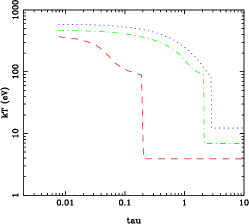
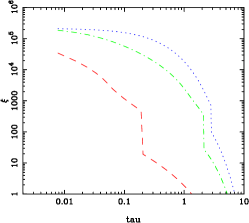
Fig. 1b shows the temperature structure as a function of vertical optical depth for each of these accretion rates, while Fig. 1c shows the corresponding estimate for the photoionisation parameter from illumination , where the factor approximates the loss of illuminating flux by scattering in the upper layers (appropriate as these layers are highly ionized), and the diffuse emission is ignored. Fig. 1c shows immediately why the soft excess is so weak. Firstly, the ionization parameter should be around to produce the highly but not completely ionized species of Oxygen (Sobolewska & Done 2007). In our models this parameter space occurs over too narrow a region in the optical depth, just before the temperature drop due to thermal instability. Secondly, on the top of that layer, there is a skin of even more highly ionized material, where Oxygen is completely stripped. Reflection (and emission) from this layer “fills in” the gap in the 0.7–3 keV energy band. As a result, the soft X-ray emission does not stand out as a well defined rise in the reflected spectrum.
4 Comparison with constant density models
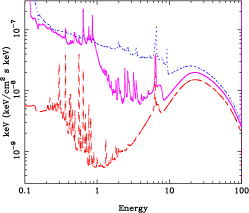
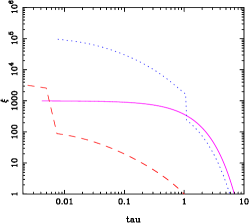
The diluting effect of the highly ionized, upper layer can be removed by decreasing the size of this layer. This can be done by reducing the strength of the illuminating flux (NKK00; NK01). Fig. 2 shows results for two further hydrostatic balance models with (red) and (blue) as in Fig. 1, but now with . The corresponding temperature and ionisation structures for these are shown in Fig. 2b and c. These show that the lower illumination can indeed remove the highly ionized upper layer for the lowest mass accretion rate, producing a moderate soft excess (Fig. 2a). However, Fig. 2 also shows results from the code run without hydrostatic balance i.e. in constant density mode (magenta) for . In order to compare with the results of Ross & Fabian (2005) we calculate all constant density models in the limit of negligible intrinsic disc flux. The constant density model with is much more efficient at producing the soft excess than any of the hydrostatic models.
Fig 2b shows that the constant density run has a very similar temperature profile to that of the hydrostatic disc model with , with an extended region at the Compton temperature of 100-200 eV. However, theier reflected emission is radically different (Fig 2a). Fig 2c shows that this is because the constant density model has over the entire photosphere, from to 1, while the high mass accretion rate hydrostatic disc only has a small region with this critical ionization parameter, and this region is buried beneath a a thick, highly ionized layer which dilutes the small soft excess produced in the region with .
In summary, the ionization parameter is not an independent variable in a hydrostatic disc. It cannot be set externally as the disc vertical structure responds to the illuminating flux. The partially ionized zone with is near the region where the ionisation state changes rapidly (see Figs. 1c and 2c). Thus this can only ever be characteristic of a small portion of the disc photosphere, as opposed to the constant density models. The small soft excess in the constant density models can be further suppressed by being buried beneath a more highly ionized skin, so soft excesses produced by hydrostatic discs are always much smaller than those predicted by constant density calculations.
5 Dependence of results on spectral index
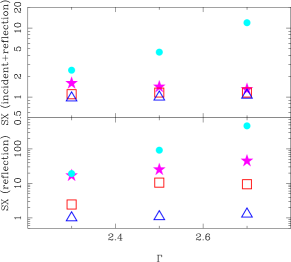
Here we explore the sensitivity of the soft excess to the continuum shape, comparing the previous results for with steeper photon indices of and . We fix 1 and calculate results for 0.003 and 0.3.
We parameterize the strength of the soft excess following Sobolewska & Done (2007) by convolving the reflected emission with the relativistic smearing expected from an extreme Kerr disc (the laor profile: Laor 1991). This smooths out individual emission features and makes soft X-ray features appear as a continuum. The 3–8 keV reflected spectrum is then fit to a power law. Extrapolating this spectrum down to lower energies, we define the soft excess strength, SX, as the ratio between the smeared reflected emission and the extrapolated power law at 0.5 keV.
The open symbols in Fig 3 show the soft excess strength for each of these hydrostatic disc models, both for the total (incident+reflected) emission expected from an isotropic source (upper panel) and for the reflected spectrum alone (lower panel). Soft excesses in these are always small, not exceeding even a factor of 1.5 at 0.5 keV for isotropic emission. This is in stark contrast to the constant density models calculated from our code with (filled magenta symbols), which show much larger soft excesses, close to the theoretical maximum of a factor for isotropic illumination. We note that the reflected emission produced by our constant density model is very similar to that of the publically available models of Ross & Fabian (2005) for , but their code gives a progressively stronger soft excess for steeper illuminating spectra (see Fig 3), which may be due to their neglect of low ionization species. However, this is probably not important for most AGN as the spectral fits of Crummy et al (2006) generally have .
6 Discussion
Both reflection and absorption are expected to be present in the spectrum at some level, and both of these are easier to identify where the velocity width is small. There is increasing evidence for absorption systems with the relativistic velocities required here (e.g. Pounds & Page 2006) but these are narrow. The relativistic broadening (as opposed to blueshift of narrow features) required in both soft excess models makes it harder to unambiguously identify characteristic atomic features in reflection or absorption, and additional physical constraints become important in assessing their origin.
The strongest reflected soft excesses are from constant density models with . Even these cannot match the strongest soft excesses observed with isotropic illumination, hence the requirement for reflection dominated emission (Fabian et al 2002). The much smaller soft excesses produced in the hydrostatic disc models mean that these simply cannot match the largest soft excesses observed in the data, even with a completely reflection dominated geometry.
Thus the disc cannot be in hydrostatic equilibrium if the soft excess is made via reflection. However, it is clear that hydrostatic equilibrium is not always appropriate. Magnetic flares with irradiate the local patch of the disc underneath the flare, causing it to expand sideways as well as vertically. Some of the disc material escapes out from underneath the flare, reducing the optical depth of the skin from that expected in hydrostatic equilibrium (NKK00, Done & Nayakshin 2001, Czerny & Goosmann 2004).
Such effects are not expected in the more uniform disc illumination produced in a lamppost model. The entire disc is illuminated, so there is no unilluminated sector into which the material can escape. Nonetheless, the hydrostatic equilibrium condition can still be inappropriate. Firstly, and most fundamentally, the disc may have a substantial magnetic support, changing the whole behaviour of the illuminated disc (Blaes et al 2006). Secondly, even without magnetic fields, hydrostatic balance is disrupted if the disc produces a wind from the region in which the X–ray reflection spectrum is formed. The quantitative effect of the wind on the vertical disc structure depends on the detailed nature of the wind which is not currently well understood. Nonetheless, mass loss from the disc has the generic effect of driving the X–ray illuminated disc more towards a constant density structure. Thus a powerful wind, such as required by the absorption model of the soft excess, may also modify the disc vertical structure so that it can also produce more of a reflected soft excess. Nonetheless, the fine–tuning problem still remains, as there is no obvious physical reason for a magnetically or wind dominated disc to prefer .
7 Conclusions
In this paper we explored the disc reflection origin for the soft X-ray excess in AGN, using the additional constraint of the hydrostatic balance on the structure of the illuminated disc atmosphere. As is well known, material illuminated by X-rays and in pressure balance is subject to the ionisation instability (KMT81). We find that, due to this instability, there is a rapid transition through the partially ionized zone that is required to produce the soft excess below keV. The small optical depth of this zone, plus the presence of completely ionized material above it mean that the hydrostatic balance models cannot match the largest soft excesses seen, even in a reflection dominated geometry where all of the illuminating continuum is hidden from the line of sight.
Constant density reflection models can have the entire photosphere dominated by partially ionized material, so produce much stronger soft excesses. These can match the strongest soft excesses seen in a reflection dominated geometry, but there is currently no way to self-consistently account for the fine tuning of the ionization parameter.
By contrast, the ionization instability can provide a robust mechanism to fix the ionization parameter to in the optically thin absorption model. The temperature and ionization structure of the front of the absorber is similar to that in Figs 1b,c and 2b,c so there is an outer skin of completely ionized material, and then a rapid transition. The drop in temperature to the more neutral material implies a rapid density increase at the transition which may fragment the low ionization part of the cloud into clumps. A line of sight through the cloud goes through the highly ionized layer (small opacity), the transition layer (mean ) but is not likely to intercept any of the opaque cool clumps as these have low covering factor (Chevallier et al 2006). This sets a physical mechanism for selecting the partially ionized zone, which works even if the material is not in complete pressure balance. Indeed it seems likely that any realistic model of the absorption should be complex, including adiabatic cooling, spatial inhomogeneity and time dependent behaviour e.g. if the absorber is formed from cold gas clumps driven up from the disc being photoevaporated and expanding as they are exposed to the strong X-ray ionizing flux.
In conclusion, hydrostatic disc models cannot produce the soft excess, and constant density disk models need fine–tuning as well as requiring the intrinsic continuum to be suppressed to produce the largest observed soft excesses. Any real disc structure should be between these two limiting cases, hence any optically thick reflection origin for the soft excess seems unlikely. Instead, the ionization instability in the absorption model does provide a robust mechanism for the opacity to be dominated by material at , and can easily produce even the largest soft excesses seen without having to hide the intrinsic continuum Thus it seems most likely that the soft excess is from absorption, not reflection.
References
- [\citeauthoryearBallantyne, Ross, & Fabian2001] Ballantyne D. R., Ross R. R., Fabian A. C., 2001, MNRAS, 327, 10
- [\citeauthoryearBallantyne, Turner, & Blaes2004] Ballantyne D. R., Turner N. J., Blaes O. M., 2004, ApJ, 603, 436
- [\citeauthoryearBlaes et al.2006] Blaes O. M., Davis S. W., Hirose S., Krolik J. H., Stone J. M., 2006, ApJ, 645, 1402
- [\citeauthoryearBlustin et al.2005] Blustin A. J., Page M. J., Fuerst S. V., Branduardi-Raymont G., Ashton C. E., 2005, A&A, 431, 111
- [\citeauthoryearBrandt, Mathur, & Elvis1997] Brandt W. N., Mathur S., Elvis M., 1997, MNRAS, 285, L25
- [Chevallier et al.(2006)Chevallier, Collin, Dumont, Czerny, Mouchet, Gonçalves, & Goosmann] Chevallier L., Collin S., Dumont A.-M., Czerny B., Mouchet M., Gonçalves A. C., Goosmann R., 2006, A&A, 449, 493
- [Crummy et al.(2006)Crummy, Fabian, Gallo, & Ross] Crummy J., Fabian A. C., Gallo L., Ross R. R., 2006, MNRAS, 365, 1067
- [Czerny et al.(2003)Czerny, Nikołajuk, Różańska, Dumont, Loska, & Życki] Czerny B., Nikołajuk M., Różańska A., Dumont A.-M., Loska Z., Życki P. T., 2003, A&A, 412, 317
- [\citeauthoryearCzerny & Goosmann2004] Czerny B., Goosmann R., 2004, A&A, 428, 353
- [\citeauthoryearDone & Nayakshin2001] Done C., Nayakshin S., 2001, MNRAS, 328, 616
- [\citeauthoryearDumont et al.2003] Dumont A.-M., Collin S., Paletou F., Coupé S., Godet O., Pelat D., 2003, A&A, 407, 13
- [Fabian et al.(2002)Fabian, Ballantyne, Merloni, Vaughan, Iwasawa, & Boller] Fabian A. C., Ballantyne D. R., Merloni A., Vaughan S., Iwasawa K., Boller T., 2002, MNRAS, 331, L35
- [Fabian et al.(2004)Fabian, Miniutti, Gallo, Boller, Tanaka, Vaughan, & Ross] Fabian A. C., et al., 2004, MNRAS, 353, 1071
- [Fabian et al.(2005)Fabian, Miniutti, Iwasawa, & Ross] Fabian A. C., Miniutti G., Iwasawa K., Ross R. R., 2005, MNRAS, 361, 795
- [Gierliński & Done(2004)] Gierliński M., Done C., 2004, MNRAS, 349, L7 (GD04)
- [Gierliński & Done(2006)] Gierliński M., Done C., 2006, MNRAS, L64+
- [\citeauthoryearKrolik, McKee, & Tarter1981] Krolik J. H., McKee C. F., Tarter C. B., 1981, ApJ, 249, 422 (KMT81)
- [Laor(1991)] Laor A., 1991, ApJ, 376, 90
- [\citeauthoryearMerloni2003] Merloni A., 2003, MNRAS, 341, 1051
- [\citeauthoryearMerloni et al.2006] Merloni A., Malzac J., Fabian A. C., Ross R. R., 2006, MNRAS, 370, 1699
- [Miniutti & Fabian(2004)] Miniutti G., Fabian A. C., 2004, MNRAS, 349, 1435
- [\citeauthoryearNayakshin, Kazanas, & Kallman2000] Nayakshin S., Kazanas D., Kallman T. R., 2000, ApJ, 537, 833 (NKK00)
- [\citeauthoryearNayakshin & Kallman2001] Nayakshin S., Kallman T. R., 2001, ApJ, 546, 406 (NK01)
- [\citeauthoryearPéquignot et al.2001] Péquignot D., et al., 2001, ASPC, 247, 533
- [Ponti et al.(2006)Ponti, Miniutti, Cappi, Maraschi, Fabian, & Iwasawa] Ponti G., Miniutti G., Cappi M., Maraschi L., Fabian A. C., Iwasawa K., 2006, MNRAS, 368, 903
- [Porquet et al.(2004)Porquet, Reeves, O’Brien, & Brinkmann] Porquet D., Reeves J. N., O’Brien P., Brinkmann W., 2004, A&A, 422, 85
- [\citeauthoryearPounds & Page2006] Pounds K. A., Page K. L., 2006, MNRAS, 372, 1275
- [\citeauthoryearPounds & Reeves2007] Pounds K. A., Reeves J. N., 2007, MNRAS, 374, 823
- [Ross & Fabian(2005)] Ross R. R., Fabian A. C., 2005, MNRAS, 358, 211
- [\citeauthoryearRóżańska et al.2002] Różańska A., Dumont A.-M., Czerny B., Collin S., 2002, MNRAS, 332, 799
- [\citeauthoryearSchurch & Done2006] Schurch N. J., Done C., 2006, MNRAS, 371, 81
- [\citeauthoryearSobolewska & Done2007] Sobolewska M. A., Done C., 2007, MNRAS, 374, 150
- [Shakura & Sunyaev(1973)] Shakura N. I., Sunyaev R. A., 1973, A&A, 24, 337