The Era of Star Formation in Galaxy Clusters
Abstract
We analyze the star formation properties of 16 infrared-selected, spectroscopically confirmed galaxy clusters at from the Spitzer/IRAC Shallow Cluster Survey (ISCS). We present new spectroscopic confirmation for six of these high-redshift clusters, five of which are at . Using infrared luminosities measured with deep Spitzer/MIPS observations at 24 m, along with robust optical+IRAC photometric redshifts and SED-fitted stellar masses, we present the dust-obscured star-forming fractions, star formation rates and specific star formation rates in these clusters as functions of redshift and projected clustercentric radius. We find that represents a transition redshift for the ISCS sample, with clear evidence of an unquenched era of cluster star formation at earlier times. Beyond this redshift the fraction of star-forming cluster members increases monotonically toward the cluster centers. Indeed, the specific star formation rate in the cores of these distant clusters is consistent with field values at similar redshifts, indicating that at environment-dependent quenching had not yet been established in ISCS clusters. Combining these observations with complementary studies showing a rapid increase in the AGN fraction, a stochastic star formation history, and a major merging episode at the same epoch in this cluster sample, we suggest that the starburst activity is likely merger-driven and that the subsequent quenching is due to feedback from merger-fueled AGN. The totality of the evidence suggests we are witnessing the final quenching period that brings an end to the era of star formation in galaxy clusters and initiates the era of passive evolution.
Subject headings:
galaxies: clusters: general — galaxies: distances and redshifts — galaxies: formation — galaxies: evolution — galaxies: starburst1. Introduction
Galaxies in the centers of nearby rich clusters and groups are passive, with little or no ongoing star formation. Most optical and near-IR studies of the color and luminosity function evolution in cluster galaxies are consistent with a model in which cluster galaxies formed in short, vigorous bursts of star formation at high redshift (), and evolved passively thereafter (e.g., Stanford et al. 1998; Blakeslee et al. 2006; van Dokkum and van der Marel 2007; Eisenhardt et al. 2008, hereafter E08; Mei et al. 2009; Mancone et al. 2010).
In contrast, recent mid-infrared studies (e.g., Bai et al., 2009; Chung et al., 2010) have demonstrated that galaxies with high star formation rates (SFRs), including Luminous and Ultraluminous Infrared Galaxies (LIRGs and ULIRGs, defined as having m infrared luminosities, , of , and , respectively), typically reside in the outskirts of present-day massive clusters. This suggests both an ongoing level of infall of gas-rich galaxies and groups, and a mechanism to quench the prodigious star formation of such recently accreted cluster members. Strangulation (Larson et al., 1980) — the stripping of galaxies’ hot gas reservoirs via interaction with the intracluster medium (ICM) — is the long-timescale (few Gyr) mechanism typically invoked to explain the lack of subsequent star formation as a recently accreted galaxy is starved of fuel. At low redshift () this environmental quenching is so effective that the fraction of star-forming galaxies in clusters is still below that in the field even at (Chung et al., 2011), where () is the radius of the cluster within which the density is 200 times the critical density of the Universe.
Evolutionary studies have found a rapid growth in the frequency and intensity of the SFR in clusters. Saintonge et al. (2008) reported an increase in the fraction of rapidly star-forming cluster galaxies up to . The cluster mass-normalized integrated SFR was found to increase as roughly out to (Bai et al., 2007, 2009; Krick et al., 2009), at least as rapidly as the field, albeit from a lower base. Several other authors have found corroborating evidence of increased star formation activity in distant clusters out to , including a rising incidence of LIRGs and ULIRGs (e.g., Coia et al., 2005; Geach et al., 2006; Marcillac et al., 2007; Muzzin et al., 2008; Koyama et al., 2008; Haines et al., 2009; Tran et al., 2009; Smith et al., 2010; Webb et al., 2013). However, in all of these studies cluster cores () still show evidence of substantial quenching, with much lower central SFRs than are seen in the field.
Studies in deep field surveys have also addressed the effect of local density on star formation activity. Elbaz et al. (2007) and Cooper et al. (2008) found evidence that the relation between SFR and local galaxy density reverses at , in the sense that the SFR begins to increase with increasing density. Recent studies have reported LIRG-level IR luminosities in cluster galaxies at (Hilton et al., 2010) and (Tran et al., 2010). However, as Geach et al. (2006) demonstrate, there is a significant variation amongst clusters even at moderate redshifts ().
The next step is to characterize the star formation properties of a large, uniformly selected sample of galaxy clusters at redshifts well beyond unity in order to study the epoch of cluster formation. In this paper, we study the SFR and specific star formation rates (sSFR) in 16 infrared-selected, spectroscopically confirmed clusters from the Spitzer/IRAC Shallow Cluster Survey (ISCS; E08). This large statistical sample — consisting of 196 spectroscopic cluster members at including 91 at , supplemented by robust photo-z members for complete sampling — allows accurate mean cluster properties to be determined, overcoming shot noise due to low numbers of objects in individual cluster cores and systematic variations in star formation history. We use 24m Spitzer data to directly probe the obscured star formation largely missed by optical approaches, and reject contaminating AGN using both X-ray and mid-IR methods.
In Section 2 we describe the ISCS cluster sample as well as the extensive photometry, spanning X-ray to 24m wavelengths, that is available for all of these clusters. We describe the uniform photometric redshifts used to identify these clusters, and present spectroscopy for 6 newly confirmed clusters, 5 of which are at . Calculations of stellar masses, total IR luminosities and SFRs are described in Section 3. Cluster membership criteria and AGN rejection methods are described in Section 4. In Section 5, the SFR and sSFR in the ISCS clusters is presented, and the implications for cluster formation are discussed in §6. We present our conclusions in §7. We use Vega magnitudes, the Chabrier (2003) initial mass function (IMF), and the WMAP7 cosmology of of Komatsu et al. (2011).
2. Data
2.1. IRAC Shallow Cluster Survey
The IRAC Shallow Cluster Survey (ISCS; E08) is a wide-field infrared-selected galaxy cluster survey carried out using the Spitzer/IRAC Shallow Survey imaging (Eisenhardt et al., 2004) of the 8.5 deg2 Boötes field of the NOAO Deep, Wide-Field Survey (NDWFS; Jannuzi and Dey, 1999). The clusters are identified via a wavelet search algorithm operating on photometric redshift probability distribution functions for 4.5m-selected galaxies in thin redshift slices over the redshift range . The ISCS sample contains 335 clusters and groups in an area of 7.25 deg2, 106 of which are at .
Details of the photometric redshifts are given in Brodwin et al. (2006, hereafter B06) and a full description of the cluster search and spectroscopy for a dozen ISCS clusters is given in E08 (also see Stanford et al. 2005; B06; Elston et al. 2006). In Brodwin et al. (2011) we presented our most distant cluster at that time, ISCS J1432.4+3250 at , though a new, deep extension to the survey has thus far identified two more distant clusters, at (Stanford et al., 2012; Brodwin et al., 2012; Gonzalez et al., 2012) and (Zeimann et al., 2012).
Here we focus on sixteen ISCS clusters at , listed in Table 2.1, that have deep multi-wavelength follow-up observations from the X-ray to the mid-infrared and are spectroscopically confirmed. These clusters likely all have similar halo masses, in the range . This statement is based on X-ray, weak-lensing and dynamical masses that have been measured for a subset of them (Brodwin et al., 2011; Jee et al., 2011), as well as on a clustering analysis of the full ISCS sample (Brodwin et al., 2007). In a companion paper, Alberts et al. (2013) conduct a Herschel/SPIRE stacking analysis using the full ISCS catalog.
| Number of | |||||
|---|---|---|---|---|---|
| R.A. | Decl. | Spectroscopic | Spectroscopic | Additional | |
| ID | (J2000) | (J2000) | Redshift | Members$\ddagger$$\ddagger$See §4 for the definition of cluster membership. | References |
| ISCS J1429.2+3357 | 14:29:15.16 | +33:57:08.5 | 1.059 | 8 | 1, 2 |
| ISCS J1432.4+3332 | 14:32:29.18 | +33:32:36.0 | 1.113 | 26 | 1, 2, 3 |
| ISCS J1426.1+3403 | 14:26:09.51 | +34:03:41.1 | 1.135 | 12 | 1, 2 |
| ISCS J1425.0+3520$\dagger$$\dagger$New spectroscopic confirmation in this work. | 14:25:03.44 | +35:20:10.4 | 1.157 | 8 | - |
| ISCS J1426.5+3339 | 14:26:30.42 | +33:39:33.2 | 1.164 | 14 | 1, 2 |
| ISCS J1434.5+3427 | 14:34:30.44 | +34:27:12.3 | 1.238 | 19 | 1, 2, 4 |
| ISCS J1429.3+3437 | 14:29:18.51 | +34:37:25.8 | 1.261 | 18 | 1, 2 |
| ISCS J1432.6+3436 | 14:32:38.38 | +34:36:49.0 | 1.351 | 12 | 1, 2 |
| ISCS J1425.3+3428$\dagger$$\dagger$New spectroscopic confirmation in this work. | 14:25:19.33 | +34:28:38.2 | 1.365 | 14 | 2 |
| ISCS J1433.8+3325$\dagger$$\dagger$New spectroscopic confirmation in this work. | 14:33:51.14 | +33:25:51.1 | 1.369 | 6 | 2 |
| ISCS J1434.7+3519 | 14:34:46.33 | +35:19:33.5 | 1.374 | 10 | 1, 2 |
| ISCS J1432.3+3253$\dagger$$\dagger$New spectroscopic confirmation in this work. | 14:32:18.31 | +32:53:07.8 | 1.395 | 10 | 2 |
| ISCS J1425.3+3250$\dagger$$\dagger$New spectroscopic confirmation in this work. | 14:25:18.50 | +32:50:40.5 | 1.400 | 6 | 2 |
| ISCS J1438.1+3414 | 14:38:08.71 | +34:14:19.2 | 1.414 | 16 | 1, 2, 5, 6 |
| ISCS J1431.1+3459$\dagger$$\dagger$New spectroscopic confirmation in this work. | 14:31:08.06 | +34:59:43.3 | 1.463 | 6 | 2 |
| ISCS J1432.4+3250 | 14:32:24.16 | +32:50:03.7 | 1.487 | 11 | 2, 6 |
2.2. New ISCS Clusters
Six new ISCS clusters spanning have been spectroscopically confirmed using a combination of multi-object Keck optical spectroscopy and slitless near-IR grism spectroscopy using the Wide Field Camera 3 (WFC3) on HST. A few additional members were confirmed in the AGES survey (Kochanek et al., 2012). Table 2 lists the coordinates, observation dates, exposure times and redshifts for previously unpublished members identified via ground-based optical spectroscopy. The new members identified via infrared HST/WFC3 grism observations, also used in this analysis, are presented in Zeimann et al. (2013).
| R.A. | Decl. | Exposure Time | ||||
|---|---|---|---|---|---|---|
| ID | (J2000) | (J2000) | Spec-z | Instrument | UT Date | (s) |
| ISCS_J1425.0+3520 | ||||||
| J142503.5+352013 | 14:25:03.58 | +35:20:13.4 | 1.1570 | Hectospec | AGES22See Kochanek et al. (2012) for a complete description of the AGES spectroscopy. | AGES22See Kochanek et al. (2012) for a complete description of the AGES spectroscopy. |
| J142504.6+352114 | 14:25:04.62 | +35:21:14.1 | 1.1572 | LRIS | 2009 Apr 28 | 6 1800s |
| J142505.7+352248 | 14:25:05.73 | +35:22:48.3 | 1.156 | LRIS | 2009 Apr 28 | 6 1800s |
| J142507.4+351902 | 14:25:07.42 | +35:19:02.4 | 1.157 | LRIS | 2009 Apr 28 | 6 1800s |
| J142507.6+352151 | 14:25:07.61 | +35:21:51.2 | 1.154 | LRIS | 2009 Apr 28 | 6 1800s |
| J142510.7+352315 | 14:25:10.72 | +35:23:15.0 | 1.1588 | LRIS | 2009 Apr 28 | 6 1800s |
| J142512.0+351839 | 14:25:12.00 | +35:18:39.1 | 1.157 | LRIS | 2009 Apr 28 | 6 1800s |
| J142512.1+351955 | 14:25:12.18 | +35:19:55.2 | 1.1449 | LRIS | 2009 Apr 28 | 6 1800s |
| ISCS_J1426.5+3339 | ||||||
| J142619.7+333717 | 14:26:19.74 | +33:37:17.0 | 1.165 | LRIS | 2012 Apr 20 | 3 1140s |
| J142631.2+334307 | 14:26:31.20 | +33:43:07.1 | 1.160 | LRIS | 2012 Apr 20 | 3 1140s |
| J142633.4+334224 | 14:26:33.46 | +33:42:24.5 | 1.160 | LRIS | 2012 Apr 20 | 3 1140s |
| ISCS_J1425.3+3428 | ||||||
| J142511.3+342852 | 14:25:11.31 | +34:28:52.8 | 1.3759 | LRIS | 2006 Apr 5 | 7 1760s |
| J142516.0+343040 | 14:25:16.02 | +34:30:40.9 | 1.39 | LRIS | 2006 Apr 5 | 7 1760s |
| J142519.0+342807 | 14:25:19.05 | +34:28:07.2 | 1.3574 | LRIS | 2006 Apr 5 | 7 1760s |
| ISCS_J1433.8+3325 | ||||||
| J143333.9+332602 | 14:33:33.98 | +33:26:02.9 | 1.377 | DEIMOS | 2007 Apr 19 | 4 1800s |
| J143351.5+332645 | 14:33:51.55 | +33:26:45.9 | 1.3687 | Hectospec | AGES22See Kochanek et al. (2012) for a complete description of the AGES spectroscopy. | AGES22See Kochanek et al. (2012) for a complete description of the AGES spectroscopy. |
| J143349.0+332603 | 14:33:49.05 | +33:26:03.3 | 1.39 | LRIS | 2006 Apr 4 | 7 1740s |
| ISCS_J1432.3+3253 | ||||||
| J143211.5+325646 | 14:32:11.56 | +32:56:46.7 | 1.401 | LRIS | 2012 Apr 20 | 4 1740s |
| J143216.5+325433 | 14:32:16.54 | +32:54:33.9 | 1.3921 | Hectospec | AGES22See Kochanek et al. (2012) for a complete description of the AGES spectroscopy. | AGES22See Kochanek et al. (2012) for a complete description of the AGES spectroscopy. |
| ISCS_J1425.3+3250 | ||||||
| J142523.8+325001 | 14:25:23.85 | +32:50:01.7 | 1.41 | LRIS | 2012 Apr 20 | 4 1740s |
| J142520.3+324701 | 14:25:20.34 | +32:47:01.7 | 1.3972 | Hectospec | AGES22See Kochanek et al. (2012) for a complete description of the AGES spectroscopy. | AGES22See Kochanek et al. (2012) for a complete description of the AGES spectroscopy. |
| ISCS_J1431.1+3459 | ||||||
| J143110.8+350016 | 14:31:10.88 | +35:00:16.4 | 1.477 | LRIS | 2012 Apr 21 | 4 1740s |
| ISCS_J1432.4+3250 | ||||||
| J143225.1+325013 | 14:32:25.15 | +32:50:13.6 | 1.49 | LRIS | 2012 Apr 20 | 4 1740s |
| J143225.1+325010 | 14:32:25.18 | +32:50:10.4 | 1.491 | LRIS | 2012 Apr 20 | 4 1740s |
The Keck optical spectra were reduced using standard techniques, including flat-fielding, fringe correction for LRIS red-side spectra, cosmic ray rejection, wavelength calibration and stacking. Spectral features were identified in the one-dimensional spectra extracted in IRAF111IRAF is distributed by the National Optical Astronomy Observatory, which is operated by the Association of Universities for Research in Astronomy (AURA) under cooperative agreement with the National Science Foundation., although all identified emission lines were verified to be robust in the 2-D spectra. Redshifts for star-forming galaxies were determined from a combination of [OII] emission and the 4000 Å break or overall spectral shape, whereas redshifts for passive galaxies were secured primarily via Ca HK absorption lines.
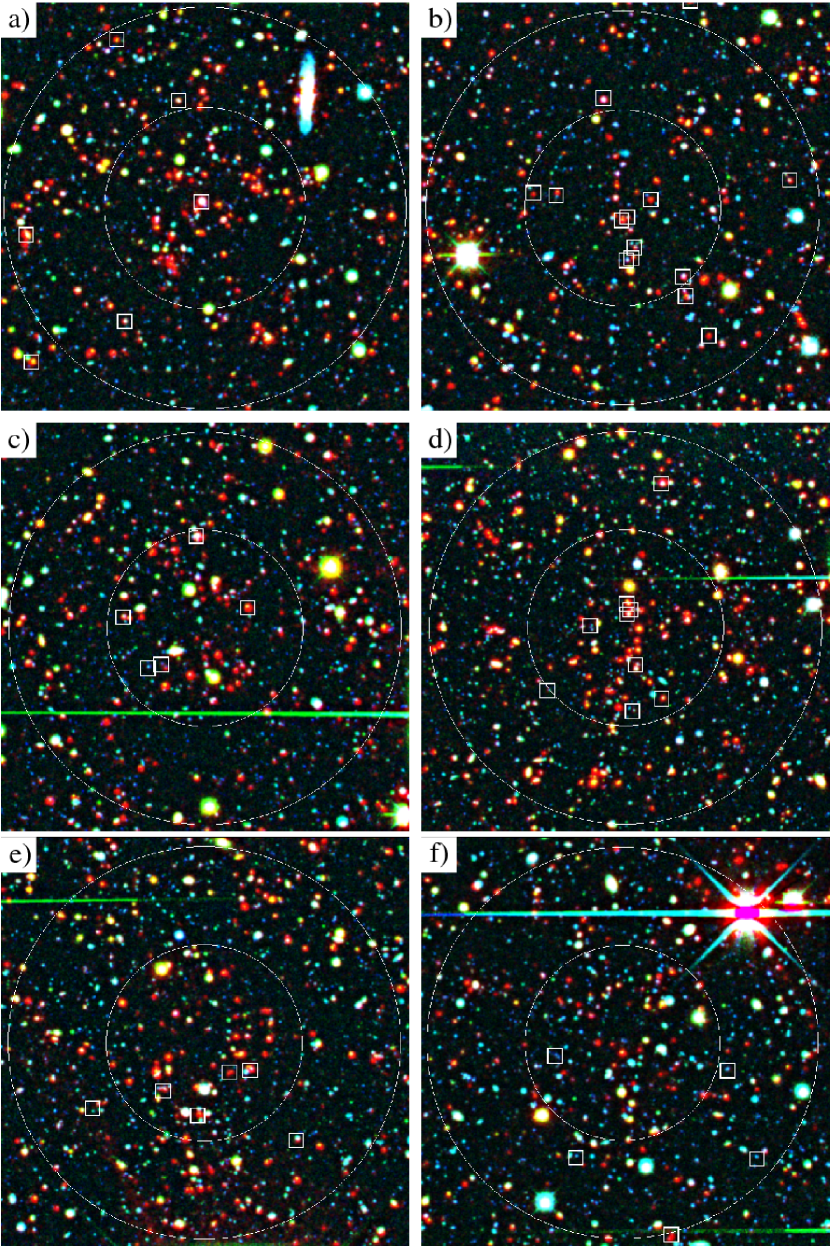
Optical/IRAC pseudo-color images of these new clusters, with the spectroscopic members indicated, are shown in Figure 1. Although prominent red overdensities are present for most of the clusters, the ISCS clusters are not red-sequence selected. The photometric redshift methodology includes bluer members, as is evident in some of the panels of Figure 1, and therefore offers a selection that is less biased toward red-and-dead membership than simple red-sequence surveys. This is of crucial importance for studies of the star formation activity in high-redshift clusters.
2.3. Photometry and Photometric Redshifts
2.3.1 Optical and IRAC Data
Deep, optical data from the NDWFS (Jannuzi and Dey, 1999) is available for all of these clusters (see B06 for more details). In order to match the larger PSFs of the Spitzer/IRAC photometry described below, aperture–corrected 4″ aperture fluxes were used.
The original 90s depth IRAC Shallow Survey was repeated three more times as part of the Spitzer Deep, Wide-Field Survey (SDWFS; Ashby et al., 2009) in Spitzer Cycle 4 (PID 40839), leading to a factor of 2 increase in depth and a significantly more robust catalog in terms of resistance to cosmic rays and instrumental effects. Combined with new, PSF-matched NDWFS optical catalogs (Brown et al. in prep), these data were used to compute new photometric redshifts for the full 5 4.5m SDWFS sample consisting of 434,295 galaxies down to an aperture-corrected limit of [4.5] = 18.83 mag.
2.3.2 MIPS Data
Imaging at 24 m was obtained with the Multiband Imaging Photometer for Spitzer (MIPS) in Cycle 3 (PID 30950) for all the clusters in Table 2.1. The exposure time increased with redshift from 12 to 48 min, corresponding to rms flux limits of 52 Jy at to 12 Jy at , in order to uniformly detect LIRGs at S/N for all clusters in this sample.
Following generation of the Basic Calibrated Data (BCD) by the Spitzer Science Center pipeline, we flat-fielded our images using scan mirror position-dependent flat fields derived from our science data. This is necessary because MIPS flat-fields are slightly dependent on the position of scan mirrors222see http://irsa.ipac.caltech.edu/data/SPITZER/docs/mips/features/ for details.. We also performed a jailbar correction on some science data that presented a regular pattern of bars (due to the presence of saturated pixels). The images were then sky-subtracted and the final mosaics were produced using MOPEX (with a drizzle scale of and a pixel-resampling factor of ).
The MIPS data have an angular resolution of FWHM, while the relative astrometric accuracy derived by matching the 24 m sources with Two Micron All Sky Survey (2MASS) stars and the SDWFS IRAC images is better than . The sources discussed in this paper are all unresolved at MIPS resolution; most are unresolved even at IRAC resolution. The MIPS source catalogs were generated by using the positions of sources in the higher resolution IRAC images and fitting groups of point sources using a singular value decomposition technique at the positions of the IRAC sources to minimize the effect of source confusion. This is equivalent to a DAOPHOT-type approach (Stetson, 1987), which is commonly adopted to obtain stellar photometry in crowded fields.
2.3.3 Chandra X-ray Data
Several of these cluster positions had been previously imaged with Chandra to 5-15 ks depths (Murray et al., 2005). A Cycle 10 Chandra program added additional exposure time to bring the full sample to a uniform exposure time of 40 ks. Although the shallow X-ray exposures were designed to study bright AGN, emission from the intracluster medium (ICM) is detected for several of them. A complete description of the reduction of these data, along with ICM mass measurements for two clusters in the present sample, is given in Brodwin et al. (2011).
2.3.4 Matched Catalogs
The various analyses in this work are based on cluster galaxy samples selected in IRAC and/or MIPS bands from the global 4.5m-limited photometric redshift catalog described above. Photometric redshift and stellar mass fits use the optical and IRAC bands, with uniform 4″ aperture fluxes measured at the positions of the SDWFS 4.5m sources. Unlike in B06, the optical images were first convolved to a uniform 1.35″ PSF to produce more robust optical colors, and to better match the native IRAC PSF. All photometry was corrected to total using a curve of growth analysis on bright, unsaturated stars. Since the SDWFS 4.5m catalog was used as a positional prior to extract 24 m fluxes in the MIPS images (e.g., Magnelli et al., 2009), infrared luminosities () or limits are measured for all sources.
2.3.5 Photometric Redshifts
The photometric redshift methodology adopted here is broadly similar to that of B06, the main difference being that with the greater SDWFS depth the 5.8 and 8.0m catalogs are included because they are sensitive to non-local galaxy populations. The extended Coleman et al. (1980) and Kinney et al. (1996) templates used in B06 do not sample these wavelengths, so in this work the models of Polletta et al. (2007) were adopted. Specifically, the templates employed include Ell5, Ell13, S0, Sa, Sb, Sc, Sd, Spi4, and M82. This subset of the Polletta et al. (2007) templates, supplemented by the extended Coleman et al. (1980) elliptical template, were empirically determined to provide an excellent spectral basis for SDWFS galaxies at (i.e. spanning the rest-frame wavelengths of 0.1-8 m probed by our filters).
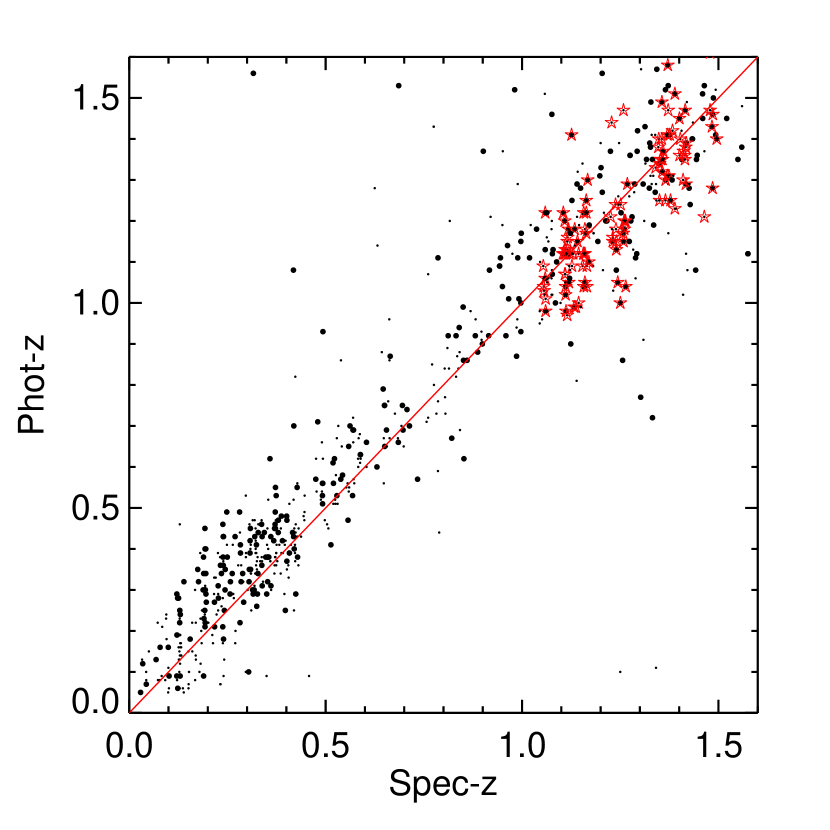
The accuracy and precision of the new photometric redshifts are very similar to those described in B06, with for 95% of the galaxies. The key improvement is that the photo-z sample now extends to the SDWFS 5 survey limit, corresponding to 0.22 * at . Unlike in B06, a neural-net approach was not attempted for the bright AGNs as these are identified and removed using our complementary data, as described below. Figure 2 shows the quality of the photometric redshifts for galaxies on lines-of-sight toward the 16 clusters in Table 2.1. The slight bias to higher photometric redshifts evident at was not corrected as the present focus is on galaxies. Larger filled-in circles represent galaxies detected at S/N 4 in the 24m MIPS band, to which the rest of the discussion in this paper will be limited. Both the full and MIPS-detected line-of-sight galaxy populations have redshift dispersions similar to the full field, and , respectively. Spectroscopically confirmed cluster members, denoted by stars, have a significantly tighter dispersion, .
As a further test of the reliability of the photometric redshifts, Table 3 shows the fraction of galaxies for which the spectroscopic redshift lies within the 1, 2 and 3 confidence intervals, defined as the redshift regions that enclose the top 68.3%, 95.4%, and 99.7% of the normalized area under the photometric redshift probability distributions. The photometric redshift accuracy in these clusters fields is as good as or better than that of the general SDWFS sample, particularly for the galaxies which form the basis of this work.
| Sample | |||
|---|---|---|---|
| Gaussian Expectation | 68.3% | 95.4% | 99.7% |
| SDWFS Main Galaxy Sample | 73.8% | 96.5% | 99.3% |
| This Work | 74.6% | 93.6% | 98.6% |
| This Work | 81.1% | 93.0% | 98.7% |
3. Stellar Masses, Total Luminosities and Star Formation Rates
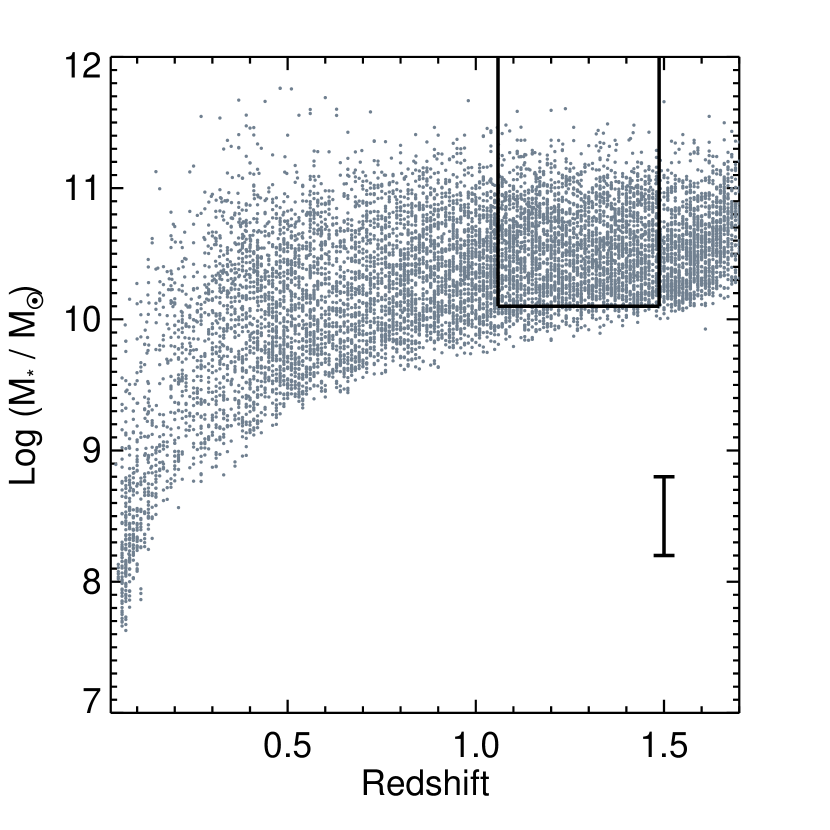
We estimate stellar masses using iSEDfit (Moustakas et al., 2013), a Bayesian SED-fitting code that uses population synthesis models to infer the physical properties of a galaxy given its observed broadband SED. We adopt the Bruzual and Charlot (2003) population synthesis models based on the Padova isochrones, the stelib (Le Borgne et al., 2003) stellar library, and the Chabrier (2003) IMF ranging from 0.1–100 . The upper panel of Figure 3 shows the stellar masses of all galaxies along the line-of-sight to these clusters. For uniformity across the cluster sample, we restrict the stellar masses to . This limit corresponds to the completeness level, though our cluster member completeness is far higher over this redshift range given the high masses of cluster galaxies and the flat luminosity function (Mancone et al., 2012). Although the individual iSEDfit mass errors are typically 0.2 dex, we adopt an error floor of 0.3 dex (indicated by the error bar in the figure) to account for the systematic uncertainty inherent in mass-fitting.
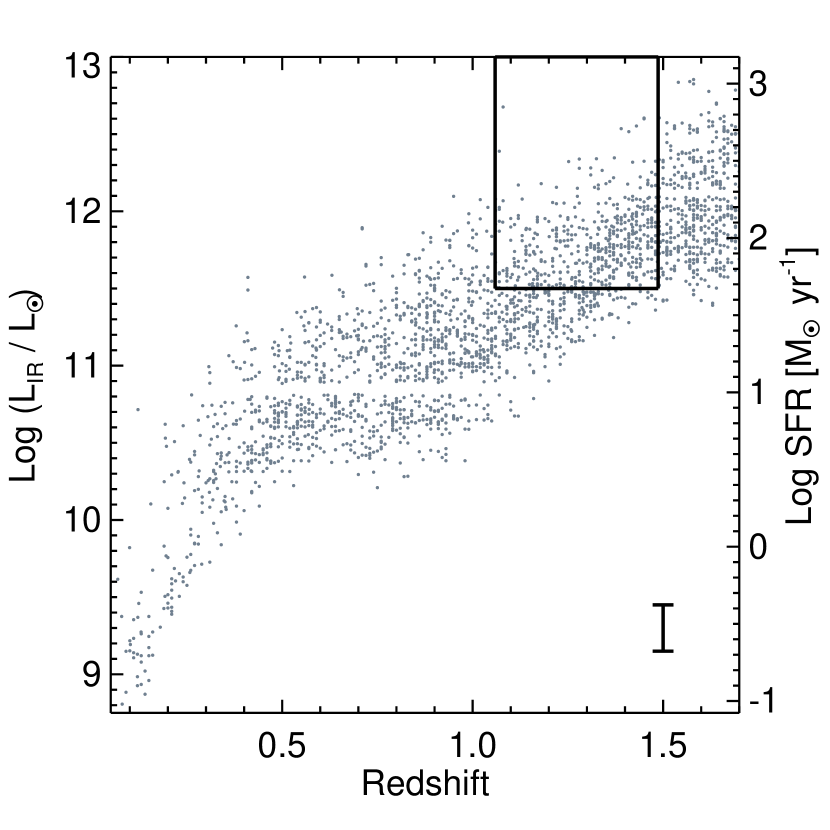
The total infrared luminosities of these galaxies are inferred from the 24m fluxes using the Chary and Elbaz (2001) templates. While this tends to overestimate at high redshift (), particularly for AGN-dominated ULIRGs (Murphy et al., 2009; Nordon et al., 2010; Rodighiero et al., 2010), it provides an accurate (scatter ) estimate of out to (Marcillac et al., 2006; Murphy et al., 2009; Elbaz et al., 2010). The MIPS data allow a complete sample of total infrared luminosities down to for all our clusters (lower panel of Figure 3), and we adopt this as the selection limit. The horizontal gap visible as a lack of sources with is an artifact stemming from the discreteness of the Chary and Elbaz (2001) templates. Given our selection region, it does not affect the present analysis. The scatter is indicated by the error bar in the figure. We convert the total infrared luminosities to star formation rates using the relation given in Murphy et al. (2011). This is defined assuming a Kroupa (2001) IMF, and therefore has a similar normalization to the Chabrier IMF used to calculate our stellar masses.
The primary goals of this paper are to compare the SFR and sSFR in the cluster outskirts and cores, and between clusters and the field. In all cases these SFRs have been derived using the same templates, so these comparisons should be robust to small absolute deviations in SFR compared with measurements at longer wavelengths (i.e. with Herschel).
4. Cluster Membership
4.1. Identification of Members
Following E08, galaxies with robust spectroscopic redshifts are identified as likely cluster members if they lie within a radius of 2 Mpc and their relative velocities are within km s-1 of the systemic cluster velocity. Galaxies without spectroscopy are identified as cluster members via a constraint on the integral of their normalized photometric redshift probability distribution functions,
| (1) |
is the best-fit photometric redshift of the cluster, determined by iteratively summing up the functions for member galaxies within 1 Mpc, re-identifying members and repeating the process to convergence. The positional centers are taken from the wavelet algorithm used to initially identify the clusters, although we have verified that using the Brightest Cluster Galaxy (BCG) position yields similar results.
4.2. Rejection of AGN
AGNs are problematic to include in this analysis, both due to the difficulty of obtaining good photometric redshifts for them, and because they bias the star formation rates inferred from the infrared luminosity. We therefore choose to omit them with the understanding that the resulting star formation rates are formally lower limits. X-ray emitting AGN with 2–10 keV luminosities brighter than erg s-1 were identified via a positional match to the matched catalog, within a match radius that is the larger of the IRAC PSF () and the Chandra positional uncertainty (which varies with off-axis angle). We also identify AGN via their power-law emission in the IRAC bands. Objects with S/N in all four IRAC bands that fall in the Stern et al. (2005) AGN wedge were deemed AGN. Objects satisfying either of these AGN criteria are removed from this analysis.
We have verified that the rejected AGN represent a relatively small fraction of our cluster membership and have no strong redshift dependence, as this could bias our primary result. Only of members satisfying our stellar mass cut are rejected as AGN within a radius of 1 Mpc, with no apparent redshift trend (2.8%, 6.0% and 4.1% in the 3 redshift bins used in §5). Similarly, of the subset of members that are detected at 24m, only are rejected as AGN (11.1%, 15.3% and 9.9% in these redshift bins). In the cluster cores, within projected radii of 0.5 Mpc, the rejected fractions are slightly higher ( and for all and 24m-detected members, respectively), but there is still no trend with redshift. As we reject more AGN in the cores we may possibly be underestimating the SFR in the cores relative to the outskirts at all redshifts. Since our results actually go the other way, with higher activity in the cores, we conclude that the rejection of AGN does not significantly bias our results with respect to SFR trends in redshift or radius.
5. Star Formation in High Redshift Clusters
5.1. 24m-Detected Cluster Members
Figure 4 shows the SFR (left panel) and sSFR (right panel) as a function of stellar mass for galaxies above the stellar mass and limits given in §3. The small boxes are galaxies satisfying the cluster membership criteria defined in §4, and the stars indicate galaxies for which cluster membership has been spectroscopically confirmed. The large error bars indicate the systematic errors. For the stellar masses these are conservatively estimated to be 0.3 dex, accounting for IMF variations (e.g., Bell et al., 2003). For the SFRs the systematic error is taken to be 40%, based on a comparison with Herschel far-IR measurements (Elbaz et al., 2010).
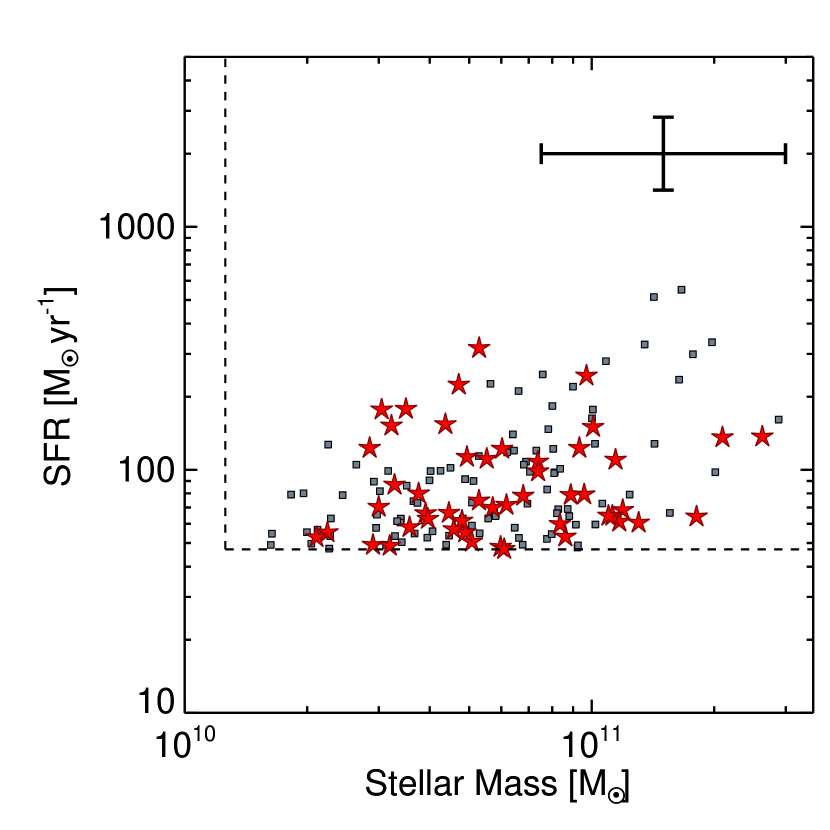
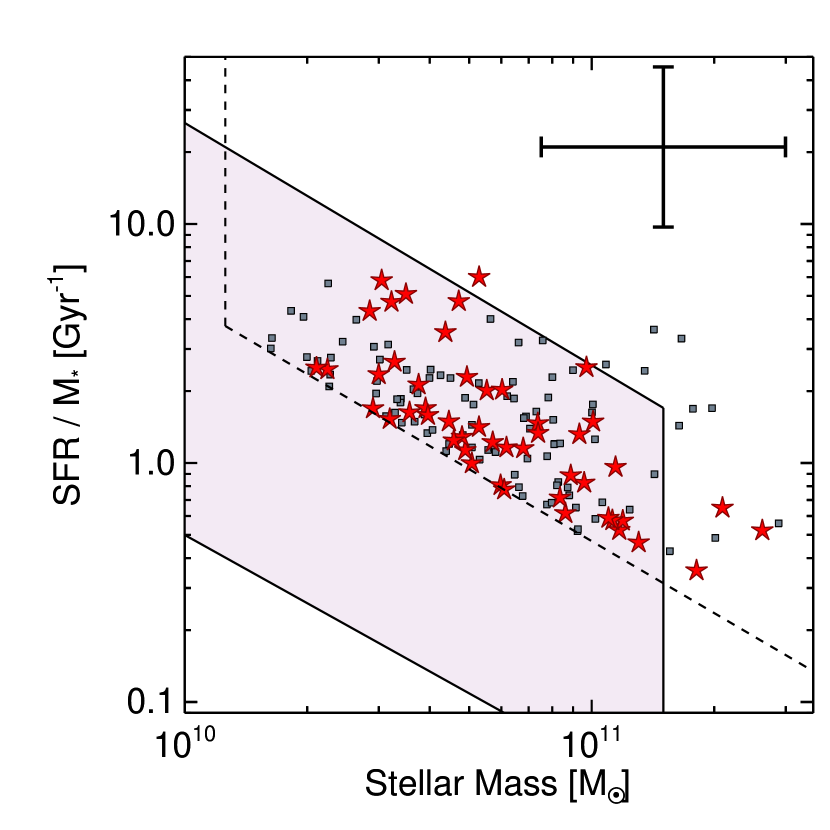
The region of the sSFR plot populated by the field galaxy sample of Santini et al. (2009) at , adjusted to our choice of IMF, is shown for comparison. The MIPS data for this small field survey is much deeper and hence probes to lower SFR. However, to our SFR sensitivity limit the cluster members, both spectroscopic and photometric, have specific star formation rates very similar to these field galaxies. The spectroscopically confirmed cluster members span a similar range in stellar mass, SFR and sSFR as the photometric redshift members. Given the small photometric redshift error for cluster members (§2.3.5), the integrated cluster SFR measurements, using spectroscopic redshifts where available and photometric redshifts otherwise, should be robust.
5.2. Star Formation vs. Stellar Mass and Redshift
The mean sSFR of the central cluster galaxies, within projected radii of 500 kpc, are plotted in Figure 5 in bins of stellar mass and redshift. The mean sSFR is defined here as the sum of the SFRs divided by the sum of the stellar masses in the mass bin. Objects undetected above 4 at 24 m in any bin are assigned the median 24 m flux of all such formally-undetected objects in that bin. This catalog-space median stacking is complementary to the more common image-space stacking employed in a companion paper (Alberts et al., 2013).

We have verified that none of the main results in this work depend on the flux we infer for the undetected sources — our primary conclusions are unchanged if the fluxes of all galaxies with S/N MIPS detections are set to zero. For comparison we plot the sSFR of field galaxies from Santini et al. (2009, open symbols) in the same mass bins. In this field study, SFRs for galaxies undetected at 24m are calculated from opt/NIR SED fits.
Although the methodologies differ in detail, the cluster and field samples share some key characteristics. The cluster galaxies appear to lie in the same region of the sSFR–stellar mass plane as do the star-forming field galaxies. Similarly, the same evolutionary trend is apparent in both cluster and field samples, with the sSFR increasing over . The increase appears to be particularly rapid for the more massive cluster galaxies above , perhaps indicating that vigorous star formation is occurring in the massive central galaxies in these clusters at levels comparable to the field.
5.3. Star Formation vs. Radius and Redshift
To probe the effect of environment on star formation in clusters, we plot in Figure 6 (upper panel) the fraction of cluster members with vs. projected clustercentric radius. The sample is divided into three redshift bins, chosen to have roughly equal numbers of clusters in each bin, and the errors are estimated via bootstrap resampling.
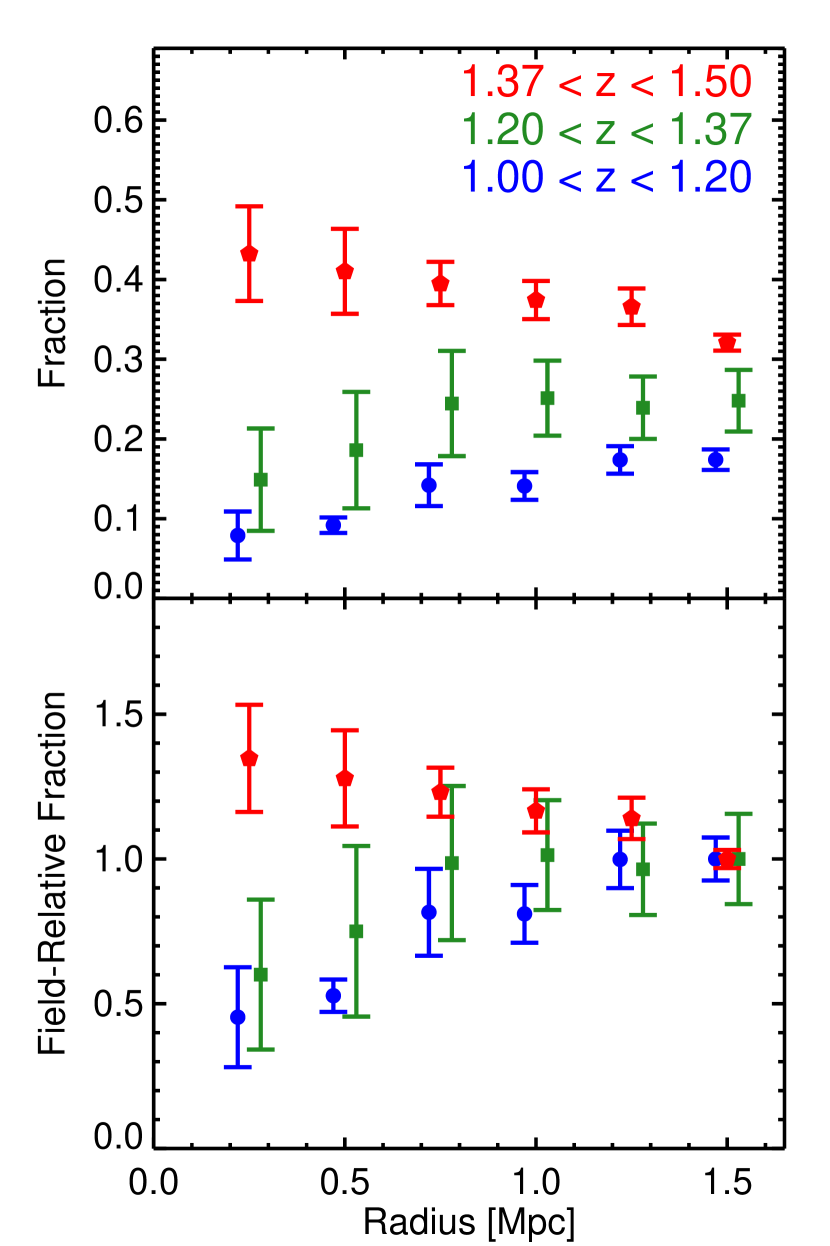
In the lowest redshift bin () the LIRG fraction within is roughly consistent with that seen at by Finn et al. (2010) in the ESO Distant Cluster Survey (EDisCS; White et al., 2005), although that work probes to lower IR luminosities ( ). At the other extreme, the most distant ISCS clusters have a LIRG fraction similar to, or even somewhat higher than, IR-selected cluster ClG J0218.3-0510 at (Tran et al., 2010). However, as demonstrated below, there is significant cluster to cluster variation in star formation properties, so comparisons of individual clusters should be interpreted with caution.
For the ISCS clusters in the two bins at the fraction of star-forming members drops significantly from a radius of about 1.5 Mpc, which is outside the virial radius ( Mpc) for this sample, to the inner 250 kpc. This is expected due to the quenching of star formation in the central regions of clusters. Indeed, Muzzin et al. (2012) find a very similar star formation-radius trend in the GCLASS sample at .
However, in the highest redshift bin () we find the star-forming fraction does not drop, but rather rises with decreasing radius right into the cluster cores. This is consistent, in an evolutionary sense, with the observation of Muzzin et al. (2012) that the fraction of post-starburst galaxies in lower-redshift () clusters increases toward the core. Indeed, there is sufficient time between and ( Gyr) for a significant fraction of the ISCS starbursts to evolve into post-starbursts, but only if their star formation is rapidly quenched.
The upper panel of Figure 6 also shows that the fraction of star-forming galaxies in the field, taken here to be the values observed at a radius of 1.5 Mpc, is also increasing with redshift. To better isolate the cluster-specific evolution, the fractions in each redshift bin are normalized to this field value in the lower panel of Figure 6. This plot demonstrates that there is a very clear transition occurring in the cluster galaxies between the highest and middle redshift bins, beyond the global evolution underway in the field. Indeed, the star-forming fraction increases monotonically from the field level, rising into the cluster cores.
To better explore the star formation properties as a function of environment, in Figure 7 (upper panel) we plot the SFR surface density versus clustercentric projected radius. There is a strong radial trend, with the SFR surface density increasing by a factor of 2–3 from the outskirts to the centers of clusters at . This is expected even in a quenched environment since the sheer number of galaxies per unit area is increasing towards the cluster cores more rapidly than the SFR is falling.
The SFR surface density trend with radius is considerably more dramatic for clusters in the highest redshift bin (), where it increases by a factor of , reaching a SFR surface density of nearly yr-1arcmin-2 within 250 kpc, i.e., in the cluster cores. Building on the rising star-forming fraction discussed above, this measurement highlights the strong central star formation occurring in clusters at . We confirm the largely qualitative measurements made on individual, serendipitously-discovered clusters at similar redshifts; (Hilton et al., 2010; Hayashi et al., 2011), (Fassbender et al., 2011b), (Santos et al., 2011) and (Tran et al. 2010; Tadaki et al. 2012).
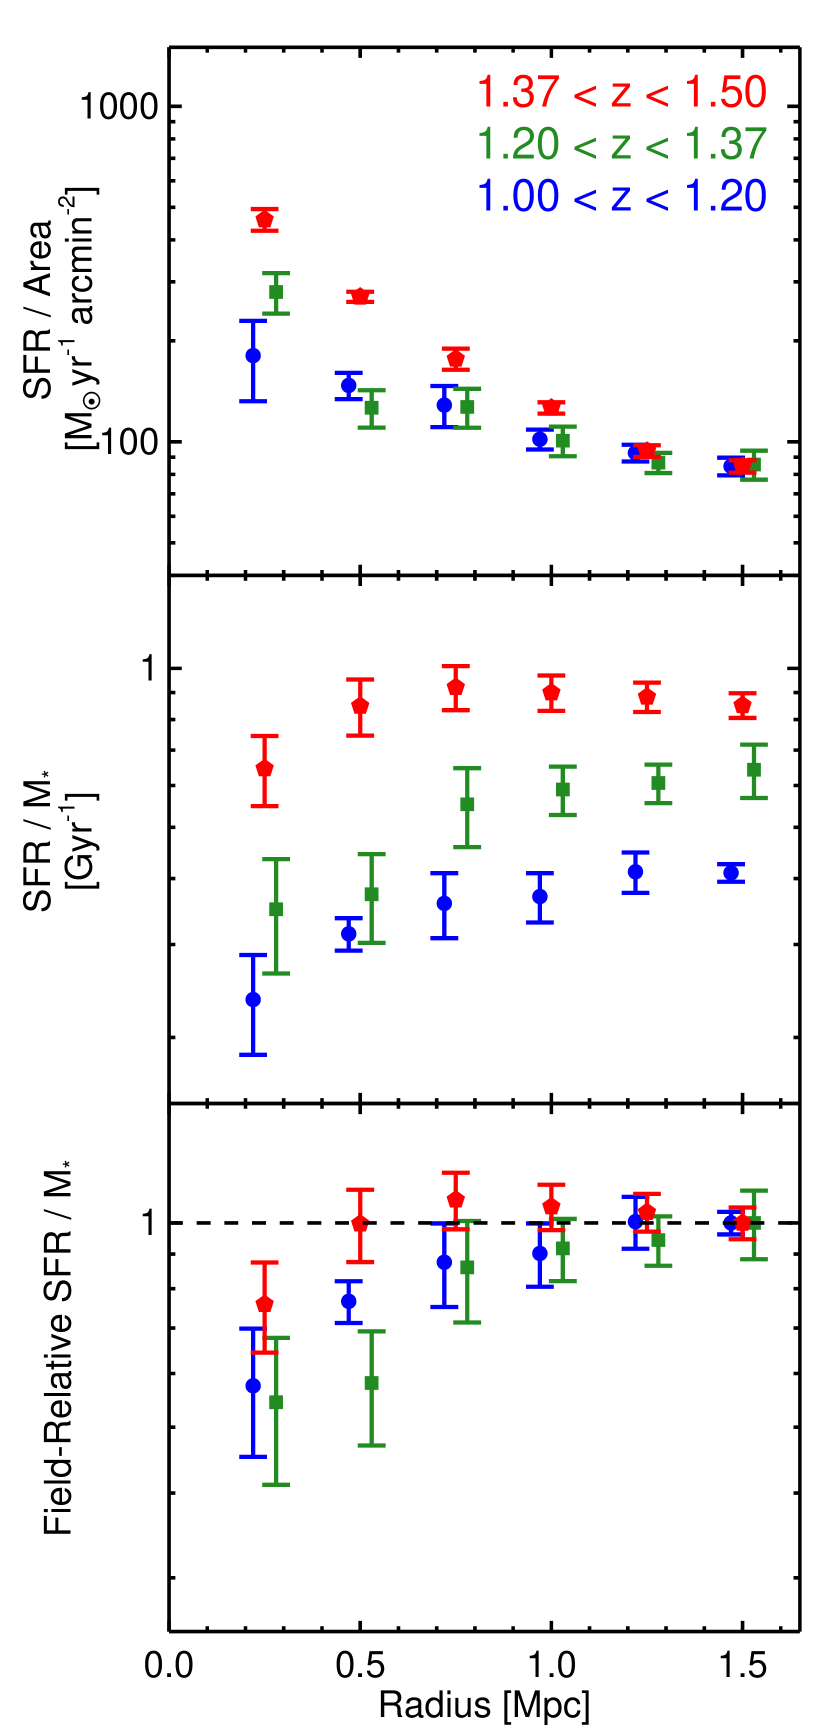
The middle panel of Fig. 7 shows the trend of sSFR vs. clustercentric radius. In the redshift bins at , the sSFR decreases from a level similar to field galaxies in the outskirts (see, e.g., Fig 5) to lower levels toward the center, a drop of a factor of . Although the SFR surface density increases in the cluster cores at these redshifts, the stellar mass density is increasing faster, leading to falling sSFR values as in lower redshift clusters, albeit scaled up by a factor of from the local Universe (e.g., Chung et al., 2011).
Conversely, the SFR is increasing so rapidly toward the centers of the clusters in the most distant redshift bin () that the sSFR is approximately flat right into the cluster cores. This is the physically crucial transition, as it indicates the redshift at which the star formation in recently accreted galaxies has not yet started to be meaningfully quenched. These central cluster galaxies are forming stars as rapidly for their mass as their field galaxy counterparts.
The radial dependence of the sSFRs in all three redshift bins largely reflects that seen in the star-forming fractions in Fig. 6. This indicates that this activity is happening across the entire cluster galaxy population, not in just a few star formation-dominated ULIRGs. Indeed, as shown in the lower panel of Figure 3, the bulk of the 24 m-detected population are LIRGs typical of this redshift regime.
In the lower panel of Fig. 7 we plot the field-normalized radial sSFR trend, where the field sSFR in each redshift bin is again taken to be the measurement at a radius of 1.5 Mpc. This removes the strong evolution in field galaxy sSFR, and allows a quantitative test of the hypothesis that clusters in the highest redshift bin no longer exhibit environmental quenching. The horizontal line illustrates the expected cluster sSFR in this scenario, identical to the field at all radii. Comparisons of the goodness of fit of this hypothesis to the field-normalized cluster sSFR trends produce values of 6.50, 5.71 and 1.15 for these sample bins, in order of increasing redshift. Thus, the no-quenching model is ruled out for the lower redshift bins at 4.6 and 4.2 , with probability-to-exceed (PTE) values of and , respectively. Conversely, the high redshift bin is a satisfactory fit to the no-quenching model, in agreement at the 0.97 level, corresponding to a PTE of 0.31. Despite this statistical consistency, the sSFR appears slightly depressed in the innermost radius bin suggesting there may still be a small amount of quenching in the very center even at this redshift.
5.4. Cluster-to-Cluster Variation
The errors on which this statistical test relies are derived from bootstrap resampling the members in each redshift and radius bin and therefore reflect the scatter due to population variance in each bin. To ensure that the abrupt transition in the highest redshift bin is not due to a single discrepant cluster, we removed each of the 6 highest redshift clusters in turn and recomputed the central sSFR from the remaining 5 clusters. The scatter from this jackknife process is smaller than the plotted member-weighted bootstrap errors, confirming that the transition is characteristic of the cluster sample as a whole.
Figure 8 shows histograms in total cluster SFR (left) and sSFR (right) in two mass bins for the 16 clusters in the present sample. The high-mass and low-mass cluster members make similar contributions to the total SFR within 1 projected Mpc. Thus, the enhanced central star formation seen above is occurring in all galaxies, including the very massive ones. This is in sharp contrast to the situation at low redshift, where massive central galaxies are largely quiescent.
The sSFR distribution is higher for lower mass galaxies, as seen in the previous sections. The cluster-to-cluster variation in the SFR and sSFR, in both mass bins, is a factor of 3–5. About half of this variation is due to the global evolution in the sSFR over the redshift range probed (Fig. 7). For reference, the field galaxy sSFR values in the same mass and redshift bins, from Santini et al. (2009), are indicated with arrows.
6. Discussion
6.1. The Era of Star Formation in Galaxy Clusters
These measurements of the star formation properties in high-redshift ISCS galaxy clusters expand on previous studies in several important ways. The sample of 16 IR-selected, spectroscopically confirmed clusters is the largest to date. The SFRs are measured using mid-IR photometry that is sensitive to the obscured star formation that dominates the SFR budget, and contaminating AGNs have been removed using X-ray and mid-infrared methods. The cluster sample spans the redshift interval between the era, at , where clusters cores are less active, and the era at where this trend appears to reverse. Secure spectroscopic or accurate photometric redshifts for all members, coupled with multi-wavelength SED-fitted stellar masses and 24 m-based SFRs, allow robust measurement of the evolution of the SFR and sSFR in high redshift clusters in bins of redshift, radius and galaxy mass.
We confirm the high fraction of star-forming members in clusters reported by previous groups in individual clusters (e.g., Tran et al., 2010; Hilton et al., 2010; Lemaux et al., 2010; Hayashi et al., 2011; Fassbender et al., 2011a; Tadaki et al., 2012). We quantify the star-forming fraction, SFR and sSFR, and robustly detect a transition between passive, star formation-quenched low-redshift clusters and relatively unquenched high-redshift clusters with high central SFRs. For clusters in the mass range of the ISCS sample ( at ) the transition to the unquenched star formation era occurs at .
6.2. Quenching Mechanisms
The commonly invoked quenching mechanisms in clusters, strangulation (Larson et al., 1980) and ram pressure stripping (Gunn and Gott, 1972), likely operate at some level in these clusters. While the quenching timescale for strangulation (several Gyr) is too long to cause the transition observed in this work, the stripping of the loosely-bound outer-halo hot gas reservoirs prevents subsequent fueling and star formation episodes at late times (i.e. at ).
Ram pressure stripping can remove tightly bound disk gas on relatively rapid timescales ( Gyr), particularly in clusters in which the dynamical time is fairly short. As such, it can rapidly quench star formation in cluster galaxies. However, the ram pressure goes as the square of the orbital velocity, and hence is more effective in massive, high-dispersion ( km s-1) clusters than in typical ISCS clusters, which have more modest dispersions ( km s-1; Brodwin et al. 2011). Further, detailed simulations of ram pressure stripping suggest that at least 30% of a galaxy’s disk gas remains unstripped 10 Gyr after initial infall (McCarthy et al., 2008). Therefore, while this mechanism may be responsible for a portion of the quenching, it likely cannot fully explain the strong quenching occurring over (Figs. 6 and 7). In the more passive era following the one studied in the present work, over , Alberts et al. (2013) observe a gradual, continuous quenching of star formation in ISCS clusters. They suggest this is likely a due to a combination of strangulation and ram pressure stripping.
The transition at is strikingly similar to the recent results of Mancone et al. (2010, see their Fig. 7). That work measured rest-frame infrared luminosity functions for the full ISCS cluster sample, consisting of 335 clusters over . Using the same accurate photometric redshifts as in the present work, the evolution in the cluster luminosity function was mapped out at both 3.6m and 4.5m. At the evolution in the characteristic magnitude , an extremely good proxy for stellar mass given the rest-frame NIR sampling, was fully consistent with the passive evolution model found in most other studies (e.g., Stanford et al., 1998). However, at , Mancone et al. (2010) found an abrupt mag dimming of in the cluster luminosity functions, corresponding to a stellar mass growth of a factor of from to . This was interpreted as evidence of mass assembly via merging in these high-redshift cluster galaxies.
Evidence that mergers may play an important role in the evolution of galaxy populations in distant clusters has been accumulating. Luminosity functions presented by several groups exhibit a paucity of massive () member galaxies on the red sequence at (Hilton et al., 2009, 2010; Fassbender et al., 2011a; Rudnick et al., 2012; Mancone et al., 2012). Direct and indirect evidence for a sharply increased merging rate, a factor of 3–10 higher than in contemporaneous field galaxies, has been seen in a cluster (Lotz et al., 2013; Rudnick et al., 2012). Evidence for a stochastic star formation history, with young early-type galaxies (presumably formed via mergers) continuously arriving on the cluster red sequence at , has been reported by Snyder et al. 2012 (see also Jaffé et al. 2011). A rapid two-order-of-magnitude increase in the fraction of AGN in clusters at is reported by Martini et al. (2013). Finally, a high fraction of post-starbust central galaxies are detected in somewhat lower redshift () clusters (Poggianti et al., 2009; Muzzin et al., 2012).
From the Spitzer/IRAC data at 3.6m and 4.5m, Mancone et al. (2010) could not discern whether this epoch of assembly in ISCS clusters consisted of mergers that were “wet” (i.e., collisional mergers of gas-rich galaxies, triggering a starburst and fueling black hole accretion via nuclear inflow of gas; e.g., Barnes and Hernquist 1991; Springel et al. 2005; Hopkins et al. 2006; Narayanan et al. 2010) or “dry” (collisionless mergers of gas-free galaxies; e.g., van Dokkum 2005; Bell et al. 2006). With the longer wavelength MIPS data, we now have at least circumstantial evidence that a substantial fraction of the mergers inferred by that work are likely inducing massive starbursts. Visual inspection of several of the highest galaxies in high-resolution HST images shows a large number of disturbed and/or merging systems. This evidence for “wet” mergers corroborates the findings of Desai et al. (2011) that low redshift elliptical galaxies have residual 24 m emission, suggestive of past collisional mergers. A complete statistical description of the star formation properties of a morphological, merger-selected sample of ISCS cluster members will be presented in a future paper.
If these observed starbursts are merger-induced, recent simulations (e.g., Springel et al., 2005; Hopkins et al., 2006; Narayanan et al., 2010) predict that AGN feedback may also play a significant role in quenching the star formation in these cluster galaxies. In these models, a merger of gas-rich progenitors triggers both massive starbursts and fuels a powerful central AGN. The AGN heats and expels the remaining gas, leading to a rapid quenching of star formation, on Myr timescales. This model helps explain the transition observed in the ISCS cluster galaxies and provides a mechanism that allows them to appear to be passively evolving only Gyr later. The most massive merger-induced starbursts will likely also experience significant feedback from supernovae and strong stellar winds which can efficiently expel gas, particularly in the outer regions of the galaxies (Diamond-Stanic et al., 2012).
The observed starbursts are not likely to be driven by cold-mode accretion (e.g., Kereš et al., 2005; Dekel and Birnboim, 2006; Dekel et al., 2009; Nelson et al., 2013) as these cluster galaxies reside within a hot ICM that should prevent cold streams to all galaxies except possibly the BCG. Further, this scenario offers no straightforward way to rapidly quench the star formation for sub-L∗ galaxies. The cold-stream only shuts off when the halo reaches a mass large enough ( ) to shock heat the infalling gas. Indeed, the simulations of Kereš et al. (2005) show that cold flows are only important in areas of low galaxy density. In groups or clusters the contribution of cold-mode accretion is expected to be negligible.
6.3. A Model for Galaxy Cluster Evolution
The standard cluster formation paradigm explains many of the observed properties of cluster galaxies. It holds that both the primordial cluster seed galaxies and those accreted from the field are stripped of their hot, loosely-bound gaseous halos by the ICM. Over a dynamical time ( Gyr in high-redshift clusters) ram pressure stripping removes of order half of the cool gas from the galaxy disks (McCarthy et al., 2008). Cold mode accretion is inefficient in hot cluster halos (Kereš et al., 2005), so in the absence of mergers secular star formation ceases when the remaining cool gas supply in the galaxy disks is exhausted. At this point the galaxies become quiescent and evolve passively thereafter, becoming “red and dead” by the present day. While many elements of this model are probably correct, it does not explain the extensive star formation (this work; Snyder et al. 2012; Zeimann et al. 2013; Alberts et al. 2013), merger (Mancone et al., 2010) and AGN activity (Galametz et al., 2010; Wagg et al., 2012; Martini et al., 2013) observed to be taking place in the ISCS clusters at .
We find evidence for an additional, significant epoch of merging activity taking place in clusters at , which is also the era of peak star formation and AGN activity in the general galaxy population. This merging epoch, observed statistically by Mancone et al. (2010) in the rest-frame near-IR cluster luminosity functions, is occurring between gas-rich progenitors and leads to vigorous starbursts that we detect in the mid-IR. The resulting SFRs in some galaxies are so high they would, if allowed to proceed unquenched, consume the bulk of the cold gas remaining in these cluster galaxies on a very short timescale ( Myr). The mergers also feed the accretion of central black holes. When these black holes enter an active AGN phase, they heat and/or expel the remaining cold gas, abruptly quenching the star formation.
This model explains the bulk of the observations of cluster evolution to date. In particular, it offers a more physically motivated explanation for the apparent pure passive evolution seen in cluster studies (e.g., Stanford et al., 1998; van Dokkum and van der Marel, 2007; Muzzin et al., 2008). These studies typically employ models in which the last significant SF activity occurred at . These models are ruled out by recent observations of vigorous star formation in high redshift clusters, most dramatically in the present paper. While a passive model fit the Mancone et al. (2010) observations for clusters at , it failed completely at higher redshift, where the galaxies were substantially less massive than expected in a merger-free passive model. Similarly, the rapid reddening observed in E08 at (their Fig. 19) is better explained by an epoch of merger-driven obscured star formation than by a sudden change in the passive-model formation redshift from to . In the AGN-quenched model, cluster galaxies will have faded, reddened and appear “red and dead” by (1-2 Gyr after quenching). If the galaxies evolve passively thereafter, they will appear in the present day to have luminosity-weighted pure passive-model formation redshifts of . That is an average of the more extended and punctuated star formation history, from formation at to final starburst ending at .
Indeed, recent analyses of the colors and scatters of red-sequences in high-redshift clusters, such as Jaffé et al. (2011) and Snyder et al. (2012), have tested models with ongoing stochastic or even continuous star formation, ending Gyr prior to the epoch of observation. They find good fits for models in which the interval between formation and final placement on the cluster red-sequence is similar to the timescale for AGN-quenching in mergers. These delayed models, in which the last big epoch of star formation occurs at but is complete by , are qualitatively consistent with the ISCS cluster observations and the picture we have presented to describe them.
Unlike explanations of low-redshift galaxy properties, such as the black hole-bulge mass relation (e.g., Ferrarese and Merritt, 2000) or the very red colors of the most massive field galaxies (e.g., Croton et al., 2006), mergers in this work were not merely invoked as a useful mechanism to explain the observations. The era of significant merging was first observed (statistically) in Mancone et al. (2010), and in the present work we directly observe in the same clusters the vigorous starbursts expected from gas-rich mergers. Further, we indirectly observe the rapid quenching of that star formation expected due to feedback from the central AGN. The AGN feedback scenario offers a natural explanation for all these observations and, furthermore, makes several falsifiable predictions.
Most directly it predicts a strong increase in the incidence of AGN activity in clusters at compared with those at lower redshifts. Evidence of this has already been seen by several groups (e.g., Martini et al., 2009; Kocevski et al., 2009a; Lemaux et al., 2010; Fassbender et al., 2012; Tanaka et al., 2013) including our own statistical analysis of the full ISCS sample (Galametz et al., 2009) in which we find that X-ray-selected AGN are at least 3 times more prevalent in clusters at compared with clusters at . Since cold flows are inefficient in hot cluster halos, the role of mergers in rich environments is likely to be even more important than in the field. We therefore might expect not only a rapid increase in the incidence of AGN activity in clusters with increasing redshift, but an increase that is significantly more rapid than is occurring in the field. A detailed new analysis of the clusters in this work (Martini et al., 2013), using deep X-ray data and extensive spectroscopy, confirms this is the case. Although the AGN fraction is times higher in the field than in clusters in the local Universe, the fractions are comparable at . Martini et al. (2013) conclude that this differential evolution of the AGN fraction in the field and clusters is strong evidence for environment-dependent AGN evolution.
This model also corroborates the findings of Brodwin et al. (2008) that the brightest Dust-Obscured Galaxies (DOGS, Dey et al., 2008; Pope et al., 2008), which are dusty AGN-dominated ULIRGs at (also see Farrah et al. 2006; Magliocchetti et al. 2008; Starikova et al. 2012; Viero et al. 2013), have similar clustering properties to galaxy groups and are located in rare, rich environments. Although this extreme population is excluded from the present study by our AGN rejection and the limited redshift overlap with the clusters in this sample, this evolutionary relationship between DOGs and clusters is an interesting and important topic that will be addressed in a future paper (Williams et al. in prep.).
In addition to rendering cluster galaxies largely quiescent at , in this model cluster galaxies at such redshifts should show signs of both recent starburst activity and of rapid AGN-driven quenching. This is seen in a several studies, with high post-starburst and low-level AGN fractions in clusters at (e.g., Kocevski et al., 2009b; Lemaux et al., 2010; Muzzin et al., 2012).
6.4. Epoch of Merging in ISCS Clusters
Mergers are most efficient when galaxy space densities are high and relative velocities are low. In the local Universe, group environments, with their relatively high source densities and modest velocity dispersions, are expected to have the highest merging frequency (Hopkins et al., 2008). Dispersions are too high ( km s-1) in present-day massive clusters ( ) to produce much merging. But the progenitors of these massive clusters had smaller halo masses and velocity dispersions, and higher densities of galaxies with extended gas-rich disks, all of which led to a higher merging efficiency. For clusters with masses typical of the ISCS sample ( at ), major merging had likely been occurring continuously since initial formation, but should have begun to subside by due to ever-growing velocity dispersions. Indeed, in their long-baseline Herschel stacking study, Alberts et al. (2013) only find evidence for substantial merging in ISCS clusters at . An enhanced merger rate is also directly observed in ClG J0218.3-0510 at (Lotz et al., 2013) and inferred by Rudnick et al. (2012) from the evolution of its luminosity function.
If this model is correct, more massive high-redshift clusters such as SPT-CL J0205-5829 at (Stalder et al., 2013), XMMU J2235.3-2557 at (Mullis et al., 2005; Rosati et al., 2009) and SPT-CL J2040-4451 at (Bayliss et al., 2013), with masses of , and , respectively, should no longer be experiencing efficient merging due to their high in situ velocity dispersions. Rather their transition redshifts, when phase space conditions were more conducive to major merging activity, should be considerably higher than that seen in the ISCS. Indeed, these clusters have relatively low central star formation rates (Stalder et al., 2013; Grützbauch et al., 2012; Bayliss et al., 2013; Santos et al., 2013), below those in the present work, consistent with already being largely quenched and passive in their cores. A related prediction is that the scatter in the colors of red-sequence galaxies in these very massive clusters should be smaller than that measured by Snyder et al. (2012) for ISCS clusters at similar redshifts.
Another test of this prediction is forthcoming, using the massive cluster IDCS J1426.5+3508 at (Brodwin et al., 2012; Gonzalez et al., 2012; Stanford et al., 2012). This cluster is, in an evolutionary sense, a precursor of these three massive clusters and of the most massive clusters at all redshifts, including Coma. Its star formation properties, measured from deep Herschel observations, will be presented in an upcoming paper (Alberts et al. in prep). Though very massive for its redshift ( ) it is very compact, with the majority of the infrared overdensity within a projected radius of . As such, conditions may be still be suitable for substantial merging and merging-induced starbursts.
7. Conclusions
We have investigated the star formation properties of 16 high-redshift, IR-selected galaxy clusters from the ISCS. Using deep Spitzer 24 m imaging, we characterized the obscured star formation in these clusters as a function of redshift, stellar mass and clustercentric radius. For 6 of these clusters, including 5 at , we also provide the ground-based spectroscopic confirmation. Redshifts from the HST/WFC3 grism, along with a complementary analysis of the unobscured H star formation activity, are presented in Zeimann et al. (2013).
The primary result is that ISCS clusters have substantial star formation activity occurring at all radii, including in the cluster cores. The SFRs in these cluster galaxies are similar to that of field galaxies at similar redshifts, suggesting that we are probing the era before cluster quenching was complete. As we have conservatively rejected X-ray and IR AGN from this study, these cluster star formation rates are lower limits.
The transition between the low redshift () era, in which cluster galaxies are significantly quenched relative to the field, and the era of cluster formation, in which cluster galaxies form stars at the same rate as field galaxies for their masses, occurs at in the ISCS sample. Below this redshift, although significant star formation occurs in clusters at all radii, the sSFR drops near the core, suggesting active environmental-dependent quenching. At redshifts above , there is evidence from both the fraction of star-forming galaxies and the sSFR that quenching in the cores is minimal. Above this redshift, cluster galaxies are forming stars at the rate expected for field galaxies of similar mass, independent of their location in the cluster.
There is a factor of 3–5 variation in the star formation activity from cluster to cluster in this IR-selected sample. About half of that variation is due to the observed redshift evolution, but the rest is intrinsic scatter in the population. This variance suggests that substantially larger samples will be required to improve upon the present work. In particular, single-cluster studies are difficult to interpret and to place in a meaningful evolutionary context.
Combining the present measurements with recent independent results from the ISCS survey, such as the strong increase in AGN density (Martini et al., 2013), the stochastic star formation histories (Snyder et al., 2012; Alberts et al., 2013), and the statistical evidence for a significant assembly epoch at (Mancone et al., 2010), we suggest that mergers likely play a significant role in the observed star formation activity. In addition to plausibly inducing the large starbursts seen in these cluster galaxies, merger-fueled AGN feedback (e.g., Hopkins et al., 2006) may naturally explain the rapid truncation of star formation that occurs between and , by which time the cores of clusters become largely quiescent (e.g., Vulcani et al., 2010; Finn et al., 2010; Muzzin et al., 2012) with high post-starburst fractions (Poggianti et al., 2009; Muzzin et al., 2012).
If mergers do play a significant role in the transition between the unquenched and quenched eras, the redshift of this transition is likely strongly dependent on cluster halo mass. Mergers require relatively low velocity dispersions, so a prediction of this work is that more massive clusters than those in the ISCS sample would experience this transition at higher redshifts. Studies of the star formation properties in the few known high-mass, high-redshift clusters (Stalder et al., 2013; Grützbauch et al., 2012; Bayliss et al., 2013; Santos et al., 2013) support this expectation.
References
- Alberts et al. (2013) Alberts, S., et al. 2013, MNRAS, in press
- Ashby et al. (2009) Ashby, M. L. N., et al. 2009, ApJ, 701, 428
- Bai et al. (2007) Bai, L., et al. 2007, ApJ, 664, 181
- Bai et al. (2009) Bai, L., Rieke, G. H., Rieke, M. J., Christlein, D., and Zabludoff, A. I. 2009, ApJ, 693, 1840
- Barnes and Hernquist (1991) Barnes, J. E. and Hernquist, L. E. 1991, ApJ, 370, L65
- Bayliss et al. (2013) Bayliss, M. B., et al. 2013, ApJ, submitted (arXiv:1307.2903)
- Bell et al. (2003) Bell, E. F., McIntosh, D. H., Katz, N., and Weinberg, M. D. 2003, ApJS, 149, 289
- Bell et al. (2006) Bell, E. F., et al. 2006, ApJ, 640, 241
- Blakeslee et al. (2006) Blakeslee, J. P., et al. 2006, ApJ, 644, 30
- Brodwin et al. (2006) Brodwin, M., et al. 2006, ApJ, 651, 791
- Brodwin et al. (2008) Brodwin, M., et al. 2008, ApJ, 687, L65
- Brodwin et al. (2007) Brodwin, M., Gonzalez, A. H., Moustakas, L. A., Eisenhardt, P. R., Stanford, S. A., Stern, D., and Brown, M. J. I. 2007, ApJ, 671, L93
- Brodwin et al. (2012) Brodwin, M., et al. 2012, ApJ, 753, 162
- Brodwin et al. (2011) Brodwin, M., et al. 2011, ApJ, 732, 33
- Bruzual and Charlot (2003) Bruzual, G. and Charlot, S. 2003, MNRAS, 344, 1000
- Chabrier (2003) Chabrier, G. 2003, PASP, 115, 763
- Chary and Elbaz (2001) Chary, R. and Elbaz, D. 2001, ApJ, 556, 562
- Chung et al. (2011) Chung, S. M., Eisenhardt, P. R., Gonzalez, A. H., Stanford, S. A., Brodwin, M., Stern, D., and Jarrett, T. 2011, ApJ, 743, 34
- Chung et al. (2010) Chung, S. M., Gonzalez, A. H., Clowe, D., Markevitch, M., and Zaritsky, D. 2010, ApJ, 725, 1536
- Coia et al. (2005) Coia, D., et al. 2005, A&A, 431, 433
- Coleman et al. (1980) Coleman, G. D., Wu, C.-C., and Weedman, D. W. 1980, ApJS, 43, 393
- Cooper et al. (2008) Cooper, M. C., et al. 2008, MNRAS, 383, 1058
- Croton et al. (2006) Croton, D. J., et al. 2006, MNRAS, 365, 11
- Dekel and Birnboim (2006) Dekel, A. and Birnboim, Y. 2006, MNRAS, 368, 2
- Dekel et al. (2009) Dekel, A., et al. 2009, Nature, 457, 451
- Desai et al. (2011) Desai, V., Dey, A., Cohen, E., Le Floc’h, E., and Soifer, B. T. 2011, ApJ, 730, 130
- Dey et al. (2008) Dey, A., et al. 2008, ApJ, 677, 943
- Diamond-Stanic et al. (2012) Diamond-Stanic, A. M., Moustakas, J., Tremonti, C. A., Coil, A. L., Hickox, R. C., Robaina, A. R., Rudnick, G. H., and Sell, P. H. 2012, ApJ, 755, L26
- Eisenhardt et al. (2004) Eisenhardt, P. R., et al. 2004, ApJS, 154, 48
- Eisenhardt et al. (2008) Eisenhardt, P. R. M., et al. 2008, ApJ, 684, 905
- Elbaz et al. (2007) Elbaz, D., et al. 2007, A&A, 468, 33
- Elbaz et al. (2010) Elbaz, D., et al. 2010, A&A, 518, L29
- Elston et al. (2006) Elston, R. J., et al. 2006, ApJ, 639, 816
- Farrah et al. (2006) Farrah, D., et al. 2006, ApJ, 643, L139
- Fassbender et al. (2011a) Fassbender, R., et al. 2011a, New J. Phys., 13, 125014
- Fassbender et al. (2011b) Fassbender, R., et al. 2011b, A&A, 527, L10
- Fassbender et al. (2012) Fassbender, R., Šuhada, R., and Nastasi, A. 2012, Advances in Astronomy 2012
- Ferrarese and Merritt (2000) Ferrarese, L. and Merritt, D. 2000, ApJ, 539, L9
- Finn et al. (2010) Finn, R. A., et al. 2010, ApJ, 720, 87
- Galametz et al. (2009) Galametz, A., et al. 2009, ApJ, 694, 1309
- Galametz et al. (2010) Galametz, A., Stern, D., Stanford, S. A., De Breuck, C., Vernet, J., Griffith, R. L., and Harrison, F. A. 2010, A&A, 516, A101
- Geach et al. (2006) Geach, J. E., et al. 2006, ApJ, 649, 661
- Gonzalez et al. (2012) Gonzalez, A. H., et al. 2012, ApJ, 753, 163
- Grützbauch et al. (2012) Grützbauch, R., Bauer, A. E., Jørgensen, I., and Varela, J. 2012, MNRAS, p. 3149
- Gunn and Gott (1972) Gunn, J. E. and Gott, III, J. R. 1972, ApJ, 176, 1
- Haines et al. (2009) Haines, C. P., et al. 2009, ApJ, 704, 126
- Hayashi et al. (2011) Hayashi, M., Kodama, T., Koyama, Y., Tadaki, K.-I., and Tanaka, I. 2011, MNRAS, 415, 2670
- Hilton et al. (2010) Hilton, M., et al. 2010, ApJ, 718, 133
- Hilton et al. (2009) Hilton, M., et al. 2009, ApJ, 697, 436
- Hopkins et al. (2006) Hopkins, P. F., Hernquist, L., Cox, T. J., Di Matteo, T., Robertson, B., and Springel, V. 2006, ApJS, 163, 1
- Hopkins et al. (2008) Hopkins, P. F., Hernquist, L., Cox, T. J., and Kereš, D. 2008, ApJS, 175, 356
- Jaffé et al. (2011) Jaffé, Y. L., Aragón-Salamanca, A., De Lucia, G., Jablonka, P., Rudnick, G., Saglia, R., and Zaritsky, D. 2011, MNRAS, 410, 280
- Jannuzi and Dey (1999) Jannuzi, B. T. and Dey, A. 1999, in ASP Conf. Ser. 191 — Photometric Redshifts and the Detection of High Redshift Galaxies, p. 111
- Jee et al. (2011) Jee, M. J., et al. 2011, ApJ, 737, 59
- Kereš et al. (2005) Kereš, D., Katz, N., Weinberg, D. H., and Davé, R. 2005, MNRAS, 363, 2
- Kinney et al. (1996) Kinney, A. L., Calzetti, D., Bohlin, R. C., McQuade, K., Storchi–Bergmann, T., and Schmitt, H. R. 1996, ApJ, 467, 38
- Kocevski et al. (2009a) Kocevski, D. D., Lubin, L. M., Gal, R., Lemaux, B. C., Fassnacht, C. D., and Squires, G. K. 2009a, ApJ, 690, 295
- Kocevski et al. (2009b) Kocevski, D. D., Lubin, L. M., Lemaux, B. C., Gal, R. R., Fassnacht, C. D., Lin, R., and Squires, G. K. 2009b, ApJ, 700, 901
- Kochanek et al. (2012) Kochanek, C. S., et al. 2012, ApJS, 200, 8
- Komatsu et al. (2011) Komatsu, E., et al. 2011, ApJS, 192, 18
- Koyama et al. (2008) Koyama, Y., et al. 2008, MNRAS, 391, 1758
- Krick et al. (2009) Krick, J. E., Surace, J. A., Thompson, D., Ashby, M. L. N., Hora, J. L., Gorjian, V., and Yan, L. 2009, ApJ, 700, 123
- Kroupa (2001) Kroupa, P. 2001, MNRAS, 322, 231
- Larson et al. (1980) Larson, R. B., Tinsley, B. M., and Caldwell, C. N. 1980, ApJ, 237, 692
- Le Borgne et al. (2003) Le Borgne, J.-F., et al. 2003, A&A, 402, 433
- Lemaux et al. (2010) Lemaux, B. C., Lubin, L. M., Shapley, A., Kocevski, D., Gal, R. R., and Squires, G. K. 2010, ApJ, 716, 970
- Lotz et al. (2013) Lotz, J. M., et al. 2013, ApJ, 773, 154
- Magliocchetti et al. (2008) Magliocchetti, M., et al. 2008, MNRAS, 383, 1131
- Magnelli et al. (2009) Magnelli, B., Elbaz, D., Chary, R. R., Dickinson, M., Le Borgne, D., Frayer, D. T., and Willmer, C. N. A. 2009, A&A, 496, 57
- Mancone et al. (2012) Mancone, C. L., et al. 2012, ApJ, 761, 141
- Mancone et al. (2010) Mancone, C. L., Gonzalez, A. H., Brodwin, M., Stanford, S. A., Eisenhardt, P. R. M., Stern, D., and Jones, C. 2010, ApJ, 720, 284
- Marcillac et al. (2006) Marcillac, D., Elbaz, D., Chary, R. R., Dickinson, M., Galliano, F., and Morrison, G. 2006, A&A 451, 57
- Marcillac et al. (2007) Marcillac, D., Rigby, J. R., Rieke, G. H., and Kelly, D. M. 2007, ApJ, 654, 825
- Martini et al. (2013) Martini, P., et al. 2013, ApJ, 768, 1
- Martini et al. (2009) Martini, P., Sivakoff, G. R., and Mulchaey, J. S. 2009, ApJ, 701, 66
- McCarthy et al. (2008) McCarthy, I. G., Frenk, C. S., Font, A. S., Lacey, C. G., Bower, R. G., Mitchell, N. L., Balogh, M. L., and Theuns, T. 2008, MNRAS, 383, 593
- Mei et al. (2009) Mei, S., et al. 2009, ApJ, 690, 42
- Moustakas et al. (2013) Moustakas, J., et al. 2013, ApJ, 767, 50
- Mullis et al. (2005) Mullis, C. R., Rosati, P., Lamer, G., Böhringer, H., Schwope, A., Schuecker, P., and Fassbender, R. 2005, ApJ, 623, L85
- Murphy et al. (2009) Murphy, E. J., Chary, R., Alexander, D. M., Dickinson, M., Magnelli, B., Morrison, G., Pope, A., and Teplitz, H. I. 2009, ApJ, 698, 1380
- Murphy et al. (2011) Murphy, E. J., et al. 2011, ApJ, 737, 67
- Murray et al. (2005) Murray, S. S., et al. 2005, ApJS, 161, 1
- Muzzin et al. (2008) Muzzin, A., Wilson, G., Lacy, M., Yee, H. K. C., and Stanford, S. A. 2008, ApJ, 686, 966
- Muzzin et al. (2012) Muzzin, A., et al. 2012, ApJ, 746, 188
- Narayanan et al. (2010) Narayanan, D., et al. 2010, MNRAS, 407, 1701
- Nelson et al. (2013) Nelson, D., Vogelsberger, M., Genel, S., Sijacki, D., Kereš, D., Springel, V., and Hernquist, L. 2013, MNRAS, 429, 3353
- Nordon et al. (2010) Nordon, R., et al. 2010, A&A, 518, L24
- Poggianti et al. (2009) Poggianti, B. M., et al. 2009, ApJ, 693, 112
- Polletta et al. (2007) Polletta, M., et al. 2007, ApJ, 663, 81
- Pope et al. (2008) Pope, A., et al. 2008, ApJ, 675, 1171
- Rodighiero et al. (2010) Rodighiero, G., et al. 2010, A&A, 518, L25
- Rosati et al. (2009) Rosati, P., et al. 2009, A&A, 508, 583
- Rudnick et al. (2012) Rudnick, G. H., Tran, K.-V., Papovich, C., Momcheva, I., and Willmer, C. 2012, ApJ, 755, 14
- Saintonge et al. (2008) Saintonge, A., Tran, K., and Holden, B. P. 2008, ApJ, 685, L113
- Santini et al. (2009) Santini, P., et al. 2009, A&A, 504, 751
- Santos et al. (2013) Santos, J. S., et al. 2013, MNRAS, 433, 1287
- Santos et al. (2011) Santos, J. S., et al. 2011, A&A, 531, L15
- Smith et al. (2010) Smith, G. P., et al. 2010, A&A, 518, L18
- Snyder et al. (2012) Snyder, G. F., et al. 2012, ApJ, 756, 114
- Springel et al. (2005) Springel, V., et al. 2005, Nature, 435, 629
- Stalder et al. (2013) Stalder, B., et al. 2013, ApJ 763, 93
- Stanford et al. (2012) Stanford, S. A., et al. 2012, ApJ, 753, 164
- Stanford et al. (2005) Stanford, S. A., et al. 2005, ApJ, 634, L129
- Stanford et al. (1998) Stanford, S. A., Eisenhardt, P. R., and Dickinson, M. 1998, ApJ, 492, 461
- Starikova et al. (2012) Starikova, S., Berta, S., Franceschini, A., Marchetti, L., Rodighiero, G., Vaccari, M., and Vikhlinin, A. 2012, ApJ, 751, 126
- Stern et al. (2005) Stern, D., et al. 2005, ApJ, 631, 163
- Stetson (1987) Stetson, P. B. 1987, PASP, 99, 191
- Tadaki et al. (2012) Tadaki, K.-i., et al. 2012, MNRAS, p. 3032
- Tanaka et al. (2013) Tanaka, M., et al. 2013, PASJ, 65, 17
- Tran et al. (2010) Tran, K., et al. 2010, ApJ, 719, L126
- Tran et al. (2009) Tran, K.-V. H., Saintonge, A., Moustakas, J., Bai, L., Gonzalez, A. H., Holden, B. P., Zaritsky, D., and Kautsch, S. J. 2009, ApJ, 705, 809
- van Dokkum (2005) van Dokkum, P. G. 2005, AJ 130, 2647
- van Dokkum and van der Marel (2007) van Dokkum, P. G. and van der Marel, R. P. 2007, ApJ, 655, 30
- Viero et al. (2013) Viero, M. P., et al. 2013, ApJ, 772, 77
- Vulcani et al. (2010) Vulcani, B., Poggianti, B. M., Finn, R. A., Rudnick, G., Desai, V., and Bamford, S. 2010, ApJ, 710, L1
- Wagg et al. (2012) Wagg, J., et al. 2012, ApJ, 752, 91
- Webb et al. (2013) Webb, T., et al. 2013, AJ, in press (arXiv:1304.3335)
- White et al. (2005) White, S. D. M., et al. 2005, A&A, 444, 365
- Zeimann et al. (2013) Zeimann, G. R., et al. 2013, ApJ, in press
- Zeimann et al. (2012) Zeimann, G. R., et al. 2012, ApJ, 756, 115