The Mid-Infrared Environments of High-Redshift Radio Galaxies
Abstract
Taking advantage of the impressive sensitivity of Spitzer to detect massive galaxies at high redshift, we study the mid-infrared environments of powerful, high-redshift radio galaxies at . Galaxy cluster member candidates were isolated using a single Spitzer/IRAC mid-infrared color criterion, (AB), in the fields of radio galaxies at . Using a counts-in-cell analysis, we identify a field as overdense when or more red IRAC sources are found within (i.e., Mpc at ) of the radio galaxy to the flux density limits of our IRAC data (Jy). We find that radio galaxies lie preferentially in medium to dense regions, with of the targeted fields denser than average. Our (shallow) s data permit the rediscovery of previously known clusters and protoclusters associated with radio galaxies as well as the discovery of new promising galaxy cluster candidates at .
Subject headings:
galaxies: active - galaxies: clusters: general - galaxies: high redshift - infrared1. Introduction
The classical technique of finding distant galaxy clusters from the extended X-ray emission associated with their intracluster medium is very effective at finding clusters out to , but rapidly becomes insensitive for cluster searches beyond (for a detailed review of X-ray selected clusters, see Rosati et al. 2002). The challenge of using X-ray observations to find the most distant clusters is primarily due to the fading of the X-ray surface brightness. While X-ray selection is very effective at finding massive structures at moderate redshifts and large samples are expected from the all-sky eROSITA soft X-ray telescope after it launches in 2013 (Cappelluti et al., 2011), X-ray selection is unlikely to find the most distant clusters and proto-clusters.
Another proven method to identify distant clusters is by searching wide-field imaging surveys for the red sequence of early-type galaxies. Such red sequence searches were initially introduced using solely optical data (e.g., Gladders & Yee, 2000), and have identified hundreds of clusters out to . More recently, the Spitzer Adaptation of the Red-sequence Cluster Survey (SpARCS; Wilson et al., 2009) has pushed this method to redder wavelengths and thus to higher redshifts. SpARCS has identified clusters out to . However, a weakness of this approach is that it requires the presence of a well-formed red sequence of early-type galaxies. Such a sequence might not yet exist as we approach the epoch of cluster formation.
Other field studies such as the IRAC Shallow Survey (ISCS; Stanford et al., 2005; Brodwin et al., 2006; Eisenhardt et al., 2008) also used the Infrared Array Camera (IRAC; Fazio et al., 2004) onboard Spitzer to expand the sample of galaxy clusters known at . In particular, the ISCS identifies clusters on the basis of photometric redshifts and does not require a red sequence. IRAC is an extremely sensitive tool for finding massive galaxies at high redshift since their m flux densities remain nearly constant at due to a negative and favorable -correction (e.g., Eisenhardt et al., 2008).
Papovich (2008) used a simple IRAC color criterion (see Section 4) to highlight overdensities of high-redshift galaxies in the Spitzer Wide-Infrared Extragalactic (SWIRE; Lonsdale et al., 2003) survey and, in doing so, isolated one of the highest redshift clusters known to date, ClG J0218-0510 at in the XMM-LSS field of SWIRE. Spectroscopic follow-up confirmed members (Papovich et al., 2010). This same cluster was independently discovered by Tanaka et al. (2010) using photometric redshifts. This second team found two concentrations of galaxies at , one of them associated with extended X-ray emission. They spectroscopically confirmed six members.
These various IRAC surveys have the strong advantage of providing uniformly selected galaxy cluster samples over wide areas. Such uniform cluster samples are beneficial for a range of studies, including probing the formation epoch of the early-type galaxy populations (e.g., Mancone et al., 2010; Rettura et al., 2011) and statistical probes of cosmological parameters (e.g., Vikhlinin et al., 2009; Stern et al., 2010).
However, clusters are rare objects and finding larger samples of massive high-redshift galaxy clusters would require field surveys even wider than the several tens of square-degrees which is the current state-of-the-art. Work has been done using targeted cluster searches, i.e., focusing on regions of the sky suspected to host overdensities of galaxies. For example, powerful, high-redshift radio galaxies111Following Seymour et al. (2007), we define a HzRG as a radio galaxy above a redshift of one with a restframe GHz luminosity greater than W Hz-1. (HzRGs hereafter) are among the most massive galaxies known up to very high redshift (Seymour et al., 2007) and, as such, are suspected to lie preferentially in overdense regions. Studies of HzRG environments have revealed excesses of extremely red objects (EROs; Stern et al., 2003; Best et al., 2003), line emitters detected through narrow-band imaging (Pentericci et al., 2000; Venemans et al., 2007, and references therein) and submillimetre galaxies (Stevens et al., 2003; De Breuck et al., 2004; Greve et al., 2007) in the fields of HzRGs out to . A range of complementary studies have made use of optical through mid-infrared observations to isolate candidate cluster members associated with radio galaxies (Kodama et al. 2007; Galametz et al. 2009, 2010a; Hatch et al. 2010; Mayo et al. 2012 in press) .
Recently, Falder et al. (2010) extended this cluster selection technique to a large sample of high-redshift active galactic nuclei (AGN) at . Their sample, observed at m with IRAC, included both radio-loud and radio-quiet AGN. They found excesses of m sources within kpc of the AGN, as well as evidence for a positive correlation between source density and radio power.
In this paper, we use mid-infrared and m observations of radio galaxies at to study their environments and identify their possible association with high-redshift galaxy clusters. Note that we use the designation ‘cluster’ to refer to both cluster- and protocluster-like structures. The paper is organized as follows. The HzRG sample and catalog extraction are presented in §2 and §3. In §4, we introduce our IRAC selection criterion for high-redshift cluster member candidates. In §5, we present the counts-in-cell analysis used to isolate overdensities associated with HzRGs. We also present the spatial distribution of IRAC-selected sources in our most promising high-redshift cluster candidates in §6. We discuss our fields in §7 and present our conclusions in §8. Throughout, we assume a CDM cosmology with km s-1 Mpc-1, and . Magnitudes and colors are expressed in the AB photometric system unless stated otherwise.
2. Radio galaxy sample and IRAC data
Our primary HzRG sample comes from the Spitzer High-Redshift Radio Galaxy survey (SHzRG; Seymour et al. 2007, De Breuck et al. 2010). Most of the sources were observed with IRAC during Cycle 1 (PID 3329; PI Stern) with typical integration times of s in all four IRAC bands (see Table 2). Some fields were imaged more deeply using guaranteed time observations (see Table 3). Details on the IRAC reductions can be found in Seymour et al. (2007) and De Breuck et al. (2010). Mayo et al. 2012 (in press) report on the MIPS m environments of of these fields.
The initial SHzRG sample was designed to homogenously cover the radio luminosity - redshift plane. More recent work on the SHzRG sample, including this paper, instead use , which is a more isotropic measure of AGN power (De Breuck et al., 2010). This leads to a slightly less uniform distribution in the radio luminosity - redshift plane (see Fig. 2 of De Breuck et al. 2010). We will keep this in mind by using appropriate statistical tests later in the paper (see Section 5.3).
In 2009, we obtained deeper s IRAC observations of a sample of radio galaxies (see Table 3, PID 60112; PI Hatch) at and m. Six of these fields were already part of the initial shallower sample. In this paper, we make use of the deeper data when available. These deeper data were reduced as in Seymour et al. (2007).
The goal of our study is to isolate galaxy clusters at high redshift using only mid-infrared data. As described below, the IRAC criterion applied in this work (see Section 4) is optimal for isolating galaxy structures at . We therefore concentrate our analysis on the HzRG fields in this redshift range. We also analyze the HzRG fields at and from our sample in an identical manner and use these fields as a control sample.
3. Catalog extraction and flux limits
In order to study the mid-infrared environments of our HzRG sample, we analyzed the available Spitzer data using standard techniques.
We restricted the analysis to areas covered for at least s in both IRAC channel 1 (m) and 2 (m). The central part () exposure time is s. We checked the images by eye and flagged zones affected by artifacts (e.g., scattered light). Source extraction was done using SExtractor (Bertin & Arnouts, 1996) in dual image mode, using the m frame as the detection image. We used SExtractor parameters from Lacy et al. (2005) which have been optimized for analysis of IRAC data, and measured photometry in 3″ diameter apertures. These magnitudes were then corrected to total magnitudes using corrections determined by the IRAC instrument team (M. Lacy, private communication). Specifically, the aperture corrections applied were and for channels 1 and 2 respectively.
Limiting flux densities for each image were determined from randomly placed diameter apertures. For the SHzRG fields, the limiting flux densities were determined on the area covered by s exposure which extends beyond a radius of from the HzRG i.e., the size of the cell on which this work is conducted. To allow for uniform analysis of our large data set, we adopt a conservative flux density cut corresponding to the depth of our shallowest data, i.e., Jy () and Jy ()222Magnitudes in IRAC channels 1 and 2 are indicated by and , respectively, and log(Jy)..
Recently, Mancone et al. (2010) derived the and m luminosity functions of galaxy clusters out to . They found and for clusters at . Similarly, Strazzullo et al. (2006) derived the -band luminosity function of clusters at . Using the Bruzual & Charlot (2003) model of a Gyr-old single burst galaxy with an exponentially declining star formation history with , we find that at with a nearly constant color at . Strazzullo et al. (2006) find that at , corresponding to , in agreement with the work of Mancone et al. (2010). To our adopted limiting magnitude of , our shallow s observations are therefore sensitive to galaxies one magnitude fainter than at . As shown in Mancone et al. (2010), should remain relatively constant out to assuming cluster galaxies form at .
4. Color selection of cluster member candidates
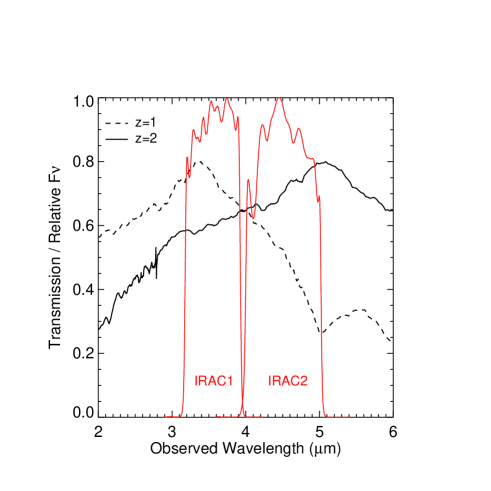
One of the main spectral features in the spectral energy distributions (SEDs) of galaxies is the m bump, caused by a minimum in the opacity of the H- ion which is present in the atmospheres of cool stars (John, 1988). This bump, seen in the SEDs of all normal galaxies, has often been used as an efficient photometric redshift indicator (e.g., Simpson & Eisenhardt, 1999; Sorba & Sawicki, 2010, and references therein). Fig. 1 shows the position of the m bump for galaxies at and relative to the IRAC and m bands. The bump enters the IRAC bands at and shifts beyond m at . This causes lower redshift galaxies to have blue colors, while galaxies above become red across these passbands.
Combining a wide variety of composite stellar population models and spectroscopy of high-redshift galaxies in the GOODS-S and AEGIS DEEP2 fields, Papovich (2008) confirmed that (i.e., ) is very efficient at isolating galaxies. They showed that only a minority population of strongly star-forming galaxies with a strong warm dust contribution have such red colors and that about % of galaxies with are at . Specifically, based on redshifts from the DEEP2 redshift survey, Papovich (2008) show that % of galaxies at have red IRAC colors, with this percentage increasing to % for galaxies and reaching % for galaxies. In the later analysis we use this color cut to study the fields of HzRGs at , though we caution the reader than the efficiency of the selection criterion is diminished in the range. At any rate, only one HzRG from our sample, 3C266 at , is in this redshift range. Finally, we note that, contrary to other high-redshift galaxy selection techniques such as the selection for galaxies (Daddi et al., 2000) or the near-infrared selection techniques for galaxies (Kajisawa et al., 2006; Galametz et al., 2010b), this single IRAC color criterion does not permit the segregation between galaxy types since it is based on a spectro-photometric property of essentially all galaxy populations (Papovich, 2008).
This red IRAC color criterion will identify a few additional astronomical populations, but none are expected to be significant contaminations. Most stars have (i.e., Vega color of zero). Stern et al. (2007) shows that only brown dwarfs cooler than spectral type T3 have such red colors () and such objects will be rare in a flux-limited survey at our depth. Extremely dusty stars, such as asymptotic giant branch (AGB) stars, will also have red IRAC colors (e.g., Eisenhardt et al., 2010). However, they are likewise expected to be quite rare in a flux-limited survey primarily targeted at high Galactic latitudes.
At all redshifts, most powerful AGN (%) have and will be selected by this IRAC criterion. Stern et al. (2005) measure a surface density of AGN per deg2 in the Boötes field down to flux density limits of Jy and Jy. Using IRAC catalogues available for the Boötes field (see Section 5.2 for details), we derive a density of red IRAC-selected sources per deg2 to the same depth. We therefore expect contamination by AGN to represent less than % of sources with at the depth of our survey.
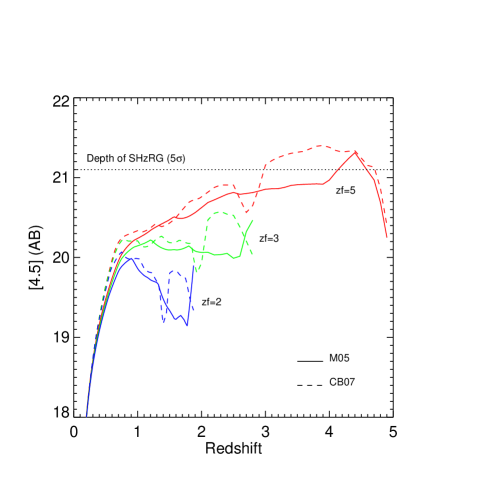
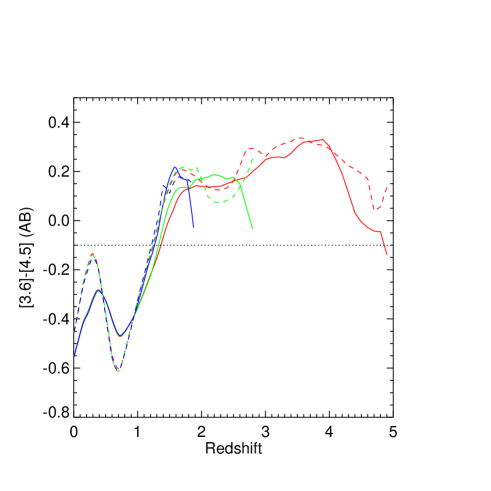
According to models for passively evolving stellar populations formed at high-redshift, negative -corrections provide a nearly constant m flux density at and up to high redshifts. Fig. 2 shows the evolution of the m flux density and the color as a function of redshift for various formation redshifts. We make use of the publicly available model calculator EZ Gal333www.mancone.net/ezgal/model. We use the Maraston (2005) and the Charlot & Bruzual 2007 — an update of Bruzual & Charlot (2003) — models for single stellar populations assuming solar metallicity and a Salpeter initial mass function. The m flux density is normalized to match the observed of galaxy clusters at , . Mancone et al. (2010) studied a large sample of clusters up to to derive the m luminosity function and found that the luminosity function is consistent with a formation redshift . Fig. 2 shows that for , the m flux density is relatively constant at . It even decreases (brightens) with redshift as one approaches the galaxy formation epoch.
Mancone et al. (2010) models could not simultaneously match the low and high-redshift data; they found that becomes fainter at the highest redshifts probed, interpreted as a possible evidence for galaxy assembly at . Note, however, that the Mancone et al. (2010) uncertainties increase with redshift, with few of the highest redshift clusters spectroscopically confirmed, and larger systematic uncertainties in subtracting the foreground/background galaxy populations. Numerous authors have investigated the epoch of early-type galaxy assembly, and the results span a wide range of formation redshifts (e.g., van Dokkum, 2008; Eisenhardt et al., 2010). A larger sample of high-redshift galaxy clusters is clearly needed to further investigate this question.
In the following, we assume a uniform color criterion to select high-redshift candidates in the fields of 48 radio galaxies at . We consider sources detected to the depth of our SHzRG sample (). We include sources with with a m magnitude fainter than the limits of our SHzRG survey. For such sources, we uniformly assign a lower limit of . Sources selected by these criteria are referred to as ‘red IRAC-selected sources’ or simply as ‘IRAC-selected sources’ in the rest of the paper.
As seen in Fig. 2, our selection criteria should robustly identify clusters across this whole redshift range, assuming cluster galaxy formation and assembly is at similar or higher redshift. The aim of the current work is to test this hypothesis. Current literature only studies evolved populations in clusters out to , with less certain results for cluster candidates at higher redshifts. Extensive literature from multiple observing programs infer the cluster formation epoch is at higher redshift, with results ranging over the range. Given the current state of knowledge, the high redshift end of our analysis is somewhat arbitrary; we could have been more conservative and chosen a lower redshift cut-off, or, in principle, we could have considered a higher redshift cut-off. If we do not find rich fields around our highest redshift HzRGs, multiple explanations are possible. It could mean that clusters do not exist at those redshifts, it could be due to small number statistics, or it could imply issues with the simple evolutionary model we are testing in Fig. 2, a model that is remarkably effective at describing cluster data at . In particular, galaxy mergers might cause an evolution of with redshift such that we become less sensitive to clusters at the high-redshift end of our sample. Such a result would be of interest.
5. Counts-in-cell analysis
5.1. Counts-in-cell in SWIRE
We use a counts-in-cell analysis to identify overdensities of IRAC red galaxies associated with HzRGs. As a reference field, we analyze the SWIRE (SWIRE; Lonsdale et al., 2003) survey. With its typical s exposure, the SWIRE survey reaches slightly deeper than our HzRG data, primarily because it exclusively targets low-background regions of the sky. SWIRE covers deg2, split into six independent fields which mitigates the effects of cosmic variance.
To ensure consistency with our analysis of the radio galaxy fields, we build our own catalogues for all six SWIRE fields. As described in Section 3, we use the m image for source detection and derive photometry from diameter apertures, corrected to total magnitudes following Lacy et al. (2005).
At the depth of our survey, we detect the bright end of the galaxy luminosity function, which preferentially populates cluster cores. We therefore adopt a cell size of radius, corresponding to Mpc at . This distance matches typical cluster sizes for mid-infrared selected galaxy clusters (e.g., Wilson et al., 2009).
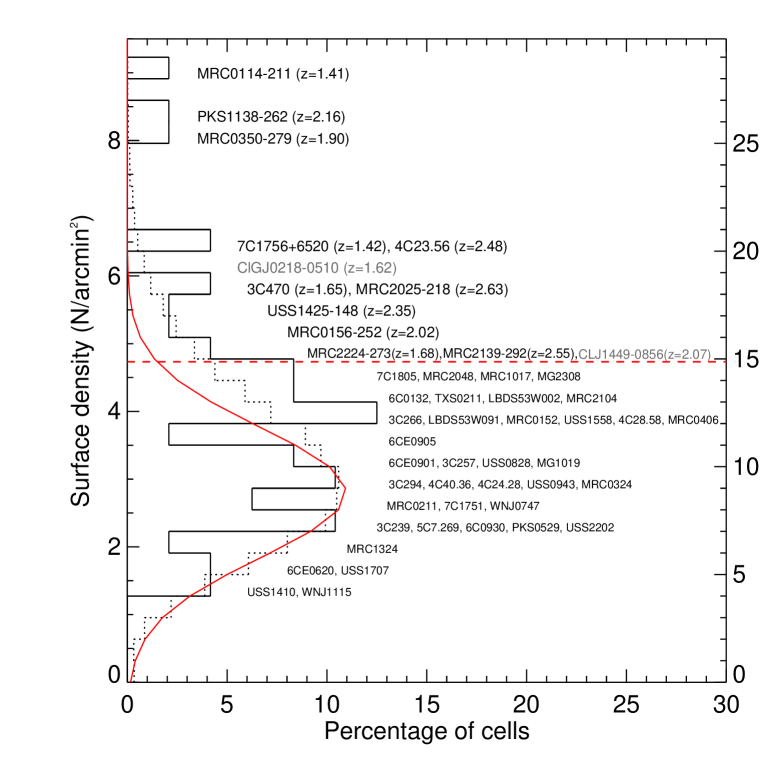
We generate independent (i.e., non-overlapping) circular cells of radius, randomly distributed over the six SWIRE fields. Fig. 3 shows the histogram of the surface density of red IRAC-selected sources per cell. The horizontal axis shows the percentage of cells corresponding to a specific surface density. The shape of the distribution is a Gaussian strongly skewed towards higher density cells. We fit the lower half of the distribution (i.e., the distribution of the lower density regions) by a Gaussian (iteratively clipping at ). The best fit values give a Gaussian centered at galaxies per arcmin2 ( sources per cell) with . We define an overdensity of IRAC-selected sources when a cell is denser than galaxies per arcmin2 — i.e., when at least sources are found within a cell of radius. This criterion, for which visual inspection typically registers interesting spatial segregation, is matched by only of the cells in SWIRE.
5.2. Tests on known galaxy clusters
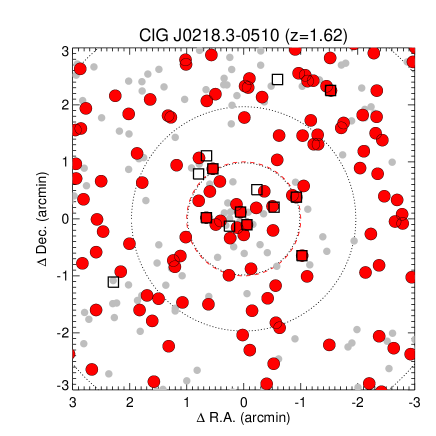
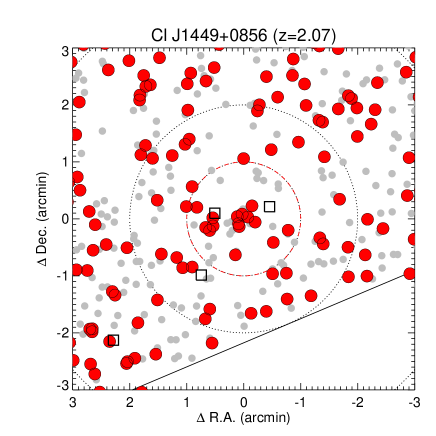
Before applying our newly defined criterion, we test its efficiency on published clusters at observed with IRAC. We first study two of the highest redshift clusters known to date: ClG J0218-0510 at (Papovich et al., 2010; Tanaka et al., 2010) and Cl J1449+0856 at (Gobat et al., 2011).
ClG J0218-0510 is located in the XMM field of SWIRE. We select sources with in the field of ClG J0218-0510 using the catalogues we derived from the SWIRE data (see Section 5). Cl J1449+0856 was discovered in the CNOC 1447+09 field (Yee et al., 2000) and was also first identified as an overdensity of red IRAC-selected galaxies. To date, cluster members have been spectroscopically confirmed (Gobat et al., 2011). We retrieved the IRAC and m reduced post-BCD images of the CNOC 1447+09 field from the Spitzer archive (P.I. Fazio) and derived our own catalogue in an identical manner as for the HzRG targets.
For both cluster fields, we select sources with . Fig. 4 shows the spatial distribution of these red sources in the field around ClG J0218-0510 (top) and Cl J1449+0856 (bottom panel). Large red symbols account for sources detected within the limits applied to our SHzRG sample and smaller gray dots account for sources within the limits of SWIRE (Jy and Jy) and CNOC 1447+09 (Jy and Jy). We also show the spectroscopically confirmed cluster members (black squares) for ClG J0218-0510 (Papovich et al., 2010; Tanaka et al., 2010) and Cl J1449+0856 (R. Gobat, private communication). All of the confirmed members detected at and m have though some are below the limits plotted in Fig. 4.
Nineteen red IRAC-selected galaxies are found within of the assigned center of ClG J0218-0510 and for Cl J1449+0856. Both clusters are clearly seen as compact concentrations of red galaxies and are selected as overdense fields by our IRAC criteria (see also Fig. 3, gray labels).
An overdensity of EROs was also recently detected in the field of the quasar 3C270.1 at (Haas et al., 2009) suggesting that the quasar is associated with a high-redshift galaxy structure. We retrieved the IRAC post-BCD and m images of this field from the Spitzer archive and extracted the corresponding m selected catalogue. Twenty-four red IRAC-selected sources are found within of the quasar. This strengthens past results that the quasar is part of a high-redshift cluster.
Recently, Eisenhardt et al. (2008) identified a large sample of mid-infrared selected galaxy clusters in the Boötes field, including five clusters spectroscopically confirmed at . The Boötes field was covered by the Spitzer Deep, Wide-Field Survey (SDWFS; Ashby et al., 2009), an IRAC survey of deg2 with depths of and in and m, respectively. We make use of the publicly available m-selected catalogue of the SDWFS Data Release 1 to derive the number of IRAC-selected sources within of the cluster centers. All five confirmed galaxy clusters have or more IRAC-selected sources in the studied cell and would be selected as overdense fields by our IRAC criteria. Of the spectroscopically confirmed members of these clusters at detected at m (Stanford et al. 2005, Brodwin et al. 2006, Eisenhardt et al. 2008), (%) have . Considering only clusters members at , all galaxies have colors consistent with the red IRAC criterion within the photometric errors. Considering the clusters reported in Eisenhardt et al. (2008), only the cluster at would be selected as an overdense field by our red IRAC selection criterion. These results confirm that our IRAC criterion begins to become effective at identifying galaxy clusters at and is quite robust at identifying rich structures at .
A large number of high-redshift galaxy cluster candidates were also recently found in SWIRE by the SpARCS survey. We further test our selection criterion on spectroscopically confirmed SpARCS clusters and recover their two highest redshift galaxy clusters (to date): SpARCS J003550-431224 (; Wilson et al., 2009) — a very dense structure with IRAC-selected sources found within of the assigned cluster center — and SpARCS J161037+552417 (; Demarco et al., 2010) with red IRAC-selected sources. We note that the two clusters published in Demarco et al. 2010 (at and ) were not recovered.
5.3. Radio galaxy fields
We now determine the number of red IRAC-selected sources within of each radio galaxy. Each field is shown in Fig. 3 at the position corresponding to the number of IRAC-selected sources found within of the radio galaxies. The density for each field is also reported in Tables 2 and 3 (last column). The solid histogram shows the percentage of radio galaxy fields corresponding to a given density. We find that radio galaxies preferentially lie in medium to dense regions, with (%) of the targeted fields denser than the mean of the Gaussian fit to the SWIRE fields. Eleven fields i.e. % (%) are found with more than red IRAC-selected sources within of the central radio galaxy. We conduct a two-sided Kolmogorov-Smirnov statistic between the distributions of densities of IRAC-selected sources in SWIRE and in the HzRG cells and find a probability of only % that the two distributions are drawn from the same distribution.
From the cells we produced in SWIRE, we generated random samples of cells and derived the fraction of these sub-samples that have at least -overdense cells. We find that only % of the sub-samples have a fraction of overdense cells comparable to our radio galaxy sample, confirming that radio galaxies lie preferentially in dense regions.
We discuss our overdense fields in more detail in Section 6. At our bright magnitude limits, we expect to isolate high-redshift galaxy structures that contain many bright ( or brighter) galaxies in their cores. We do not rule out the possibility that the other radio galaxies may be associated with less massive and/or less compact galaxy structures.
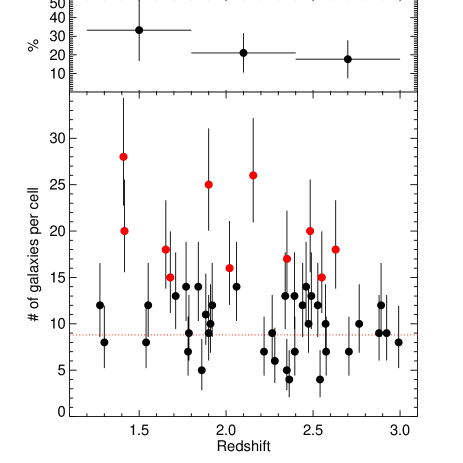
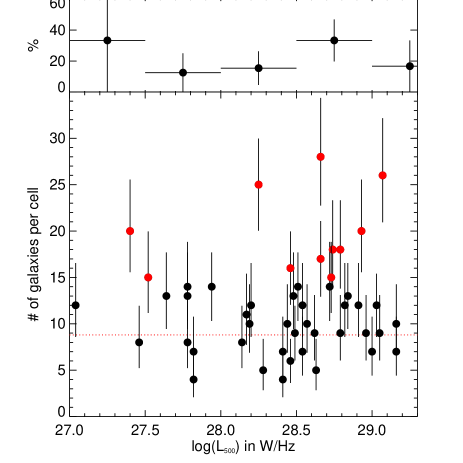
The sample of radio galaxies covers a wide range of redshift as well as a wide range of radio luminosity. We next consider a possible dependance of overdensity with these two parameters. Fig. 5 and Fig. 6 show the counts-in-cell around the radio galaxies versus redshift and radio luminosity, respectively. We adopt Poissonian errors for the counts-in-cell and use the Gehrels (1986) small number approximation for Poisson distribution. The inset on top of each figure shows the percentage of overdense fields compared to the total number of fields per bin of redshift or radio luminosity.
No significant correlation is observed between overdensity and redshift (Fig. 5). As far as a correlation with radio power is concerned (Fig. 6), we note that % (%) of radio galaxies with W Hz-1 are found in overdense fields, compared to % of the full sample. This could indicate a positive correlation between overdensity and radio power, a result suggested by past studies (Miley & De Breuck, 2008; Falder et al., 2010). However, the Spearman rank correlation coefficient between overdensity and radio power is as low as . As mentioned in Section 2, there may be a small degeneracy between and redshift in our sample. A study of the Spearman partial rank correlation coefficient — which takes the correlation of two variables with a third related variable (Macklin, 1982) — still do not show any significant correlation between overdensity and radio luminosity. This result is consistent with the absence of correlation observed between overdensity and the density of m MIPS-selected sources in the same HzRG sample (Mayo et al. 2012 in press). We conclude that a larger sample, reaching radio luminosities of several orders of magnitude lower, is required to study (and quantify) a possible correlation.
5.4. Analysis of HzRG fields with deeper IRAC data
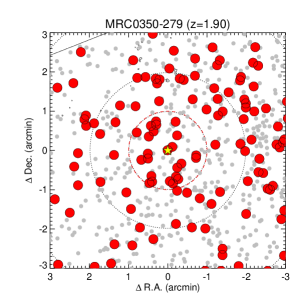
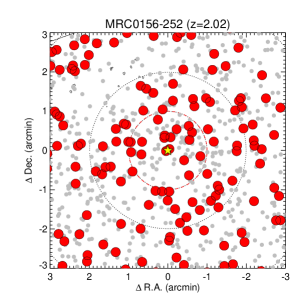
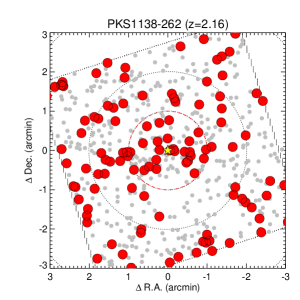
We also examine fields with at least s IRAC exposures. We adopt correspondingly deeper cuts for the deeper sample (Jy; ). Similar to the shallower analysis, we select sources using the criterion . For sources below the deeper m flux density limits, we uniformly assign a lower limit . The adopted depth corresponds to . We derive densities of red IRAC-selected sources within of the radio galaxies to these deeper flux limits (Table 1). We find results consistent with our analysis at shallower cuts, recovering PKS1138-262 (), MRC0156-252 () and MRC0350-279 () as the densest fields; compared to the average surface density of red IRAC-selected sources in the other radio galaxy fields, the environments of these three radio galaxies are at least 1.5 times richer.
| HzRG | Density |
|---|---|
| (arcmin-2) | |
| PKS1138-262 () | |
| MRC0156-252 () | |
| MRC0350-279 () | |
| MRC1017-220 () | |
| MRC2104-242 () | |
| MRC2139-292 () | |
| MG2308+0336 () | |
| USS1425-148 () | |
| MRC0324-228 () | |
| LBDS53W002 () | |
| MRC0406-244 () | |
| MRC1324-262 () |
6. Confirmed clusters and new cluster candidates
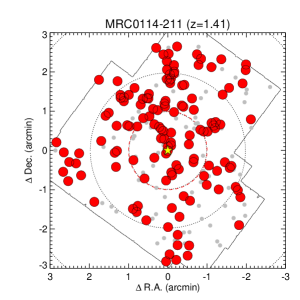
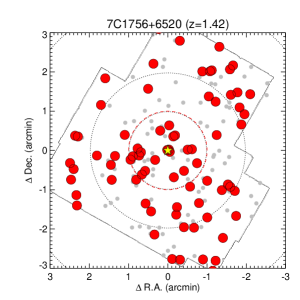
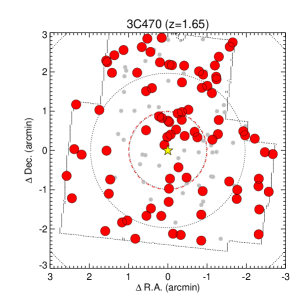
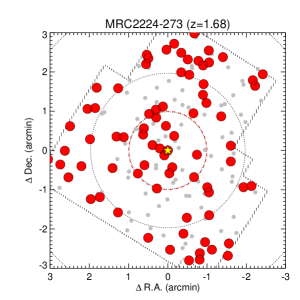
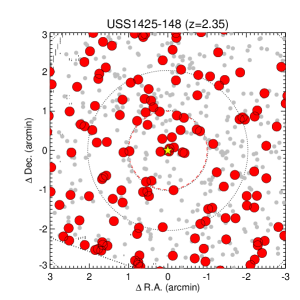
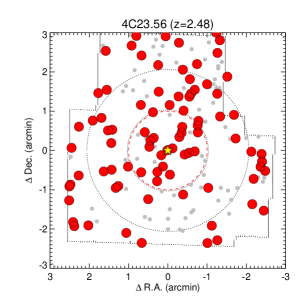
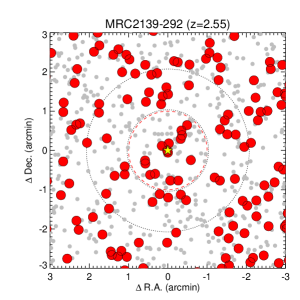
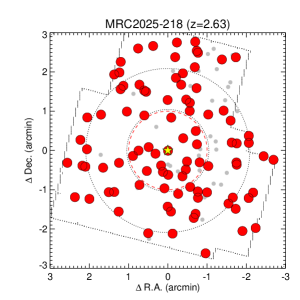
Eleven radio galaxy fields present significant overdensities of red sources. Fig. 7 shows the spatial distribution of the IRAC-selected sources for these cluster candidates. Small gray and large red dots indicate red IRAC-selected sources detected within the limits of each individual field and to the depth of our survey, respectively. These fields present a very diverse spatial distribution of red sources. Some fields show clumps (e.g., USS1425-148, MRC0350-279) while others show more filamentary structures (e.g., MRC0114-211, 3C470, PKS1138-262).
The fields of MRC0114-211 (), 3C470 (), MRC2224-273 (), MRC0350-279 (), MRC2139-292 () and MRC2025-218 () have never been studied for overdensities in the past. They show several clumps of red sources whose association with the targeted radio galaxy still need to be confirmed with spectroscopy. We next briefly discuss each of these cluster candidates in order of increasing redshift.
6.1. MRC0114-211 ()
The environment of this radio galaxy had never been studied in the past. This field is the lowest redshift but also the strongest galaxy cluster candidate in the HzRG sample, overdense at a level compared to SWIRE. Only % of the cells in our counts-in-cells analysis are found with such density. The distribution of the IRAC-selected red sources shows a clear spatial segregation. The bright red galaxies lie preferentially in two N/S elongated structures with the radio galaxy embedded in the southern one. The northern clump is ( Mpc) north of the radio galaxy. Additional groups of red galaxies are also observed within Mpc of the radio position, suggesting that MRC0114-211 is part of a complex large-scale structure. Furthermore, five red IRAC-selected sources (including the radio galaxy itself) are found in the immediate vicinity (within kpc) of the HzRG, corresponding to a density about times higher than average. No other radio galaxy in our sample shows such a dense environment.
6.2. 7C1756+6520 ()
Galametz et al. (2009) identified this HzRG as residing in a candidate high-redshift cluster based on photometry. This cluster was recently confirmed in spectroscopy with cluster members (Galametz et al., 2010b). The spatial distribution of the IRAC-selected sources is clumpy, with a main compact clump of bright galaxies SE of the radio galaxy. This location coincides with the spectroscopically confirmed sub-group of galaxies in Galametz et al. (2010b) at . Seven of the spectroscopically confirmed members were observed and detected both at and m. Only one (ID Cl 1756.20 in Galametz et al., 2010b) has an unexpectedly blue IRAC color (). The other six galaxies have .
6.3. 3C470 () and MRC2224-273 ()
These fields present very inhomogenous distributions of IRAC-selected sources. In both cases, the radio galaxies are located (in projection) at the edges of the galaxy overdensities. Spectroscopic follow-up of the structures is required to confirm the association of high-redshift galaxy structures with the radio galaxies.
6.4. MRC0350-279 ()
This is the third densest field in our sample. Two very compact clumps of red sources are found within and aligned with MRC0350-279 in the direction NW/SE, forming an intriguing symmetrical structure.
6.5. MRC0156-252 ()
Galametz et al. (2010a) presented a study of the surroundings of MRC0156-252. In that work, we used a purely near-infrared color criterion to select galaxies in the field and found that the radio galaxy lies in an overdense region of both early-type and star-forming candidates. The majority of the IRAC-selected sources within of MRC0156-252 are found north of the radio galaxy, a result also found for the near-infrared selected cluster candidates in Galametz et al. (2010a).
6.6. PKS1138-262 ()
This radio galaxy (also referred to as the “Spider Web” galaxy) is associated with a well studied high-redshift galaxy protocluster. Several intense programs have studied this field, identifying a diversity of cluster members: Ly emitters, H emitters (Pentericci et al., 2000; Kurk et al., 2004a), or candidate cluster members: EROs (Kurk et al., 2004b), Distant Red Galaxies (DRGs; Kodama et al., 2007). To date, only two massive red sources have been spectroscopically confirmed to be associated with PKS1138-262 (Doherty et al., 2010); both are red IRAC-selected sources with . Similar to DRGs selected in this field, the (brightest) IRAC-selected galaxies are preferentially found along a -long E/W filamentary structure (corresponding to the radio axis) in which the radio galaxy is embedded.
6.7. USS1425-148 ()
The environment of this radio galaxy was recently studied using near-infrared observations. Hatch et al. (2011) selected high-redshift galaxies using near-infrared color criteria in the field of six radio galaxies at . USS1425-148 was the most overdense field of their sample and suspected to contain a high-redshift galaxy cluster at . Fig. 7 suggests that the radio galaxy has several nearby companions. A second clump of sources is found north of USS1425-148.
We note that MRC1324-262 () and MRC0406-244 () were also part of the Hatch et al. (2011) sample and were not found to lie in particularly overdense environments, a result consistent with the present mid-infrared analysis of these fields.
6.8. 4C23.56 ()
4C23.56 is also known to lie in an overdense region of galaxies. More than a decade ago, Knopp & Chambers (1997) found an overdensity of red galaxies (, Vega) in the immediate surroundings of 4C23.56. A complementary analysis was made by Kajisawa et al. (2006) who found that 4C23.56 was the densest field out of their sample of six radio galaxies at in terms of near-infrared cluster galaxy candidates. An excess of candidate H emitters has also recently been detected in the field by Tanaka et al. (2011), which also reported on the first spectroscopically confirmed companions for 4C23.56, three H emitters at .
6.9. MRC2139-292 () and MRC2025-218 ()
These fields are our two highest redshift candidates. The field of MRC2139-292 presents a very clear and compact concentration of red galaxies centered on the radio galaxy. Though MRC2025-218 is just above our threshhold for identifying rich IRAC environments, we note that Mayo et al. 2012 (in press) find that it resides in a very rich field in the MIPS m bandpass, overdense at level compared to control fields.
7. The mid-infrared environments of radio galaxies
The initial sample of HzRGs also comprised galaxies at that were analyzed in an identical manner to the main sample. Some of these radio galaxies are known to be within spectroscopically confirmed high-redshift protoclusters (e.g. USS0943-242, TNJ1338-1942, MRC0316-257, TNJ0924-2201; Venemans et al. 2007) though none were recovered by the present mid-infrared analysis. This suggests evolution in the luminosity function of high redshift galaxy clusters. As seen in Fig. 2, the simplest single stellar population models predict relatively constant [4.5] flux densities at for a wide range of formation redshifts, as well as a brightening of the galaxies as we approach the formation epoch. The fact that we do not recover these known rich (proto-)clusters at implies that this simple model is incorrect, most likely because the massive ellipticals that comprise the clusters are still in process of forming in a hierarchical manner. Deeper IRAC data from a large sample of clusters and cluster candidates out to should test this hypothesis. We are, in fact, amassing such a data set with the Clusters Around Radio-Loud AGN (CARLA) Warm Spitzer snaphot program (Galametz et al. in prep.).
The radio galaxy 4C41.17 () lies in an overdense region of IRAC-selected sources. A compact clump of IRAC-selected sources is observed, slightly offset south of the radio galaxy. Ivison et al. (2000) also reported an overdensity of sub-millimeter galaxies in this field, though spectroscopic follow-up has failed to confirm their association with the radio galaxy (Greve et al., 2007). We suspect that there might be a foreground galaxy structure in this field.
8. Conclusions
We identified overdensities in the fields of powerful HzRGs at . We studied the distribution of sources with using a counts-in-cell analysis, defining a region to be overdense when denser (at the level) than the SWIRE average, i.e., when or more red IRAC-selected galaxies (with Jy) are found in a cell of radius. We identified radio galaxies with at least IRAC-selected candidates within . These radio galaxy fields, representing % of our sample of HzRGs, are the most promising galaxy cluster candidates from our analysis. The large fraction of overdense fields clearly indicates that radio galaxies, on average, reside in rich enviroments. Randomly selecting similarly analyzed samples of control fields from the SWIRE survey, we find such a high fraction of dense fields in only % of the samples.
Five of these fields have been studied in the past and are known or suspected to contain a (proto-)cluster at high-redshift. Three have been spectroscopically confirmed to be associated with the radio galaxy. This clearly demonstrates the strength of IRAC to select high-redshift galaxy structures. Our relatively shallow data have permitted the recovery of known clusters in very short integration times (s); past ground-based studies have required hours of optical/near-infrared observations.
We tested for correlations of environment with radio galaxy properties and found no significant trends with either redshift or radio luminosity. We note however that a detailed analysis of evolution of the cluster population with redshift will require an even larger sample of high-redshift clusters as well as a better understanding of the luminosity function for clusters at . No statistically significant trend with radio luminosity was observed. Nevertheless, the majority of our cluster candidates are found in the fields of more luminous radio galaxies ( W Hz-1).
| Name | R.A. | Dec. | za | log()b | Density |
|---|---|---|---|---|---|
| (J2000) | (J2000) | (W Hz-1) | (arcmin-2) | ||
| 3C356.0 | 17:24:19.0 | 50:57:40.30 | 1.079 | 28.35 | |
| MRC0037258 | 00:39:56.4 | 25:34:31.01 | 1.100 | 27.72 | |
| 3C368.0 | 18:05:06.3 | 11:01:33.00 | 1.132 | 28.52 | |
| 6C0058+495 | 01:01:18.9 | 49:50:12.29 | 1.173 | 27.33 | |
| 3C266 | 11:45:43.4 | 49:46:08.24 | 1.275 | 28.54 | |
| MRC0211256 | 02:13:30.5 | 25:25:21.00 | 1.300 | 27.78 | |
| MRC0114211 | 01:16:51.4 | 20:52:06.71 | 1.410 | 28.66 | |
| 7C1756+6520 | 17:57:05.4 | 65:19:53.11 | 1.4156 | 27.40 | |
| 7C1751+6809 | 17:50:49.9 | 68:08:25.93 | 1.540 | 27.46 | |
| 3C470 | 23:58:35.3 | 44:04:38.87 | 1.653 | 28.79 | |
| MRC2224273 | 22:27:43.3 | 27:05:01.71 | 1.679 | 27.52 | |
| 6C0132+330 | 01:35:30.4 | 33:17:00.82 | 1.710 | 27.64 | |
| 3C239 | 10:11:45.4 | 46:28:19.75 | 1.781 | 29.00 | |
| 3C294.0 | 14:06:44.0 | 34:11:25.00 | 1.786 | 28.96 | |
| 7C1805+6332 | 18:05:56.9 | 63:33:13.14 | 1.840 | 27.78 | |
| 6CE0820+3642 | 08:23:48.1 | 36:32:46.42 | 1.860 | 28.28 | |
| 6CE0905+3955 | 09:08:16.9 | 39:43:26.00 | 1.883 | 28.17 | |
| 6CE0901+3551 | 09:04:32.4 | 35:39:03.23 | 1.910 | 28.19 | |
| MRC0152209 | 01:54:55.8 | 20:40:26.30 | 1.920 | 28.20 | |
| MRC2048272 | 20:51:03.6 | 27:03:02.53 | 2.060 | 28.72 | |
| 5C7.269 | 08:28:38.8 | 25:28:27.10 | 2.218 | 27.82 | |
| 4C40.36 | 18:10:55.7 | 40:45:24.01 | 2.265 | 28.79 | |
| TXS0211122 | 02:14:17.4 | 11:58:46.00 | 2.340 | 28.48 | |
| USS1707+105 | 17:10:06.5 | 10:31:06.00 | 2.349 | 28.63 | |
| USS1410001 | 14:13:15.1 | 00:22:59.70 | 2.363 | 28.41 | |
| 6C0930+389 | 09:33:06.9 | 38:41:50.14 | 2.395 | 28.41 | |
| 3C257 | 11:23:09.2 | 05:30:19.47 | 2.474 | 29.16 | |
| 4C23.56 | 21:07:14.8 | 23:31:45.00 | 2.483 | 28.93 | |
| USS1558003 | 16:01:17.3 | 00:28:48.00 | 2.527 | 28.82 | |
| WNJ1115+5016 | 11:15:06.9 | 50:16:23.92 | 2.540 | 27.82 | |
| USS0828+193 | 08:30:53.4 | 19:13:16.00 | 2.572 | 28.44 | |
| PKS0529549 | 05:30:25.2 | 54:54:22.00 | 2.575 | 29.16 | |
| MRC2025218 | 20:27:59.5 | 21:40:56.90 | 2.630 | 28.74 | |
| USS2202+128 | 22:05:14.1 | 13:05:33.50 | 2.706 | 28.54 | |
| MG1019+0534 | 10:19:33.4 | 05:34:34.80 | 2.765 | 28.57 | |
| 4C24.28 | 13:48:14.8 | 24:15:52.00 | 2.879 | 29.05 | |
| 4C28.58 | 23:51:59.2 | 29:10:28.99 | 2.891 | 28.91 | |
| USS0943242 | 09:45:32.7 | 24:28:49.65 | 2.923 | 28.62 | |
| WNJ0747+3654 | 07:47:29.4 | 36:54:38.09 | 2.992 | 28.14 | |
| B3J2330+3927 | 23:30:24.9 | 39:27:12.02 | 3.086 | 28.33 | |
| WNJ0617+5012 | 06:17:39.4 | 50:12:55.40 | 3.153 | 28.02 | |
| MRC0251273 | 02:53:16.7 | 27:09:13.03 | 3.160 | 28.54 | |
| WNJ1123+3141 | 11:23:55.9 | 31:41:26.14 | 3.217 | 28.51 | |
| 6C1232+39 | 12:35:04.8 | 39:25:38.91 | 3.220 | 28.93 | |
| TNJ0205+2242 | 02:05:10.7 | 22:42:50.40 | 3.506 | 28.46 | |
| TNJ0121+1320 | 01:21:42.7 | 13:20:58.00 | 3.516 | 28.49 | |
| TXJ1908+7220 | 19:08:23.7 | 72:20:11.82 | 3.53 | 29.12 | |
| USS1243+036 | 12:45:38.4 | 03:23:20.70 | 3.570 | 29.23 | |
| WNJ1911+6342 | 19:11:49.6 | 63:42:09.60 | 3.590 | 28.14 | |
| MG2144+1928 | 21:44:07.5 | 19:29:14.60 | 3.592 | 29.08 | |
| 6C0032+412 | 00:34:53.1 | 41:31:31.50 | 3.670 | 28.75 | |
| 4C60.07 | 05:12:54.8 | 60:30:52.01 | 3.788 | 29.20 | |
| TNJ20071316 | 20:07:53.3 | 13:16:43.62 | 3.840 | 29.13 | |
| 8C1435+635 | 14:36:37.1 | 63:19:14.00 | 4.250 | 29.40 | |
| TNJ09242201 | 09:24:19.9 | 22:01:41.00 | 5.195 | 29.51 |
-
a
Our analysis focusses on fields around HzRGs with . The other fields are used as control fields.
-
b
Radio luminosities from De Breuck et al. (2010).
| Name | R.A. | Dec. | z a | log()a | IRAC Exp. Time | PID | Density |
| (J2000) | (J2000) | (W Hz-1) | (s) | (arcmin-2) | |||
| LBDS53W091 | 17:22:32.7 | 50:06:01.94 | 1.552 | 27.04 | 900 | 65 | |
| MRC1017220 | 10:19:49.0 | 22:19:58.03 | 1.768 | 27.94 | 1600 | 60112 | |
| MRC0324228 | 03:27:04.4 | 22:39:42.60 | 1.894 | 28.49 | 1600 | 60112 | |
| MRC0350279 | 03:52:51.6 | 27:49:22.61 | 1.900 | 28.25 | 1600 | 60112 | |
| MRC0156252 | 01:58:33.6 | 24:59:31.10 | 2.016 | 28.46 | 1600 | 60112 | |
| PKS1138262 | 11:40:48.6 | 26:29:08.50 | 2.156 | 29.07 | 3000 | 17 | |
| MRC1324262 | 13:26:50.82 | 26:30:51.10 | 2.280 | 28.45 | 1600 | 60112 | |
| USS1425148 | 14:28:52.50 | 15:01:37.50 | 2.349 | 28.66 | 1600 | 60112 | |
| LBDS53W002 | 17:14:14.7 | 50:15:29.70 | 2.393 | 27.78 | 3300 | 211 | |
| MRC0406244 | 04:08:51.5 | 24:18:16.39 | 2.427 | 29.03 | 1600 | 60112 | |
| MG2308+0336 | 23:08:28.05 | 03:36:20.70 | 2.457 | 28.51 | 1600 | 60112 | |
| MRC2104242 | 21:06:58.1 | 24:05:11.00 | 2.491 | 28.84 | 1600 | 60112 | |
| MRC2139292 | 21:42:16.7 | 28:58:40.00 | 2.550 | 28.73 | 1600 | 60112 | |
| MRC0316257 | 03:18:12.0 | 25:35:11.00 | 3.130 | 28.95 | 46000 | 3482 | |
| B20902+34 | 09:05:30.1 | 34:07:56.89 | 3.395 | 28.78 | 1200 | 64 | |
| 4C41.17 | 06:50:52.1 | 41:30:31.00 | 3.792 | 29.18 | 5000 | 79 | |
| TNJ13381942 | 13:38:26.0 | 19:42:31.00 | 4.110 | 28.71 | 5000 | 17 | |
| 6C0140+326 | 01:43:43.8 | 32:53:49.31 | 4.413 | 28.73 | 5000 | 79 |
-
a
Our analysis focusses on fields around HzRGs with . The other fields are used as control fields.
-
b
Radio luminosities from De Breuck et al. (2010).
References
- Ashby et al. (2009) Ashby, M. L. N. et al. 2009, ApJ, 701, 428
- Bertin & Arnouts (1996) Bertin, E. & Arnouts, S. 1996, A&AS, 117, 393
- Best et al. (2003) Best, P. N. et al. 2003, MNRAS, 343, 1
- Brodwin et al. (2006) Brodwin, M. et al. 2006, ApJ, 651, 791
- Bruzual & Charlot (2003) Bruzual, G. & Charlot, S. 2003, MNRAS, 344, 1000
- Cappelluti et al. (2011) Cappelluti, N. et al. 2011, Memorie della Societa Astronomica Italiana Supplementi, 17, 159
- Daddi et al. (2000) Daddi, E. et al. 2000, A&A, 361, 535
- De Breuck et al. (2004) De Breuck, C. et al. 2004, A&A, 424, 1
- De Breuck et al. (2010) —. 2010, ApJ, 725, 36
- Demarco et al. (2010) Demarco, R. et al. 2010, ApJ, 711, 1185
- Doherty et al. (2010) Doherty, M. et al. 2010, A&A, 509, 83
- Eisenhardt et al. (2008) Eisenhardt, P. R. M. et al. 2008, ApJ, 684, 905
- Eisenhardt et al. (2010) —. 2010, AJ, 139, 2455
- Falder et al. (2010) Falder, J. T. et al. 2010, MNRAS, 405, 347
- Fazio et al. (2004) Fazio, G. G. et al. 2004, ApJS, 154, 10
- Galametz et al. (2009) Galametz, A. et al. 2009, A&A, 507, 131
- Galametz et al. (2010a) —. 2010a, A&A, 522, A58+
- Galametz et al. (2010b) —. 2010b, A&A, 516, A101+
- Gehrels (1986) Gehrels, N. 1986, ApJ, 303, 336
- Gladders & Yee (2000) Gladders, M. D. & Yee, H. K. C. 2000, AJ, 120, 2148
- Gobat et al. (2011) Gobat, R. et al. 2011, A&A, 526, A133+
- Greve et al. (2007) Greve, T. R. et al. 2007, MNRAS, 382, 48
- Haas et al. (2009) Haas, M. et al. 2009, ApJ, 695, 724
- Hatch et al. (2011) Hatch, N. A. et al. 2011, MNRAS, 410, 1537
- Ivison et al. (2000) Ivison, R. J. et al. 2000, ApJ, 542, 27
- John (1988) John, T. L. 1988, A&A, 193, 189
- Kajisawa et al. (2006) Kajisawa, M. et al. 2006, MNRAS, 371, 577
- Knopp & Chambers (1997) Knopp, G. P. & Chambers, K. C. 1997, ApJS, 109, 367
- Kodama et al. (2007) Kodama, T. et al. 2007, MNRAS, 377, 1717
- Kurk et al. (2004a) Kurk, J. D. et al. 2004a, A&A, 428, 793
- Kurk et al. (2004b) —. 2004b, A&A, 428, 817
- Lacy et al. (2005) Lacy, M. et al. 2005, ApJS, 161, 41
- Lonsdale et al. (2003) Lonsdale, C. J. et al. 2003, PASP, 115, 897
- Macklin (1982) Macklin, J. T. 1982, MNRAS, 199, 1119
- Mancone et al. (2010) Mancone, C. L. et al. 2010, ApJ, 720, 284
- Maraston (2005) Maraston, C. 2005, MNRAS, 362, 799
- Miley & De Breuck (2008) Miley, G. & De Breuck, C. 2008, A&A Rev., 15, 67
- Papovich (2008) Papovich, C. 2008, ApJ, 676, 206
- Papovich et al. (2010) Papovich, C. et al. 2010, ApJ, 716, 1503
- Pentericci et al. (2000) Pentericci, L. et al. 2000, A&A, 361, L25
- Rettura et al. (2011) Rettura, A. et al. 2011, ApJ, 732, 94
- Rosati et al. (2002) Rosati, P., Borgani, S., & Norman, C. 2002, ARA&A, 40, 539
- Seymour et al. (2007) Seymour, N. et al. 2007, ApJS, 171, 353
- Simpson & Eisenhardt (1999) Simpson, C. & Eisenhardt, P. 1999, PASP, 111, 691
- Sorba & Sawicki (2010) Sorba, R. & Sawicki, M. 2010, ApJ, 721, 1056
- Stanford et al. (2005) Stanford, S. A. et al. 2005, ApJ, 634, L129
- Stern et al. (2003) Stern, D., Holden, B., Stanford, S. A., & Spinrad, H. 2003, AJ, 125, 2759
- Stern et al. (2005) Stern, D. et al. 2005, ApJ, 631, 163
- Stern et al. (2007) —. 2007, ApJ, 663, 677
- Stern et al. (2010) —. 2010, Journal of Cosmology and Astro-Particle Physics, 2, 8
- Stevens et al. (2003) Stevens, J. A. et al. 2003, Nature, 425, 264
- Strazzullo et al. (2006) Strazzullo, V. et al. 2006, A&A, 450, 909
- Tanaka et al. (2011) Tanaka, I. et al. 2011, PASJ, 63, 415
- Tanaka et al. (2010) Tanaka, M., Finoguenov, A., & Ueda, Y. 2010, ApJ, 716, L152
- van Dokkum (2008) van Dokkum, P. G. 2008, ApJ, 674, 29
- Venemans et al. (2007) Venemans, B. P. et al. 2007, A&A, 461, 823
- Vikhlinin et al. (2009) Vikhlinin, A. et al. 2009, ApJ, 692, 1033
- Wilson et al. (2009) Wilson, G. et al. 2009, ApJ, 698, 1943
- Yee et al. (2000) Yee, H. K. C. et al. 2000, ApJS, 129, 475