HST Grism Confirmation of Structures at
from the Clusters Around Radio-Loud AGN (CARLA) Survey
Abstract
We report spectroscopic results from our 40-orbit Hubble Space Telescope slitless grism spectroscopy program observing the 20 densest CARLA candidate galaxy clusters at . These candidate rich structures, among the richest and most distant known, were identified on the basis of color from a hr multi-cycle Spitzer program targeting distant radio-loud AGN. We report the spectroscopic confirmation of distant structures at associated with the targeted powerful high-redshift radio-loud AGN. We also report the serendipitous discovery and spectroscopic confirmation of seven additional structures at not associated with the targeted radio-loud AGN. We find that member galaxies of our confirmed CARLA structures form significantly fewer stars than their field counterparts at all redshifts within . We also observe higher star-forming activity in the structure cores up to , finding similar trends as cluster surveys at slightly lower redshifts (). By design, our efficient strategy of obtaining just two grism orbits per field only obtains spectroscopic confirmation of emission-line galaxies. Deeper spectroscopy will be required to study the population of evolved, massive galaxies in these (forming) clusters. Lacking multi-band coverage of the fields, we adopt a very conservative approach of calling all confirmations “structures”, although we note that a number of features are consistent with some of them being bona fide galaxy clusters. Together, this survey represents a unique and large homogenous sample of spectroscopically confirmed structures at high redshifts, potentially more than doubling the census of confirmed, massive clusters at .
Subject headings:
galaxies: clusters, galaxies: high-redshift1. Introduction
The last decade has seen an explosion in our understanding of the early stages of galaxy cluster formation, largely built upon samples of distant galaxy clusters identified from the Infrared Array Camera (IRAC; Fazio et al., 2004) on the Spitzer Space Telescope. Mid-infrared observations provide an incredibly sensitive tool for identifying massive galaxies at high redshift. For stellar populations formed at high redshift, negative -corrections provide a nearly constant m flux density over a wide redshift range, while red colors provide an effective means of isolating galaxies at (e.g., Papovich, 2008). Indeed, the sensitivity required to detect galaxies at with mid-infrared observations, which Spitzer reaches in min integrations, is sufficient to detect such galaxies to . Several large projects are exploiting mid-infrared data to search for high-redshift galaxy clusters using Spitzer and WISE (e.g., Eisenhardt et al., 2008; Papovich et al., 2010; Galametz et al., 2010, 2013; Stanford et al., 2012, 2014; Muzzin et al., 2013; Wylezalek et al., 2014; Rettura et al., 2014; Brodwin et al., 2015, 2016; Paterno-Mahler et al., 2017). Such work has, for example, proved useful for (i) measuring the galaxy cluster autocorrelation function out to , which provides a measure of the typical galaxy cluster mass (Brodwin et al., 2007), (ii) targeted cosmological surveys for Type Ia SNe in dust-free environments (Suzuki et al., 2012), (iii) probing evolution in the correlation (Brodwin et al., 2011), (iv) using the rest-frame near-infrared luminosity function and rest-frame optical colors to probe the formation epoch of cluster galaxies (Mancone et al., 2010, 2012; Snyder et al., 2012, Wylezalek et al., 2014; Cooke et al., 2015; Nantais et al., 2016), (v) probing the role of AGN feedback in forming clusters (Galametz et al., 2009; Martini et al., 2013), (vi) leading cosmological investigations based on the incidence of massive, high-redshift clusters (Brodwin et al., 2012; Gonzalez et al., 2012), and (vii) probing the dependency of galaxy quenching on environment (Muzzin et al., 2014, Nantais et al., 2017).
A significant challenge, however, is to confirm these massive, distant cluster candidates, particularly at the highest redshifts which probe the earliest stages of their evolution. At , the strong [O II] and D4000 features shift to infrared wavelengths where ground-based spectroscopic follow-up is more challenging, particularly for absorption-line redshifts. Near-infrared grism spectroscopy using the Wide Field Camera 3 (WFC3) onboard the Hubble Space Telescope (HST) provides impressive sensitivity for studying galaxy clusters at high redshift. Courtesy of the multiplexing advantages of slitless spectroscopy combined with the low, absorption-free background provided from space, grism data is sufficient to confirm clusters out to . Indeed, the majority of the most distant clusters currently known were selected on the basis of Spitzer mid-infrared data and confirmed with Hubble grism spectroscopy. This includes clusters at (Stanford et al., 2012), (Newman et al., 2014), (Zeimann et al., 2012), and our own recent confirmation of one evolved cluster and one younger forming structure at and , respectively (Noirot et al., 2016; hereafter N16).
Much work on distant clusters is based on blind field searches, which provide both a strength and a weakness. Field surveys have a simpler selection function for measuring the growth of structure through cluster counts. However, field surveys — both in the mid-infrared and at other wavelengths (e.g., Sunyaev-Zel’dovich or X-ray surveys; Bleem et al., 2015; Tozzi et al., 2015) — find few massive clusters at the highest redshifts (). Many key galaxy cluster studies do not require knowledge of the cluster space density (e.g., Krick et al., 2008; Stern et al., 2010; Rettura et al., 2011; Suzuki et al., 2012), and therefore targeted searches for high-redshift galaxy clusters have many advantages.
We report on a comprehensive, 40-orbit Hubble program using the unique near-infrared grism capabilities of the WFC3 to attempt confirmation of the 20 richest galaxy cluster candidates identified from our 408-hr Warm Spitzer survey of 420 radio-loud AGN across the full sky, Clusters Around Radio-Loud AGN (CARLA; Wylezalek et al., 2013, 2014). With IRAC exposures of hr per field, CARLA reaches depths of out to . Extensive literature reaching back 50 years shows that powerful radio-loud AGN preferentially reside in overdense environments (e.g., Matthews et al., 1964). We identified sources with red mid-infrared colors (; AB), which are primarily expected to be galaxies at (e.g., Wylezalek et al., 2013). Considering the surface density of sources with such colors as selected from the 1 deg2 Spitzer UKIDSS Ultra-Deep Survey (SpUDS, PI: J. Dunlop), we find that the average blind field contains red Spitzer galaxies arcmin-2. In contrast, 92.4% of the CARLA fields are denser than this SpUDS average density. Approximately of the CARLA fields are as rich or richer than twice the average SpUDS density of red galaxies (i.e., arcmin-2), compared to 0.7% of SpUDS fields. Indeed, many of the CARLA fields — and all the fields reported here — are richer than the highest density region in SpUDS, the cluster reported by Papovich et al. (2010) and Tanaka et al. (2010). This Hubble program enhances the census of confirmed rich structures at by a factor of several, identifying systems at a time when clusters are believed to be actively forming.
The paper is structured as follows. Section 2 reports
on the observations, while Section 3 briefly summarizes the
data analysis; we refer the reader to N16 for a detailed description
of the data processing. Section 4 reports on some
initial results from the rest-frame optical spectroscopy, including
cluster membership (§ 4.2), cluster star formation rates
(SFRs; § 4.4), and a detailed description of several
newly confirmed structures of particular interest
(§ 4.6). Section 5 investigates
statistical correlations probed by the data, including
comparison to other cluster surveys (§ 5.1), typical H/[O III] line ratios at high redshift
(§ 5.2), and how SFR depends on galaxy mass
(§ 5.3) and distance from the cluster center
(§ 5.4). We summarize our results in Section 6.
Throughout, we use AB magnitudes and we
adopt the concordance cosmology, , and .
2. Observations
| Field | UT Date | Position AngleaaEast of north. (degrees) | F140W/G141 Exp. Time (s) |
|---|---|---|---|
| CARLA J01162052 | 2014 Dec 06 | 70 | 512/2012 |
| 2015 Oct 25 | 100 | 512/2012 | |
| CARLA J0800+4029 | 2014 Nov 03 | +125 | 537/2062 |
| 2014 Nov 07 | +162 | 537/2062 | |
| CARLA J09582904 | 2015 Oct 13 | +124 | 512/2012 |
| 2015 Dec 02 | +161 | 512/2012 | |
| CARLA J1017+6116 | 2014 Dec 22bbFailed. Re-observed on UT 2015 Nov 22. | +104 | 512/2262 |
| 2015 Feb 05 | +76 | 512/2262 | |
| 2015 Nov 22 | +173 | 512/2262 | |
| CARLA J1018+0530 | 2015 Mar 14 | 30 | 487/2012 |
| 2015 Mar 14 | 10 | 487/2012 | |
| CARLA J1052+0806 | 2015 May 14 | 8 | 487/2012 |
| 2015 May 17 | 28 | 487/2012 | |
| 6CSS1054+4459 | 2014 Dec 26 | +122 | 537/2062 |
| 2015 May 15 | 19 | 537/2062 | |
| CARLA J1103+3449 | 2014 Dec 25 | +167 | 537/2012 |
| 2016 Mar 03 | +45 | 537/2012 | |
| CARLA J1129+0951 | 2015 Apr 19 | 20 | 487/2012 |
| 2015 Apr 19 | 0 | 487/2012 | |
| CARLA J11312705 | 2014 Nov 12 | +131 | 512/2012 |
| 2016 Jan 31 | 159 | 512/2012 | |
| CARLA J1300+4009 | 2015 Jul 04 | 31 | 537/2062 |
| 2015 Oct 30 | 160 | 537/2062 | |
| J1317+3925 | 2015 Jun 30 | 25 | 512/2062 |
| 2016 Feb 29 | +111 | 512/2062 | |
| CARLA J1358+5752 | 2015 Feb 03 | +142 | 537/2212 |
| 2016 Feb 17 | +111 | 537/2212 | |
| CARLA J1510+5958 | 2015 May 18 | +21 | 537/2212 |
| 2015 Jul 04 | 9 | 537/2212 | |
| J1515+2133 | 2015 Apr 08 | +99 | 512/2012 |
| 2015 Apr 13 | +79 | 512/2012 | |
| CARLA J1753+6310 | 2015 Jul 02 | +45 | 512/2262 |
| 2015 Aug 21 | 25 | 512/2262 | |
| CARLA J20392514 | 2014 Oct 14 | 62 | 512/2012 |
| 2014 Oct 14 | 39 | 512/2012 | |
| CARLA J22272705 | 2014 Oct 30 | 50 | 512/2012 |
| 2015 Jul 26 | +160 | 512/2012 | |
| TNR 2254+1857 | 2014 Nov 05 | 32 | 512/2012 |
| 2014 Nov 09 | 72 | 512/2012 | |
| CARLA J23550002 | 2014 Oct 22 | 46 | 487/2012 |
| 2015 Jul 13 | +97 | 462/2012 |
Our HST program consists of WFC3/F140W imaging and WFC3/G141 grism spectroscopy of the 20 densest CARLA cluster candidates, selected from 420 radio-loud AGN at observed in our Spitzer program (Wylezalek et al., 2013). The HST fields are to overdense in Spitzer color-selected sources (i.e, selected to have mid-infrared colors consistent with ) compared to the mean SpUDS density of similarly selected sources (Wylezalek et al., 2014). The targeted radio-loud AGN (RLAGN) at the center of the fields observed with HST cover the redshift range , with a median redshift . Ten fields are associated with high-redshift radio galaxies (HzRGs, type-2 RLAGN), and the other ten with radio-loud quasars (RLQs, type-1 RLAGN). The 20 fields were observed between 2014 October and 2016 April (Program ID: 13740) with a 2-visit per field strategy, using different orientations to mitigate contamination from overlapping spectra. For each visit, we obtained ksec F140W imaging and ksec G141 grism spectroscopy, divided into four dithered blocks of exposures, with the direct images taken just after the grism exposures to enable wavelength calibration of the spectra based on source position. Table 1 lists the observation dates, orientation angles, and exposure times. We refer to confirmed structures by their CARLA names, whereas we refer to unconfirmed structures by their radio-loud AGN target names.
Each image covers a field of view of
at a sampling of arc. The G141 grism
covers the wavelength range with a throughput
at low spectral resolution, . This grism was chosen to enable identification of strong
spectroscopic features at the redshifts of our cluster candidates
(), namely H at , [O III]
at , H at , and [O II]
at . Our efficient strategy of two orbits per field
represents shallow observations, only allowing us to spectroscopically
confirm star-forming galaxies with their strong, narrow emission
lines. Specifically, this strategy of shallow observations does
not provide spectroscopic confirmation of the important, but more
challenging, population of passive galaxies in the distant clusters.
3. Data Processing
Data reduction mainly follows the steps described in N16. In short, we first combine the individual F140W exposures with aXe (v2.2.4; Kümmel et al., 2009, 2011) to create deep drizzled, cosmic ray cleaned, direct images of each field, on which we perform source extraction using SExtractor (Bertin & Arnouts, 1996). Using spectrally empty sky regions determined from the SExtractor catalogs, we then subtract the sky from the grism images using aXe and appropriate configuration files. Individual two-dimensional spectra in each field and visit are then extracted from the grism data based on source position and sizes. For each spectrum we also determine contamination estimates from neighboring objects using the aXe Gaussian contamination model.
We then use an internally developed Graphical User Interface (GUI) to facilitate spectral and source characterization. We determine source redshifts and emission line fluxes with the python version of mpfit using the same method as described in N16, now implemented within our GUI.
See N16 for a detailed, in-depth description of the data processing methodology and implementation.
4. Results
| Field | aaOverdensity significance of color-selected sources above the field value (Wylezalek et al., 2014). | bbMean redshift of structure members. | ccMedian redshift of structure members. | /ddNumber of confirmed structure members () compared to the total number of sources for which we measure a redshift (). The first column corresponds to sources detected in our HST/F140W imaging, the second column to secure sources detected in our Spitzer/IRAC imaging, and the third column to sources passing our Spitzer/IRAC color-selection criterion. | |||
|---|---|---|---|---|---|---|---|
| HST | IRAC | ||||||
| CONFIRMED CARLA STRUCTURES | |||||||
| CARLA J01162052 | 5.14 | 1.417 | 1.425 | 1.430 | 12/31 | 9/22 | 7/14 |
| CARLA J0800+4029 | 6.38 | 2.004 | 1.986 | 1.986 | 10/26 | 5/18 | 5/14 |
| CARLA J09582904 | 5.00 | 1.411 | 1.392 | 1.396 | 8/23 | 5/12 | 5/9 |
| CARLA J1017+6116 | 6.67 | 2.80 | 2.801 | 2.801 | 7/41 | 3/20 | 3/10 |
| CARLA J1018+0530 | 5.00 | 1.949 | 1.952 | 1.953 | 8/26 | 5/18 | 4/8 |
| CARLA J1052+0806 | 4.71 | 1.641 | 1.646 | 1.648 | 6/40 | 1/17 | 1/9 |
| CARLA J1103+3449 | 6.38 | 1.444 | 1.442 | 1.443 | 8/26 | 4/15 | 4/10 |
| CARLA J1129+0951 | 6.33 | 1.520 | 1.528 | 1.531 | 12/39 | 4/16 | 4/7 |
| CARLA J11312705 | 4.38 | 1.444 | 1.446 | 1.445 | 9/36 | 6/23 | 6/18 |
| CARLA J1300+4009 | 4.86 | 1.669 | 1.675 | 1.676 | 8/28 | 2/10 | 2/7 |
| CARLA J1358+5752 | 6.24 | 1.370 | 1.368 | 1.373 | 14/48 | 8/23 | 8/17 |
| CARLA J1510+5958 | 5.62 | 1.719 | 1.725 | 1.719 | 6/46 | 5/24 | 5/14 |
| CARLA J1753+6310 | 4.52 | 1.576 | 1.582 | 1.581 | 5/35 | 1/8 | 1/7 |
| CARLA J20392514 | 8.00 | 1.997 | 1.999 | 2.000 | 9/30 | 3/14 | 3/10 |
| CARLA J22272705 | 5.29 | 1.684 | 1.692 | 1.686 | 7/51 | 2/28 | 2/10 |
| CARLA J23550002 | 5.62 | 1.487 | 1.490 | 1.489 | 12/44 | 7/28 | 7/14 |
| UNCONFIRMED CARLA STRUCTURESeeFor unconfirmed structures, we show in parenthesis mean and median redshifts and source numbers based on the few confirmed sources at the RLAGN redshifts. | |||||||
| 6CSS1054+4459 | 4.67 | 2.573 | (2.566) | (2.566) | (2)/38 | (0)/17 | (0)/7 |
| J1317+3925 | 4.86 | 1.569 | (1.574) | (1.569) | (3)/39 | (3)/22 | (3)/10 |
| J1515+2133 | 4.24 | 2.249 | (2.262) | (2.262) | (2)/35 | (1)/22 | (1)/10 |
| TNR 2254+1857 | 5.62 | 2.164 | (2.159) | (2.157) | (3)/25 | (1)/14 | (1)/10 |
| SERENDIPITOUS DISCOVERIES | |||||||
| CARLA-Ser J1017+6116 | 1.235 | 1.234 | 5/41 | 3/20 | 1/10 | ||
| CARLA-Ser J1317+3925 | 1.467 | 1.465 | 8/39 | 3/22 | 3/10 | ||
| CARLA-Ser J1510+5958 | 0.875 | 0.876 | 6/46 | 1/24 | 0/14 | ||
| CARLA-Ser2 J1510+5958 | 0.977 | 0.976 | 7/46 | 5/24 | 0/14 | ||
| CARLA-Ser J1753+6310 | 2.117 | 2.117 | 6/35 | 0/8 | 0/7 | ||
| CARLA-Ser J22272705 | 1.355 | 1.358 | 10/51 | 3/28 | 1/10 | ||
| CARLA-Ser2 J22272705 | 1.477 | 1.478 | 6/51 | 2/28 | 2/10 | ||
All spectra were initially analyzed by GN, with secondary assessments provided by co-authors. In our final catalogs, we provide the fitted redshifts and consensus quality flags, described in § 4.1. Table 2 shows the spectroscopic results, and spectra of all confirmed members are shown in Appendix D. Among the 20 fields, 16 are confirmed structures associated with the RLAGN, while we fail to confirm four cluster candidates (at , and ). In five of the 20 fields, we also identify seven background or foreground structures. Four (seven) of the 16 confirmed structures have 12 (9) or more confirmed star-forming members. All four non-confirmed clusters have at least one source confirmed at the RLAGN redshift in addition to the RLAGN itself111Note that these non-confirmed clusters also have the potential to host low star-forming or quiescent populations that we cannot identify with our shallow grism observations.. We provide a catalog of all spectroscopically identified sources in the online material. We describe the content of this catalog in Appendix A.
4.1. Redshift Quality Flags
We use the same redshift qualities as in N16: A, B+, and B-. In short, we have three proxies for redshift determination: emission lines, Spitzer/IRAC colors, and the RLAGN prior redshifts. We only consider strong emission lines characteristic of star formation: H, [O III], H, and [O II]. When two or more emission lines are securely detected, we assign quality A redshifts. These redshifts are considered to be very secure.
When only one strong line is detected we also use line non-detections to disentangle between possible identifications and reject uncertain cases. Additionally, if a source also possesses a secure Spitzer/IRAC counterpart with a mid-infrared color that disentangles between possible identifications (see § 1), the redshift quality becomes B+. Such sources are considered to have relatively secure redshifts. In the absence of a secure Spitzer/IRAC identification, the redshift quality flag is B-. Such a situation could happen either because the source is undetected by IRAC or because an IRAC-detected source is a blend of several sources detected in the HST imaging. The redshift quality flag is also B- when a source is securely detected by IRAC but the mid-infrared color alone leaves an ambiguous redshift identification — e.g., a red IRAC source with an isolated emission line at could potentially be, based on the IRAC color, H at or [O III] at (or [O II] at yet higher redshift). Quality B- redshift are considered likely correct, albeit with the potential for some mis-identifications. Note that recurrent identification of strong line(s) at the same wavelengths as the strong emission lines of the targeted RLAGN provides additional strong support that B identifications are robust.
Without deep multi-band coverage of the majority of the fields, robust photometric redshifts are not possible.
Overall, we identify quality A, quality B+, and quality B- redshifts, in the range . Among them, two-thirds () are at .
4.2. Membership Definition
As in N16, we adapt the Eisenhardt et al. (2008) criteria to define a spectroscopically confirmed galaxy cluster. Developed to confirm clusters, the Eisenhardt et al. (2008) criteria require at least five galaxies within a physical radius of 2 Mpc whose spectroscopic redshifts are confined to lie within . The physical radius of our confirmations is here constrained by our HST field of views, which probe smaller radii that the 2 Mpc criterion. Our adopted criteria therefore require at least five galaxies within our HST field of views ( Mpc physical radius) whose spectroscopic redshifts are confined to lie within . As emphasized in N16, the Eisenhardt et al. (2008) definition was designed for ground-based spectroscopic surveys and, alone, may also identify groups, protoclusters, sheets and filaments. As such, these criteria are imperfect, but have the advantage of providing a clearly stated and easily measurable threshold. Ideal criteria for defining robust clusters would likely require additional multi-wavelength data such as extended X-ray detections, Sunyaev-Zel’dovich decrements, and/or weak-lensing total mass measurements. We are pursuing such observations, but they are beyond the scope of the results presented herein. We note, however, that (i) our HST observations probe smaller areas than the area considered by the Eisenhardt et al. (2008) criteria, (ii) the color-selected (i.e., ) cluster member candidates are, on average, highly concentrated around the targeted RLAGN (Wylezalek et al., 2013) and (iii) the overdensities of these candidates reach to above the field value for all fields (Wylezalek et al., 2014). Therefore, the fields confirmed herein have additional supporting properties that argue for them being associated with rich clusters and protoclusters.
In an attempt to better assess the status of our confirmations, we investigate their spectroscopic overdensity significance using the similarly deep 3D-HST field survey (e.g., Momcheva et al., 2016) and compare them to what is expected from numerical simulations (Cautun et al., 2014). In Appendix B, we describe three classes of confirmation: (i) highly probable confirmed clusters (HPC), (ii) probable confirmed clusters (PC), and (iii) confirmed galaxy concentrations (CGC). Three of our confirmed CARLA cluster candidates fall in the first category (HPC) while the rest () fall in the second category (PC). This analysis suggests that, albeit imperfect, our confirmation criteria are robust and likely suffer minimal contamination from groups, sheets and filaments. For simplicity, and lacking additional multi-wavelength coverage of the fields, we however adopt a very conservative approach of calling all spectroscopic confirmations “structures” and refer the reader to Appendix B for a more detailed analysis. We did obtain optical wavelength observations for two fields confirmed herein (CARLA J2039-2514 and CARLA J1753+6310), revealing the presence of two red sequences populated by passive galaxies (see N16 and Cooke et al., 2016, respectively). Based on these additional observations, CARLA J2039-2514 and CARLA J1753+6310 are therefore consistent with being evolved galaxy clusters at and , respectively.
We also emphasize that our 2-orbit per field strategy only confirms star-forming galaxies,
and not the typically dominant passive galaxy population present in evolved galaxy clusters.
Among the 16 confirmed CARLA structures associated with the targeted RLAGN, we identify quality A, quality B+, and quality B- members in the range , with an average (median) of (8) emission line members per confirmed structure. In Appendix C, we show the redshift/velocity and spatial distributions of all HST confirmed members of the confirmed CARLA cluster candidates and briefly discuss characteristics of these structures.
4.3. Line Fluxes
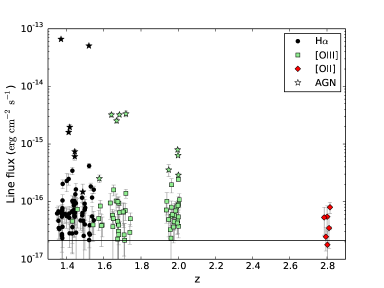
The left panel of Figure 1 shows the emission line fluxes of confirmed members as a function of redshift. For members with multiple-line identifications, we show only one line with the following priority order: H, [O III], and then [O II]. In our low resolution grism data, H and the [N II] doublet are blended. Similar to other teams using WFC3 grism data (e.g., 3D-HST, Fumagalli et al., 2012, Momcheva et al., 2016; the WISP survey, Colbert et al., 2013), our reported H fluxes include the [N II] contributions. However, we consider [N II] contributions when estimating H star formation rates, assuming a typical [N II]/H ratio of (see § 4.4). The [O III] doublet is also unresolved in our grism data, but we fit and measure line fluxes of both emission lines in our fitting procedure (see N16 for details) and only refer to [O III] when using the generic [O III] denomination. Finally, the [O II] doublet is also blended in our grism spectroscopy. However, we do not distinguish between the two lines when referring to [O II], and our [O II] fluxes include the contribution of both lines, fitted as a single Gaussian.
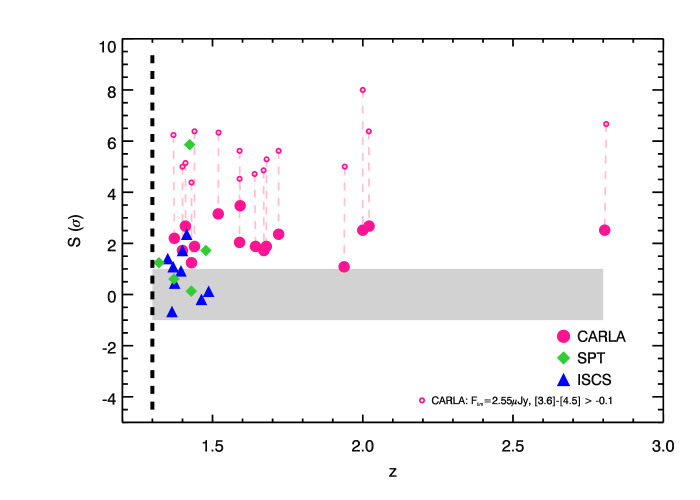
In N16 we determined a line detection limit, with some scatter in the range . This limit varies somewhat depending on the specific observation and grism exposure time.
The 3D-HST survey had a similar 2-orbit depth per WFC3 G141 observation, and determined a emission line flux limit of (Momcheva et al., 2016). This limit, shown as the solid black line in the left panel of Figure 1, is consistent with our measured fluxes.
Overall, fluxes are in the range for star-forming members and in the range for the RLAGN.
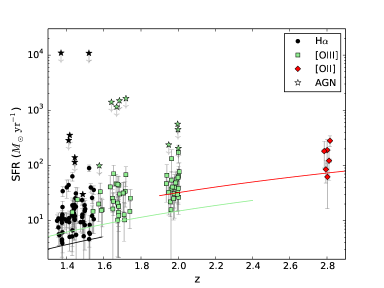
4.4. Star Formation Rates
The right panel of Figure 1 shows the SFRs of confirmed members as a function of redshift. We measure SFRs based on the following lines in priority order: H, [O III], and [O II]. We use the Kennicutt (1983) relation, , to convert H luminosities to SFRs. As noted earlier, H and the [N II] doublet are blended in our low resolution grism data. The typical [N II]/H ratio for local star-forming galaxies is in the range (e.g., Brinchmann et al., 2004). Shapley et al. (2005) found similar values at higher redshifts from a sample of star-forming galaxies at , and determined an average ratio of . [N II] is fainter than [N II], with a ratio of [N II]/[N II] predicted theoretically (e.g., Osterbrock & Ferland, 2006) and confirmed empirically (e.g., Boselli et al., 2013). We therefore correct the H SFRs from [N II] flux contributions using [N II]/H. When estimating SFRs, the WISP survey and 3D-HST teams corrected their H fluxes for [N II] contributions using a [N II]/H ratio of (Atek et al., 2010, Fumagalli et al., 2012, respectively), similar to the correction used here. This ratio typically shows a scatter (e.g., Shapley et al., 2005), which we also add in quadrature to the H flux errors to estimate H SFR uncertainties.
When H is not available, we estimate SFRs based on the [O III] fluxes. As in N16, we assume a crude H/[O III] ratio of unity and estimate SFRs using the same Kennicutt (1983) relation as before. Typically, H/[O III] ratios show a scatter (e.g., Mehta et al., 2015, Suzuki et al., 2016). We therefore add a typical scatter in quadrature to the [O III] flux errors to estimate [O III] SFR uncertainties. We investigate H/[O III] line ratios in § 5.2 from member galaxies where both lines are measured. When only [O II] is available, we measure SFRs using the Kennicutt (1998) relation, [O II].
As in N16, and as done by other teams (e.g., Zeimann et al., 2012, Newman et al., 2014), we crudely correct our observed fluxes for dust extinction assuming a constant dust attenuation in the -band of mag (typical of star forming galaxies; e.g., Kewley et al., 2004, Sobral et al., 2012), and using the Calzetti et al. (2000) extinction curve with (see N16 for details). Unfortunately, we cannot accurately evaluate the amount of dust in our galaxies without additional, longer wavelength data. We further discuss dust contributions in § 5.3.
The right panel of Figure 1 shows the line detection limit shown in the left panel converted to SFRs.
Overall, SFRs are in the range (excluding the RLAGN). Due to AGN contamination, SFR values for (RL)AGN are likely overestimated, and are therefore considered upper limits. The median (mean) star-forming structure member SFR is based on H (i.e., ), based on [O III] (i.e., ), and based on [O II] (CARLA J1017+6116 at ).
For similar limiting fluxes, we are limited to confirming sources with higher SFRs at higher redshifts, as expected. These numbers also clearly demonstrate the added difficulty in confirming clusters at higher redshifts, as only the galaxies with the highest SFRs are confirmed in our shallow grism data.
4.5. Stellar Masses
We determine the stellar masses of sources with Spitzer detections from their Spitzer/IRAC and fluxes. We scale the fluxes with the python version of EZGAL (Mancone & Gonzalez, 2012) to Bruzual & Charlot (2003) stellar population synthesis models using a Chabrier (2003) initial mass function (IMF), single stellar population (SSP), and a formation redshift. We normalize the models to match the best-fit CARLA luminosity function for a Schechter parametrization with (Wylezalek et al., 2014). Using the CARLA luminosity function at instead does not significantly change the results. Using this methodology, structure members with Spitzer/IRAC detections have stellar masses in the range , with a median (mean) stellar mass of . We derive masses in the range for a few RLAGN, though these masses are likely overestimated due to AGN contributions to the spectral energy distributions (e.g., Drouart et al., 2012) and are therefore upper limits. For structure members without Spitzer/IRAC detections, we determine upper limits based on the Spitzer/IRAC depths (Wylezalek et al., 2014); typically, these sources have masses .
To investigate the robustness of our masses, we also estimate stellar masses using models comprised of varying contributions between an SSP and a population of exponentially decaying SFRs. Wylezalek et al. (2014) showed that models with up to an contribution of the star-forming population (with an -folding time ) were still in good agreement with the empirical evolution of , while higher contributions of the star-forming population shows disagreement, especially in the highest redshift bins. In the extreme case of an contribution of the star-forming population, we find lower stellar masses in the range compared to an SSP model for our Spitzer-detected member galaxies. We discuss how this can bias the SFR-mass relation in Section 5.3.
4.6. Clusters of Interest
We next discuss several structures and bona fide clusters of interest, including ones with supporting
data in the literature (CARLA J23550002, CARLA J1753+6310, CARLA J0800+4029, and CARLA J20392514), and the most distant confirmed structure in our sample
(CARLA J1017+6116, at ).
4.6.1 CARLA J23550002
De Breuck et al. (2001) reported the redshift of the targeted HzRG of this field, TXS2353003, as from long-slit spectroscopic observations with the ESO 3.6m EFOSC1 instrument. They reported detection of Ly, N V, and C IV emission. We do not find emission lines consistent with this redshift in our grism spectroscopy. In both orientations, we identify two strong emission lines consistent with H and [O III] at . A similar redshift, consistent with our measurement, was independently reported in Collet et al. (2015), who studied the radio-jet and gas properties of this HzRG as part of a larger study on the warm ionized gas properties of HzRGs at . With moderate-resolution VLT/SINFONI near-infrared spectroscopy (), they measured a redshift of for TXS2353003 based on H and [N II] emission. Given the higher spectral resolution of their data compared to our low-resolution grism data, we adopt this value as the redshift of the HzRG. Note that the redshift discrepancy with our grism measurement is due to the Sextractor source centroid being offset from the emission line region (see last paragraph of this section and Fig. 3). Collet et al. (2015) do not identify any lines consistent with .
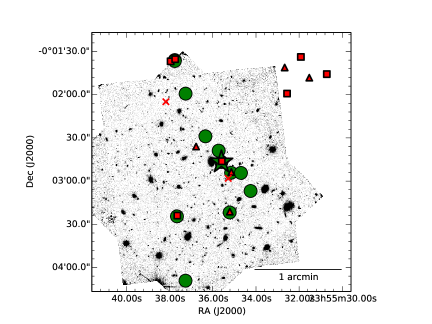
We only identify one source showing a tentative emission line at which could be consistent with [O II] at . However, this identification is very uncertain and therefore not included in our catalog. HST grism data of this field does, however, identify twelve emission line galaxies at a median redshift , out of a total of redshift identifications. We identify both H and [O III] emission for all twelve members (i.e., all redshifts are therefore of quality A). Collet et al. (2015) also obtained H narrow-band imaging of the field around TXS J2355002 with the VLT/ISAAC narrow-band filter. They identified six high-confidence H emitters at (down to a flux of ) in addition to the HzRG, and five lower-confidence emitters. In Figure 2 we show the spatial distribution of the grism confirmed members (green markers) and H emitters (red markers) in the field. Four high-confidence and two lower-confidence emitters fall outside of our HST field of view (red squares and red triangles in Fig. 2, respectively). Considering the narrow-band emitters within the HST field, all three remaining high-confidence H emitters (which includes the HzRG) correspond to independently confirmed members from our HST analysis. One of these H emitters actually corresponds to two confirmed HST members separated by less than one arcsecond. Of the three remaining low-confidence H emitters, all but one is independently confirmed from our HST analysis; the unconfirmed member shows bright continuum in our grism data, but with no indication of emission lines consistent with . Collet et al. (2015) also identified two additional low-confidence H emitters, unpublished in their paper (private communication; red crosses in Fig. 2). One of these sources corresponds to four sources within a radius aperture in our HST imaging. One of these HST sources is confirmed at (quality A), but is not considered a member of CARLA J23550002 due to its velocity shift of from the mean structure redshift, higher than our threshold of . The other three sources of this group do not show notable spectral features. The other unpublished low-confidence emitter was not confirmed in our initial HST analysis. However, a posteriori, we identify tentative H and H emission lines in both grism orientations consistent with , without the detection of [O III]. This suggests that this source is likely an additional structure member. However, the identification is uncertain at the current depth of our HST grism data, and therefore is not included in our catalog.
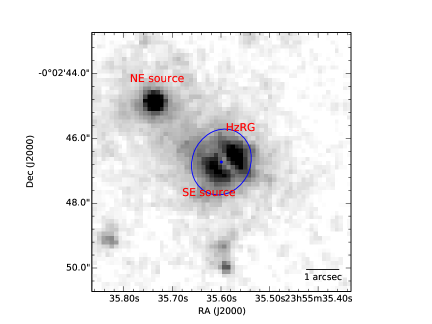
Collet et al. (2015) also reported peculiar radio-jet and gas properties for TXS2353003, finding many similarities with brightest cluster galaxies in low-redshift cool core clusters. Specifically, they found a large () offset between the position angle of the radio jets and the warm ionized gas, and a large radio size of . This suggests no direct interaction between the radio jets and the galaxy gas. They also identified a possible companion to the HzRG, to the North-East, with no emission lines in the SINFONI spectroscopic data. We also detect this source in the HST data (see Fig. 3), similarly detecting only continuum without emission lines in the grism data. However, the approximately two times better HST/WFC3 spatial resolution compared to SINFONI allows us to identify two sources at the position of the HzRG, with visually complex morphologies. As seen in Fig. 3, the two sources are separated by less than , and show distinct spectral traces in the grism data (see Panel d in Fig. 24 in Appendix D). We identify faint continuum with strong H and [O III] emission lines for the North-Western source, which we identify as the HzRG. We identify bright continuum with no clear emission lines for the South-Eastern source.
Collet et al. (2015) argued that the misalignment of the gas and jet could be explained by gas supply from a satellite galaxy.
They however also argued that the potential companion to the NE is unlikely
a perturbing satellite. The other source we identify less than to the SE of the HzRG, unresolved in their imaging, seems a better candidate to be associated to the HzRG and responsible for the jet-gas misalignment.
4.6.2 CARLA J1753+6310
Based on William Herschel Telescope (WHT) ISIS spectroscopic data, Lacy et al. (1999) measured a tentative redshift of for this source based on uncertain identification of a He II emission line and Ly absorption. We do not find any emission lines consistent with this redshift in our grism data. Cooke et al. (2016) studied the broadband spectral energy distributions of candidate members of this distant galaxy cluster, CARLA J1753+6310 (CARLA J1753+6311 in their paper) by combining the CARLA Spitzer/IRAC observations with deep optical imaging data. They also obtained Keck/LRIS optical spectroscopic data for the RLAGN and measured a redshift of based on identification of a single [O II] emission line. In our grism data, we detect bright continuum in both orientations and strong emission at and in the first and second orientations, respectively (see Panel b in Fig. 22 in Appendix D). The emission line is spatially offset from the continuum, by approximately in the first orientation and approximately in the second orientation, while the continuum is aligned with the source centroid from SExtractor in both orientations. This suggests the presence of a line-emitting region located less than an arcsecond to the West of the SExtractor source centroid. With this close separation we consider the system as a single galaxy, the HzRG, at the redshift measured with Keck. The emission lines in our grism data are consistent with [O III] at similar redshift222We initially measured in the first orientation and in the second orientation, under the assumption that the emission line regions were associated with the SExtractor source centroid. Adjusting the wavelength calibration based on the apparent small spatial offset should slightly lower the measured redshift, bringing it into agreement with the redshift measured by Cooke et al. (2016).. H unfortunately falls outside of the grism range at this redshift, but we assign a quality A to the HzRG redshift based on the complementary Keck detections of [O II] and H lines reported by Cooke et al. (2016) and A. Rettura et al. (in prep), respectively.
We identify five emission line members at a median redshift of . These identifications are based on [O III] emission only, as H falls outside of the grism range at this redshift. With additional Keck/MOSFIRE observations of the field, we confirm a combined total of emission line members at =1.582 (A. Rettura et al., in prep.). Among these sources, three are new members confirmed outside the HST field of view with the MOSFIRE spectroscopy based on H emission. Excluding the HzRG which was re-observed as well, A. Rettura et al. (in prep.) also present complementary H emission for HST source , which was already confirmed in our grism data based on [O III] emission. We therefore assign a quality A redshift to this source.
Cooke et al. (2016) demonstrate that CARLA J1753+6310 is a mature cluster at high-redshift. They identify a red sequence population dominated by passive galaxies (i.e., of the red sequence galaxies have broadband colors indicative of a passive population). They show that half the cluster galaxies in the core are quiescent, as compared to only of field galaxies of similar mass and redshift. The relatively small number of confirmed star-forming members in our grism data is therefore consistent with this picture of an evolved cluster largely comprised of passive members with minimal star formation.
The HST grism data of this field also identify a group of six emission line sources at a median redshift of , within . This structure, serendipitously discovered, is comprised of one quality A and five quality B- sources. None of the sources have secure Spitzer/IRAC detections. The quality A source was identified on the basis of [O III] and [O II] emissions, while the quality B- sources were identified based solely on [O III] emission.
This system is the second highest redshift confirmed structure in our sample. A. Rettura et al. (in prep.) present this structure in more detail.
This discovery, as well as the serendipitous discovery of three additional structures not associated with the targeted RLAGN (in the fields of CARLA J1317+3925 and CARLA J22272705; see Table 2), suggests that a fraction of the Spitzer/IRAC overdensities are enhanced by line-of-sight projections
— though we note that all the confirmed members of the background structure identified in this field are actually below the CARLA IRAC detection limit. Potentially, passive, massive members of this background structure are in the CARLA sample, but were not confirmed in the grism spectroscopy. Section 4.7 discusses serendipitous structures identified in our grism data.
4.6.3 CARLA J0800+4029 & CARLA J20392514
CARLA J0800+4029 and CARLA J20392514 are two of the highest-redshift confirmed structures associated with the targeted RLAGN, at and , respectively. These were two of the first fields observed by our HST program, and the grism results are presented in N16. Based on additional optical data, we show in N16 that CARLA J20392514 possesses a red-sequence population of passive galaxies. This suggests that CARLA J20392514 is a bona fide galaxy cluster, while our analysis suggests that CARLA J0800+4029 is a younger forming cluster at similar epoch. We also show in N16 that the targeted HzRG of CARLA J20392514 is kinematically complex with two components, likely a dual AGN, separated by and confirmed at the same redshift. This complex morphology, together with similar findings for the HzRGs of CARLA J23550002, CARLA J1753+6310 and several other fields (e.g., the targeted RLAGN MRC0955288,
6CE1100+3505,
MRC1128268,
J1510+5958)
is consistent with type-2 RLAGN often being found in close merging systems (e.g., Chiaberge et al., 2015). We redirect the reader to N16 for further details concerning CARLA J0800+4029 and CARLA J20392514, such as redshift distributions, mass estimates, color-magnitude relation (CMR) analysis, and comparison to other individual high-redshift clusters.
4.6.4 CARLA J1017+6116
CARLA J1017+6116 is the highest redshift confirmed structure in our CARLA HST sample. We identify seven emission line members at . At this redshift, H, [O III], and H fall outside the G141 grism wavelength range, and identifications are therefore based solely on [O II] emission. We however do not identify [O II] emission in the grism data of the targeted QSO of this field, but additional strong [O III], H, and [Ne III], at (quality A). Excluding the targeted QSO, two confirmed members (HST sources and ) have Spitzer/IRAC detections with mid-infrared colors consistent with . This simple color criterion alone, however, does not disentangle between identifying the detected lines as [O III] or [O II]. These two sources have some of the reddest Spitzer/IRAC colors measured in our sample, with colors of mag for source and mag for source , consistent with very distant galaxies. We conservatively assign quality B- redshifts to these two sources, as the color information alone also allows for an [O III] identification. The redshifts of the other five sources are based on the detection of single emission lines, and are therefore of quality B- as well.
We also serendipitously identify another structure in the grism data of this field. We confirm five emission line sources at a median redshift of . Three of these sources have both multiple-line identifications of H and [O III], as well as Spitzer/IRAC detections. The other two are identified based solely on H.
4.7. Serendipitous Discoveries
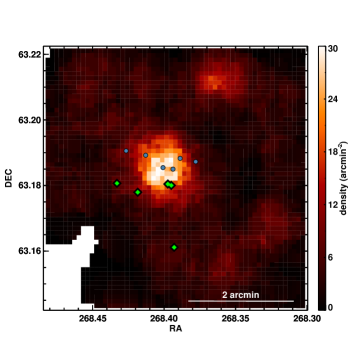
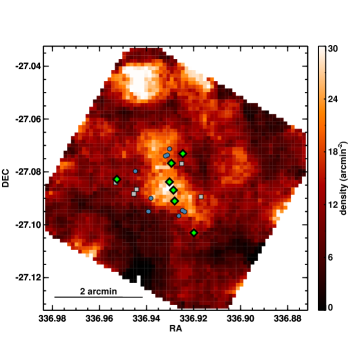
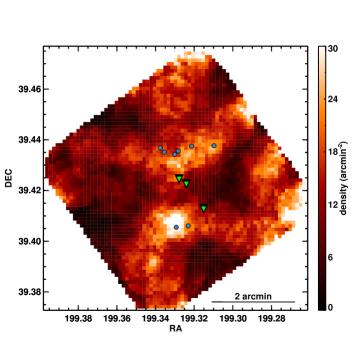
In addition to the confirmed CARLA structures associated with the targeted RLAGN of our program, we identify a total of seven serendipitous structures among five of the twenty HST fields. We refer to these serendipitous structures in the CARLA fields by the nomenclature “CARLA-SerX Jhhmmddmm” where X is an integer, starting at 2 and in redshift order, if two or more serendipitous structures are identified in the same CARLA field, and where Jhhmmddmm are the CARLA coordinates of the respective field. As noted earlier, a fraction of the Spitzer/IRAC overdensities might be enhanced by line-of-sight projections. In the last column of Table 2, we show the number of structure members which satisfy our Spitzer/IRAC color-criterion among the total number of sources with a measured redshift satisfying the same criterion. When compared to the second-to-last column, which shows the same numbers for Spitzer/IRAC detected sources, we see that only one of the 9 Spitzer-detected confirmed members of the serendipitous structures has a color matching our selection criterion. This corroborates the goodness of our selection criterion and further suggests that the overdensity significance (, second column in Table 2) of the fields containing the three serendipitous structures is minimally contaminated by these foreground structures. The serendipitous structures at , however, are more likely to enhance the CARLA overdensities since a large fraction of galaxies detected by Spitzer should satisfy our color-selection criterion. We discover four serendipitous structures at , including two within the same field (CARLA J22272705). CARLA-Ser J1753+6310, discovered at in the field of CARLA J1753+6310, is comprised of six faint, star-forming members, none of which are detected in our Spitzer/IRAC data. The members of this serendipitous structure, however, lie close to the core of CARLA J1753+6310 as seen in the density map of that field in the top panel of Figure 4. We therefore cannot rule out a contribution of potential CARLA-Ser J1753+6310 members to the CARLA overdensity of this field. The two serendipitous structures identified in the field of CARLA J22272705 appear not to be contributing significantly to the CARLA overdensity in this field, as shown by their member spatial distribution overlaid on the CARLA density map in the bottom left panel of Figure 4. We see that CARLA members align with the density of red sources whereas the serendipitous members are less clearly associated. We do not confirm a CARLA structure associated with the targeted RLAGN J1317+3925 at . In the grism data of this field, we only identify two additional sources at the redshift of the RLAGN, as shown in Table 2. We however serendipitously identify CARLA-Ser J1317+3925, a foreground structure at comprised of galaxies. Unlike the two serendipitous structures in the field of CARLA J22272705, CARLA-Ser J1317+3925 members spatially align with the overdensity of red sources as shown in the density map of that field in the bottom right panel of Figure 4. On the other hand, the two sources at the RLAGN redshift do not appear associated with the overdensity. This suggests that the CARLA overdensity in this field is potentially associated with CARLA-Ser J1317+3925. This structure is therefore likely a “spurious” detection of an overdense structure, and not associated with the targeted RLAGN.
To investigate whether we find a larger number of serendipitous structures than expected, we calculate the number of sources in the 3D-HST survey (Momcheva et al., 2016) which belong to a structure as defined in Section 4.2. To compare to our observations and redshift determinations, we select 3D-HST sources which have usable grism redshifts (), and have any combinations of identified H, [O III], or [O II] emission lines above our limiting fluxes () and falling within the wavelength range covered by the G141 grism (). Using arcmin and thresholds, we find that of such selected galaxies in 3D-HST are members of structures containing at least five confirmed members. In contrast, the comparable number from our similarly deep CARLA program is , with three-quarters () associated with the RLAGN structures and one-quarter () associated with serendipitous structures. This is consistent with our observations probing biased, rich, environments. Assuming no strong confirmation bias,
the number of serendipitous structures identified in the CARLA program is
consistent with expectations based on 3D-HST.
5. Discussion
5.1. High-Redshift Clusters
Our shallow 2-orbit per field strategy proves to be efficient at confirming Spitzer color-selected high-redshift structures, with an confirmation rate (16/20 CARLA confirmations). Our grism confirmation method additionally allowed us to serendipitously discover and confirm other high-redshift structures not associated with the targeted RLAGN.
In the following section, we compare the spectroscopically confirmed high redshift CARLA clusters with other high redshift massive clusters. As laid out in the introduction, finding and confirming high redshift galaxy clusters is non trivial. Although much progress has been made in the past decade in finding and characterizing galaxy clusters at , confirmed galaxy clusters at even higher redshift () remain rare, making a direct comparison to the confirmed CARLA clusters challenging.
The South Pole Telescope (SPT) Sunyaev-Zel’dovich (SZ) survey (Reichardt et al., 2013; Bleem et al., 2015) discovered a few tens of high redshift galaxy clusters at , with about a third of those at (Bleem et al., 2015). In contrast to CARLA clusters, the SZ-selected SPT clusters naturally represent a mass-selected sample and the structures belong to the most massive structures known at this epoch. Another very successful program, the IRAC Shallow Cluster Survey (ISCS, Eisenhardt et al., 2008), identified galaxy cluster and group candidates, including at , using a -selected sample of objects in the Boötes field. These systems are typically less massive clusters as they were selected from a relatively small survey area. The ISCS clusters were identified as three-dimensional overdensities using a wavelet algorithm, based on photometric redshift probability distributions. Similar to CARLA clusters, ISCS clusters therefore form an IRAC-based galaxy richness-selected sample, although the exact details of the selection differ from the CARLA selection. Brodwin et al. (2013) report on the high central SFRs in spectroscopically confirmed ISCS clusters at .
For all spectroscopically confirmed SPT and ISCS clusters with existing IRAC data, we generate IRAC1 and IRAC2 source catalogs using the same procedures and parameters as for the CARLA catalogs (Wylezalek et al., 2013, 2014). We use the same color cut of as for the CARLA fields (Wylezalek et al., 2013). Similar to Wylezalek et al. (2013, 2014), we then measure the density of the IRAC-selected sources, , within an radius aperture around each cluster center. SPT cluster centers have been re-calculated using the IRAC photometry to calculate the centroid of the galaxy distribution from the IRAC-selected sources (Gonzalez et al. in prep., Wylezalek et al. in prep.). ISCS cluster centers were determined based on the wavelet analysis from weighted galaxy density maps (Eisenhardt et al., 2008).
To account for the different depths between the SPT, ISCS and CARLA Spitzer/IRAC observations, we apply a common flux density cut of Jy (see Wylezalek et al., 2013 for details on estimating limiting flux densities) to the SPT, ISCS and CARLA fields, shallower than the original depth of the CARLA survey (Jy). For completeness, we also show the CARLA overdensity significance at the original depth of the CARLA survey, Jy (pink open circles in Figure 5). To derive density estimates for a blind field, , and the corresponding standard deviation to the blind field density distribution, , we apply the same criteria to a distribution of random locations from SpUDS. We then estimate the significance of the overdensity of IRAC-selected sources in the fields using:
| (1) |
where denotes that we repeat this calculation for the SPT, ISCS and CARLA fields with the corresponding background estimates, respectively.
In Figure 5, we compare the IRAC overdensity significances, , of SPT and ISCS clusters to our confirmed CARLA clusters.
While CARLA, SPT and ISCS clusters have been selected in different ways, CARLA clusters tend to show a similar or even higher galaxy richness than SPT and ISCS clusters although the SPT clusters are expected to represent the most massive and virialized systems among the three samples. It is beyond the scope of this paper to evaluate how and if galaxy richness can be used to estimate the total mass of a galaxy cluster (see Rettura et al., 2017 in this respect). Though, this simple analysis shows that our CARLA fields (the most overdense among the full CARLA sample, by selection) are comparable to confirmed massive, evolved systems in terms of overdensity of Spitzer/IRAC color-selected galaxies. The strength of the CARLA survey is to find similarly significant overdensities at . We however caution the reader that the non-evolving flux cuts used here preclude direct comparison of the different redshift bins with each other. Investigation of evolutionary trends –and whether the current sample of 16 spectroscopically confirmed structures represent an evolutionary sequence– is therefore beyond the scope of the current analysis.
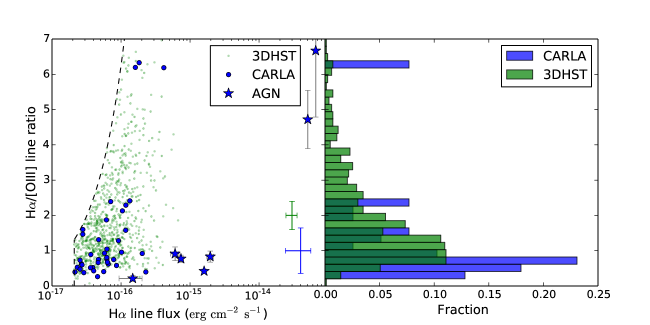
5.2. Line Ratios
In Figure 6, we show the H/[O III] line ratios of confirmed members against H flux, compared to field values from the 3D-HST survey (Momcheva et al., 2016). We select sources from 3D-HST with usable grism redshifts () in the range where we observe both H and [O III] (i.e., ) and use their emission line flux limit of . We assume a 1:3.2 [O III] doublet ratio (see N16) to convert the 3D-HST [O III] doublet fluxes into [O III] fluxes. As noted earlier, the H fluxes include the [N II] contribution. We find a median of for star-forming CARLA members (i.e., excluding AGN), slightly lower than unity, and lower than the 3D-HST median of for sources within [O III]. Our results suggest that, on average, [O III] is brighter than H at these redshifts for cluster galaxies. This is consistent with a decreasing ratio with redshift, where H is typically brighter than [O III] at lower redshifts (e.g., Ly et al., 2007, Domínguez et al., 2013). This would additionally be consistent with elevated AGN activity in high-redshift (proto)clusters compared to the field, as seen in other works (e.g., Galametz et al., 2009), enhancing [O III] line fluxes via AGN photoionization.
Five sources from our grism survey have high ratios, in the range [O III].
Two of these sources are the central QSOs of CARLA J1358+5752
and CARLA J1129+0951. We identify and measure broad and strong H, and weaker [O III] and H fluxes for the
two QSOs. Unless due to intrinsic QSO line properties, the high H/H ratios (,
and , respectively) suggest the presence of intrinsic dust extinction that affects the H/[O III] ratios; where the typical Balmer-decrement (i.e., H/H ratio) is for low-redshift radio-loud QSOs with negligible dust extinction (Dong et al., 2008). The three other sources with high H/[O III] ratios are star-forming members of CARLA J1129+0951. We detect H emission for one of the three sources, for an H/H ratio of ; where the intrinsic (i.e., dust-free) ratio is for Case B recombination (Osterbrock, 1989). We only detect [O III] to the level of our detection limit and a stronger H flux for the other two sources. In both cases, this suggests that the high H/[O III] ratios are due to dust-attenuated [O III] emission. Another possibility for the latter case, would be a very strong [N II] contribution to the H flux.
Two sources have low H/[O III] ratios, with values . One source is the central HzRG of CARLA J23550002, and the other is a star-forming member of this structure.
Using sources with Spitzer detections we do not find a dependence of the line ratio with galaxy stellar mass.
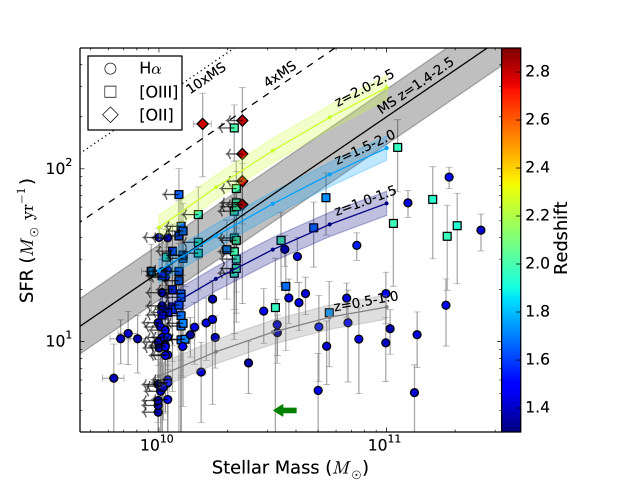
5.3. SFR vs. Mass
In Figure 7, we show the SFRs of members as a function of galaxy stellar mass, where masses are determined as described in § 4.5. The leftward green arrow represents the typical shift in stellar mass () when using a sum of SSP and star-forming decaying models contributing and of the mass, respectively, instead of using an SSP-only model, as described in § 4.5. Note that this shift does not significantly change our results. We also show uncertainties in the SSP-derived stellar masses, propagated from uncertainties in Spitzer/IRAC flux measurements. Most symbols have sizes similar to that of these uncertainties.
As noted in § 4.4, depending on the available emission lines, we estimate SFRs with the following priority order: H, [O III], and [O II] (highlighted by circles, squares, and diamonds in Fig. 7, respectively). To compare the SFR- relation of our confirmed members with field values, we show the star-forming main-sequence of field galaxies established in Daddi et al. (2007) (solid black line in Fig. 7). The dashed and dotted lines represent and the main-sequence, respectively. We also show the Whitaker et al. (2014) main-sequences for galaxies, comparable to our mass estimates of Spitzer-detected members. We show the main-sequences derived for the redshift ranges and (grey, blue, cyan, and yellow curves in Fig. 7, respectively). The grey confidence region around the Daddi et al. (2007) main-sequence corresponds to the semi-interquartile range ( dex) of their SFR- distribution. The confidence regions around the Whitaker et al. (2014) main-sequences represent the typical error ( dex) in their SFR median stacks used to derive the polynomial fits of the main-sequences in the range , as in Table 2 of their paper. Using the limiting Spitzer/IRAC fluxes determined in Wylezalek et al. (2014), we determine upper limits on the galaxy masses of non-Spitzer-detected confirmed members. We highlight these sources with leftward arrows in Figure 7.
We find that Spitzer-detected confirmed members, with stellar masses typically above , are located under the main-sequence of their corresponding redshift bins up to . Indeed, Spitzer-detected members (highlighted by dark blue markers in Fig. 7) are located below the field star-forming main-sequence, and tend to better agree with the lower-redshift (i.e., ) star-forming main-sequence of Whitaker et al. (2014). This would be consistent with an accelerated galactic evolution in overdense environments. Similarly, Spitzer-detected members are located below the Daddi et al. (2007) and Whitaker et al. (2014) main-sequences. For many of the lower mass galaxies, we only have upper limits on their masses and are therefore unable to confidently address where they reside relative to the main-sequence. On the other hand, at all redshifts, the more massive (i.e., Spitzer-detected) member galaxies, with stellar masses typically above , form very few stars for their mass, as shown by their location under their respective star-forming main-sequences of field galaxies. This suggests that these are evolved galaxies, that have already undergone a major episode of star formation.
These results, however, are dependent on
the robustness of the SFR estimates. We might be underestimating SFRs
of dustier member galaxies since our calculations assume a constant
dust attenuation of mag in the -band for all galaxies. Additional
longer wavelength data will be required to fully investigate how
dust affects our results. However, we emphasize that our treatment is
identical to the approach adopted in previous analyses (e.g., Zeimann et al., 2012, Newman et al., 2014), and that this value is typical of star-forming galaxies
(e.g., Kewley et al., 2004, Sobral et al., 2012). Even adopting mag of dust attenuation
in the -band, we still find that of Spitzer-detected
star-forming members are located below the Daddi et al. (2007)
main-sequence.
Alternatively, we fit a second order polynomial to the subsample of H members and compute the amount of dust attenuation AV, as a function of , required to reproduce the Whitaker et al. (2014) main-sequence at . We find that the required dust attenuation AV is monotonically increasing with stellar mass and ranges from at to at . These values are significantly higher than typical dust attenuation for massive galaxies, both at low redshifts and in color-selected massive galaxies and comparable redshift to the CARLA sample. Specifically, using a sample of star-forming galaxies from Data Release 7 of the Sloan Digital Sky Survey (Abazajian et al., 2009), Garn & Best (2010) find H dust attenuations ranging from for galaxies to at with an average width of the distribution of . This corresponds to AV attenuations of , respectively. Kashino et al. (2013, 2014) find similar dust attenuations from a sample of -selected star-forming galaxies at from the COSMOS field (McCracken et al., 2010).
Our analysis therefore supports the result that massive () confirmed
members of these distant structures did indeed form earlier than field
galaxies at similar redshift, and reside below the main sequence of
star-forming galaxies at their redshift, unless significantly dust-obscured.
5.4. SFR vs. Radius
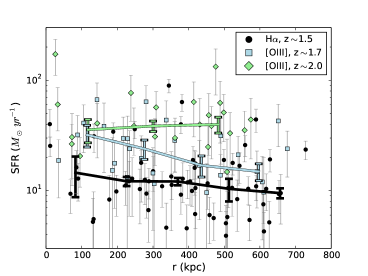
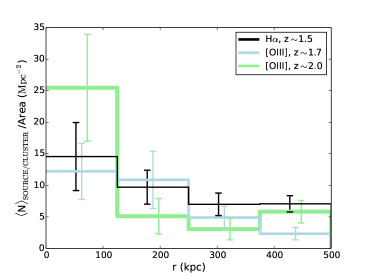
In the top panel of Figure 8, we show individual SFRs of members and corresponding running medians as a function of physical distance from the targeted RLAGN. We divided members into three redshift groups. The first group, represented by solid black circles, corresponds to members of the seven confirmed CARLA structures at for which the SFRs are based on H, and limited to . The second group, represented by solid light-blue squares, includes members of the five [O III]-based SFR structures at , which have limiting SFRs . The third group, represented by solid light-green squares, is comprised of the three [O III]-based SFR structures at (with SFRs ; see Fig. 1). We caution the reader that the use of different SFR tracers, each also having different limiting SFRs, precludes direct comparison of the three different redshift bins. Despite large scatter, we observe a general trend of slightly decreasing source SFR with distance from the targeted RLAGN for members of the H SFR-based group and for members of the [O III] SFR-based group at (top panel Fig. 8). Confirmed members of the [O III] SFR-based group at , limited to higher () SFRs, do not exhibit such behavior. Higher number statistics and deeper observations to identify lower star-forming members would therefore be required to infer the radial SFR trend of individual sources at . At close proximity to the RLAGN (), we see a steep increase of member galaxy SFRs (for the H SFR-based group and the [O III] SFR-based group at ). This could be consistent with RLAGN nuclear activity triggering the star-formation of satellite galaxies.
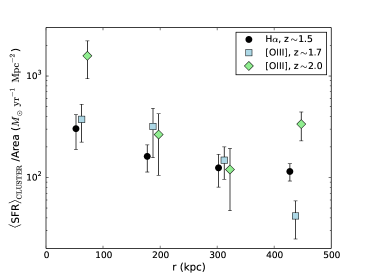
In the bottom left panel of Figure 8, we show the average SFR density per structure (in ) as a function of distance from the targeted RLAGN. Values are all derived within bins of from the RLAGN, and error bars represent the error in the mean. We observe a clear decreasing trend with distance from the targeted RLAGN for all SFR tracers and redshift bins, except the last radial bin of the [O III] SFR-based group at (light-green diamonds) which exhibits an increase of SFR density. This is directly correlated to the average number density of sources with distance from the RLAGN. In the bottom right panel of Figure 8, we indeed observe a general higher concentration of star-forming members at close proximity to the RLAGN, and also a slightly increased concentration of sources within compared to for the [O III] SFR-based group at . Even though the RLAGN may not always reside at the center of the structures, this result supports that it is the case on average, as also shown in Wylezalek et al. (2013). These results also show that, on average, most of the star-forming budget in our confirmed CARLA structures is enclosed within their densest, central regions.
Overall, these trends are consistent with Brodwin et al. (2013) who studied confirmed clusters from the Spitzer/ISCS (Eisenhardt et al., 2008) in the range and found similar trends for a subsample of clusters in the range , while lower redshift clusters showed
lower SFR in clusters cores, ubiquitous at (see also, e.g., Tran et al., 2010). Together, this suggests that cluster cores are the preferred sites of star formation at these epochs.
6. Summary
We conclude the following from our 40-orbit HST/WFC3 F140W and G141 follow-up observations on the 20 densest CARLA candidate clusters at .
-
1.
We spectroscopically confirm Spitzer color-selected distant structures associated with the targeted RLAGN, including three at (CARLA J1018+0530, CARLA J0800+4029 and CARLA J2039-2514) and one at (CARLA J1017+6116). These structures are among the most distant confirmed cluster candidates currently known. We identify members in these structures, with an average of members per confirmed structure. We also serendipitously discover and confirm seven other structures at not associated with the targeted RLAGN of our program.
-
2.
With just two orbits of HST imaging and grism spectroscopy per field, we confirm emission-line sources down to , corresponding to limiting SFRs in the range , depending on the identified emission line and galaxy redshift.
-
3.
We show that these newly confirmed CARLA structures at are comparable or slightly richer in mid-infrared overdensity to spectroscopically confirmed massive SPT and ISCS clusters at , implying similar galaxy richness despite being at much higher redshift.
-
4.
We find that massive () confirmed structure members, all showing evidence of star formation, reside below the star-forming main-sequence of galaxies at their redshift. Unless significantly dust-obscured, this implies that these galaxies in rich environments underwent a significant episode of star formation prior to the epoch that we are now observing them.
-
5.
We find that the density of star-forming galaxies rises sharply at smaller radii from the central RLAGN, implying that most of the star-forming budget is enclosed within the densest regions of these structures. This trend is consistent with the results of Brodwin et al. (2013), who studied a sample of mid-infrared selected clusters at slightly lower redshift, and is consistent with an overall reversal of the SFR-density relation at higher redshifts.
-
6.
Comparing spectroscopically confirmed member densities to expectations from field observations and numerical simulations, we classify, in Appendix B, our confirmed structures into three classes: (i) highly probable confirmed clusters (HPC), (ii) probable confirmed clusters (PC), and (iii) confirmed galaxy concentrations (CGC). Our analysis classifies three confirmed CARLA structures in the HPC category, while all other confirmed CARLA structures () are classified as probable confirmed clusters.
-
7.
Finally, these results highlight both the strengths and weaknesses of shallow HST grism spectroscopy for confirming high-redshift galaxy clusters. With an extremely efficient strategy of just 2-orbits per field, we are able to confirm most of these candidate high-redshift clusters and demonstrate the robust selection efficiency of the CARLA Spitzer imaging program. However, by design, this strategy fails to confirm member galaxies lacking star formation and therefore fails to identify the interesting sample of massive, evolved, early-type galaxies in these distant structures. A deeper grism program would be able to achieve such science.
Facilities: HST (WFC3; STScI), Spitzer (IRAC; JPL/Caltech), Palomar (DBSP; Caltech).
Appendix A Spectroscopic Catalog
We describe in Table 3 the content of the spectroscopic catalog available in the online material. This catalog gathers spectroscopic information on all sources with a measured redshift in our 20 HST fields.
| # | Column Label | Description |
|---|---|---|
| col1 | Field | CARLA names for all fields where a CARLA confirmed structure is present. Target RLAGN name otherwise, |
| except for CARLA-Ser J1317+3925 (only serendipitous structure within a field with no confirmed CARLA structure). | ||
| col2 | ID | Unique source ID among each field. |
| col3 | RA | Right Ascension (J), in degrees. |
| col4 | Dec | Declination (J), in degrees. |
| col5 | F140W | Magnitude (AB). |
| col6 | F140W_ERR | Magnitude uncertainty (AB). |
| col7 | z | Redshift. |
| col8 | z_ERR | Redshift uncertainty. |
| col9 | Q | Redshift quality. |
| col10 | f_Ha | H flux (). H fluxes include [N II] contributions. |
| col11 | f_Ha_ERR | H flux uncertainty (). |
| col12 | f_Hb | H flux () |
| col13 | f_Hb_ERR | H flux uncertainty () |
| col14 | f_OIII | [O III] flux () |
| col15 | f_OIII_ERR | [O III] flux uncertainty () |
| col16 | f_OII | [O II] flux () |
| col17 | f_OII_ERR | [O II] flux uncertainty () |
Note. — The catalog is published in its entirety in the machine-readable format. Meta-data are shown here for guidance regarding its form and content.
Appendix B Significance of the Spectroscopic Confirmations
In this Appendix we evaluate the significance of our CARLA spectroscopic overdensities (both targeted and serendipitous). This analysis provides an additional flag to better assess the status of our confirmations and non-confirmations.
As already mentioned, in Wylezalek et al. (2013, 2014) we derived an estimate of the Spitzer-selected galaxy overdensities for all CARLA fields and compared them to the average distribution of similarly selected galaxies from SpuDS. We measured a field galaxy overdensity of galaxies per arcmin2 (Wylezalek et al., 2014). The fields of our confirmed structures (CARLA clusters) have galaxy overdensity significances . This means that, based on the Spitzer-selected galaxy overdensities alone, there is an almost zero probability that our confirmed structures are simply field galaxy overdensities. As mentioned before, our detections can still be clusters, groups, filaments or sky superpositions which can not be distinguished in Spitzer colors alone. We therefore measure the overdensity of spectroscopically confirmed members in our CARLA fields and compare to expected values in the field (using 3D-HST) and numerical simulations (using Cautun et al., 2014) in an attempt to understand whether our confirmations are in better agreement with being nodes of the cosmic web (i.e., virialized clusters) or filaments.
As previously, we select 3D-HST sources which have usable grism redshifts (), and have any combinations of identified H, [O III], or [O II] emission lines above our limiting fluxes () and falling within the wavelength range covered by the G141 grism (). We scan these sources in the redshift range with a step of , corresponding to our adopted definition. For each redshift bin, we measure the number density of galaxies using randomly distributed non-overlapping radius apertures. We then stack the density distributions within steps of in redshift and fit Gaussians to the distributions to obtain the standard deviation of the spectroscopic field galaxy density (in ) at these redshifts. We then compare confirmed member densities in our CARLA fields to the field values at the appropriate redshifts. The top left panel of Figure 9 shows the overdensity significance (in ) of spectroscopic members of our confirmed CARLA and serendipitous structures and non-confirmed CARLA cluster candidates, shown as red circles, green triangles, and black crosses, respectively.
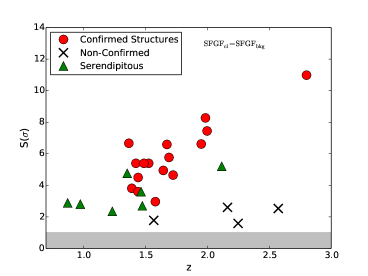
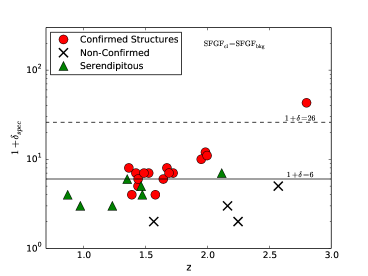
We also measure galaxy contrasts (where and are measured in galaxies per arcmin2) which we can compare to numerical simulations (e.g., Cautun et al., 2014). Following a similar approach as in Mei et al. (2015), we compare the galaxy contrast measurements of Cautun et al. (2014) to our . Cautun et al. (2014) measured the probability density function (PDF) of contrasts belonging to a void, a wall, a filament or a node (virialized region) of the cosmic web. Following Cautun et al. (2014), we define, for this analysis, clusters and cluster progenitors as virialized regions at all redshifts. Numerical simulations predict that the haloes that are most probably accreted in clusters with masses at have masses at (e.g., Chiang et al., 2013, Cautun et al., 2014).
Following Cautun et al. (2014), overdensities within from the mean of the node PDF have contrasts of and a probability of to be filaments, while those with contrasts of are within from the mean of the node PDF and have a probability of to be filaments. Overdensities with contrasts of are more than from the mean of the node PDF; their probability to be nodes of the cosmic web is and they also have a probability of to be filaments. We find galaxy contrasts for of our confirmed CARLA cluster candidates, including one (CARLA J1017+6116) with a contrast higher than (; see top right panel of Fig. 9). CARLA J1753+6310, showing a strong red sequence, dominated by a passive population (Cooke et al., 2016) and for which we confirm five star-forming members in our grism data, is among the three confirmed CARLA structures with . This illustrates that the different star-formation histories in the field and cluster environments can significantly affect our spectroscopic overdensity significances and galaxy contrasts. We therefore estimate different contributions of the star-forming population from the literature to scale our galaxy contrasts. Also note that the higher grism confusion in crowded (cluster) environments compared to the field tends to underestimate our measurements of spectroscopic significance and galaxy contrast.
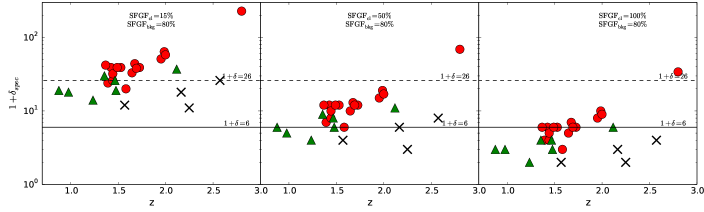
The fraction of star-forming galaxies in the field is typically at (e.g., Darvish et al., 2016). The fraction of star-forming galaxies in clusters within a region of radius Mpc () is typically and at and , respectively (e.g., Brodwin et al., 2013). The exact percentage depends on the evolutionary status of the cluster. In fact, clusters dominated by passive populations are found up to (e.g., Newman et al., 2014, Cooke et al., 2016). To quantify how different star-forming galaxy fractions in clusters and the field ( and , respectively) change our classification, we scale by for three different cases: (i) , which is typical of evolved clusters, (ii) , which corresponds to typical clusters at (e.g., Brodwin et al., 2013), and (iii) , which corresponds to the most extreme case in which all galaxies are star-forming galaxies. We show our galaxy contrasts for these three cases in the bottom panels of Figure 9.
In the case (Fig. 9, bottom left panel), 14 of our 16 confirmed CARLA structures are within from the mean of the Cautun et al. (2014) node PDF (i.e., they have ). Three of the serendipitous confirmations are also within of the node PDF, while four are within (i.e., they have ). In the case (Fig. 9, bottom middle panel), the only confirmed CARLA structure within from the mean of the node PDF is CARLA J1017+6116, confirmed at with star-forming members. With a contrast of , Cautun et al. (2014) predicts a probability larger than that this is a node of the cosmic web and to be a filament. In this scenario, all other confirmed CARLA structures and five serendipitous structures have . In the extreme case of (Fig. 9, bottom right panel), again only the confirmed structure is within from the mean of the node PDF. In this last scenario, eleven confirmed CARLA structures and one serendipitous have ; all other sources have .
In Table 4, we show for all 20 fields the spectroscopic overdensity significance (), the galaxy contrast () for the three star-forming galaxy fractions discussed here, and a robustness flag. This flag is comprised of three integers, each corresponding to one of the three star-forming galaxy fraction cases, and each ranging from one to three, with , , and corresponding to fields which have galaxy contrasts , , and from the mean of the node PDF, respectively. For example, a field with flag is within from the mean of the node PDF (i.e., ) for of , , and , in this sequence. We also add a flag, not available to all fields, indicating the presence of a clearly defined red sequence as from Cooke et al. (2016) and N16.
Using this analysis, we consider confirmed structures (confirmed CARLA structures and serendipitous discoveries) with at least two flag components equal to as highly probable confirmed clusters or protoclusters (HPC). We consider confirmed structures with at least two flag components equal or less than as probable confirmed clusters or protoclusters (PC). For any flag combination, we consider confirmed structures with clear red sequences as highly probable confirmed clusters or protoclusters (HPC). We consider all other confirmed structures as confirmed galaxy concentrations (CGC). We show the classifications for our confirmed structures in Table 4.
We have three confirmed CARLA structures classified as HPC, while the rest () are classified as PC. Among serendipitous discoveries, are classified as PC, while the other two are classified as CGC. We do not classify unconfirmed CARLA structures but show their flags in Table 4 for completeness.
We will refine these considerations when additional multi-wavelength imaging and spectroscopy will be available to us on these fields. For simplicity, in the main body of this paper, we adopt the very conservative approach to call all spectroscopic confirmations “structures”.
| Field | aaOverdensity significance (in ) of color-selected sources above the field value (Wylezalek et al., 2014). | bbOverdensity significance (in ) of spectroscopically confirmed sources above the field value. The values derived assume identical star-forming galaxy fractions in the field and cluster environments. | ccGalaxy contrast of spectroscopically confirmed sources for three cases of star-forming galaxy fractions in clusters; respectively , , and , with a constant fraction of in the field. | FlagddRobustness flag, as described in the text. | RSeeFlag indicating if the confirmed structure exhibits a tight red sequence (0: False, 1: True) | ClassffConfirmed structure classification following our analysis. HPC: highly probable confirmed cluster, PC: probable confirmed cluster, CGC: confirmed galaxy concentration. | |||
|---|---|---|---|---|---|---|---|---|---|
| CONFIRMED CARLA STRUCTURES | |||||||||
| CARLA J01162052 | 1.430 | 5.14 | 5.54 | 39 | 12 | 6 | 122 | PC | |
| CARLA J0800+4029 | 1.986 | 6.38 | 8.91 | 64 | 19 | 10 | 122 | 0 | PC |
| CARLA J09582904 | 1.396 | 5.00 | 3.71 | 24 | 7 | 4 | 223 | PC | |
| CARLA J1017+6116 | 2.801 | 6.67 | 12.26 | 228 | 69 | 34 | 111 | HPC | |
| CARLA J1018+0530 | 1.953 | 5.00 | 7.13 | 51 | 15 | 8 | 122 | PC | |
| CARLA J1052+0806 | 1.648 | 4.71 | 6.19 | 33 | 10 | 5 | 123 | PC | |
| CARLA J1103+3449 | 1.443 | 6.38 | 3.69 | 26 | 8 | 4 | 123 | PC | |
| CARLA J1129+0951 | 1.531 | 6.33 | 5.54 | 39 | 12 | 6 | 122 | PC | |
| CARLA J11312705 | 1.445 | 4.38 | 4.62 | 32 | 10 | 5 | 123 | PC | |
| CARLA J1300+4009 | 1.676 | 4.86 | 7.07 | 44 | 13 | 7 | 122 | PC | |
| CARLA J1358+5752 | 1.373 | 6.24 | 6.49 | 42 | 12 | 6 | 122 | PC | |
| CARLA J1510+5958 | 1.719 | 5.62 | 4.52 | 39 | 12 | 6 | 122 | PC | |
| CARLA J1753+6310 | 1.581 | 4.52 | 2.90 | 20 | 6 | 3 | 223 | 1 | HPC |
| CARLA J20392514 | 2.000 | 8.00 | 8.02 | 58 | 17 | 9 | 122 | 1 | HPC |
| CARLA J22272705 | 1.686 | 5.29 | 6.19 | 38 | 12 | 6 | 122 | PC | |
| CARLA J23550002 | 1.489 | 5.62 | 5.54 | 39 | 12 | 6 | 122 | PC | |
| UNCONFIRMED CARLA STRUCTURESggFor unconfirmed structures, overdensity significances and galaxy contrasts are derived based on the few () confirmed sources at the RLAGN redshifts. | |||||||||
| 6CSS1054+4459 | (2.566) | 4.67 | 2.27 | 26 | 8 | 4 | (123) | ||
| J1317+3925 | (1.569) | 4.86 | 1.74 | 12 | 4 | 2 | (233) | ||
| J1515+2133 | (2.262) | 4.24 | 1.63 | 11 | 3 | 2 | (233) | ||
| TNR 2254+1857 | (2.157) | 5.62 | 3.15 | 18 | 6 | 3 | (223) | ||
| SERENDIPITOUS DISCOVERIES | |||||||||
| CARLA-Ser J1017+6116 | 1.234 | 2.17 | 14 | 4 | 2 | 233 | CGC | ||
| CARLA-Ser J1317+3925 | 1.465 | 3.69 | 26 | 8 | 4 | 123 | PC | ||
| CARLA-Ser J1510+5958 | 0.875 | 2.69 | 19 | 6 | 3 | 223 | PC | ||
| CARLA-Ser2 J1510+5958 | 0.976 | 2.36 | 18 | 5 | 3 | 233 | CGC | ||
| CARLA-Ser J1753+6310 | 2.117 | 5.51 | 37 | 11 | 6 | 122 | PC | ||
| CARLA-Ser J22272705 | 1.357 | 4.64 | 30 | 9 | 4 | 123 | PC | ||
| CARLA-Ser2 J22272705 | 1.478 | 2.77 | 19 | 6 | 3 | 223 | PC | ||
Appendix C Velocity Scatter and Spatial Distribution of Confirmed Members
In this Appendix we show and briefly discuss the redshift/velocity scatter and spatial distribution of confirmed members in our confirmed CARLA cluster candidates (additional members of CARLA J1753+6311 confirmed with Keck spectroscopy are not shown here; see A. Rettura et al., in prep). CARLA confirmations are sorted by increasing scatter in redshift space (standard deviation). CARLA J20392514 and CARLA J0800+4029, already published in N16, are reproduced here for consistency.
CARLA J1103+3449, Fig. 10, Panel (a) – This confirmed CARLA cluster candidate is comprised of members at , six being of quality A with both H and [O III] detected. All members are confirmed within and strongly peak at the same redshift as the RLAGN, which could argue against a very massive virialized cluster of larger velocity scatter/dispersion. We however determined a flag for this confirmed structure (see Appendix B), which, following our analysis in Appendix B, would tend to support that CARLA J1103+3449, classified as PC, is probably a node of the cosmic web, as opposed to a filament. The RLAGN appears to possess at least one confirmed satellite member ().
CARLA J1300+4009 (b) – Given its redshift, [O III] was the only strong line available in our grism data for confirming members of this CARLA cluster candidate. The confirmed members have again very low velocity scatter, for a combined flag . Classified as PC, this would tend to support that CARLA J1300+4009 is most probably a node of the cosmic web at .
CARLA J20392514 (c) – We previously presented CARLA J20392514 in detail in N16 and showed that this confirmed structure is already comprised of a red-sequence of passive candidate members, consistent with being a bona fide galaxy cluster. With a flag of , CARLA J20392514, comprised of 9 confirmed members including a dual AGN and classified as HPC, appears as a very strong candidate for being a massive node of the cosmic web at . The (dual-AGN) RLAGN seem to possess at least two confirmed satellite members ( and ).
CARLA J1052+0806 (d) – This confirmed structure shows one of the densest cores, among our 20 CARLA HST fields, of red color-selected galaxies which only exhibit continuum in our grism data, without detection of emission lines. Due to proximity, their spectra are additionally contaminating each other. These sources are very promising targets for deeper spectroscopic observations and additional multi-wavelength follow-ups to reveal and study passive populations already present in a cluster core at . A flag of classifies CARLA J1052+0806 as PC. A bright nearby galaxy, falling on the West side of our HST field of view, additionally contaminated a significant fraction of our grism data in this field, likely hindering confirmation of additional star-forming members of CARLA J1052+0806.
CARLA J1753+6310 (e) – We previously presented CARLA J1753+6310 in Section 4.6.2; see that section for details. We only confirm five members in our grism data, while additional Keck observations confirm an additional three members (A. Rettura et al., in prep). CARLA J1753+6310 has a flag, and Cooke et al. (2016) demonstrated that this structure possesses a strong red-sequence of passive candidate members and that its core is dominated by passive galaxies. CARLA J1753+6310, classified as HPC, therefore appears as a very strong candidate for being a massive node of the cosmic web at . The RLAGN likely possesses one confirmed satellite member () at least.
CARLA J23550002 (f) – We previously presented CARLA J23550002 in Section 4.6.1; see that section for details. With a total of quality-A-only members at , CARLA J23550002 appears as one of the most convincing spectroscopic confirmation from our HST data alone. Supporting data (Collet et al., 2015) additionally identifies H emitters outside our HST field of view. CARLA J23550002 has a flag and its velocity distribution shows some scatter. This tends to support that CARLA J23550002, classified as PC, is probably a massive virialized cluster caught at an epoch of star formation. Confirmed (star-forming) members interestingly appear to be aligned in the NNE-SSW direction. Detailed study of CARLA J23550002 therefore appears very promising with respect to investigating the interplay between AGN nuclear activity, large-scale star formation and the infall of gas from the cosmic web. The RLAGN seems to possess multiple confirmed satellite members.
CARLA J11312705 (g) – CARLA J11312705 is comprised of members at , including four quality A and four quality B+ sources. Confirmed members are well peaked around the redshift of the RLAGN, with a scatter similar to CARLA J23550002. This confirmed structure has a flag. Together, this tends to support that CARLA J11312705, classified as PC is a probable node of the cosmic web. One member (#442) appears as a probable satellite of the RLAGN.
CARLA J01162052 (h) – We confirm members at , including six quality A sources, in the grism data of CARLA J01162052. As opposed to previously discussed confirmed structures, confirmed members of CARLA J01162052 appear to form two peaks around its mean redshift and are predominantly located to the North of the RLAGN. This might suggest that the RLAGN is not located at the center of the structure. With a flag of , our analysis however supports that this confirmed structure is a probable node of the cosmic web (it is classified as PC).
CARLA J1017+6116 (i) – At a redshift of , CARLA J1017+6116 is the highest redshift confirmed structure among our 20 fields. With seven confirmed members at this redshift, CARLA J1017+6116 also possesses the highest spectroscopic overdensity significance and galaxy contrast of our sample. Confirmed members appear well distributed around the RLAGN redshift. At this high redshift, we however relied on the sole identification of the relatively weak [O II] emission line to confirm members of this structure. Additional spectroscopy would be required to obtain more robust redshift qualities on these sources. With a flag, our analysis suggests that CARLA J1017+6116 is a highly probable node of the cosmic web (i.e., it is classified as HPC). Note that Spitzer/IRAC and HST/F140W flux measurements of source are contaminated by a bright nearby source and a diffraction spike and should be considered as upper limits only.
CARLA J1358+5752 (j) – CARLA J1358+5752 is the structure with the highest number of confirmed members in our data, with confirmations at including quality A sources. Five confirmed sources appear slightly blueshifted compared to the rest of the members. This could suggest infalling galaxies in the structure potential. Together with a flag, CARLA J1358+5752, classified as PC, appears as a probable node of the cosmic web. One source () appears as a probable satellite of the RLAGN.
CARLA J1129+0951 (k) – We confirm members at , including quality A sources, in the grism data of CARLA J1129+0951. The velocity distribution is again double peaked, with five members slightly redshifted compared to the bulk of confirmed members including the RLAGN. Deeper, higher-resolution spectroscopy will be required to understand whether they are infalling galaxies. This structure has a flag, classifying CARLA J1129+0951 as PC.
CARLA J1018+0530 (l) – Together with CARLA J20392514 and CARLA J0800+4029, CARLA J1018+0530 is one of the three confirmed structures at among our 20 fields. CARLA J1018+0530 interestingly shows a concentration of bright continuum-only sources in the NE with respect to the RLAGN. This group shows hint of potential intra-cluster light, while narrow-band imaging available for this field suggests that sources of this group have photometric redshifts consistent with that of the RLAGN. A posteriori tentative detection of an emission line consistent with [O III] at the redshift of the RLAGN for one source in this group tends to support this claim. We will present these data in a forthcoming paper. With a flag, CARLA J1018+0530 is classified as PC. Two sources ( and ) appear as probable satellites of the RLAGN.
CARLA J1510+5958 (m) – CARLA J1510+5958 is comprised of six confirmed members, mainly of B qualities due to the redshift () of the target. This allows identification of a sole strong emission line ([O III]) in our grism data. Two sources appear significantly redshifted () compared to the other confirmed members. With a flag, our analysis classifies CARLA J1510+5958 as PC. One source () appears as a probable satellite of the RLAGN.
CARLA J09582904 (n) – CARLA J09582904 is confirmed with members at including five quality A sources. Among our confirmed CARLA clusters, CARLA J09582904 shows the most redshifted RLAGN relative to the mean redshift of the structure. Unless due to e.g., wavelength mis-calibration, this could suggest that the targeted RLAGN of CARLA J09582904 might not reside at the center of the structure. Source appears as a likely satellite of the RLAGN. With a flag, CARLA J09582904 is classified as PC. Source appears as a probable satellite of the RLAGN.
CARLA J22272705 (o) – CARLA J09582904, confirmed with members at , shows a double-peaked velocity distribution, which could potentially suggest that confirmed members are not yet well stabilized in the structure potential. With a flag, our analysis classifies CARLA J22272705 as PC.
CARLA J0800+4029 (p) – We previously presented CARLA J0800+4029 in detail in N16. In N16, we showed that CARLA J0800+4029 does not exhibit a clear red-sequence of bright () candidate members, as opposed to CARLA J20392514, and is likely a younger forming structure than CARLA J20392514, which was confirmed at a similar redshift (). This would tend to better argue in favor of the large velocity scatter of CARLA J0800+4029 being consistent with infalling members in the structure potential rather than showing evidence for a massive stabilized cluster. Additional data, however, is required to better characterize the evolutionary status of this confirmed structure. With a flag of , our analysis classifies CARLA J0800+4029 as PC. Source appears as a probable satellite of the RLAGN.
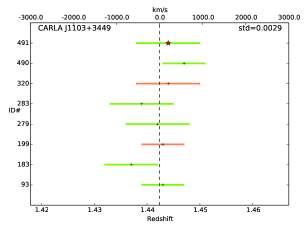
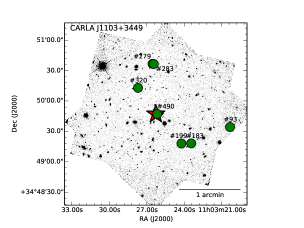 (a)
(a)
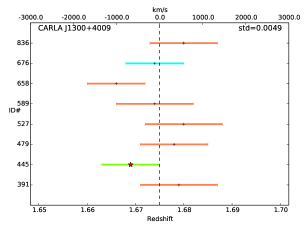
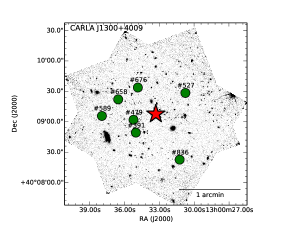 (b)
(b)
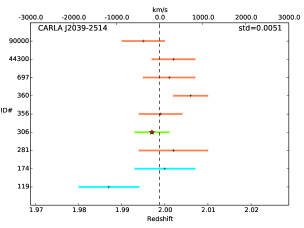
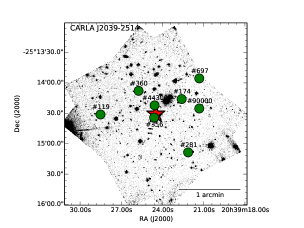 (c)
(c)
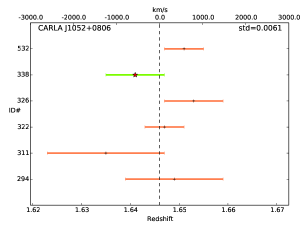
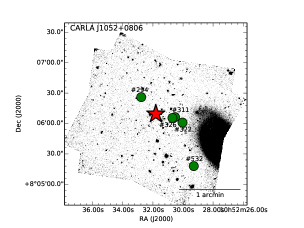 (d)
(d)
![[Uncaptioned image]](/html/1804.01500/assets/x25.png)
![[Uncaptioned image]](/html/1804.01500/assets/x26.png) (e)
(e)
![[Uncaptioned image]](/html/1804.01500/assets/x27.png)
![[Uncaptioned image]](/html/1804.01500/assets/x28.png) (f)
(f)
![[Uncaptioned image]](/html/1804.01500/assets/x29.png)
![[Uncaptioned image]](/html/1804.01500/assets/x30.png) (g)
(g)
![[Uncaptioned image]](/html/1804.01500/assets/x31.png)
![[Uncaptioned image]](/html/1804.01500/assets/x32.png) (h)
(h)
Figure 10 — Continued.
![[Uncaptioned image]](/html/1804.01500/assets/x33.png)
![[Uncaptioned image]](/html/1804.01500/assets/x34.png) (i)
(i)
![[Uncaptioned image]](/html/1804.01500/assets/x35.png)
![[Uncaptioned image]](/html/1804.01500/assets/x36.png) (j)
(j)
![[Uncaptioned image]](/html/1804.01500/assets/x37.png)
![[Uncaptioned image]](/html/1804.01500/assets/x38.png) (k)
(k)
![[Uncaptioned image]](/html/1804.01500/assets/x39.png)
![[Uncaptioned image]](/html/1804.01500/assets/x40.png) (l)
(l)
Figure 10 — Continued.
![[Uncaptioned image]](/html/1804.01500/assets/x41.png)
![[Uncaptioned image]](/html/1804.01500/assets/x42.png) (m)
(m)
![[Uncaptioned image]](/html/1804.01500/assets/x43.png)
![[Uncaptioned image]](/html/1804.01500/assets/x44.png) (n)
(n)
![[Uncaptioned image]](/html/1804.01500/assets/x45.png)
![[Uncaptioned image]](/html/1804.01500/assets/x46.png) (o)
(o)
![[Uncaptioned image]](/html/1804.01500/assets/x47.png)
![[Uncaptioned image]](/html/1804.01500/assets/x48.png) (p)
(p)
Figure 10 — Continued.
Appendix D Member Spectra
In the following appendix (Figs. 11–24, in R.A. order), we show member spectra of all confirmed structure members, except CARLA J20392514 and CARLA J0800+4029 which were published in N16.
 (a)
(a)
 (b)
(b)
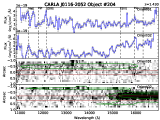 (c)
(c)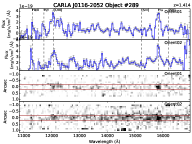
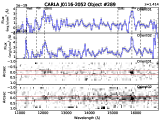 (d)
(d)
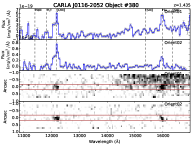
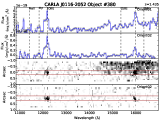 (e)
(e)
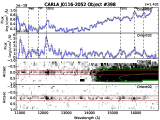 (f)
(f)
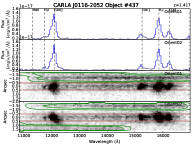
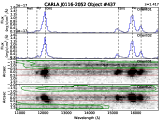 (g)
(g)
 (h)
(h)
 (i)
(i)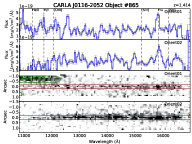
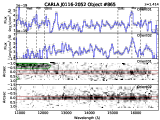 (j)
(j)
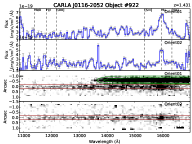
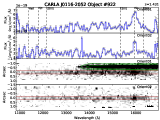 (k)
(k)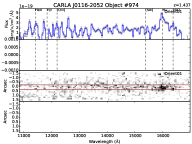
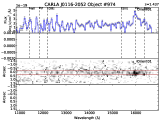 (l)
(l)
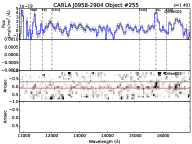
 (a)
(a)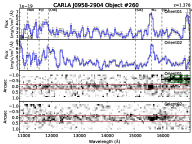
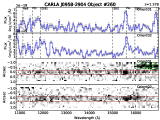 (b)
(b)
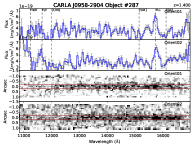
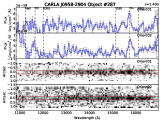 (c)
(c)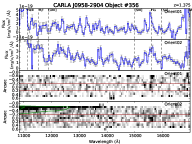
 (d)
(d)
 (e)
(e)
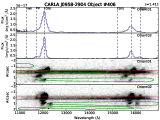 (f)
(f)
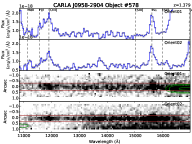
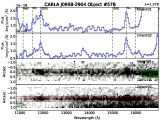 (g)
(g)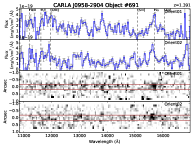
 (h)
(h)
 (a)
(a)
 (b)
(b)
 (c)
(c)
 (d)
(d)
 (e)
(e)
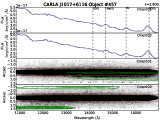 (f)
(f)
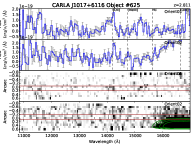
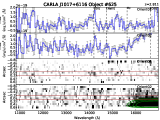 (g)
(g)
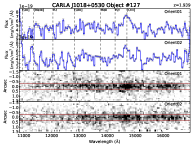
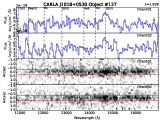 (a)
(a)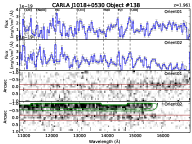
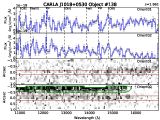 (b)
(b)
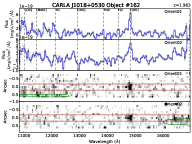
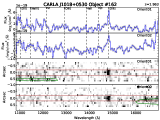 (c)
(c)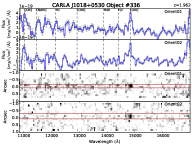
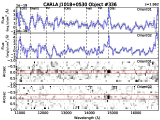 (d)
(d)
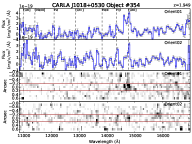
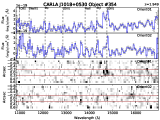 (e)
(e)
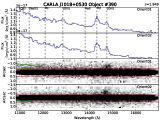 (f)
(f)
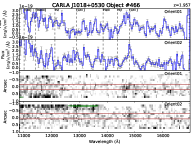
 (g)
(g)
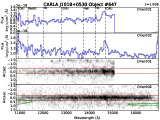 (h)
(h)
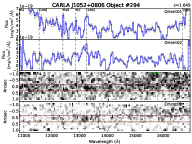
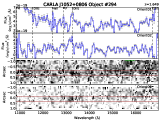 (a)
(a)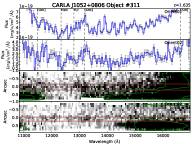
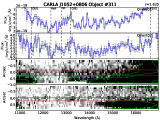 (b)
(b)
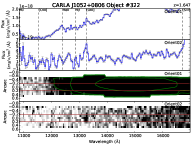
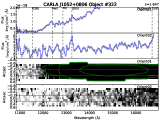 (c)
(c)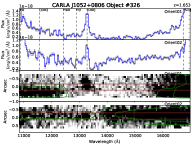
 (d)
(d)
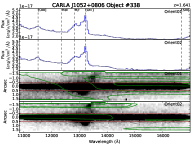
 (e)
(e)
 (f)
(f)
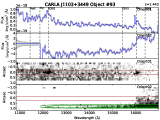 (a)
(a)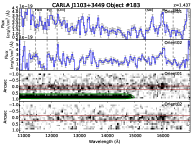
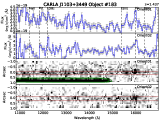 (b)
(b)
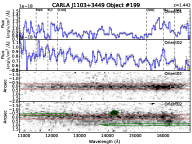
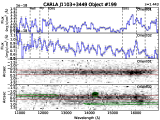 (c)
(c)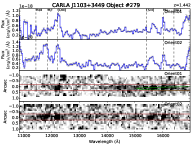
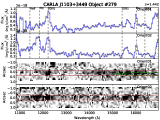 (d)
(d)
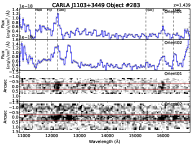
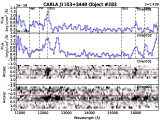 (e)
(e)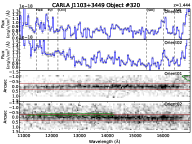
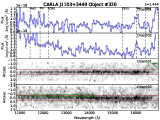 (f)
(f)
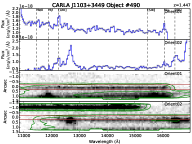
 (g)
(g)
 (h)
(h)
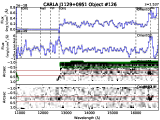 (a)
(a)
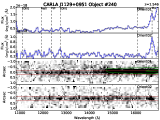 (b)
(b)
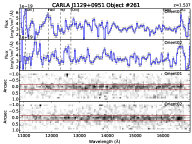
 (c)
(c)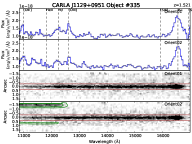
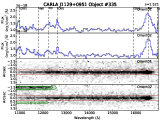 (d)
(d)
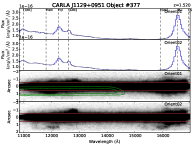
 (e)
(e)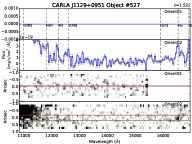
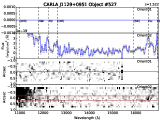 (f)
(f)
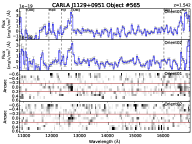
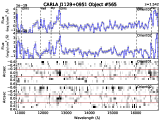 (g)
(g)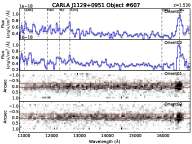
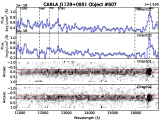 (h)
(h)
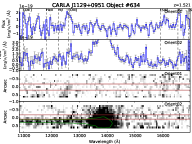
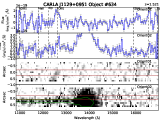 (i)
(i)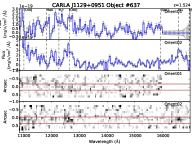
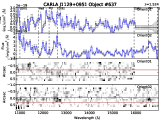 (j)
(j)
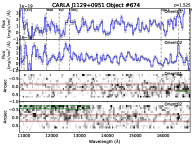
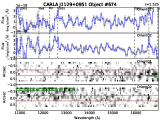 (k)
(k)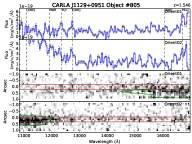
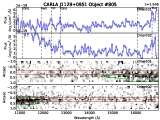 (l)
(l)
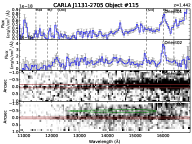
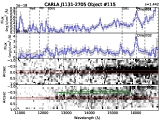 (a)
(a)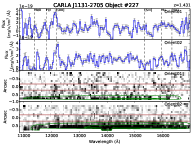
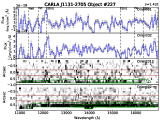 (b)
(b)
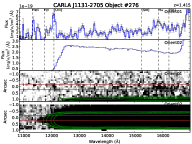
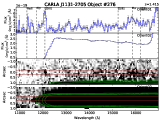 (c)
(c)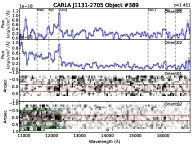
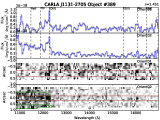 (d)
(d)
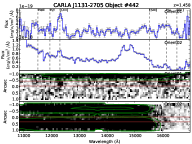
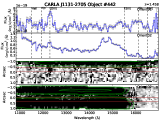 (e)
(e)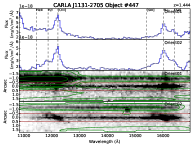
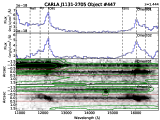 (f)
(f)
 (g)
(g)
 (h)
(h)
 (i)
(i)
 (j)
(j)
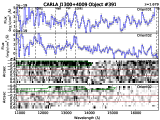 (a)
(a)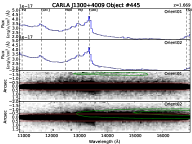
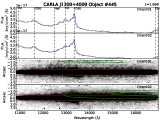 (b)
(b)
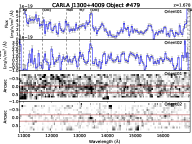
 (c)
(c)
 (d)
(d)
 (e)
(e)
 (f)
(f)
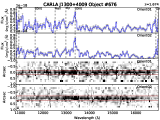 (g)
(g)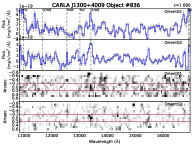
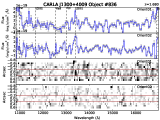 (h)
(h)

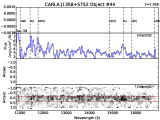 (a)
(a)
 (b)
(b)

 (c)
(c)
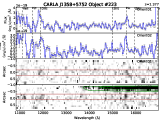 (d)
(d)
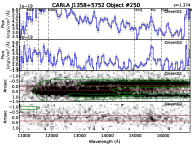
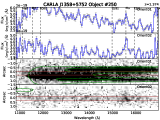 (e)
(e)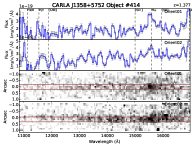
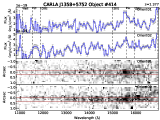 (f)
(f)
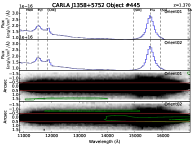
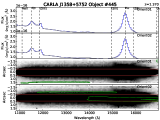 (g)
(g)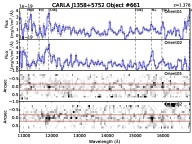
 (h)
(h)
 (i)
(i)
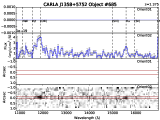 (j)
(j)
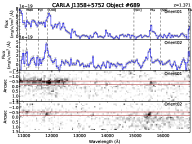
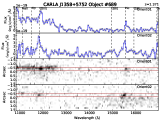 (k)
(k)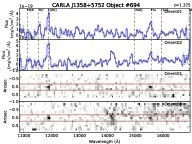
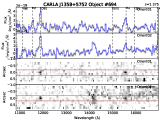 (l)
(l)
![[Uncaptioned image]](/html/1804.01500/assets/x231.png)
![[Uncaptioned image]](/html/1804.01500/assets/x232.png) (m)
(m)![[Uncaptioned image]](/html/1804.01500/assets/x233.png)
![[Uncaptioned image]](/html/1804.01500/assets/x234.png) (n)
(n)
Figure 20 — Continued.
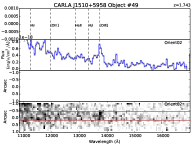
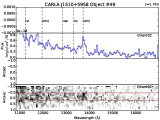 (a)
(a)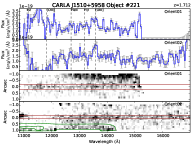
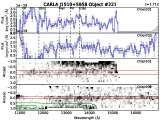 (b)
(b)
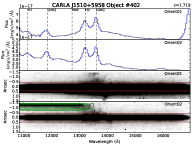
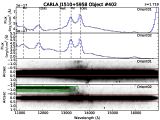 (c)
(c)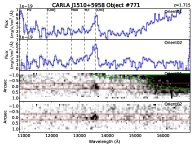
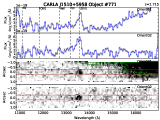 (d)
(d)
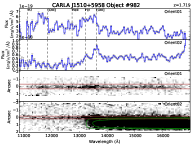
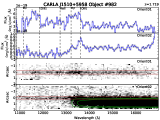 (e)
(e)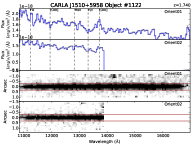
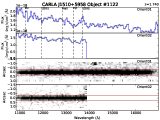 (f)
(f)

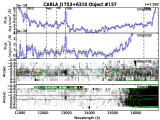 (a)
(a)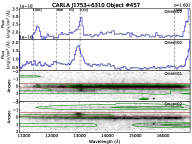
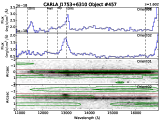 (b)
(b)

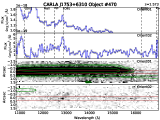 (c)
(c)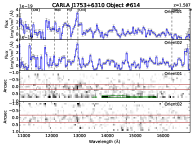
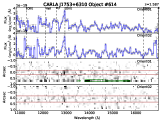 (d)
(d)

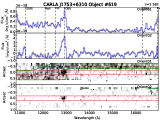 (e)
(e)
 (a)
(a)
 (b)
(b)
 (c)
(c)
 (d)
(d)
 (e)
(e)
 (f)
(f)
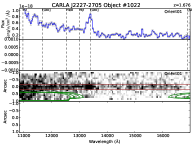
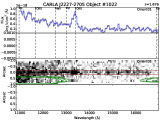 (g)
(g)
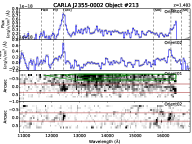
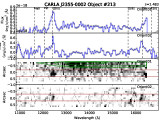 (a)
(a)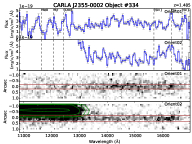
 (b)
(b)
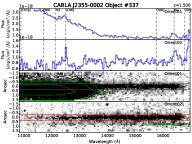
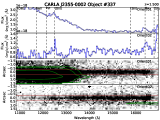 (c)
(c)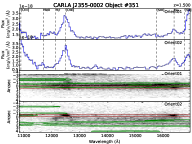
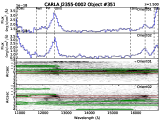 (d)
(d)
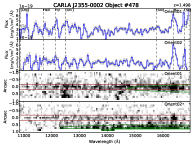
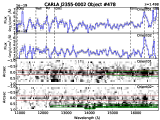 (e)
(e)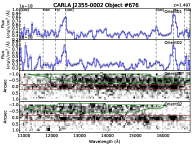
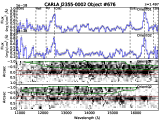 (f)
(f)
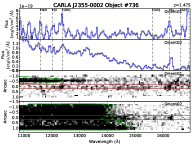
 (g)
(g)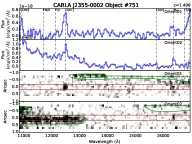
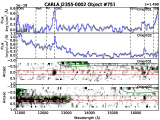 (h)
(h)
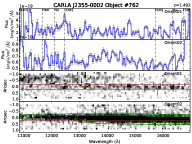
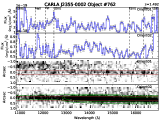 (i)
(i)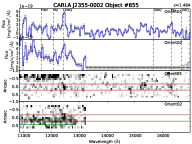
 (j)
(j)
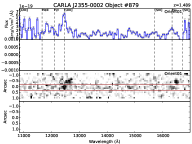
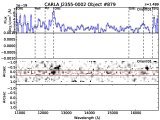 (k)
(k)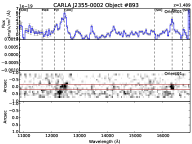
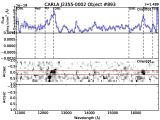 (l)
(l)
References
- Abazajian et al. (2009) Abazajian, K. N., Adelman-McCarthy, J. K., Agüeros, M. A., et al. 2009, ApJS, 182, 543-558
- Atek et al. (2010) Atek, H., Malkan, M., McCarthy, P., et al. 2010, ApJ, 723, 104
- Bertin & Arnouts (1996) Bertin, E., & Arnouts, S. 1996, A&AS, 117, 393
- Bleem et al. (2015) Bleem, L. E., Stalder, B., de Haan, T., et al. 2015, ApJS, 216, 27
- Boselli et al. (2013) Boselli, A., Hughes, T. M., Cortese, L., Gavazzi, G., & Buat, V. 2013, A&A, 550, A114
- Brinchmann et al. (2004) Brinchmann, J., Charlot, S., White, S. D. M., et al. 2004, MNRAS, 351, 1151
- Brodwin et al. (2007) Brodwin, M., Gonzalez, A. H., Moustakas, L. A., et al. 2007, ApJ, 671, L93
- Brodwin et al. (2011) Brodwin, M., Stern, D., Vikhlinin, A., et al. 2011, ApJ, 732, 33
- Brodwin et al. (2012) Brodwin, M., Gonzalez, A. H., Stanford, S. A., et al. 2012, ApJ, 753, 162
- Brodwin et al. (2013) Brodwin, M., Stanford, S. A., Gonzalez, A. H., et al. 2013, ApJ, 779, 138
- Brodwin et al. (2015) Brodwin, M., Greer, C. H., Leitch, E. M., et al. 2015, ApJ, 806, 26
- Brodwin et al. (2016) Brodwin, M., McDonald, M., Gonzalez, A. H., et al. 2016, ApJ, 817, 122
- Bruzual & Charlot (2003) Bruzual, G., & Charlot, S. 2003, MNRAS, 344, 1000
- Calzetti et al. (2000) Calzetti, D., Armus, L., Bohlin, R. C., et al. 2000, ApJ, 533, 682
- Cautun et al. (2014) Cautun, M., van de Weygaert, R., Jones, B. J. T., & Frenk, C. S. 2014, MNRAS, 441, 2923
- Chabrier (2003) Chabrier, G. 2003, PASP, 115, 763
- Chiaberge et al. (2015) Chiaberge, M., Gilli, R., Lotz, J. M., & Norman, C. 2015, ApJ, 806, 147
- Chiang et al. (2013) Chiang, Y.-K., Overzier, R., & Gebhardt, K. 2013, ApJ, 779, 127
- Colbert et al. (2013) Colbert, J. W., Teplitz, H., Atek, H., et al. 2013, ApJ, 779, 34
- Collet et al. (2015) Collet, C., Nesvadba, N. P. H., De Breuck, C., et al. 2015, A&A, 579, A8
- Cooke et al. (2015) Cooke, E. A., Hatch, N. A., Rettura, A., et al. 2015, MNRAS, 452, 2318
- Cooke et al. (2016) Cooke, E. A., Hatch, N. A., Stern, D., et al. 2016, ApJ, 816, 83
- Daddi et al. (2007) Daddi, E., Dickinson, M., Morrison, G., et al. 2007, ApJ, 670, 156
- Darvish et al. (2016) Darvish, B., Mobasher, B., Sobral, D., et al. 2016, ApJ, 825, 113
- De Breuck et al. (2001) De Breuck, C., van Breugel, W., Röttgering, H., et al. 2001, AJ, 121, 1241
- Dong et al. (2008) Dong, X., Wang, T., Wang, J., et al. 2008, MNRAS, 383, 581
- Domínguez et al. (2013) Domínguez, A., Siana, B., Henry, A. L., et al. 2013, ApJ, 763, 145
- Drouart et al. (2012) Drouart, G., De Breuck, C., Vernet, J., et al. 2012, A&A, 548, A45
- Eisenhardt et al. (2008) Eisenhardt, P. R. M., Brodwin, M., Gonzalez, A. H., et al. 2008, ApJ, 684, 905
- Fazio et al. (2004) Fazio, G. G., Hora, J. L., Allen, L. E., et al. 2004, ApJS, 154, 10
- Fumagalli et al. (2012) Fumagalli, M., Patel, S. G., Franx, M., et al. 2012, ApJ, 757, L22
- Galametz et al. (2009) Galametz, A., Stern, D., Eisenhardt, P. R. M., et al. 2009, ApJ, 694, 1309
- Galametz et al. (2010) Galametz, A., Stern, D., Stanford, S. A., et al. 2010, A&A, 516, A101
- Galametz et al. (2013) Galametz, A., Stern, D., Pentericci, L., et al. 2013, A&A, 559, A2
- Garn & Best (2010) Garn, T., & Best, P. N. 2010, MNRAS, 409, 421
- Gonzalez et al. (2012) Gonzalez, A. H., Stanford, S. A., Brodwin, M., et al. 2012, ApJ, 753, 163
- Grogin et al. (2011) Grogin, N. A., Kocevski, D. D., Faber, S. M., et al. 2011, ApJS, 197, 35
- Hatch et al. (2011) Hatch, N. A., De Breuck, C., Galametz, A., et al. 2011, MNRAS, 410, 1537
- Hatch et al. (2014) Hatch, N. A., Wylezalek, D., Kurk, J. D., et al. 2014, MNRAS, 445, 280
- Hayashi et al. (2010) Hayashi, M., Kodama, T., Koyama, Y., et al. 2010, MNRAS, 402, 1980
- Hewett & Wild (2010) Hewett, P. C., & Wild, V. 2010, MNRAS, 405, 2302
- Juneau et al. (2014) Juneau, S., Bournaud, F., Charlot, S., et al. 2014, ApJ, 788, 88
- Kashino et al. (2013) Kashino, D., Silverman, J. D., Rodighiero, G., et al. 2013, ApJ, 777, L8
- Kashino et al. (2014) Kashino, D., Silverman, J. D., Rodighiero, G., et al. 2014, ApJ, 785, L37
- Kapahi et al. (1998) Kapahi, V. K., Athreya, R. M., van Breugel, W., McCarthy, P. J., & Subrahmanya, C. R. 1998, ApJS, 118, 275
- Kennicutt (1983) Kennicutt, R. C., Jr. 1983, ApJ, 272, 54
- Kennicutt (1998) Kennicutt, R. C., Jr. 1998, ARA&A, 36, 189
- Kewley et al. (2004) Kewley, L. J., Geller, M. J., & Jansen, R. A. 2004, AJ, 127, 2002
- Kravtsov et al. (2014) Kravtsov, A., Vikhlinin, A., & Meshscheryakov, A. 2014, arXiv:1401.7329
- Krick et al. (2008) Krick, J. E., Surace, J. A., Thompson, D., et al. 2008, ApJ, 686, 918-926
- Kroupa (2001) Kroupa, P. 2001, MNRAS, 322, 231
- Kümmel et al. (2009) Kümmel, M., Walsh, J. R., Pirzkal, N., Kuntschner, H., & Pasquali, A. 2009, PASP, 121, 59
- Kümmel et al. (2011) Kümmel, M., Walsh, J., Kuntschner, H., & Bushouse, H. 2011, aXe User Manual version 2.3 (Baltimore: STScI)
- Labbé et al. (2005) Labbé, I., Huang, J., Franx, M., et al. 2005, ApJ, 624, L81
- Lacy et al. (1999) Lacy, M., Rawlings, S., Hill, G. J., et al. 1999, MNRAS, 308, 1096
- Large et al. (1981) Large, M. I., Mills, B. Y., Little, A. G., Crawford, D. F., & Sutton, J. M. 1981, MNRAS, 194, 693
- Licitra et al. (2016) Licitra, R., Mei, S., Raichoor, A., Erben, T., & Hildebrandt, H. 2016, MNRAS, 455, 3020
- Lidman et al. (2008) Lidman, C., Rosati, P., Tanaka, M., et al. 2008, A&A, 489, 981
- Ly et al. (2007) Ly, C., Malkan, M. A., Kashikawa, N., et al. 2007, ApJ, 657, 738
- Mancone et al. (2010) Mancone, C. L., Gonzalez, A. H., Brodwin, M., et al. 2010, ApJ, 720, 284
- Mancone et al. (2012) Mancone, C. L., Baker, T., Gonzalez, A. H., et al. 2012, ApJ, 761, 141
- Mancone & Gonzalez (2012) Mancone, C. L., & Gonzalez, A. H. 2012, PASP, 124, 606
- Martini et al. (2013) Martini, P., Miller, E. D., Brodwin, M., et al. 2013, ApJ, 768, 1
- Matthews et al. (1964) Matthews, T. A., Morgan, W. W., & Schmidt, M. 1964, ApJ, 140, 35
- McCracken et al. (2010) McCracken, H. J., Capak, P., Salvato, M., et al. 2010, ApJ, 708, 202
- Mehta et al. (2015) Mehta, V., Scarlata, C., Colbert, J. W., et al. 2015, arXiv:1505.07843
- Mei et al. (2015) Mei, S., Scarlata, C., Pentericci, L., et al. 2015, ApJ, 804, 117
- Momcheva et al. (2016) Momcheva, I. G., Brammer, G. B., van Dokkum, P. G., et al. 2016, ApJS, 225, 27
- Muzzin et al. (2013) Muzzin, A., Wilson, G., Demarco, R., et al. 2013, ApJ, 767, 39
- Muzzin et al. (2014) Muzzin, A., van der Burg, R. F. J., McGee, S. L., et al. 2014, ApJ, 796, 65
- Nantais et al. (2016) Nantais, J. B., van der Burg, R. F. J., Lidman, C., et al. 2016, A&A, 592, A161
- Nantais et al. (2017) Nantais, J. B., Muzzin, A., van der Burg, R. F. J., et al. 2017, MNRAS, 465, L104
- Newman et al. (2014) Newman, A. B., Ellis, R. S., Andreon, S., et al. 2014, ApJ, 788, 51
- Noirot et al. (2016) Noirot, G., Vernet, J., De Breuck, C., et al. 2016, ApJ, 830, 90
- Osterbrock (1989) Osterbrock, D. E. (ed.) 1989, Astrophysics of Gaseous Nebulae and Active Galactic Nuclei (Mill Valley, CA: University Science Books)
- Osterbrock & Ferland (2006) Osterbrock, D. E., & Ferland, G. J. 2006, Astrophysics of gaseous nebulae and active galactic nuclei, 2nd. ed. by D.E. Osterbrock and G.J. Ferland. Sausalito, CA: University Science Books, 2006
- Papovich (2008) Papovich, C. 2008, ApJ, 676, 206
- Papovich et al. (2010) Papovich, C., Momcheva, I., Willmer, C. N. A., et al. 2010, ApJ, 716, 1503
- Paterno-Mahler et al. (2017) Paterno-Mahler, R., Blanton, E. L., Brodwin, M., et al. 2017, ApJ, 844, 78
- Reichardt et al. (2013) Reichardt, C. L., Stalder, B., Bleem, L. E., et al. 2013, ApJ, 763, 127
- Rettura et al. (2011) Rettura, A., Mei, S., Stanford, S. A., et al. 2011, ApJ, 732, 94
- Rettura et al. (2014) Rettura, A., Martinez-Manso, J., Stern, D., et al. 2014, ApJ, 797, 109
- Rettura et al. (2017) Rettura, A., Chary, R., Krick, J., & Ettori, S. 2017, arXiv:1705.00037
- Shapley et al. (2005) Shapley, A. E., Coil, A. L., Ma, C.-P., & Bundy, K. 2005, ApJ, 635, 1006
- Snyder et al. (2012) Snyder, G. F., Brodwin, M., Mancone, C. M., et al. 2012, ApJ, 756, 114
- Sobral et al. (2012) Sobral, D., Best, P. N., Matsuda, Y., et al. 2012, MNRAS, 420, 1926
- Stanford et al. (2012) Stanford, S. A., Brodwin, M., Gonzalez, A. H., et al. 2012, ApJ, 753, 164
- Stanford et al. (2014) Stanford, S. A., Gonzalez, A. H., Brodwin, M., et al. 2014, ApJS, 213, 25
- Stern et al. (2010) Stern, D., Jimenez, R., Verde, L., Kamionkowski, M., & Stanford, S. A. 2010, J. Cosmology Astropart. Phys, 2, 008
- Suzuki et al. (2012) Suzuki, N., Rubin, D., Lidman, C., et al. 2012, ApJ, 746, 85
- Suzuki et al. (2016) Suzuki, T. L., Kodama, T., Sobral, D., et al. 2016, MNRAS, 462, 181
- Tanaka et al. (2010) Tanaka, M., Finoguenov, A., & Ueda, Y. 2010, ApJ, 716, L152
- Tozzi et al. (2015) Tozzi, P., Santos, J. S., Jee, M. J., et al. 2015, ApJ, 799, 93
- Tran et al. (2010) Tran, K.-V. H., Papovich, C., Saintonge, A., et al. 2010, ApJ, 719, L126
- Whitaker et al. (2014) Whitaker, K. E., Franx, M., Leja, J., et al. 2014, ApJ, 795, 104
- Wylezalek et al. (2013) Wylezalek, D., Galametz, A., Stern, D., et al. 2013, ApJ, 769, 7
- Wylezalek et al. (2014) Wylezalek, D., Vernet, J., De Breuck, C., et al. 2014, ApJ, 786, 17
- Zeimann et al. (2012) Zeimann, G. R., Stanford, S. A., Brodwin, M., et al. 2012, ApJ, 756, 115