Infrared luminosity functions from the Chandra Deep Field South : the Spitzer view on the history of dusty star formation at 0 1 1
Abstract
We analyze a sample of 2 600 MIPS/Spitzer 24 m sources brighter than 80 Jy and located in the Chandra Deep Field South to characterize the evolution of the comoving infrared (IR) energy density of the Universe up to 1. Using published ancillary optical data we first obtain a nearly complete redshift determination for the 24 m objects associated with 24 mag counterparts at 1. These sources represent 55-60% of the total MIPS 24 m population with 80 Jy, the rest of the sample likely lying at higher redshifts. We then determine an estimate of their total IR luminosities using various libraries of IR spectral energy distributions. We find that the 24 m population at 0.5 1 is dominated by “Luminous Infrared Galaxies” (i.e., 1011 L⊙ LIR 1012 L⊙), the counterparts of which appear to be also luminous at optical wavelengths and tend to be more massive than the majority of optically-selected galaxies. A significant number of fainter sources (51010 L⊙ LIR 1011 L⊙) are also detected at similar distances. We finally derive 15 m and total IR luminosity functions (LFs) up to 1. In agreement with the previous results from and SCUBA and as expected from the MIPS source number counts, we find very strong evolution of the contribution of the IR-selected population with lookback time. Pure evolution in density is firmly excluded by the data, but we find considerable degeneracy between strict evolution in luminosity and a combination of increases in both density and luminosity ( (1+), (1+)). A significant steepening of the faint end slope of the IR luminosity function is also unlikely, as it would overproduce the faint 24 m source number counts. Our results imply that the comoving IR energy density of the Universe evolves as (1+)3.9±0.4 up to 1 and that galaxies luminous in the infrared (i.e., LIR 1011 L⊙) are responsible for 7015% of this energy density at 1. Taking into account the contribution of the UV luminosity evolving as (1+)∼2.5, we infer that these IR-luminous sources dominate the star-forming activity beyond 0.7. The uncertainties affecting these conclusions are largely dominated by the errors in the -corrections used to convert 24 m fluxes into luminosities.
Subject headings:
galaxies: high-redshift — infrared: galaxies — cosmology: observations1. Introduction
The successful launch of the Spitzer Space Telescope (Werner et al. 2004) recently opened a new exciting window on the deep infrared (IR) Universe. Spitzer operates between 3.6 and 160 m with unprecedented sensitivity and better spatial resolution compared to previous infrared satellites (e.g., IRAS, ISO). Directly probing the dust emission or the redshifted signature of distant stellar populations, its first extragalactic surveys have already unveiled a huge number of faint and high redshift sources (see for instance Fazio et al. 2004; Eisenhardt et al. 2004; Papovich et al. 2004; Marleau et al. 2004; Lonsdale et al. 2004; Chary et al. 2004; Yan et al. 2004; Dole et al. 2004a in the “Spitzer Special Edition – volume 154” of the ApJ Supplement). Spitzer therefore provides new opportunities to determine the IR properties of galaxies in the general context of cosmic evolution.
High redshift sources detected by Spitzer in the mid- and far-infrared wavelength range (i.e., 8 m 1000 m) are characterized by intrinsically very high luminosities (Egami et al. 2004; Frayer et al. 2004; Ivison et al. 2004; Le Floc’h et al. 2004). They appear as the distant analogs of the local Luminous and Ultra-Luminous InfraRed Galaxies (respectively LIRGs: L LL L⊙, and ULIRGs: L L⊙, see the review by Sanders & Mirabel 1996). Such infrared-luminous sources111We adopt in this paper the more general expression of “infrared-luminous galaxies” to denote sources characterized by L L⊙. emit the bulk of their energy as dust-reprocessed thermal IR emission powered by embedded star formation or by accreted material surrounding supermassive black holes. They were first discovered in the nearby Universe with ground-based observations (Rieke & Low 1972). After being systematically catalogued by IRAS (Soifer et al. 1987), they were found to be locally very rare and to only account for 5% of the total infrared energy emitted by galaxies at low redshift (Soifer & Neugebauer 1991; Kim & Sanders 1998). Nevertheless, there is clear evidence that they were significantly more numerous earlier in cosmic history. In the past few years, deep observations performed in the infrared by ISO and in the submillimeter by the SCUBA camera have revealed strong evolution of these luminous sources with lookback time (Smail et al. 1997; Blain et al. 1999a; Elbaz et al. 1999; Serjeant et al. 2001; Dole et al. 2001), that is also apparent in the population of radio sources at Jy flux levels (e.g., Cowie et al. 2004). Characterized by a high redshift space density several orders of magnitude larger than predicted by non-evolving models, infrared luminous galaxies contribute a significant fraction of the distant starbursting activity and play a crucial role in the formation of massive spheroidals throughout the cosmic ages (e.g., Flores et al. 1999; Gispert et al. 2000; Franceschini et al. 2001; Chary & Elbaz 2001; Blain et al. 2002; Chapman et al. 2003a).
This strong evolution of infrared-selected sources has also been clearly seen by Spitzer (Chary et al. 2004, Papovich et al. 2004, hereafter P04; Marleau et al. 2004; Dole et al. 2004a). One of the most interesting results of the Spitzer deep surveys is the behavior of the differential number counts at 24 m. These counts turn over at fluxes lower than had been expected based on “pre-launch” models. Lagache et al. (2004) suggest that these counts reveal even more luminous galaxies 1.5 than expected, though one could argue that they can also originate from a steeper faint-end slope of the infrared luminosity function at more modest redshifts. To better understand the nature of the sources responsible for this turn-over and also more generally the role of infrared galaxies in cosmic evolution, we examine in this paper the evolution of the comoving IR energy density with redshift up to 1. This study is based on a sample of 24 m-selected Spitzer sources within the Chandra Deep Field South and characterized by redshifts taken from the literature. A companion publication by Bell et al. (2005) explores in more detail the role played by these sources in the decline of the star formation history since 0.7.
The paper is organized as follows. In Sect. 2 we describe the infrared and optical data used in this study, while Sect. 3 outlines the results of the cross-correlations that we performed among catalogs to determine the redshifts of infrared-selected sources. In Sect. 4 we study the contribution of these infrared galaxies to the total counts at 24 m for various redshift limits and present a comparison with the predictions from various recent models of IR galaxy evolution. Using different libraries of templates published in the literature, we further derive in Sect. 5 an estimate of the total infrared luminosities of these sources based on our mid-infrared observations. In Sect. 6 we analyze a few properties of their optical counterparts and we finally explore in Sect. 7 how the evolution of the infrared luminosity function at in the CDFS can be constrained using our data. Interpretations are discussed in Sect. 8, and we give our conclusions in Sect. 9. Throughout this work, we assume a CDM cosmology with H0 = 70 km s-1 Mpc-1, = 0.3 and (Spergel et al. 2003). Unless explicitly stated, magnitudes are quoted within the Vega system. We also adopt the universal Initial Mass Function from Salpeter (1955).
2. The data
2.1. 24 m imaging
The region of the Chandra Deep Field South (hereafter CDFS, , , J2000) was observed with the MIPS instrument (Rieke et al. 2004) on-board the Spitzer Space Telescope in January 2004 as part of the MIPS Guaranteed Time Observing program. These observations were performed over a total field of 1.450.4 = 0.6 deg2 with the so-called “Slow Scan” technique, a MIPS observing mode that allows the coverage of large sky areas with high efficiency. The detector at 24 m uses a 2.45″ pixel size array of 128128 elements and the image at this wavelength is characterized by a Point Spread Function (PSF) with a Full-Width at Half Maximum (FWHM) of 6″. The effective integration time per sky pixel was 1380 s. Data reduction was carried out using the MIPS Data Analysis Tool (DAT, Gordon et al. 2005). The mosaic finally obtained has a pixel scale of half that of the physical detector pixel. A color version of this 24 m map can be seen in the publication by Rigby et al. (2004). A sub-region of this field is also illustrated in Figure 1.
![[Uncaptioned image]](/html/astro-ph/0506462/assets/x1.png)
A sub-image of the CDFS 24 m observations obtained with MIPS, centered at and (J2000). The fields of view respectively covered by COMBO-17 (dashed line), VVDS (solid line) and GOODS (dotted line) are also indicated (see text for details). The 24 m sources considered in this paper are located within the 775 arcmin2 of overlap between MIPS and COMBO-17.
Since most sources are unresolved in our data, extraction and photometry were performed using the PSF fitting technique of the DAOPHOT software (Stetson 1987). An empirical point spread function was constructed from the brightest objects found in our mosaic, and it was subsequently fitted to all the sources detected in the map. Allowing for multiple-match fitting to deal with blended cases, we derived the flux density of each source from the scaled fitted PSF and finally applied a slight correction to account for the finite size of the modeled point spread function. We also performed extensive simulations adding and recovering artificial sources in the data, which allowed us to derive an 80% completeness limit at 83 Jy. Contamination by false sources appears in our detection catalog at fluxes fainter than 90 Jy. In the full sample of objects brighter than the 80% completeness limit, we estimate such a contamination to be around 0.6%. A more detailed description of our technique is presented by Papovich et al. (2004) who also discuss the evolution of the completeness limit and the false source fraction as a function of the flux at 24 m (see their figure 1).
Distortion effects are efficiently removed by the DAT. The final astrometric uncertainty of the mosaics produced by the pipeline therefore originates from the pointing reconstruction. To quantify this uncertainty in our data, we cross-identified the brightest sources detected at 24 m with the Two Micron All Sky Survey (2MASS) catalog (Jarrett et al. 2000). A systematic offset of 0.6″ was observed in the scan direction222This offset seems to be due to systematics related to the position of the MIPS scan mirror. It affects the headers of the data obtained before May 2004 (Spitzer Science Center, priv. communication). and subsequently removed for our source catalog to match the 2MASS coordinates. We estimate that the remaining scatter relative to 2MASS is better than 0.3 rms.
2.2. Optical-spectroscopic redshifts
To derive the redshifts of the MIPS 24 m–selected sources, we retrieved from the literature publicly available catalogs of optical spectroscopic surveys in the CDFS such as the “VIMOS VLT Deep Survey”333http://cencosw.oamp.fr/EN/index.en.html (hereafter VVDS, Le Fèvre et al. 2004), the ESO/FORS2 survey performed by the GOODS Legacy team444http://www.eso.org/science/goods/spectroscopy/products.html (Vanzella et al. 2005), and the follow-up of X-ray sources described by Szokoly et al. (2004)555http://www.mpe.mpg.de/ mainieri/cdfs_pub/. The VVDS consortium has released redshifts for 1599 sources located in an area of 2121.6 arcmin2 with an overall redshift measurement completeness of 88% down to . For each identification, a flag indicates the reliability level of the corresponding measurement; 1457 sources in this survey are classified with more than 75% confidence in the redshift determination. The GOODS catalog provides 234 redshifts obtained within a slightly smaller area of the CDFS (1015 arcmin2). They are also tentatively classified into three categories depending on their reliability, and 150 sources in this catalog are thought to have a secure redshift measurement. Finally, Szokoly et al. (2004) present a spectroscopic follow-up of Chandra X-ray sources, with redshifts obtained for 168 objects. Among those, 126 are considered to have unambiguous identifications.
We combined the catalogs of these three optical surveys to create a single list of 1 941 spectroscopic redshifts with their corresponding flags. Because of some overlap between the different observed regions, several redshifts were sometimes assigned to a given single source. In case of discrepant estimates, we kept the one flagged with the highest confidence in the redshift measurement.
The MIPS image at 24 m entirely covers the areas observed by these spectroscopic surveys. The VVDS and GOODS fields of view can be seen in Figure 1.
2.3. Optical-photometric redshifts
In addition to the spectroscopic redshifts previously described, we also made extensive use of the photometric redshifts from the COMBO-17 survey (“Classifying Objects by Medium-Band Observations in 17 filters”, Wolf et al. 2004). COMBO-17 observed a 31.530 arcmin2 region of the CDFS (see Fig. 1) through a set of 5 broad-band and 12 narrow-band filters, which allowed the determination of accurate spectral energy distributions (SEDs) and absolute magnitudes for several thousand optically-selected sources (see also Wolf et al. 2003). Each SED was analyzed using a library of representative templates for various spectral types, and a redshift probability distribution was subsequently derived for each source. For a total of 24 217 objects, these distributions were successfully fitted with Gaussian-like functions, the mean and the variance of which led to well-constrained estimates of photometric redshifts with corresponding uncertainties.
These redshifts are accurate to 1% in for galaxies with 21 mag, and they are mostly reliable (i.e., ) for all sources at 1.2 and brighter than 24 mag (11 422 objects). The yield of high weight redshifts drops steeply for 1.2 or 24 mag, so we did not consider such faint or distant objects. Another redshift estimate is also provided for nearly every detection of the survey (62 366 sources) based on the peak of the computed probability distribution. Because it is less reliable, it should be used with caution (Wolf et al. 2004) and was therefore also not considered in this work. About 85% of the region covered by COMBO-17 overlaps with our MIPS 24 m mosaic and the spectroscopic optical surveys. This overlapping area has a total field of view of 775 arcmin2 (see Fig. 1).
3. Optically-selected redshifts of MIPS sources
3.1. Cross-correlation between the infrared and the optical data
From the full MIPS catalog we first selected the 24 m sources located in the common area covered by Spitzer and the aforementioned optical redshift surveys (i.e., 775 arcmin2). In this region of overlap we detected 5 589 objects at 24 m, with 3 616 of those having a flux greater than the 80% completeness limit of 83 Jy.
We cross-correlated this 24 m sub-sample with the optical data using a tolerance radius of 2″ for matching sources. This choice was first motivated by the rather large FWHM of the MIPS 24 m PSF (6″) compared to that typically seen in optical images. As already observed in local interacting systems (e.g., Le Floc’h et al. 2002; Charmandaris et al. 2004; Gallais et al. 2004), it also accounts for the physical shift that could be present between the location of the infrared emission and the brightest optical component of distant mergers (2″ corresponds to a linear projection of 15 kpc on the sky at 1). It is yet reasonably small given the position accuracy of the source centroids at 24 m (better than 0.5″ rms). Taking a larger value also increases the risk of associating MIPS sources with wrong optical counterparts in the case of multiple matches. When a double match was found, we selected the closest object. We ignored the cases where three or more optical sources could be associated with a given 24 m detection.
We first correlated the 24 m source catalog with the list of spectroscopic redshifts. A total of 543 matches was found in this cross-identification, of which 465 objects are flagged to have a high-confidence redshift measurement. The fraction of multiple matches was only 1%. At this stage, we only kept the identifications with a secure redshift determination. Those 465 sources represent only 8% of the infrared-selected sub-sample, which emphasizes the critical need for using photometric redshifts. We thus cross-correlated the rest of the data with the catalog of COMBO-17. We found 2 170 MIPS sources (1 987 single and 183 double matches) identified with a photometric redshift below = 1.2 and an optical counterpart brighter than = 24 mag. For 9 objects selected at 24 m (less than 0.5% of the sample) three possible matches were found within 2″ around the MIPS source. They were not further considered. In total, we assembled a catalog of 2 635 MIPS sources (of which 1 962 are brighter than the 80% completeness limit of the 24 m survey) associated either with a reliable spectroscopic redshift or a clearly-constrained photometric redshift. Virtually all are at 1.2, since the yield of values at higher redshift is very low with both spectroscopy (due to the “redshift desert”) and COMBO-17. We also identified another set of 1 681 MIPS sources with an optical counterpart in the COMBO-17 catalog but without any reliable redshift (271 of them have 83 Jy and are brighter than = 24 mag).
3.2. Redshift uncertainties
Since only a very small fraction of the MIPS sources have been identified with secure spectroscopic redshifts, it is worth looking at the typical uncertainties of the other photometric redshifts characterizing the 24 m-selected sources. The accuracy of the COMBO-17 classification decreases for sources fainter than 22 mag. This may have non-negligible effects when estimating e.g., source densities as a function of lookback time, especially when the uncertainties become comparable to the redshift bins in which galaxy properties are averaged. Given that the 24 m sample is by definition selected through the emission by warm dust, one may furthermore question whether the implied extinction at optical wavelengths can lead to a more significant redshift mis-classification in the specific case of the most luminous (i.e., dust-obscured) MIPS sources.
In Figures 2a & 2b we compare high-confidence spectroscopic redshifts of optically-selected field galaxies and MIPS 24 m detections with their photometric redshifts estimated by COMBO-17. We see that the photometric redshift errors are small (i.e., - 0.1) and they are not statistically larger in the case of the MIPS sources. The latter can be explained as follows. Mid-infrared space-borne and ground-based observations of local LIRGs/ULIRGs reveal that the dust responsible for the bulk of the IR luminosity of those objects originates from very compact regions (Soifer et al. 2000, 2001; Charmandaris et al. 2002). The effect of extinction in these dusty systems is therefore very localized and is usually not apparent in the global spectral energy distribution of their optical counterparts (Sanders & Mirabel 1996). A similar situation likely pertains at higher redshifts up to at least 1. At 0.7 for instance, ISOCAM 15 m and MIPS 24 m-selected galaxies are indeed associated with luminous optical sources characterized by a wide range of optical colors and morphologies (Flores et al. 1999; Rigopoulou et al. 2002; Franceschini et al. 2003, Bell et al. 2005; see also Sect. 6). Only a careful approach based on medium-resolution spectroscopy can distinguish them from the optically-selected galaxy population (e.g., Flores et al. 2004). It is therefore unlikely to encounter any significant increase of redshift mis-classification as a function of infrared luminosity (at least up to 1).

Finally, Fig. 2c shows the photometric redshift uncertainties provided by the COMBO-17 catalog as a function of the observed -band magnitude for the MIPS sources considered in this paper. These errors were determined as the square root of the variance characterizing the redshift probability distribution of each object. In agreement with the comparison we made from Fig. 2a using the spectroscopic sub-sample, we see that sources brighter than 22 mag have a very accurate redshift estimate (i.e., 0.04) and most of the sample (88%) is characterized by a redshift accuracy better than 0.1. The average uncertainty is only =0.07 with a dispersion =0.05 for sources with 22 mag 24 mag. It rises to =0.09 (with a similar dispersion) if we only consider objects fainter than 23 mag. Looking at the evolution of the MIPS sources averaged per redshift bin of 0.2 should lead therefore to rather robust results.
3.3. Completeness of the sample
The biggest concern affecting our results is the incompleteness of the redshift determination for the most distant sources considered in this paper. As previously mentioned, 3 616 objects were detected by MIPS above the 80% completeness limit in the region overlapping with the optical surveys of the CDFS, while our final catalog only contains 1 962 sources with 83 Jy and a redshift identification (i.e., 55%). To better assess this effect, we plot in Figure 3.a the fraction of MIPS sources characterized either by a spectroscopic or a photometric redshift as a function of the observed 24 m flux (solid line) as well as the fraction of their identification with an optical counterpart for various magnitude limits (shaded regions). At the highest fluxes (i.e., 1mJy), the incompleteness of the sample is mostly due to a few objects detected close to very bright stars blooming the optical image and where a reliable identification of the counterpart cannot be obtained. These cases should not introduce any bias in our results. Below 1 mJy, the drop in the redshift determination completeness corresponds to sources fainter than 23.5 mag (see also Fig. 3.b). Above the 80% completeness limit of our MIPS data (i.e., 83 Jy), we see for instance that a significant fraction ( 25%) of the MIPS objects with no redshift are associated with 24 mag 25.5 mag sources, while 20% of them have counterparts fainter than 25.5 mag. This also indicates that a complete study of the faint MIPS population will likely require an extensive use of photometric redshift techniques.
The consequence of this limitation can be seen by comparing the redshift determination completeness as a function of the -band magnitude with the distribution of the -band magnitudes of the MIPS sources for different redshift limits. This is shown in Fig. 3.b, while Fig. 3.c represents the absolute -band magnitudes of the MIPS sources as a function of redsfhit and derived from COMBO-17. We see that the identification should be nearly complete up to 0.8, but we start missing 24 m objects located at higher redshift and associated with optical counterparts fainter than 23.5–24 mag. These mis-identifications likely induce a biais against the faintest sources detected at 24 m. In Sect. 6 we will establish a correlation between the optical and the infrared luminosities of galaxies in our sample, and we will use such relation in Sect. 7 to quantify how this bias affects the estimates of luminosity functions (see also the Appendix for further details characterizing these faint 24 m sources). However, given the importance of the cosmic variance arising from the variations of large scale structures in the CDFS (see Sect. 3.4), and taking into account the errors in the -corrections used to derive IR luminosities (see Sect. 5), we infer that the possible missing redshift determinations should not dominate the absolute uncertainty in the source density estimate up to 1.
![[Uncaptioned image]](/html/astro-ph/0506462/assets/x3.png)
a) Fraction of MIPS sources identified with a spectroscopic or a photometric redshift as a function of the observed flux at 24 m (solid line). We also indicate the fraction of MIPS sources with an optical counterpart detected in the -band for various magnitude limits (shaded regions). The vertical dotted line corresponds to the 80% completeness limit of the 24 m observations. b) Fraction of 24 m source optical counterparts identified with a redshift, as a function of the -band magnitude (solid line). Shaded regions show the -band magnitude histograms (all scaled with an arbitrary constant factor) of the MIPS sources up to various redshift limits. The drop in the redshift identification is clearly apparent at 23.5-24 mag. The sample should be complete up to 0.8. c) Absolute -band magnitudes of the MIPS sources as a function of redshift.
Other arguments also suggest that the bulk of the MIPS sources for which we could not identify any reliable redshift should be indeed located at 1 and will not affect this study. First we will show in the following sections that infrared luminous galaxies are associated with optical counterparts at the bright end of the luminosity function in the visible. Luminous optical sources with L L but fainter than 23.5–24 mag should lie at 1 (Benítez 2000). Moreover, preliminary results from reveal that a significant fraction of the MIPS sources are located at such large redshifts (Chary et al. 2004; Egami et al. 2004; Le Floc’h et al. 2004; Lagache et al. 2004). Finally, although they are not fully reliable, the COMBO-17 redshift estimates based on the peak of the redshift probability distributions indicate that the majority of the sources that we have not identified should be at 1.
3.4. Redshift distribution
Figure 4 shows the distribution of the redshifts derived for our sample of infrared sources (bottom panel, solid line). It is compared to the redshift distributions of the VVDS (dotted line) and the COMBO-17 objects with (dashed line). As previously discussed, the redshift identification of the MIPS sources is complete only up to 0.8, and the distribution beyond this limit should thus be considered as a lower limit estimate.
![[Uncaptioned image]](/html/astro-ph/0506462/assets/x4.png)
Bottom: The redshift distribution of 24 m-selected sources over a 775 arcmin2 region within the CDFS (solid line), compared to the distributions of photometric redshifts for 24 mag sources in the COMBO-17 catalog (dashed-line, scaled down by a factor of 2.5) and spectroscopic redshifts for 24 mag sources in the VVDS survey (dotted line). The contribution of MIPS sources with spectroscopic redshifts is also indicated (dash-dotted line). Note the prominent overdensity at 0.65, clearly seen in all the distributions. Source densities at 0.8 should be considered as lower limit estimates due to the incompleteness of the redshift identification. Top: The fractions of 24 mag sources detected at 24 m, estimated as a function of redshift in the whole population of COMBO-17 (dashed line) and restricted to the objects with MB –16 (solid line).
We note that the three distributions (i.e., MIPS, VVDS, COMBO-17) are more or less similar from 0 to 1. Up to this redshift limit, MIPS is indeed sensitive to sources luminous in the infrared but also to more normal galaxies (see Sect. 5) such as those detected at optical wavelengths and driving the VVDS and COMBO-17 redshift distributions. Furthermore, we note a significant number of objects around 0.65, apparent in all the distributions. This originates from an overdensity characteristic of the CDFS near this redshift (e.g., Wolf et al. 2004) and it is likely related to cosmic variance and large-scale structure effects (Somerville et al. 2004). It may constitute a non negligible source of uncertainty in our density estimates. A comparison between the integrated -band luminosity densities as a function of redshift from galaxies of the blue sequence (Bell, private communication, see Willmer et al., in prep., for the evolution of the blue sequence luminosity function) in the CDFS and averaged over the three fields of COMBO-17 (Wolf et al. 2003) shows that the CDFS is most often underdense by 50% at 0 1, except indeed at 0.650.1 where the overdensity reaches 20%. Given the similarity between the redshift distributions of the optically and infrared selected sources, and since most of MIPS sources at 0.7 appear to be associated with large spirals dominating the -band emission (Bell et al. 2005, see also Fig. 10b), this cosmic variance characterized from the -band luminosity density is likely affecting also the population of galaxies detected at 24 m. Therefore the apparent peak at 0.65 in the MIPS redshift distribution is probably only related to the structure of the CDFS and it should not be a characteristic of the general population of infrared-selected sources.
In spite of the similarities that we observe between the redshift distributions in the visible and the infrared, a more critical look reveals that the fraction of optical sources brighter than MB = –16 and detected at 24 m decreases from = 0 to 0.4 and then increases with redshift up to 1 (see Fig.4., top panel). Interpreting this trend is not straightforward, but it could reflect the difference in the -correction effects observed at optical and infrared wavelengths. As we will see in Sect. 5 (see Figs. 7 & 9) the effective sensitivity of the deep 24 m observations drops rapidly from = 0 to 0.5, which explains the sharp decrease of relative 24 m detections in this redshift range. Then it remains roughly constant at 0.5 0.9 because of strong emission features present at 11.3 and 12.7 m in galaxy spectra progressively entering the 24 m filter at these redshifts. Since the sensitivity of the optical data constantly drops with distance, an increase in the relative number of 24 m sources detected beyond 0.5 in the visible might thus result. Note that it may also reflect the stronger evolution of IR sources with lookback time, since IR-luminous phases in galaxies were more common in the past (e.g., Hammer et al. 2005). The lack of apparent decline moreover suggests that the intrinsic peak of the MIPS population redshift distribution must lie at least beyond 0.8.
Finally, another overdensity lies at 0.15. It represents a rather small fraction of our detections at 24 m (i.e., 4%). Since we will only consider sources at 0.3 when building the luminosity functions in Sect. 7, it will not affect our final results on the evolution of the IR galaxy population.
4. Exploring the origin of the break in the MIPS 24 m number counts
4.1. Cumulative differential counts as a function of redshift
Using our matched catalog of 24 m-selected objects with redshifts, we now explore for various redshift slices the contribution of these MIPS sources to the total differential number counts. Our goal is a better understanding of the origin of the bump detected at 0.2–0.4 mJy (P04, Marleau et al. 2004). Figure 5 illustrates these cumulative source counts for redshift limits of 0.3, 0.5, 0.8, 1.0 and 1.2 along with the global contribution of the MIPS sources identified with an optical counterpart in the full COMBO-17 catalog (i.e., 25.5 mag). The distributions for redshift limits = 1 and = 1.2 are likely underestimated due to the incompleteness of the sample as showed in Sect. 3.3. However, uncertainties due to cosmic variance likely dominate here ( 0.10-0.15 dex based on the ratio between the -band luminosity densities of the CDFS and averaged within the other fields of COMBO-17). For comparison, we also represent the total 24 m number counts derived from our sub-sample as well as those obtained by Papovich et al. (2004), who averaged the 24 m source population over 10 deg2 in several cosmological fields. For consistency with our data, these counts from P04 were not corrected for incompleteness of the MIPS detections at faint fluxes.
![[Uncaptioned image]](/html/astro-ph/0506462/assets/x5.png)
Cumulative differential number counts observed at 24 m as a function of redshift (shaded regions). Distributions at 0.8 should be considered as lower limit estimates due to the incompleteness of the redshift identification. The striped area represents the contribution of all 24 m sources identified with an optical counterpart down to 25.5 mag. The total differential counts derived from our sub-sample are illustrated by the black solid line, while those determined by Papovich et al. (2004) are represented by the dashed line and the vertical error bars. Counts are normalized to the Euclidian slope.
We note that the 24 m number counts derived in the CDFS show a roughly good agreement with those obtained by P04 below 0.2 mJy. However, the density of 24 m CDFS sources at higher fluxes appears to be slightly lower (20%), and consequently the peak of the differential number counts seems to occur at fainter levels. As previously seen in Sect. 3.4., such variations are easily understood in terms of cosmic variance and the smaller number of infrared-bright sources in the CDFS is likely related to the underdensity observed in the -band at 1.
At critical fluxes 0.2-0.4 mJy where the 24 m differential counts present a turn-over, sources lying at 1 contribute 55% to the whole sample. Even though this fraction could be slightly higher due to the possible incompleteness of our redshift identification at 0.8 1, a significant part of the MIPS population should therefore be located at higher redshifts (i.e., 1). As already derived from Fig. 3, it can also be noted that 20% of the 24 m sources have optical counterparts fainter than 25.5 mag.
4.2. Comparison with model predictions
In Figure 6 we compare the differential counts in four redshift slices between = 0 and = 1.2 with the predictions from the models of IR galaxy evolution proposed by Lagache et al. (2004), Chary et al. (2004), Gruppioni et al. (2005 , see also Pozzi et al. 2004) and Pearson (2005). These models are all tied to the local IR galaxy population but differ in (i) the description of its components and their global properties (i.e., SEDs, luminosity functions per object type) and (ii) the assumptions and parameterization used to infer the backward evolution of IR sources. They provide a reasonably good fit to the total 24 m number counts. They also reproduce a variety of other observables such as the IR background, the counts and/or the redshift distributions of the and SCUBA galaxy populations.
![[Uncaptioned image]](/html/astro-ph/0506462/assets/x6.png)
Differential 24 m number counts produced by the MIPS sources in four redshift slices between = 0 and = 1.2 as indicated within each panel (shaded regions). They are compared to the predictions by Lagache et al. (2004 , dashed lines), Gruppioni et al. (2005 , dotted lines), Chary et al. (2004 , dash-dotted lines) and Pearson (2005 , triple dot-dashed line) for similar redshift ranges. The total counts derived from our sample are shown in each panel by the black solid line. The vertical bar in the upper panels represents the typical uncertainty due to the effect of large scale structures. The counts at 0.8 1.0 and 1.0 1.2 (lower panels) only show a lower limit given the incompleteness of the redshift identification in our sample at 0.8.
Looking at their predictions for the 24 m number counts within the redshift slices considered in this Fig. 6, we see that the models from Chary et al. (2004), Gruppioni et al. (2005) and Pearson (2005) may underestimate the contribution of faint sources at 0 0.8 but predict too many bright objects at 0.5. Lagache et al. (2004), on the other hand, closely follow the observations at 0.5 but might globally underestimate the source density at 0.5 0.8. All these models finally seem to overpredict the contribution of bright galaxies at 0.8. However we also note that these comparisons could be undermined given not only cosmic variance effects and the global underdensity of the CDFS between = 0 and 1 but also the incompleteness of our redshift identification at 0.8.
Comparisons with other models in the literature such as those published before the launch of lead to larger discrepancies. These models tend to predict the characteristic turn-over of the differential 24 m number counts at much higher fluxes than where it has been observed (see for instance Figure 3 of Papovich et al. 2004).
5. Total infrared luminosities
5.1. Estimating the total IR luminosity of galaxies from their mid-IR emission
The rest-frame mid-infrared (MIR) regime (i.e., 8 m 40 m) is considered to be a good tracer of the bolometric luminosity of galaxies. Using the 12 m IRAS galaxy sample, Spinoglio et al. (1995) first showed that the relative dust content of galaxies balances their total energetic output between the optical and the far-infrared, leaving a “pivot point” in the MIR where the specific luminosity linearly scales with the bolometric one. More recently, a similar conclusion has been reached by Chary & Elbaz (2001) who found a tight correlation between the 15 m and the total infrared luminosities for a sample of normal and luminous sources studied with ISOCAM. Based on these considerations and taking into account the general IR/submm color-color and/or luminosity-color correlations observed in the local Universe, several authors have built libraries of luminosity- or color-dependent galaxy templates, which can then be used to estimate the total infrared luminosity of galaxies from their 24 m flux densities (Dale et al. 2001; Chary & Elbaz 2001; Dale & Helou 2002; Lagache et al. 2003; Chanial 2003).
Figure 7 shows the total infrared luminosity that can be detected in our survey down to a 24 m sensitivity limit of 0.08 mJy, as a function of redshift and computed with the aforementioned libraries. Provided these templates are still representative of high redshift sources, we see that MIPS can easily detect normal starbursts (i.e., LIR 1011 L⊙) up to 1, and LIRGs up to 1.5. Note that such limits only characterize a pure selection of sources at 24 m, and the use of a priori information from detections at other wavelengths can allow the identification of MIPS sources with similar infrared luminosities at even higher redshift (see e.g., Le Floc’h et al. 2004). The 80% completeness level roughly corresponds to a 5 detection in the MIPS data (Dole et al. 2004b), and the quoted 0.08 mJy limit is therefore rather conservative.
Figure 7 also shows the dispersion between the predictions (and therefore the templates) of the various libraries (see also Papovich & Bell 2002). For a given observable (e.g., infrared luminosity, color, …) these libraries assign a unique SED that slightly varies from one set of templates to another. Such variations reflect an intrinsic dispersion of the different correlations observed between the MIR/FIR/submm properties of galaxies that is usually not taken into account (but see Chapman et al. 2003b for the use of bi-variate luminosity functions addressing this issue). As an example, we compare in Figure 8 the observed relation between LIR and the monochromatic 15 m luminosity L15666We define the monochromatic luminosity as Lν = , with the monochromatic flux of the galaxy expressed in W Hz-1. for a sample of local galaxies studied with and IRAS (Chary & Elbaz 2001) with the predictions of the template libraries considered in Fig. 7. We see that the dispersion can easily reach 0.2 dex.
![[Uncaptioned image]](/html/astro-ph/0506462/assets/x7.png)
Detection limits in terms of total infrared luminosity, derived for two different MIPS 24 m sensitivities and assuming the template libraries of Lagache et al. (2004 , thick solid line), Lagache et al. (2003 , thin solid line), Dale et al. (2001 , dotted line), Chary & Elbaz (2001 , dashed line) and Chanial (2003 , dash-dotted line) as a function of redshift. The lower (respectively, upper) set of curves corresponds to a flux limit of 0.08 mJy (0.3 mJy) typical of the MIPS deep (shallow) surveys.
To explain this dispersion, one may note that in the local Universe the mid-infrared SEDs of starburst sources with comparable bolometric luminosities are subject to significant variations (e.g., Armus et al. 2004). In the rest-frame wavelength range probed by the MIPS 24 m filter for high redshift galaxies, the MIR emission results from the combination of prominent broad-band features mostly observed between 3 and 14 m and usually denoted the Polycyclic Aromatic Hydrocarbons bands (PAHs), superimposed on a rising continuum of Very Small Grains (VSGs) stochastically heated by the young star radiation field (see e.g., Laurent et al. 2000 and references therein). PAHs present an amazingly universal SED signature as a global set of features when integrated over normal spiral galaxies (Roussel et al. 2001, but see Smith et al. 2004 for smaller scale variations and a newly-discovered 17.1 m PAH in NGC 7331). However, they are not detected in low metallicity sources (Thuan et al. 1999; Houck et al. 2004a ; Engelbracht et al. 2005, submitted). They are also believed to be destroyed within intense radiation fields as in the vicinity of active galactic nuclei (AGN, e.g., Le Floc’h et al. 2001). Finally, the temperature of the VSGs as well as the silicate absorptions at 9.7 m and 18 m represent other important factors shaping the underlying continuum of the global mid-infrared SED of galaxies. All of these variations can therefore bring significant uncertainties in relating the MIR emission to the full infrared range of galaxy SEDs.
![[Uncaptioned image]](/html/astro-ph/0506462/assets/x8.png)
Ratio between the total IR and the monochromatic 15 m luminosities as a function of LIR predicted by the SED libraries considered in Fig. 7 (similar style coding). The grey area represents the relation (mean value with 1 boundaries) derived by Chary & Elbaz (2001) for galaxies that were observed with ISO and IRAS.
Furthermore, one may question whether these templates derived from the properties of local galaxies are trully representative of higher redshift sources. Infrared luminous galaxies detected by ISOCAM at a median redshift of 0.7 are characterized by roughly half-solar metallicites (Liang et al. 2004), which could point to IR SEDs slightly different from those of local LIRGs. However, PAHs are still detected at this metallicity range in nearby starbursts (Engelbracht et al. 2005, submitted). Moreover, the 24/15 m flux ratios observed in 0.7 ISOCAM sources still argue for the presence of significant PAHs in their SEDs (Elbaz et al. 2005), and prominent PAH features were also recently observed with the InfraRed Spectrograph on Spitzer (IRS, Houck et al. 2004b) at even higher redshifts (i.e., 1.7 2.8, Houck et al. 2005). We also note that the MIR/radio relation expected from the MIR/FIR and FIR/radio correlations observed locally (Condon 1992; Chary & Elbaz 2001) appears to be still valid in the more distant Universe (e.g., Elbaz et al. 2002; Appleton et al. 2004). These results give reasonable confidence in using local galaxy templates to estimate the infrared luminosities of distant IR sources.
5.2. The total infrared luminosity of the MIPS sources at 1
For each library of SEDs previously discussed, we computed the redshift-dependent relations between LIR and the flux density observed at 24 m. For every source of the sample, an estimate of the total IR luminosity was thus obtained from each set of templates. These measures were weigthed based on the accuracy of their associated library to reproduce the observed relation between LIR and L15 at the derived luminosity (see Fig. 8). They were combined to provide the final infrared luminosity of the object, and their associated rms was taken as an estimate of the corresponding uncertainty.
As noted by Chapman et al. (2003b) there might also be a bias of MIPS 24 m sources toward luminous galaxies with hot dust temperatures compared to the whole population of IR-luminous objects at high redshift. This could result in additional systematics affecting these luminosity estimates, and we have not formally considered this effect here. We believe however that the uncertainties due to the SED libraries dominate the systematics in our study.
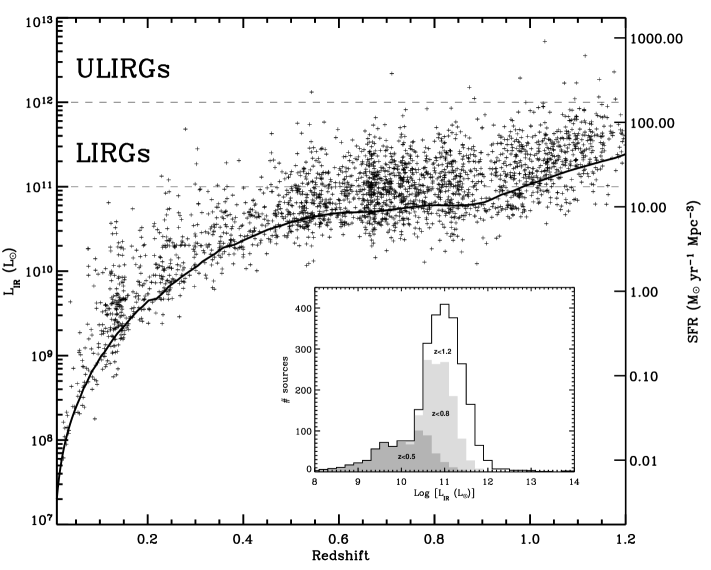
The IR luminosities are displayed as a function of redshift in Figure 9. Based on the previous arguments we estimate that they are accurate within a factor of 2–3 up to 1. We see that most sources detected below 0.5 are only modest infrared emitters (i.e., LIR 1011 L⊙), and the number of infrared-luminous galaxies found at these low redshifts is quite low. At larger distances however, LIRGs represent a significant fraction of the MIPS galaxy sample in terms of detection number. This large population of LIRGs at 0.5 1.0 has also been observed in various surveys performed at 15 m with ISOCAM (e.g., Aussel et al. 1999; Flores et al. 1999; Elbaz et al. 2002). We finally note that the most luminous galaxies (i.e., LIR 1012 L⊙) are still pretty rare, but there is a clear hint for an increase of the number of the brightest LIRGs (51011 L⊙ LIR 1012 L⊙) at 1, which could point to a large population of ULIRGs at even larger distances (i.e., 1.5, Blain et al. 1999a; Chapman et al. 2003a). These detection rates are obviously contingent on the comoving volume sampled at each redshift though. This general issue will thus be addressed in more detail in Sect. 7, where we characterize the evolution of the infrared luminosity function based on this sample of MIPS sources.
As a final remark, it is worth mentioning another possible caveat related to these infrared luminosity estimates. The various template libraries that we used in this work are only representative of normal and starburst-like galaxies, and do not include the SEDs typical of active galactic nuclei which are significantly flatter in the MIR wavelength range. A careful investigation of the nature of the emission process dominating the 24 m flux in our sub-sample (star-forming activity versus AGN) is beyond the scope of this paper, but we note that the fraction of MIPS sources showing evidence for the presence of an AGN in their optical counterparts is less than 15% according to the VVDS and COMBO-17 classifications. Furthermore, recent synthetic models connecting the X-ray and infrared SED of AGNs as well as their contribution to the cosmic backgrounds in these energy bands indicate that the emission arising from pure AGNs should be negligible (i.e., 10%) in high redshift sources detected at 24 m (e.g., Silva et al. 2004). In the local Universe moreover, AGNs dominate the mid-IR output of galaxies only for the most extreme ULIRGs (e.g., Lutz et al. 1998; Tran et al. 2001), while the X-ray and optical spectral properties of infrared galaxies detected with and MIPS at 15 m and 24 m also argue for a population dominated by star formation at the 85–90% level (Fadda et al. 2002; Franceschini et al. 2003; Manners et al. 2004; Franceschini et al. 2005; Bell et al. 2005). It should therefore be reasonable to assume SEDs typical of star-forming galaxies for this current work.
6. The optical counterparts of the MIPS sources: some properties
We describe in this section a few basic characteristics of the MIPS source optical counterparts to provide a first-order answer to very simple questions: are the distant infrared luminous galaxies detected by MIPS also luminous in the optical or are they highly obscured ? Are these dusty starbursts associated with very young systems or already evolved galaxies ? A description of their morphologies, colors and specific star formation rates is provided by Bell et al. (2005).
The COMBO-17 -band magnitudes of the MIPS sources are plotted as a function of the flux density at 24 m in Figure 10a. Not surprisingly, there is a clear trend for the fainter 24 m objects to be associated with faint optical sources likely located at higher redshifts. Such a trend has already been noted among the population of infrared galaxies detected with ISOCAM at 15 m (e.g., Pozzi et al. 2004). However there is large dispersion in the relation and for most of the sample the optical brightnesses can vary by more than 5 magnitudes when infrared fluxes only change by less than a factor of 10. This clearly points to a very wide range of the LIR/Loptical ratios and a broad variety in the nature of the MIPS sources (see also the Appendix).
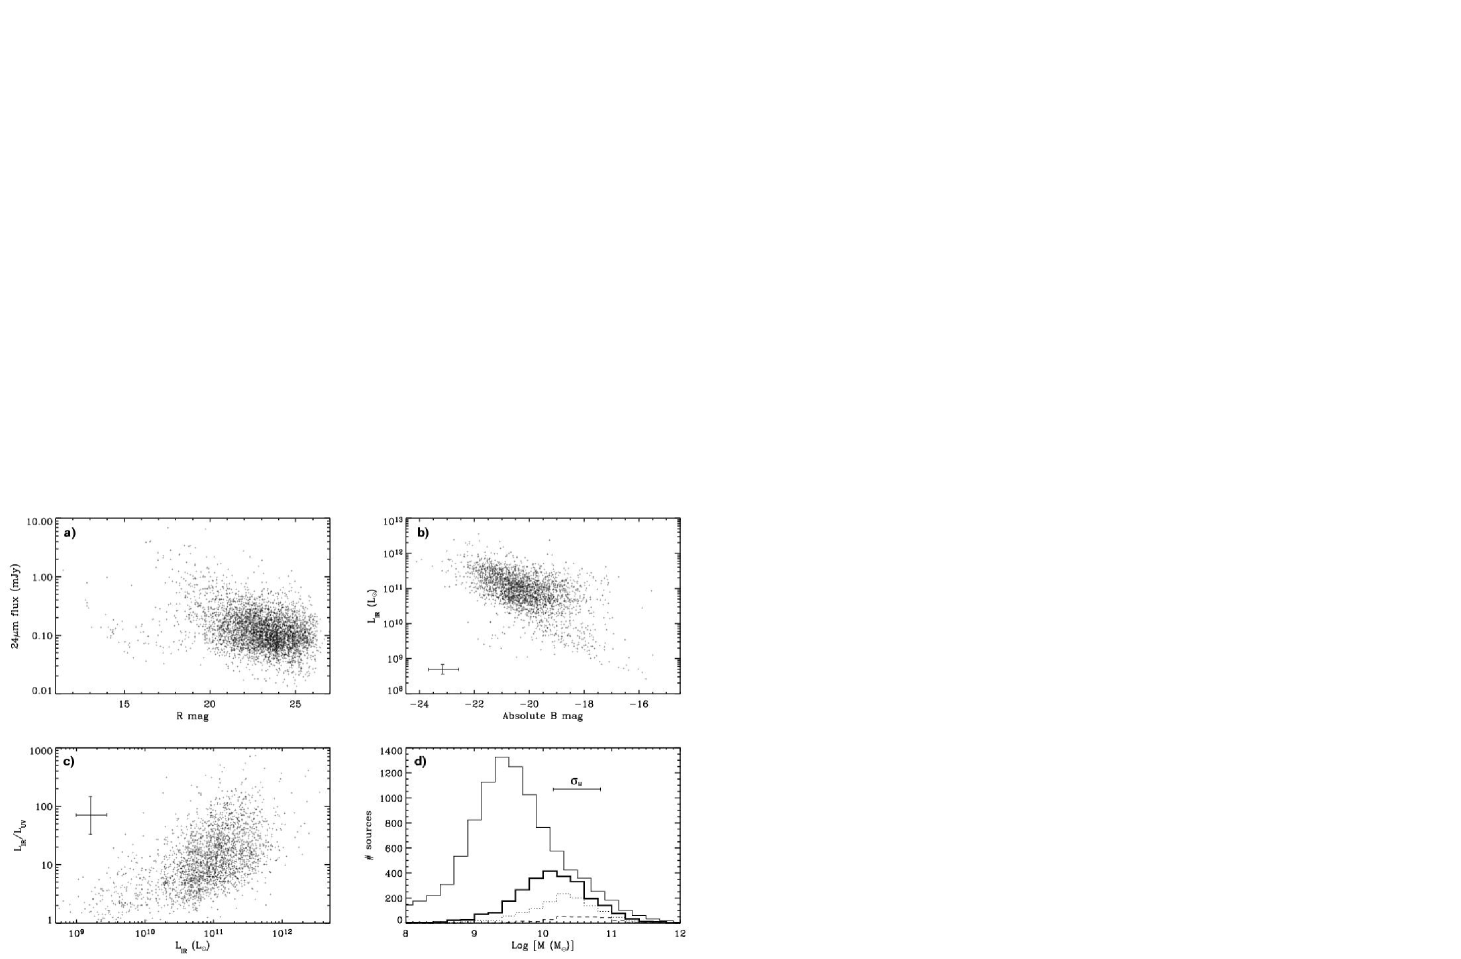
We also used the absolute magnitude estimates provided by COMBO-17 to derive the intrinsic luminosities of the MIPS sources at optical wavelengths. As an example we illustrate in Figure 10b the COMBO-17 absolute magnitudes estimated in the -band filter and corrected to our cosmology777The COMBO-17 catalog provides absolute quantities assuming H0 = 100 km s-1 Mpc-1, = 0.3 and . as a function of the total infrared luminosities derived in the previous section. We observe a clear relationship between the two quantities, though the dispersion remains relatively large (1 0.5 dex). Similar relations are also obtained between the total IR luminosity and the absolute magnitudes derived from the other broad-band filters of COMBO-17. They show that distant IR luminous sources (at least up to 1) are preferentially associated with luminous optical counterparts as in the local Universe (Sanders & Mirabel 1996). This result confirms previous studies based on surveys (Rigopoulou et al. 2002; Franceschini et al. 2003; Zheng et al. 2004). It also suggests that the dust responsible for the IR excess in such distant IR-luminous objects is likely distributed within small-size regions and the corresponding reddening is not sufficient to completely obscure the underlying galaxy. This interpretation is reinforced by the range of optical colors observed among the MIPS 24 m source population, very similar to the range characterizing the local normal galaxies (Bell et al. 2005).
COMBO-17 also provides an estimate of the rest-frame galaxy luminosity at =2800Å, which can be used to derive the “IR excess” in the MIPS sources. IR excess is usually defined as the ratio between the IR and UV emission and it is plotted in Figure 10c as a function of the total IR luminosity. Owing to the tight relation between the star-forming activity and the IR emission of galaxies (Kennicutt 1998), this plot can also be read as the IR excess as a function of an “IR-equivalent” star formation rate (an IR luminosity LIR = 1011 L⊙ typically corresponds to a formation of 17 M⊙ of stars per year following standard calibrations). It illustrates the very well-known trend for galaxies characterized by more intense star-forming activity to be generally dustier and more luminous at IR wavelengths (e.g., Buat et al. 2002; Cardiel et al. 2003; Pozzi et al. 2003; Flores et al. 2004). We also see that the fraction of UV photons not absorbed by dust in the case of the most luminous sources (i.e., LIR 1011.5 L⊙) is negligible compared to the energy reprocessed in the IR.
We finally provide an estimate of the stellar masses of the MIPS sources based on the properties of their optical counterparts. A tight correlation exists between the rest-frame optical colors of galaxies and their mass-to-light ratios (Bell & de Jong 2001; Kauffmann et al. 2003). This relation is uncertain by a factor 0.4 dex due to combined effects of metallicity, dust, and history of star formation in individual sources. It is however accurate enough for the purpose illustrated here (i.e., getting a qualitative estimate of the distribution of IR-luminous objects as a function of mass). Following the detailed analysis and recipes by Bell et al. (2003 , see their Appendix A), we used the -band absolute luminosities of galaxies from COMBO-17 (converted to our cosmology) and transformed these luminosities to stellar masses using rest-frame colors. Figure 10d illustrates the corresponding histograms for both samples of optically-selected sources (thin solid line) and of galaxies detected at 24 m (thick solid line). It is very clear that IR galaxies detected by MIPS are on average more massive (i.e., 109.5 ) than the field population of sources selected at optical wavelengths. Furthermore, the 24 m objects tend to be associated with even more massive galaxies when their IR luminosity (and thus their star formation rate) increases. As already observed in the case of 15 m sources detected by at 1 (Franceschini et al. 2003), LIRGs with LIR 1011.5 L⊙ have most often counterparts with 1010 . In Sect. 8 we will discuss this issue within the more general context of the comoving star-forming activity at 1.
As a side note, we found a group of 91 sources (among which 54 have 83 Jy) identified with photometric redshifts and totally escaping the various relations illustrated on Figs. 10abc. These objects are rather faint in the optical ( 23 mag), and their / flux ratios are particularly high and typical of LIRGs/ULIRGs. According to our previous results, and given that most of them have disturbed merger morphologies chatacteristic of high redshift star-forming galaxies (e.g., Bell et al. 2005), they are thus likely located at 0.5-0.6, which is also supported by their morphologies since many of those are chatacteristic of high redshift star-forming galaxies. However they have been assigned very low redshifts by COMBO-17, mostly in the apparent overdensity observed at 0.15 in the CDFS. This would imply faint infrared luminosities (109 L⊙ LIR 1010 L⊙, see Fig. 9) and optical absolute magnitudes much higher ( ) than expected from the correlations. We believe that these redshifts have probably been misidentified. We decided to exclude the corresponding sources from our sample.
7. Infrared luminosity functions
7.1. Methodology
We explore in this section the evolution of IR luminosity functions (LFs) at 0 1.2. These LFs were derived for various redshift bins with the usual formalism (Schmidt 1968; Huchra & Sargent 1973; Felten 1976) applied to our sub-sample of sources brighter than 83 Jy and = 24 mag. The selection function that was used in this goal was computed as follows. First, we considered the probability for a given object to verify our selection criterion at 24 m. This probability equals 1 for sources brighter than 300 Jy but decreases at fainter fluxes due to the incompleteness of the 24 m catalog. The corresponding effect was quantified using the detailed simulations described by Papovich et al. (2004 , see their figure 1). Second, we estimated the probability for a 24 m source to be associated with an optical counterpart at 24 mag. This probability is a redshift-dependent function, and it can be derived with an estimate of the absolute magnitude corresponding to the optical selection criterion ( = 24 mag) combined with the relation between the infrared and the optical luminosities established in the previous section. At this step, we actually assumed that 100% of sources with 24 mag are detected by COMBO-17888This may not be true in the few regions closely surrounding very bright stars of the optical image. However this effect is obviously negligible over the total field of view considered in this work.. Finally, we took into account the probability for a given optical source to be characterized by a redshift. This was done using the estimate of the redshift identification completeness that we determined in Sect. 3.3 for sources at 24 mag.
The computed selection function was subsequently used for each single galaxy of the sample to weight the differential volume elements that are integrated when calculating the total accessible volume . Given the multi-wavelength flux limits considered here, this integration was performed up to the maximum redshift enabling the detection of the object at both 24 m and optical wavelengths (i.e., the lowest value between the redshift where the 24 m flux would drop below 83 Jy and the redshift where the -band magnitude would reach 24 mag).
The determination of the luminosity function was performed for each redshift range independently of the sources lying in the other bins. For this reason, the approach is more subject to density fluctuations than other methods like the stepwise maximum likelihood (e.g., Efstathiou et al. 1988; Willmer 1997). Even though cosmic variance is not negligible in CDFS, we will see however that the uncertainties affecting our conclusions are largely dominated by the errors on the -corrections that are used to translate fluxes into luminosities. The technique might also be sensitive to the photometric redshift uncertainties, but as we already pointed out in Sect. 3.2, the effect should be negligible here given the accuracy of the COMBO-17 redshift classification.
7.2. Results
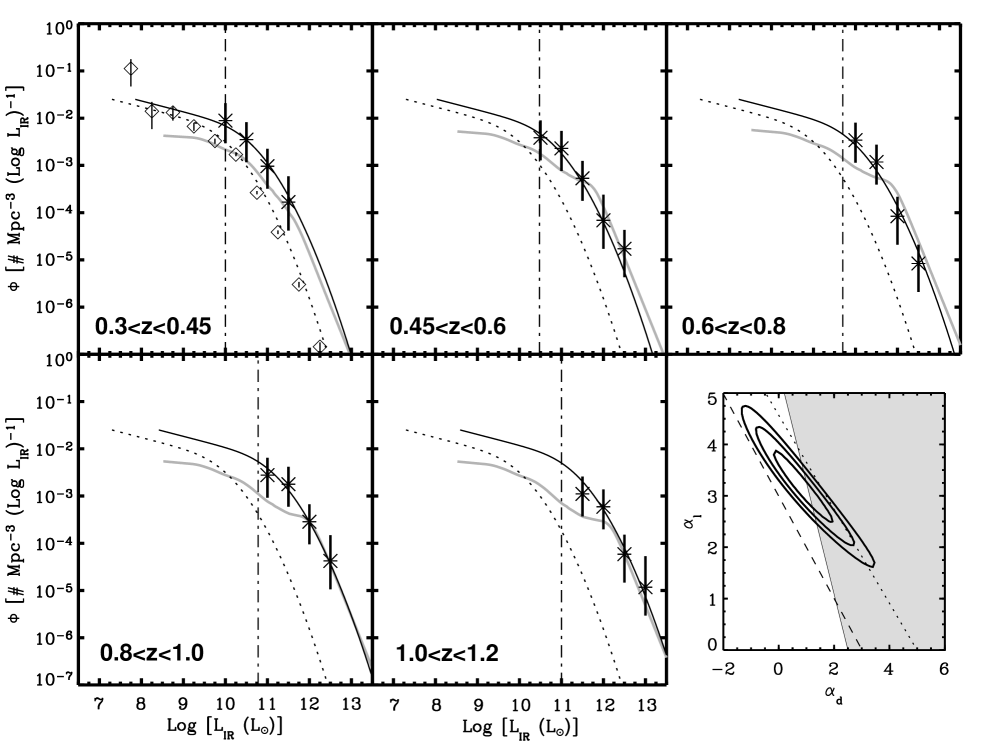
From the luminosity- dependent templates previously discussed, we converted the 24 m observed fluxes into monochromatic luminosities at 12, 15, 25 and 60 m as described in Sect. 5.2. The latter were subsequently used to derive the associated luminosity functions that we finally compared to the local LFs derived from and . In Figure 11 we illustrate the 15 m LF (L,) estimated for different redshift bins. The corresponding data points are reported in Table 1. At this wavelength the -corrections needed to convert 24 m fluxes into luminosities are minimized for most of the sources. The majority of sources are indeed located at 0.5 0.8 where the MIPS 24 m filter probes the 13.5–16 m rest-frame wavength range. This behavior reduces the dependence of the luminosity functions on the assumed IR templates. We also show in Figure 12 the total IR LFs (L,) computed from the infrared luminosities shown in Fig. 9. Data points are given in Table 2. These LFs are obviously more dependent on the choice of IR SEDs since the uncertainty in the conversion between flux and luminosity is larger ( 0.4 dex). They are however easier to interpret in the context of IR galaxy evolution.
| Log [L15μm (L⊙)] | [# Mpc-3 (Log L15μm)-1] | |||||
|---|---|---|---|---|---|---|
| —————————————————————————————————————————————— | ||||||
| 0.3 0.45 | 0.45 0.6 | 0.6 0.8 | 0.8 1.0 | 1.0 1.2 | ||
| 9.0 ……….. | 5.80 10-3 | |||||
| 9.5 ……….. | 2.93 10-3 | 2.62 10-3 | ||||
| 10.0 ……….. | 5.44 10-4 | 1.75 10-3 | 2.90 10-3 | 2.27 10-3 | 2.38 10-3 | |
| 10.5 ……….. | 8.37 10-5 | 3.78 10-4 | 7.72 10-4 | 1.40 10-3 | 1.21 10-3 | |
| 11.0 ……….. | 3.44 10-5 | 3.35 10-5 | 1.06 10-4 | 2.54 10-4 | ||
| 11.5 ……….. | 8.38 10-6 | 1.07 10-5 | 2.35 10-5 | |||
| Log [LIR (L⊙)] | [# Mpc-3 (Log LIR)-1] | |||||
|---|---|---|---|---|---|---|
| —————————————————————————————————————————————— | ||||||
| 0.3 0.45 | 0.45 0.6 | 0.6 0.8 | 0.8 1.0 | 1.0 1.2 | ||
| 10.0 ……….. | 8.88 10-3 | |||||
| 10.5 ……….. | 3.52 10-3 | 3.84 10-3 | ||||
| 11.0 ……….. | 0.96 10-3 | 2.29 10-3 | 3.43 10-3 | 2.77 10-3 | ||
| 11.5 ……….. | 0.16 10-3 | 0.53 10-3 | 1.18 10-3 | 1.78 10-3 | 1.11 10-3 | |
| 12.0 ……….. | 6.87 10-5 | 8.38 10-5 | 2.86 10-4 | 5.91 10-4 | ||
| 12.5 ……….. | 1.71 10-5 | 8.38 10-6 | 4.23 10-5 | 5.88 10-5 | ||
| 13.0 ……….. | 1.18 10-5 | |||||

To correct for cosmic variance effects in each redshift bin, the luminosity functions were normalized by the ratio between the -band luminosity densities produced by galaxies of the blue sequence and measured respectively in the CDFS and over the 3 fields of COMBO-17 (Wolf et al. 2003, 2004; Bell et al. 2004). Even though the -band and the IR selected populations differ in their evolution with redshift, they both trace instantaneous star-forming activity (yet with different time scales). This connection results in an obvious relation between the two that we already highlighted in Sects. 3.4 & 6 (see Fig. 10b, see also Bell et al. 2005). The characterization of the -band luminosity function over different fields can therefore be used to estimate a first-order correction and minimize the cosmic variance affecting our 24 m sample. With its redshift peak at 0.65, the CDFS is particularly subject to this effect.
7.3. Uncertainties
For each luminosity bin in a given redshift range, uncertainties were estimated as the combination of (i) poisson noise statistics on the number of sources used in the measurement (i.e., the rms error , with “k” the source index in the bin) and (ii) uncertainties in the flux density at 24 m and the conversion into luminosities. The effect of the latter was simulated with a Monte Carlo approach. We assigned to each galaxy a range of luminosities (monochromatic or integrated) that were calculated by taking account of the nominal flux and uncertainty at 24 m as well as the different possible SEDs for the conversion. We found this conversion from flux to luminosity to be by far the dominant source of uncertainty, which explains the larger error bars found in the case of than for . Regarding the monochromatic 15 m LF however, flux uncertainties at 24 m also contribute significantly, especially at the faintest levels. For each redshift bin finally, we uniformly added another uncertainty (0.15 dex) to the whole luminosity function based on our estimate of the cosmic variance effect. Because it should be negligible, we did not simulate the effect related to photometric redshift uncertainties.
7.4. Parameterization and evolution with redshift
In both Figures 11 & 12 we have also illustrated the luminosity functions determined locally from and . The 15 m local LF was taken from Xu et al. (1998) and Xu (2000). Regarding the total IR luminosity function at = 0, we show on one hand a recent result from the revised IRAS Bright Galaxy Sample (Sanders et al. 2003), on the other hand an estimate that we derived from the 60 m local LF (Saunders et al. 1990; Takeuchi et al. 2003) assuming the tight correlation between the 60 m and the total IR luminosity of galaxies. Not surprisingly, these two estimates agree well with each other. A commonly known characteristic of these IR luminosity functions is their relatively large number of sources at the bright end. As a result they are better described by a double-exponential profile rather than a classical Schechter parameterization. Their usual analytical form is given as follows:
where is the differential element of comoving volume and the number of sources with a luminosity within and per bin of log.
As expected, the comparison between (L,) and the local luminosity functions reveals a very strong evolution of the LFs with lookback time. For each redshift bin, (L,) was fitted assuming a monotonic evolution of the local LF in both luminosity and density as a function of (1+):
| (2) |
with and .
We explored the possible range of values for the fitting parameters and using a minimization. This was computed from the difference between the observed and the fitted luminosity functions over the 0.3 1.0 redshift range:
| (3) |
Because of their lower statistical significance, LFs determined at 0.3 and 1 were ignored in this process. Reduced values were finally transformed into likelihood estimates using log. The corresponding 1, 2 and 3 iso-probability contours for and are displayed in the insets of Figures 11 & 12 respectively.
The elliptical shape and the orientation of these contours in the luminosity and density evolution parameter space reflect a well-known degeneracy often encountered when fitting high redshift luminosity functions. Given the sensitivity of our 24 m survey indeed, the very faint-end portion of (L,) cannot be constrained at any redshift. The LF can thus be described with a variety of scenarios combining different amount of evolution in and . The constraints that we obtained can be summarized as follows:
We will analyze in Sect. 7.4 how this degeneracy can be broken by taking account of other independent constraints. Nonetheless we stress that the knee of the luminosity functions is well detected throughout the redshift range considered in this work (i.e., 1). This allows us to exclude a pure evolution of the LF in density (i.e., = 0) with a very high confidence.
Because of the quasi-linearity between L15 and LIR (Chary & Elbaz 2001; Takeuchi et al. 2005), these constraints on the evolution of and should be in principle strictly similar. While they do agree rather well with each other, the extension of the contours reveal however that the evolution of the 15 m LF seems to be better constrained than the evolution of . As we already pointed out, LF uncertainties are largely dominated by the errors in the conversion between the 24 m flux and the luminosities, and these errors are in fact minimized around 15 m. Furthermore, we see that might be characterized by a stronger evolution in density and a smaller evolution in luminosity compared to . This discrepancy could be a consequence of the non-negligible dispersion that exists in the correlations observed between fluxes at mid- and far-infrared wavelengths (e.g., Helou 1986; Xu 2000; Dale et al. 2001; Dale & Helou 2002). Indeed the templates that we used to extrapolate fluxes to luminosities do not really show a pure linear relation between L15 and LIR (see Fig. 8). Moreover, the constraints on and strongly depend on the assumed local luminosity functions, and the comparison between and (that we used to compute ) clearly reveals a non-linearity between the two. Finally, it might be suggested that our scenario based on a single evolving population is overly simplistic. Considering distinct object types characterized by their own evolution (Xu 2000; Lagache et al. 2003, 2004; Pozzi et al. 2004; Gruppioni et al. 2005), bi-variate LFs (Chapman et al. 2003b; Lewis et al. 2005) or luminosity functions only evolving at their bright end (Chary & Elbaz 2001) could be one way to explore this effect in more detail.
In spite of this apparent degeneracy, it should be however noted that the evolution of the total luminosity density integrated from these infrared LFs is more tightly constrained than the evolution of the characteristic parameters and considered separately. In each redshift bin, MIPS can indeed detect those sources responsible for the bulk of the comoving luminosity density, and the additional uncertainty related to the extrapolation for taking account of the contribution of faint objects (i.e., faint-end slope of the LF, see Sect. 7.5) is therefore not dominant. Based on the relation that we obtained between and , we find that evolves as (1+)3.9±0.4 at 0 1 (see also Sect. 8 and Fig. 14).
Finally, we tested the effect of our redshift identification incompleteness at 1 on the LF estimates by computing including the observed luminosity function determined at 1 1.2. For both and the minimization of in this case leads to a short translation of the iso-probability contours toward smaller values of and larger values of compared to what we previously found. This trend is consistent with expectations if is underestimated at 1. Indeed the latter artificially yields a fainter evolution in density, the effect of which gets compensated in the lowest redshift bins thanks to a slight increase in luminosity. As a sanity check we finally computed also excluding the LF obtained at 0.8 1 where we may also be missing a few 24 m sources fainter than 24 mag. The results that we found remain consistent with those initially obtained.
7.5. Breaking degeneracies
Hopkins (2004) combined constraints from source number counts at radio wavelengths with estimates of the comoving star formation rate (SFR) density of the Universe at high redshift to break the degeneracy that also arises when quantifying the evolution of star-forming radio-selected galaxies. Following his method we investigate in this section how similar considerations can help in better constraining the evolution of IR galaxies.
Up to 1, the integrated star formation density per comoving volume of the Universe is now well established within a factor of 2 to 3 (Hopkins 2004). Given the relationship between the total IR emission of galaxies and their obscured SFR (Kennicutt 1998), the evolution of converted into a history of the total dusty star-forming activity must be therefore consistent with these constraints on . We computed the “IR-equivalent SFR” as a function of redshift with different combinations of and . The dispersion in the relation between the flux at 24 m and the total IR luminosity obviously affects this estimate. Moreover we stress that it should only be a lower limit on the true SFR given the un-absorbed UV photons produced by young stars and not accounted for by the IR measurements (e.g., Bell 2003 , see also the LIR/LUV ratio of the MIPS sources in Fig. 10c). Given these caveats and the additional uncertainty on mentioned above, we required our IR-SFR determination to lie within 0.5 dex of the averaged relation between log10() and log10(1+) derived by Hopkins (2004). This constraint demarcates a specific region in the luminosity and density evolution parameter space, lying between the dashed and the dotted lines shown in the inset of Figure 12. As we can see, the evolving parameters and that we derived from minimization in the previous section agree well with the known history of star formation up to 1. However we also note that this approach does not really help in solving the aforementioned degeneracy. One may need a more accurate determination of to progress in this direction. Alternatively, a better constraint on the conversion between , LIR and SFR might provide in the future a more accurate determination of .
A much more interesting constraint can be obtained from the source number counts. In fact we only considered 24 m sources brighter than 83 Jy when building the luminosity functions , but the counts at lower fluxes can be used to derive limits on the contribution of sources at luminosities fainter than those taken to minimize the . Using the 24 m observations of the “GOODS test-field” centered on ELAIS-N1, Chary et al. (2004) and Papovich et al. (2004) constrained the faint source density down to 30 Jy and showed that the differential counts normalized to the Euclidian slope are likely dropping very rapidly below this limit. We must therefore ensure that the evolution of the infrared LF does not lead to an overproduction of these counts at faint fluxes. To check the latter we derived as a function of and the differential number counts that would be produced up to = 1 by a population of sources described by and evolving as given by Equation 2 (see Fig. 13). We rejected the solutions overproducing the total counts obtained from the GOODS test field at the faint end. Surprisingly we found that this constraint is nearly independent of the library of IR SEDs used to describe the galaxy population. This excludes a region of the [,] parameter space that is illustrated by the shaded area in the inset of Figure 12.
This additional constraint reduces significantly the number of possibilities to describe the evolution of . The best parameters quantifying this evolution at 0 1 are given by and (quoted uncertainty of 1) . They are summarized in Table 3. In particular they exclude any solution favoring a larger evolution in density than in luminosity. This trend has already been reported by several groups using similar analysis with the and SCUBA number counts, and the overproduction of the background resulting from a too strong increase of is a well-known constraint on the backward evolutionary scenarios of IR galaxies. It has also been noted with models assuming pure density evolution in the Press Schechter formalism (Mould 2003).
![[Uncaptioned image]](/html/astro-ph/0506462/assets/x13.png)
Simulated 24 m number counts produced up to = 1 by a population tied to the local IR luminosity function and evolving in luminosity and density according to various scenarios (dotted line: =0.0, =4.0 – dashed line: =0.2, =3.25 – dash-dotted line: =1.5, =2.75 – triple dot-dashed line: =2.5, =2.2). They are compared to the total observed 24 m source number counts (’’ symbols, solid line and vertical error bars) constrained and extrapolated at faint fluxes using the “GOODS test field” (Chary et al. 2004; Papovich et al. 2004). Note that a too large evolution in density clearly overproduces the counts at the faint end.
| Redshift range | ||||||
|---|---|---|---|---|---|---|
| = 0 (local IRAS luminosity function) | 0.89 10-2 | 1.77 109 | 1.23 | 0.72 | ||
| 0.0 0.3 …………….. | 0.98 10-2 | 2.77 109 | 1.23 | 0.72 | ||
| 0.3 0.45 ……………. | 1.11 10-2 | 4.91 109 | 1.23 | 0.72 | ||
| 0.45 0.6 ……………. | 1.20 10-2 | 6.84 109 | 1.23 | 0.72 | ||
| 0.6 0.8 …………….. | 1.29 10-2 | 9.7 109 | 1.23 | 0.72 | ||
| 0.8 1.0 …………….. | 1.40 10-2 | 13.8 109 | 1.23 | 0.72 | ||
| 1.0 1.2 …………….. | 1.50 10-2 | 19.0 109 | 1.23 | 0.72 |
Obviously we could also use this method to further restrict the possible combinations of and by rejecting scenarios that overproduce the counts at bright fluxes (i.e., 0.3 mJy) or do not reproduce the cumulative counts discussed in Section 4. For instance the model predictions represented by the dashed line in Fig. 13 are consistent with the constraints imposed by the faint source counts but severely underestimate the true contribution of sources at 1. However we found that reproducing the bump observed at 0.3 mJy is very dependent on the choice of SEDs, which could also explain why the pre-launch models had over-predicted the MIPS 24 m number counts at these bright fluxes. Since our goal is to exclude unphysical solutions without being subject to the assumed SEDs, we did not consider further this information.
8. Discussion
8.1. Evolution and shape of the infrared luminosity function
In the previous section we have constrained the knee and the bright end of the infrared luminosity function up to 1. As expected our results indicate a very strong evolution of this LF with lookback time. We find that the space density of galaxies with LIR 1011 L⊙ at 1 exceeds by more than 100 their density in the local Universe, which is in fairly good agreement with the results from . The quantification of the evolution depends however very strongly on the mid- and far-IR SEDs used to compute the -corrections. This points to an urgent need for a more accurate characterization of infrared spectral energy distributions of normal and luminous galaxies. This goal might be achieved by combining 24, 70 and 160 m broad-band MIPS imaging with infrared spectroscopy from the IRS spectrograph and the MIPS “SED mode”.
Given the limitations due to the uncertainties of our LF estimates, we do not find any evidence for a modification of the shape of relative to the local luminosity function at least in the luminosity range probed with MIPS. Obviously the density of sources fainter than the 80% completeness limit of the 24 m survey is not directly constrained and we cannot exclude a slight steepening of the LF faint-end slope at high redshifts. However, the weight of this LF by luminosity shows that the increase of energy produced by faint objects in the case of a steeper slope would be mostly driven by sources just below the knee of , the faintest ones having a negligible contribution in spite of their larger number. The corresponding effect is then very similar to the one produced by a too large evolution of in density. As we saw in the previous section it would result in an overproduction of the number counts at faint fluxes and violate therefore the constraints on the background. While the steepening of at the faintest end cannot be definitely ruled out, it must have marginal significance and will not affect our further discussion.
Furthermore we do not notice any obvious break in the shape of the luminosity function . Contrary to our simple scenario that considers the MIPS detections as a single class of objects, these breaks can occur when the LF is decomposed into the contribution of several populations (e.g., starbursts, AGNs, cold galaxies, …) evolving independently with the redshift. As an example, they can be observed in the model proposed by Lagache et al. (2003, 2004). Based on a simple decomposition of high redshift galaxies into normal non-evolving sources and starbursts undergoing strong evolution, this model had successfully reproduced previous IR/sub-mm observations from , SCUBA and COBE, but it fails in explaining the faint-end part of our luminosity functions because of a predicted break that is not observed (see Fig. 12). Spitzer provides therefore new constraints on this kind of scenario, and our results suggest in this case a smooth transition between populations so that continuity is still observed in the total luminosity function. This effect could be taken into account considering multi-variate luminosity functions (Chapman et al. 2003b; Lewis et al. 2005).
8.2. Comparison with results from the previous long-wavelength surveys
Over the last decade cosmological surveys conducted with mainly at 15 m, 90 m and 170 m provided direct evidence for the importance of infrared luminous sources at 0 1, while submillimeter observations with SCUBA revealed a very high density of dusty galaxies with LIR 1012 L⊙ at very high redshifts (i.e., 2). Number counts and redshift distributions that were derived from these surveys as well as the direct measurement of the far-infrared background by COBE already allowed determination of some constraints on the evolution of the infrared energy density with redshift (e.g., Blain et al. 1999b; Franceschini et al. 2001).
MIPS is however the first infrared instrument with good enough sensitivity to obtain a direct measurement of the mid-IR luminosity function up to 1 (but see Pozzi et al. 2004; Serjeant et al. 2004 for LFs at intermediate redshifts). It might therefore be worth comparing the constraints obtained from this work with earlier results from the literature. First, our 24 m survey not only excludes very clearly the possibility of a pure evolution of the IR luminosity function in , but it also reveals a much stronger evolution of in luminosity than in density (i.e., ). This trend confirms previous interpretations of long-wavelength surveys and implies that the contribution of dusty luminous galaxies was significantly more important in the past. Our evolution constraints (i.e., (1+)∼3.5 and (1+)∼0.5) show good agreement with previously published analysis (e.g., Blain et al. 1999a, b; Franceschini et al. 2001; Lagache et al. 2003; Chapman et al. 2002; Lewis et al. 2005). However our data do not seem to be consistent with a luminosity evolution stronger than as in several scenarios examined by Chary & Elbaz (2001) and Xu (2000), unless one adds a decrease in density ().
Our analysis moreover agrees with the constraints on the LFs of star-forming galaxies recently derived from the radio sub-mJy source number counts and the history of star formation. An evolution slightly lower than our estimate () has been obtained with this approach by Hopkins (2004), but it is still consistent with our results within the large uncertainties. The small discrepancy could also originate from the likely different levels of AGN contamination characterizing populations selected at 24 m and at radio wavelengths.
While our results on the mid- and total IR luminosity functions are still consistent with each other, we finally note that our constraints on seem to require a stronger evolution in density and a smaller evolution in luminosity compared to . We have not yet understood whether this trend is physically real and reveals the need for a more complex evolutionary scenario than the one we have assumed, or whether it is artificially produced by the infrared SEDs used to compute luminosities. Interestingly, the need for a strong evolution of the mid-IR LF in density has also been suggested by Pozzi et al. (2004) based on the ELAIS 15 m surveys (see also Gruppioni et al. 2005). A direct comparison between our analysis and their results must however be done with caution. Pozzi et al. (2004) decomposed their sample into the contribution of non-evolving galaxies that dominate the 15 m counts at low redshift, and distant starbursts responsible for the increase of the IR energy density. Given the negligible role of these starbursts at 0, their evolution must be therefore stronger than that of the global sample. This may explain why the evolving parameters that they derived are slightly larger than ours (i.e., ). Note that this approach was also used by Xu et al. (2001) and led to a qualitatively similar trend.
8.3. The evolving contribution of infrared luminous galaxies to star formation activity up to 1
The constraints on the evolution of can be used to derive the relative importance of galaxies in a given luminosity range and how their contribution to the star formation history evolves with redshift. Using the fit and the parameterization discussed in the previous section we compare in Figure 14 the evolution of the IR energy density produced by infrared luminous galaxies (i.e., LIRGs ULIRGs) and fainter sources (i.e., LIR 1011 L⊙). Uncertainties affecting our results are still significant due to the degeneracy previously described. Accordingly the range of possible solutions was estimated from the 3 iso-probability contours showed in Figure 12 excluding the combinations of and that overproduce the counts at faint fluxes.
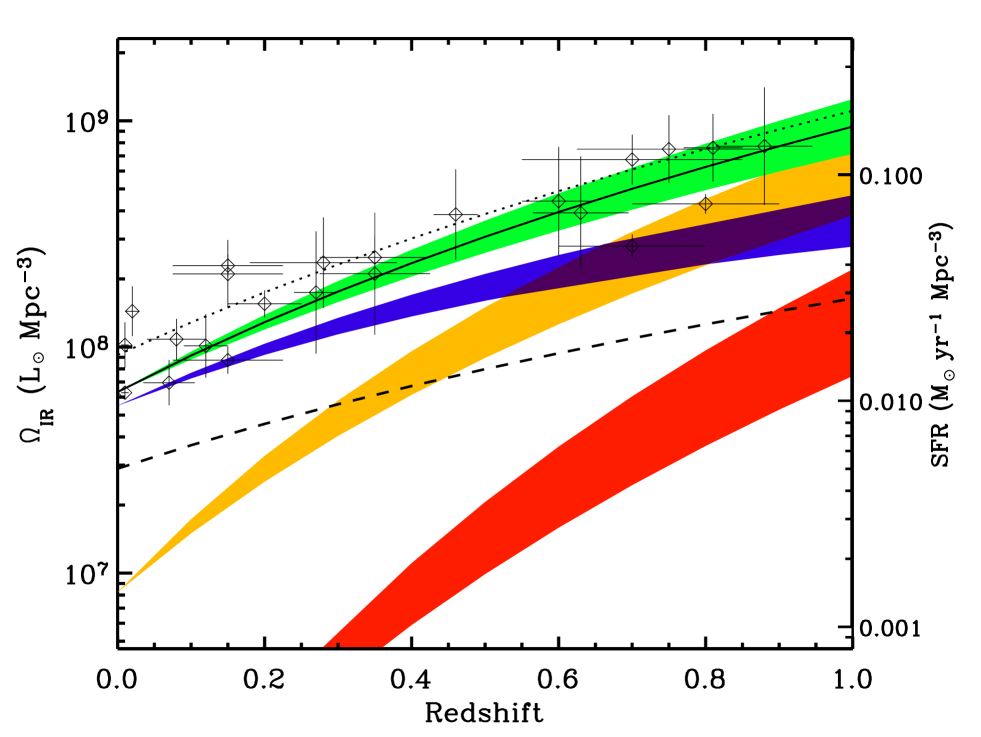
This evolution is also represented in terms of an “IR-equivalent SFR” using the calibration from Kennicutt (1998). For comparison we show integrated star formation rate densities estimated in various redshift bins and taken from the literature (see the compilation by Hopkins 2004 for references). It should be noted that we have not estimated the contribution of the AGN IR emission to . Following the arguments discussed in Sect. 5.2, we believe that such contribution results in a 10–15% overestimate in the true SFR. On the other hand this IR-SFR estimate does not take into account the contribution of the unabsorbed UV light produced by the young stars. As a result we are likely underestimating the total star formation rate density by a factor ranging between 20–30% at 1 (where dusty galaxies dominate the SFR) and 60–70% at 0 (where the star-forming activity occurs within fainter sources with low extinction). This effect can be seen by considering, in addition to the IR emission, the evolution of the UV luminosity (uncorrected for dust extinction) with redshift. Using GALEX data, Schiminovich et al. (2005) found that the energy density measured at 1 500Å evolves as (1+)∼2.5 at 0 1, which is also consistent with previous UV measurements (e.g., Lilly et al. 1996). An estimate of the total star formation rate density (represented as a dotted line in Fig. 14) can thus be obtained by adding the contribution of the equivalent UV-uncorrected SFR (dashed line in Fig. 14) to our best fit of the evolution of the IR star formation estimate (converted from the energy density evolving as (1+)3.9). This clearly shows that the IR emission provides a good approximation of the total SFR density at 1 given the uncertainties affecting its current measurements (i.e., conversion between flux and luminosity, cosmic variance).
One can see that the global evolution of the luminosity function leads to a source density increase for both populations of IR-luminous and low luminosity galaxies. However the larger increase of compared to results in a much more rapid evolution of sources characterized by the highest bolometric luminosities. The contribution of IR luminous galaxies, though negligible in the local Universe, becomes comparable to that of normal starbursts around 0.7 and they dominate beyond. We also see that such IR luminous sources are mostly dominated by LIRG-type objects up to 1 and that ULIRGs still have a modest impact ( 10%) at this redshift. This is once again in good agreement with the ISOCAM surveys (e.g., Aussel et al. 1999). However these ULIRGs have undergone the fastest evolution in the last 8 Gyrs and our results suggest that their contribution is likely still rising at 1. As already revealed by the submillimeter surveys (see Blain et al. 2002 for a review), they may therefore be responsible for a very significant fraction of the star-forming activity of the Universe at 2–3 (see also Cowie et al. 2004).
How can this strong evolution observed in the infrared be understood in the general context of the growth of structures ? There is now increasing evidence that the most massive galaxies seem to have formed their stars early in cosmic history and that their contribution to the comoving SFR density of the Universe was significantly larger at higher redshifts (e.g., Cowie et al. 1996; Cimatti et al. 2004; Daddi et al. 2004; Juneau et al. 2005). Similarly it has been shown that a significant fraction of galaxies with masses 1010 at 0.7-1.0 are experiencing a violent episode of star formation, while nearly all equally-massive sources at the present day are found in a very quiescent mode (e.g., Flores et al. 1999; Franceschini et al. 2003; Bell et al. 2005; Hammer et al. 2005). In parallel to this downsizing effect characteristic of the stellar mass assembly history, the evolution of the luminosity function at infrared and submillimeter wavelengths reveals a transfer of the star formation from the most luminous high redshift sources to more modest local starbursts. If we consider that LIRGs and ULIRGs are preferentially associated with more massive systems (see Fig. 10d), this result might be closely related to the mass growth picture described above. However the connection between the two is likely more subtle as we found that the fraction of IR luminous sources with 1010 is not negligible either. The relation between IR luminosities and masses has indeed a large dispersion and the dominant contribution of LIRGs/ULIRGs to the star formation at 1 does not necessarily imply that the SFR at these redshifts is only locked in massive systems. A similar conclusion has been proposed by Juneau et al. (2005), who showed that the star formation density at 1 was dominated by systems with 1010.5 . Much larger samples of sources will be required to address this issue in more detail, especially by de-projecting the comoving SFR density into the IR-luminosity/mass/redshift 3-dimensional space. This goal could be achieved in the very near future by combining all the MIPS cosmological surveys that are currently being carried out with Spitzer.
9. Conclusion
We have analyzed a sample of MIPS/Spitzer 24 m sources detected in the Chandra Deep Field South using ancillary optical data from the literature (i.e., magnitudes, spectroscopic and photometric redshifts). Our results can be summarized as follows:
-
•
For 24 m sources brighter than 80 Jy, the selection criterion 24 mag provides a complete sample of optical counterpart identifications up to 0.8.
-
•
About 55-60% of the 24 m objects brighter than 80 Jy are located at 1, which points to a significant fraction of the MIPS 24 m sources being luminous and ultra-luminous infrared galaxies at even higher redshifts.
-
•
The 24 m source population at 0.5 1.0 is dominated by LIRG-type objects and slightly fainter sources (i.e., LIR 1011 LIR). ULIRGs are found to be rare at these redshifts.
-
•
The conversion between fluxes and luminosities depends strongly on the assumed infrared SEDs. This points to a crucial need for more accurate determinations of IR templates, a goal which could be achieved with MIPS and IRS.
-
•
As in the local Universe, infrared luminous sources up to 1 are also luminous at optical wavelengths and they tend to be more massive than the bulk of optically-selected distant galaxies.
-
•
The comoving energy density measured in the infrared evolves as (1+)3.9±0.4 at 0 1. In contrast, the luminosity density in the UV only evolves as (1+)∼2.5 over the similar redshift range. This points to a more important extinction by dust reprocessing light in the IR at high redshift.
-
•
The infrared-selected sources at 0 1 have undergone strong evolution characterized by (1+) and (1+). At 1, infrared luminous galaxies (i.e., LIR 1011 L⊙) appear to be responsible for 7015% of the comoving IR energy density. They dominate the star-forming activity beyond 0.7.
Selection effects in the sample of 24 m sources
In this work we imposed a selection criterion 24 mag when considering the 24 m sources identified with a photometric redshift from the COMBO-17 survey. As we showed in Sect. 3, this selection obviously results in an incompleteness of the MIPS-selected population at 0.8-1.0. We provide in this Appendix a few more details characterizing the possible nature of the sources that we may have missed in the estimate of the LFs at high redshift.
In Figure 15 we show the relation between the color and the -band magnitude of the MIPS sources identified with an optical counterpart from COMBO-17 (top panel). The 24 m Vega magnitudes were calculated assuming a Zero Point of 7.3 Jy as defined in the Spitzer Observing Manual.999An electronic version is available at http://ssc.spitzer.caltech.edu/documents/SOM/ As pointed out in Sect. 6, the apparently well-defined correlation that is observed is a natural consequence of the small range of 24 m fluxes (typically a factor of 10 over our sample) compared to the much larger range ( 5 magnitudes) covered by the optical counterparts of the MIPS sources (see also Fig. 8a). If we only consider 24 m objects brighter than the 80% completeness of our survey (i.e., 83 Jy), we see that the selection at = 24 mag defines a complete sample up to 11.6. We miss therefore the reddest sources of the MIPS catalog (shaded region of Fig. 1).
![[Uncaptioned image]](/html/astro-ph/0506462/assets/x15.png)
Top: The – 24 m color as a function of the -band magnitude for the MIPS sources identified with an optical counterpart in COMBO-17. Sources above the solid line are brighter than the 80% completeness limit of the MIPS 24 m survey (i.e., 83 Jy). Given the selection criterion 24 mag (dashed line), sources redder than – 24 m 11.6 in the shaded region are therefore missed when deriving the luminosity functions in Sect. 7. Bottom: The total IR luminosities (see Sect. 5) versus the – 24 m color for the MIPS sources with 22 mag (grey filled squares), 22 mag 23 mag (’’ black symbols) and 23 mag 24 mag (’’ grey symbols). The vertical dashed line represents the color selection – 24 m 11.6. Note that the reddest sources still span a wide range of IR luminosities.
To get a hint into the possible nature of these targets, we also plot in figure 15 the total infrared luminosities (as derived in Sect. 5) versus the colors for the MIPS sources identified with a spectroscopic or a photometric redshift (bottom panel). Different symbols are used to highlight sources as a function of the -band magnitude. As we see, 24 m objects redder than 11.6 are not obviously the most extreme in terms of dust emission and their luminosity can vary between 51010 L⊙ and a few 1012 L⊙ in the infrared. Even though sources fainter than 24 mag may follow a different trend, this dispersion of LIR with both the color and the -band magnitude suggests that these sources span a wide range of IR luminosities. Taking into account the evolution of the sensivity limit with redshift in our 24 m survey (see Fig. 7), they should thus be located in a wide range of redshifts at 1.
References
- Appleton et al. (2004) Appleton, P. N., Fadda, D. T., Marleau, F. R., et al. 2004, ApJS, 154, 147
- Armus et al. (2004) Armus, L., Charmandaris, V., Spoon, H. W. W., et al. 2004, ApJS, 154, 178
- Aussel et al. (1999) Aussel, H., Cesarsky, C. J., Elbaz, D., & Starck, J. L. 1999, A&A, 342, 313
- Bell (2003) Bell, E. F. 2003, ApJ, 586, 794
- Bell & de Jong (2001) Bell, E. F. & de Jong, R. S. 2001, ApJ, 550, 212
- Bell et al. (2003) Bell, E. F., McIntosh, D. H., Katz, N., & Weinberg, M. D. 2003, ApJS, 149, 289
- Bell et al. (2005) Bell, E. F., Papovich, C., Wolf, C., et al. 2005, ApJ, in press (astro-ph/0502246)
- Bell et al. (2004) Bell, E. F., Wolf, C., Meisenheimer, K., et al. 2004, ApJ, 608, 752
- Benítez (2000) Benítez, N. 2000, ApJ, 536, 571
- Blain et al. (1999a) Blain, A. W., Kneib, J.-P., Ivison, R. J., & Smail, I. 1999a, ApJ, 512, L87
- Blain et al. (1999b) Blain, A. W., Smail, I., Ivison, R. J., & Kneib, J.-P. 1999b, MNRAS, 302, 632
- Blain et al. (2002) Blain, A. W., Smail, I., Ivison, R. J., Kneib, J.-P., & Frayer, D. T. 2002, Phys. Rep., 369, 111
- Buat et al. (2002) Buat, V., Boselli, A., Gavazzi, G., & Bonfanti, C. 2002, A&A, 383, 801
- Cardiel et al. (2003) Cardiel, N., Elbaz, D., Schiavon, R. P., et al. 2003, ApJ, 584, 76
- Chanial (2003) Chanial, P. 2003, PhD thesis, University of Paris (France)
- Chapman et al. (2003a) Chapman, S. C., Blain, A. W., Ivison, R. J., & Smail, I. R. 2003a, Nature, 422, 695
- Chapman et al. (2003b) Chapman, S. C., Helou, G., Lewis, G. F., & Dale, D. A. 2003b, ApJ, 588, 186
- Chapman et al. (2002) Chapman, S. C., Lewis, G. F., Scott, D., Borys, C., & Richards, E. 2002, ApJ, 570, 557
- Charmandaris et al. (2002) Charmandaris, V., Laurent, O., Le Floc’h, E., et al. 2002, A&A, 391, 429
- Charmandaris et al. (2004) Charmandaris, V., Le Floc’h, E., & Mirabel, I. F. 2004, ApJ, 600, L15
- Chary et al. (2004) Chary, R., Casertano, S., Dickinson, M. E., et al. 2004, ApJS, 154, 80
- Chary & Elbaz (2001) Chary, R. & Elbaz, D. 2001, ApJ, 556, 562
- Cimatti et al. (2004) Cimatti, A., Daddi, E., Renzini, A., et al. 2004, Nature, 430, 184
- Condon (1992) Condon, J. J. 1992, ARA&A, 30, 575
- Condon et al. (2002) Condon, J. J., Cotton, W. D., & Broderick, J. J. 2002, AJ, 124, 675
- Connolly et al. (1997) Connolly, A. J., Szalay, A. S., Dickinson, M., Subbarao, M. U., & Brunner, R. J. 1997, ApJ, 486, L11+
- Cowie et al. (2004) Cowie, L. L., Barger, A. J., Fomalont, E. B., & Capak, P. 2004, ApJ, 603, L69
- Cowie et al. (1999) Cowie, L. L., Songaila, A., & Barger, A. J. 1999, AJ, 118, 603
- Cowie et al. (1996) Cowie, L. L., Songaila, A., Hu, E. M., & Cohen, J. G. 1996, AJ, 112, 839
- Daddi et al. (2004) Daddi, E., Cimatti, A., Renzini, A., et al. 2004, ApJ, 600, L127
- Dale & Helou (2002) Dale, D. A. & Helou, G. 2002, ApJ, 576, 159
- Dale et al. (2001) Dale, D. A., Helou, G., Contursi, A., Silbermann, N. A., & Kolhatkar, S. 2001, ApJ, 549, 215
- Dole et al. (2001) Dole, H., Gispert, R., Lagache, G., et al. 2001, A&A, 372, 364
- Dole et al. (2004a) Dole, H., Le Floc’h, E., Pérez-González, P. G., et al. 2004a, ApJS, 154, 87
- Dole et al. (2004b) Dole, H., Rieke, G. H., Lagache, G., et al. 2004b, ApJS, 154, 93
- Efstathiou et al. (1988) Efstathiou, G., Ellis, R. S., & Peterson, B. A. 1988, MNRAS, 232, 431
- Egami et al. (2004) Egami, E., Dole, H., Huang, J.-S., et al. 2004, ApJS, 154, 130
- Eisenhardt et al. (2004) Eisenhardt, P. R., Stern, D., Brodwin, M., et al. 2004, ApJS, 154, 48
- Elbaz et al. (2002) Elbaz, D., Cesarsky, C. J., Chanial, P., et al. 2002, A&A, 384, 848
- Elbaz et al. (1999) Elbaz, D., Cesarsky, C. J., Fadda, D., et al. 1999, A&A, 351, L37
- Elbaz et al. (2005) Elbaz, D., Le Floc’h, E., Dole, H., & Marcillac, D. 2005, A&A, 434, L1
- Fadda et al. (2002) Fadda, D., Flores, H., Hasinger, G., et al. 2002, A&A, 383, 838
- Fazio et al. (2004) Fazio, G. G., Ashby, M. L. N., Barmby, P., et al. 2004, ApJS, 154, 39
- Felten (1976) Felten, J. E. 1976, ApJ, 207, 700
- Flores et al. (1999) Flores, H., Hammer, F., Désert, F. X., et al. 1999, A&A, 343, 389
- Flores et al. (2004) Flores, H., Hammer, F., Elbaz, D., et al. 2004, A&A, 415, 885
- Franceschini et al. (2001) Franceschini, A., Aussel, H., Cesarsky, C. J., Elbaz, D., & Fadda, D. 2001, A&A, 378, 1
- Franceschini et al. (2003) Franceschini, A., Berta, S., Rigopoulou, D., et al. 2003, A&A, 403, 501
- Franceschini et al. (2005) Franceschini, A., Manners, J., Polletta, M., et al. 2005, AJ, in press (astro-ph/0412476)
- Frayer et al. (2004) Frayer, D. T., Chapman, S. C., Yan, L., et al. 2004, ApJS, 154, 137
- Gallais et al. (2004) Gallais, P., Charmandaris, V., Le Floc’h, E., et al. 2004, A&A, 414, 845
- Gispert et al. (2000) Gispert, R., Lagache, G., & Puget, J. L. 2000, A&A, 360, 1
- Gordon et al. (2005) Gordon, K. D., Rieke, G. H., Engelbracht, C. W., et al. 2005, PASP, in press (astro-ph/0502079)
- Gruppioni et al. (2005) Gruppioni, C., Pozzi, F., Lari, C., Oliver, S., & Rodighiero, G. 2005, ApJ, 618, L9
- Haarsma et al. (2000) Haarsma, D. B., Partridge, R. B., Windhorst, R. A., & Richards, E. A. 2000, ApJ, 544, 641
- Hammer et al. (2005) Hammer, F., Flores, H., Elbaz, D., et al. 2005, A&A, 430, 115
- Helou (1986) Helou, G. 1986, ApJ, 311, L33
- Hopkins (2004) Hopkins, A. M. 2004, ApJ, 615, 209
- Houck et al. (2004a) Houck, J. R., Charmandaris, V., Brandl, B. R., et al. 2004a, ApJS, 154, 211
- Houck et al. (2004b) Houck, J. R., Roellig, T. L., van Cleve, J., et al. 2004b, ApJS, 154, 18
- Houck et al. (2005) Houck, J. R., Soifer, B. T., Weedman, D., et al. 2005, ApJ, 622, L105
- Huchra & Sargent (1973) Huchra, J. & Sargent, W. L. W. 1973, ApJ, 186, 433
- Ivison et al. (2004) Ivison, R. J., Greve, T. R., Serjeant, S., et al. 2004, ApJS, 154, 124
- Jarrett et al. (2000) Jarrett, T. H., Chester, T., Cutri, R., et al. 2000, AJ, 119, 2498
- Juneau et al. (2005) Juneau, S., Glazebrook, K., Crampton, D., et al. 2005, ApJ, 619, L135
- Kauffmann et al. (2003) Kauffmann, G., Heckman, T. M., White, S. D. M., et al. 2003, MNRAS, 341, 54
- Kennicutt (1998) Kennicutt, R. C. 1998, ARA&A, 36, 189
- Kim & Sanders (1998) Kim, D.-C. & Sanders, D. B. 1998, ApJS, 119, 41
- Lagache et al. (2003) Lagache, G., Dole, H., & Puget, J.-L. 2003, MNRAS, 338, 555
- Lagache et al. (2004) Lagache, G., Dole, H., Puget, J.-L., et al. 2004, ApJS, 154, 112
- Laurent et al. (2000) Laurent, O., Mirabel, I. F., Charmandaris, V., et al. 2000, A&A, 359, 887
- Le Fèvre et al. (2004) Le Fèvre, O., Vettolani, G., Paltani, S., et al. 2004, A&A, 428, 1043
- Le Floc’h et al. (2002) Le Floc’h, E., Charmandaris, V., Laurent, O., et al. 2002, A&A, 391, 417
- Le Floc’h et al. (2001) Le Floc’h, E., Mirabel, I. F., Laurent, O., et al. 2001, A&A, 367, 487
- Le Floc’h et al. (2004) Le Floc’h, E., Pérez-González, P. G., Rieke, G. H., et al. 2004, ApJS, 154, 170
- Lewis et al. (2005) Lewis, G. F., Chapman, S. C., & Helou, G. 2005, ApJ, 621, 32
- Liang et al. (2004) Liang, Y. C., Hammer, F., Flores, H., et al. 2004, A&A, 423, 867
- Lilly et al. (1996) Lilly, S. J., Le Fevre, O., Hammer, F., & Crampton, D. 1996, ApJ, 460, L1
- Lonsdale et al. (2004) Lonsdale, C., Polletta, M. d. C., Surace, J., et al. 2004, ApJS, 154, 54
- Lutz et al. (1998) Lutz, D., Spoon, H. W. W., Rigopoulou, D., Moorwood, A. F. M., & Genzel, R. 1998, ApJ, 505, L103
- Machalski & Godlowski (2000) Machalski, J. & Godlowski, W. 2000, A&A, 360, 463
- Manners et al. (2004) Manners, J. C., Serjeant, S., Bottinelli, S., et al. 2004, MNRAS, 355, 97
- Marleau et al. (2004) Marleau, F. R., Fadda, D., Storrie-Lombardi, L. J., et al. 2004, ApJS, 154, 66
- Mould (2003) Mould, J. 2003, ApJ, 587, L93
- Pérez-González et al. (2003) Pérez-González, P. G., Zamorano, J., Gallego, J., Aragón-Salamanca, A., & Gil de Paz, A. 2003, ApJ, 591, 827
- Papovich & Bell (2002) Papovich, C. & Bell, E. F. 2002, ApJ, 579, L1
- Papovich et al. (2004) Papovich, C., Dole, H., Egami, E., et al. 2004, ApJS, 154, 70
- Pearson (2005) Pearson, C. 2005, MNRAS, 358, 1417
- Pozzi et al. (2003) Pozzi, F., Ciliegi, P., Gruppioni, C., et al. 2003, MNRAS, 343, 1348
- Pozzi et al. (2004) Pozzi, F., Gruppioni, C., Oliver, S., et al. 2004, ApJ, 609, 122
- Rieke & Low (1972) Rieke, G. H. & Low, F. J. 1972, ApJ, 176, L95
- Rieke et al. (2004) Rieke, G. H., Young, E. T., Engelbracht, C. W., et al. 2004, ApJS, 154, 25
- Rigby et al. (2004) Rigby, J. R., Rieke, G. H., Maiolino, R., et al. 2004, ApJS, 154, 160
- Rigopoulou et al. (2002) Rigopoulou, D., Franceschini, A., Aussel, H., et al. 2002, ApJ, 580, 789
- Roussel et al. (2001) Roussel, H., Sauvage, M., Vigroux, L., & Bosma, A. 2001, A&A, 372, 427
- Sadler et al. (2002) Sadler, E. M., Jackson, C. A., Cannon, R. D., et al. 2002, MNRAS, 329, 227
- Salpeter (1955) Salpeter, E. E. 1955, ApJ, 121, 161
- Sanders et al. (2003) Sanders, D. B., Mazzarella, J. M., Kim, D.-C., Surace, J. A., & Soifer, B. T. 2003, AJ, 126, 1607
- Sanders & Mirabel (1996) Sanders, D. B. & Mirabel, I. F. 1996, ARA&A, 34, 749
- Saunders et al. (1990) Saunders, W., Rowan-Robinson, M., Lawrence, A., et al. 1990, MNRAS, 242, 318
- Schiminovich et al. (2005) Schiminovich, D., Ilbert, O., Arnouts, S., et al. 2005, ApJ, 619, L47
- Schmidt (1968) Schmidt, M. 1968, ApJ, 151, 393
- Serjeant et al. (2004) Serjeant, S., Carramiñana, A., Gonzáles-Solares, E., et al. 2004, MNRAS, 355, 813
- Serjeant et al. (2001) Serjeant, S., Efstathiou, A., Oliver, S., et al. 2001, MNRAS, 322, 262
- Serjeant et al. (2002) Serjeant, S., Gruppioni, C., & Oliver, S. 2002, MNRAS, 330, 621
- Silva et al. (2004) Silva, L., Maiolino, R., & Granato, G. L. 2004, MNRAS, 355, 973
- Smail et al. (1997) Smail, I., Ivison, R. J., & Blain, A. W. 1997, ApJ, 490, L5
- Smith et al. (2004) Smith, J. D. T., Dale, D. A., Armus, L., et al. 2004, ApJS, 154, 199
- Soifer & Neugebauer (1991) Soifer, B. T. & Neugebauer, G. 1991, AJ, 101, 354
- Soifer et al. (1987) Soifer, B. T., Neugebauer, G., & Houck, J. R. 1987, ARA&A, 25, 187
- Soifer et al. (2000) Soifer, B. T., Neugebauer, G., Matthews, K., et al. 2000, AJ, 119, 509
- Soifer et al. (2001) —. 2001, AJ, 122, 1213
- Somerville et al. (2004) Somerville, R. S., Lee, K., Ferguson, H. C., et al. 2004, ApJ, 600, L171
- Spergel et al. (2003) Spergel, D. N., Verde, L., Peiris, H. V., et al. 2003, ApJS, 148, 175
- Spinoglio et al. (1995) Spinoglio, L., Malkan, M. A., Rush, B., Carrasco, L., & Recillas-Cruz, E. 1995, ApJ, 453, 616
- Stetson (1987) Stetson, P. B. 1987, PASP, 99, 191
- Sullivan et al. (2001) Sullivan, M., Mobasher, B., Chan, B., et al. 2001, ApJ, 558, 72
- Szokoly et al. (2004) Szokoly, G. P., Bergeron, J., Hasinger, G., et al. 2004, ApJS, 155, 271
- Takeuchi et al. (2005) Takeuchi, T. T., Buat, V., Iglesias-Páramo, J., Boselli, A., & Burgarella, D. 2005, A&A, 432, 423
- Takeuchi et al. (2003) Takeuchi, T. T., Yoshikawa, K., & Ishii, T. T. 2003, ApJ, 587, L89
- Thuan et al. (1999) Thuan, T. X., Sauvage, M., & Madden, S. 1999, ApJ, 516, 783
- Tran et al. (2001) Tran, Q. D., Lutz, D., Genzel, R., et al. 2001, ApJ, 552, 527
- Tresse & Maddox (1998) Tresse, L. & Maddox, S. J. 1998, ApJ, 495, 691
- Tresse et al. (2002) Tresse, L., Maddox, S. J., Le Fèvre, O., & Cuby, J.-G. 2002, MNRAS, 337, 369
- Treyer et al. (1998) Treyer, M. A., Ellis, R. S., Milliard, B., Donas, J., & Bridges, T. J. 1998, MNRAS, 300, 303
- Vanzella et al. (2005) Vanzella, E., Cristiani, S., Dickinson, M., et al. 2005, A&A, 434, 53
- Werner et al. (2004) Werner, M. W., Roellig, T. L., Low, F. J., et al. 2004, ApJS, 154, 1
- Willmer (1997) Willmer, C. N. A. 1997, AJ, 114, 898
- Wilson et al. (2002) Wilson, G., Cowie, L. L., Barger, A. J., & Burke, D. J. 2002, AJ, 124, 1258
- Wolf et al. (2004) Wolf, C., Meisenheimer, K., Kleinheinrich, M., et al. 2004, A&A, 421, 913
- Wolf et al. (2003) Wolf, C., Meisenheimer, K., Rix, H.-W., et al. 2003, A&A, 401, 73
- Xu (2000) Xu, C. 2000, ApJ, 541, 134
- Xu et al. (1998) Xu, C., Hacking, P. B., Fang, F., et al. 1998, ApJ, 508, 576
- Xu et al. (2001) Xu, C., Lonsdale, C. J., Shupe, D. L., O’Linger, J., & Masci, F. 2001, ApJ, 562, 179
- Yan et al. (2004) Yan, L., Helou, G., Fadda, D., et al. 2004, ApJS, 154, 60
- Zheng et al. (2004) Zheng, X. Z., Hammer, F., Flores, H., Assémat, F., & Pelat, D. 2004, A&A, 421, 847