The boundary of cosmic filaments
Abstract
For decades, the boundary of cosmic filaments have been a subject of debate. In this work, we determine the physically-motivated radii of filaments by constructing stacked galaxy number density profiles around the filament spines. We find that the slope of the profile changes with distance to the filament spine, reaching its minimum at approximately at in both state-of-the-art hydrodynamical simulations and observational data. This can be taken as the average value of the filament radius. Furthermore, we note that the average filament radius rapidly decreases from to , and then slightly increases. Moreover, we find that the filament radius depends on the filament length, the distance from connected clusters, and the masses of the clusters. These results suggest a two-phase formation scenario of cosmic filaments. The filaments experience rapid contraction before , but their density distribution has remained roughly stable since then. The subsequent mass transport along the filaments to the connected clusters is likely to have contributed to the formation of the clusters themselves.
Purple Mountain Observatory, No.10 Yuan Hua Road, 210034 Nanjing, China.
Shanghai Astronomical Observatory, Nandan Road 80, Shanghai 200030, China.
School of Astronomy and Space Science, University of Science and Technology of China, Hefei 230026, Anhui, China.
Institute for Astronomy, the School of Physics, Zhejiang University, 38 Zheda Road, Hangzhou 310027, China.
Leibniz-Institut für Astrophysik Potsdam, An der Sternwarte 16, D-14482 Potsdam, Germany.
Max-Planck-Institut für Astrophysik, Karl-Schwarzschild-Str. 1, D-85748 Garching, Germany.
Department of Physics and Astronomy, York University, 4700 Keele Street, Toronto, ON M3J 1P3, Canada.
Harvard-Smithsonian Center for Astrophysics, 60 Garden St, Cambridge, MA 02138, USA.
Department of Astronomy, Xiamen University, Xiamen, Fujian 361005, People’s Republic of China.
Institute for Computational Cosmology, Department of Physics, Durham University, South Road, Durham, DH1 3LE, UK.
Excellence Cluster ORIGINS, Boltzmannstrasse 2, D-85748 Garching, Germany.
Introduction
The origin and evolution of cosmic structures are central issues in the CDM cosmological model. According to standard structure formation theory, the structures we observe today began as minor fluctuations in the early universe that were subsequently amplified by gravitational instability. Observations 1, 2, 3 and simulations 4, 5, 6, 7, 8 have revealed the presence of a web-like arrangement of matter in the current universe, known as the cosmic web 9. This web can be thought of as being composed of four components: clusters, filaments, walls, and voids.
A significant portion of cosmic matter is found in the filaments, and there is a growing consensus that they play a major role in the formation and evolution of galaxies. This influence is evident in various galaxy properties, including their mass, shape 10, star formation rate 10, spatial alignment 11, 12, 13, 14, 15, abundance of satellite galaxies 16, and correlation of angular momentum 12, 13, 17, 18, 19, 20, 21, 22, 23. Several different algorithms have been developed to identify filaments based on the distribution of galaxies. However, most algorithms have limitations in extracting spatial information and describe filaments as one-dimensional structures without considering their radial extent24. Without a clear understanding of the boundary of filaments, it is difficult to quantify how filaments affect the properties of the galaxy 25, 26, 27, 28.
The density profiles of mass or galaxy number around the spines of filaments have been investigated in both observations and simulations29, 30, 31, 32, 33, 34, 35, 36, 37, 38. These density profiles can be fitted with various functional forms, such as power or exponential laws, to determine the scale radii that describe the typical sizes of filaments. However, the resulting radii can range from to , depending on the fitting functions used. On the other hand, observations 39 and simulations 40 have also observed the spin of filaments, with the rotation curves peaking at approximately from the filament spine and then decreasing to zero at approximately . This suggests that filaments may have a physical radius of around to , which is also commonly adopted as the typical size of filaments 29. Having a well-defined physical radius for filaments would then greatly enhance our understanding of their formation and evolution.
Analysis & Results
This paper investigates cosmic filaments, which can be thought of as thin and elongated cylinders or curvilinear structures, identified from the galaxy distribution using the popular filament finder DisPerSE 41, 42. In essence, the DisPerSE approach identifies “critical points” (in the Morse theory sense) as locations where the gradient of the density field vanishes, and connects these to identify ridges or filaments. The framework allows the number of galaxies in each cylinder shell to be counted as a function of the distance from the filament spine, known as the galaxy number density profile 37, 43, 44. Since the absolute number of galaxies depends on the redshift and simulation resolution, the number density relative to the background number density provides a more meaningful representation of the local environment. The background number density is obtained simply by dividing the total number of galaxies by the volume. This study focuses on two sets of galaxy catalogues, one obtained from observation and the other from simulation. The analysis of cosmic filaments begins with a publicly available galaxy group catalogue45 derived from the Sloan Digital Sky Survey (SDSS) Data Release 1246. It is worth mentioning that the redshift space distortion (RSD) effect in this catalogue has been reasonably corrected, enabling an easier comparison with the simulation results in real space. The theoretical predictions are then examined using the MillenniumTNG hydrodynamical simulation (referred to as MTNG) with a volume of approximately (see Methods for more information)47, 48, 49. The evolution of the filament radius is investigated in this simulation. All the filament radii in the following are in comoving units.
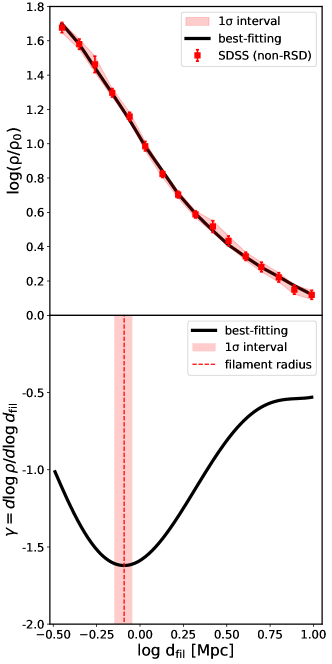
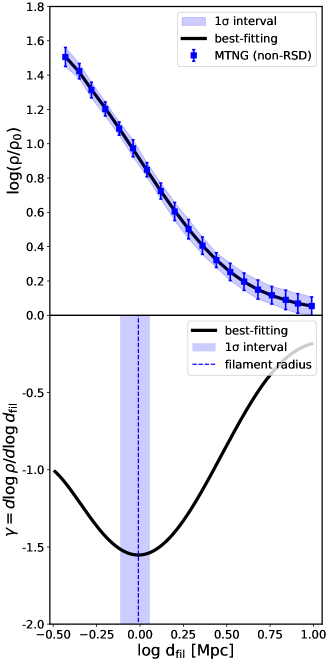
The upper panels of Figure 1 show the average radial profiles of the galaxy number density distribution around the filaments, , for both SDSS (left panel, ) and MTNG (right panel, ) using galaxies with stellar masses of (see Fig. 6 for the dependence on the stellar mass threshold). is the background galaxy number density above the stellar mass cutoff and is the perpendicular distance from the filament spines. It is evident that the number density of galaxies close to filaments is much higher than the average cosmic density, with the central region of the filament having a density more than 50 times higher than the background. As one moves away from the spine of the filaments, the density gradually decreases, although the rate of decrease is not uniform at different distances, in agreement with previous studies also using the TNG set of simulations37, 43.
In principle, the logarithmic slope of the number density profile, , depends on the concentration of matter within the filaments. The variation of with indicates how fast the galaxy number density would decrease away from the filament spines. This is analogous to the slope of the matter density profile of dark matter haloes. The radius corresponding to the minimum of the dark matter radial density gradient is proposed to be a physically motivated halo boundary50, 51, 52, known as the splashback radius where dark matter particles reach the apocenters of their first orbits. Similarly, we can essentially use the slope to define the average filament radius, where the value of with the minimal can be seen as the effective radius of the filaments.
To accurately determine the logarithmic slope , we fit a sixth-order polynomial function to , which is represented by the solid black line in the upper panel of Figure 1. We find that the choice of sixth-order polynomials efficiently reduces the noise in the profile of without affecting the actual values of , similar to the method used in previous studies focusing on haloes50. We then apply the Markov Chain Monte Carlo (MCMC) method to explore the parameter space. The slope is then derived from the best-fitting function, as shown in the bottom panels of Figure 1. We observe that reaches its minimum at approximately , the scale that we define as the average radius of the filament. The scatter of this filament radius, , is determined from the 16th and 84th percentile range of the MCMC chains. This value of is similar to the common rough estimate of filament sizes in the literature29, 31, 34, 33, 35, but here we derive it precisely from the number density distribution profiles. We emphasise that the minimal is around , which is not as steep as the halo density profile at the splashback radius (around ). This implies that the edges of the filaments are not as sharp as those of haloes.
The spatial distribution of galaxies can be influenced by RSDs, which alter the galaxy number density profile around filaments. To quantify this effect, we also measure with the RSD-included in MTNG. We assumed a plane-parallel model with the direction as the line of sight (LOS) and we changed the galaxy positions along the direction using the peculiar velocity of the LOS . The results are shown in Figure 2. Additionally, we determined the filament radius in the same manner for the observed galaxy samples of SDSS, but without applying the RSD correction. This allows us to compare the impact of RSD on the determination of the filament radius.
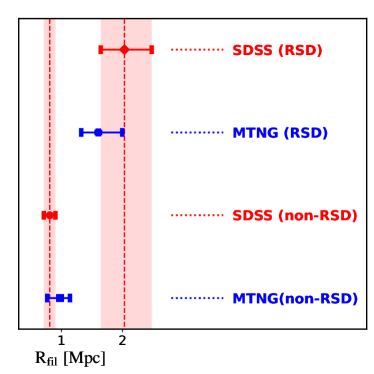
The measurements of in real and redshift spaces in MTNG are consistent with the observations from SDSS, suggesting that the MTNG simulation accurately represents the distribution of galaxies around filaments. Inclusion of RSDs causes the radius of the filament to increase from in the real space to approximately in the redshift space. On smaller scales, the RSDs result in the elongation of galaxy distributions along the LOS, a phenomenon known as the Fingers-of-God effect. As a result, the observed filaments in redshift space also appear thicker. Additionally, the number of filaments identified in SDSS decreases significantly from 9,839 in the non-RSD sample to 5,758 in the RSD sample, representing a decrease of approximately 42%. Similarly, the corresponding numbers for MTNG are 138,737 (non-RSD) and 80,384 (RSD), respectively. This reduction in the number of filaments occurs primarily in short filaments with lengths of a few Mpc, as the identification of these filaments is strongly influenced by RSD.
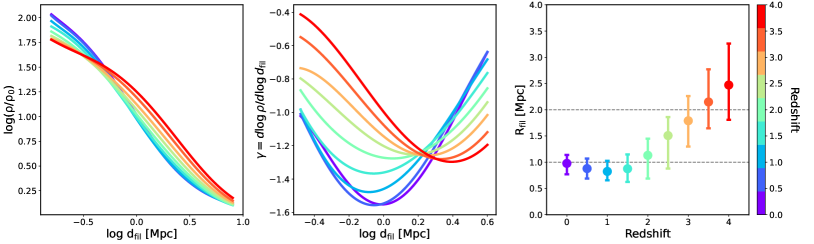
Although we lack observational data in a broad redshift range to quantify the evolution of the filament boundary, we can investigate the trend of with redshift using MTNG. Figure 3 displays the redshift evolution of , and in MTNG from left to right, respectively. It is evident that filament formation has gone through two stages: a rapid radial collapse before and a slower growth along the radial direction afterward. The median filament radius decreases from approximately 2.5 Mpc at to 0.8 Mpc at , representing a 78% decrease in only 4.4 Gyrs. In the following 7.9 Gyrs from to , the median only increases from 0.8 Mpc to 1 Mpc. Furthermore, the slope at decreases from to , sharpening the edges of the filaments.
The development of filaments is accompanied by the accumulation of matter towards the filament spines, which is demonstrated by the considerable increase in the number density of galaxies within the filaments as the redshift decreases (left panel of Figure 3), in agreement with Ref. 43. The galaxy number density profile becomes quite consistent since the formation of filaments around . This suggests that the structure of cosmic filaments was formed essentially around . According to Zel’dovich’s theory, the formation of a filamentary structure occurs after the completion of the wall structure. This implies that the most rapid collapse along the first direction has been finished, and the second direction is now collapsing to form the filaments.
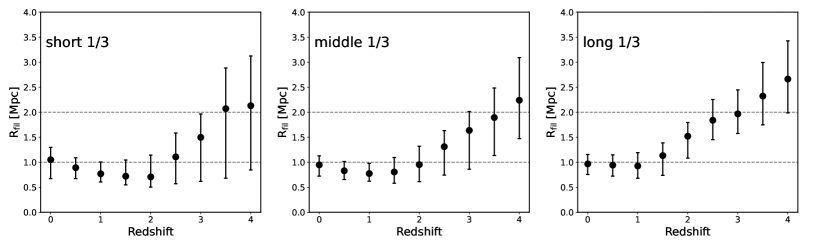
The length of a filament is an important factor in addition to its radius. It has been demonstrated that shorter filaments tend to have a higher galaxy number density, are located in denser environments, and are connected to more massive objects37, 53. Therefore, it is crucial to understand how the filament radius varies with filament length. We divided the filaments into three groups of equal size according to their lengths and present the evolution of their radii in Figure 4. These filaments become progressively thicker with time. The evolutionary patterns observed for filaments of different lengths are quite similar, but longer filaments generally have relatively larger (that is, are thicker) than shorter filaments prior to . Since , the radius of long filaments is roughly constant (right panel), while the median radii for short filaments are slightly increased (left panel) for . This means that the weak growth of the filament radius shown in Figure 3 is mainly driven by the shortest filaments. This phenomenon is likely to be attributed to the fact that short filaments are embedded in denser environments37, 53, facilitating easier matter accretion and growth.
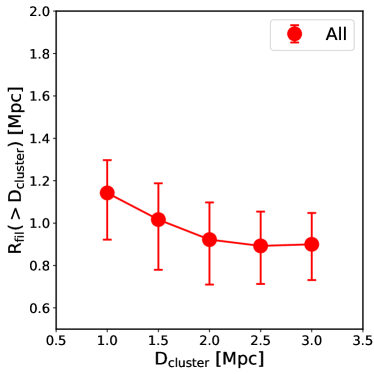
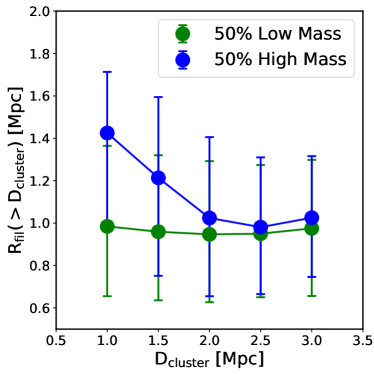
In contrast to long filaments, short filaments appear to be connected to clusters located in node structures. This increase in the filament radii of short filaments is probably due to the accretion of matter near the nodes9, 54, 55, 56. To investigate this, Figure 5 shows the dependence of the filament radius on the distance to the nearest cluster (left panel) and the further dependence on the cluster mass by dividing the connecting clusters into high and low mass halves (right panel). The identification of clusters at the end points of the filaments is provided by DisPerSE 41, 42. We only consider the effect of clusters on the filament radius starting from a distance of from the cluster/node centres, which is approximately the halo virial radius of cluster galaxies. The median radii of the filaments increase towards the clusters, with a growth of around 30% from a distance of to . The right panel of the figure reveals that the increase in is even more pronounced for more massive clusters, although consistent within the errorbars. This suggests that cluster formation is supported by the flow of matter along the filaments since 35.
Summary & Discussion
In this paper, we have developed a physically-motivated definition of the radius of filaments in terms of the minimum slope of the galaxy number density distribution around the filament spines. This approach with a precise value of the radius allows us to quantify the formation and evolution of filamentary structures. Our analysis reveals that the average radius of cosmic filaments in the MTNG simulation at is approximately , which agrees with the filament radius derived from SDSS galaxies after correcting for redshift space distortions (RSD) 46, 45. The presence of RSDs causes a distortion in the spatial distribution of galaxies, leading to an increase in the filament radius in redshift space to around , a result that is also supported by the observed SDSS galaxy sample without the RSD correction. Furthermore, we observe a decreasing trend in the slope () at the radius of the filament from approximately at to approximately at , indicating sharper filament edges. However, these slopes are still higher than the typical slope at the splashback radius of dark matter halos, suggesting that the boundaries of filaments are less sharp compared to those of halos.
We can observe that the formation of filaments occurs in two distinct phases. Before , the filaments undergo rapid collapse, resulting in a significant decrease in their radius from to . By , the filaments are more collapsed in the radial direction, and the galaxy number density profile remains relatively stable. Subsequently, the continued weak growth of the filament radius is driven by the presence of short filaments that connect to the node structures. Additionally, at , filaments that are closer to clusters exhibit larger radii, and this effect seems to be more pronounced for clusters of higher mass.
We anticipate that the outcome of this study will not depend on the specific hydrodynamical simulation employed to explore the filament radius. The filament characteristics (especially the galaxy number density profiles around the filaments) constructed for the TNG simulation suite, which is very similar to the advanced MTNG simulation used here, were found to be in line with those in other hydrodynamical simulations37. In essence, filament formation is mainly driven by the influence of the gravity of the density field37, 43, 44, 57, which is unlikely to be significantly altered by different implementations of baryonic physics in different simulation models. Although we use the galaxy number density as the tracer of the filament structure in both SDSS and MTNG, it has been shown in the simulations that the dark matter, gas and stellar distribution profiles are very consistent with each other around the scales of filament radius53. With ongoing high-redshift galaxy surveys, we will soon be able to further constrain the evolution of the filament radius using high-redshift observational galaxy samples, which will lend itself to an interesting test of the CDM simulation models.
This study is based on observed galaxy samples in the local universe, and these observations are compared to the results of advanced hydrodynamical simulations. The following sections will provide a summary of the data, the sample selection process, the algorithm used to identify filaments, the definition of the filament radius, and the estimation of errors.
Observational data
We adopted two galaxy catalogues obtained from the Sloan Digital Sky Survey (SDSS2). One of the catalogues is derived from the New York University Value-Added Galaxy Catalogue (NYU-VAGC58) of SDSS Data Release 759, while the other is obtained from the galaxy group catalogue45 constructed using SDSS Data Release 1246. The SDSS covers a large area that spans more than a quarter of the sky, providing comprehensive imaging, photometric, and spectroscopic data for a dense sample of galaxies. This allows for a statistically robust analysis of cosmic filaments. Both catalogues comprise approximately 600,000 galaxies with spectroscopic redshifts ranging from 0.01 to 0.20. In the NYU-VAGC catalogue, the galaxy redshifts are not corrected for redshift-space distortions (RSDs), whereas in the galaxy group catalogue, this correction is properly accounted for. For more information on galaxy selection and RSD correction, please refer to the relevant references60, 61, 62, 45.
Numerical simulations
For our numerical simulation sample, we used the galaxy catalogue of the MillenniumTNG project (MTNG; 47, 48, 49). The cosmological parameters adopted by MTNG were taken from the Planck Collaboration 63, which included , , , and . We use the hydrodynamical run with the largest box size, MTNG740, which has a box size of or , identical to the Millennium simulation4, apart from differences in the cosmological parameters. The MTNG run contained dark matter particles and initial gas cells, with mass resolutions of and , respectively. The Friends-of-Friends (FoF; 64, 65, 66, 67) algorithm was first applied to dark matter particles, and then the corresponding baryonic matter was assigned to the same groups as the closest dark matter particle, followed by an application of the SUBFIND-HBT 68 substructure finder. The galaxy positions were determined by the most bound particle of each subhalo.
Sample selection
Taking into account the flux limits of SDSS galaxy samples69, 70 and the mass resolution of the MTNG simulation, we only selected galaxies with a stellar mass greater than for this study. To investigate the effect of RSD, we selected the same set of galaxies in the two SDSS catalogues with and without RSD corrections. We focus only on galaxies more massive than in the redshift range of . The final two SDSS catalogues, labelled as SDSS(non-RSD) and SDSS(RSD), contain 261,354 galaxies. To further account for the incompleteness of low-mass SDSS galaxies, we calculate the galaxy number density profile in SDSS by weighting each galaxy by , where is the maximum accessible volume for each galaxy as determined in the NYU-VAGC catalogue58.
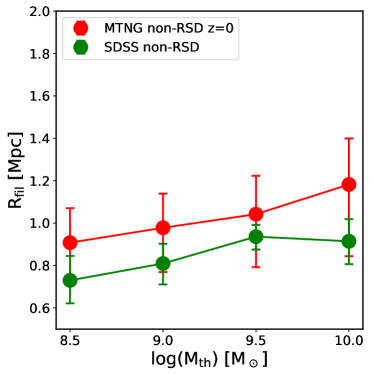
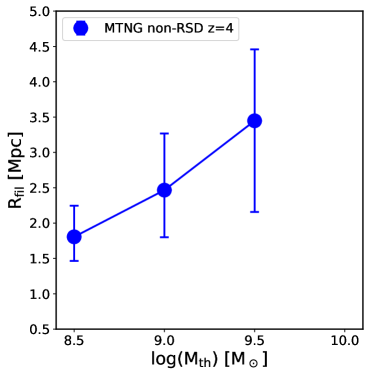
At redshift , the MTNG contains a total of 3,083,441 galaxies with a stellar mass greater than . To account for the RSD effect, we used a plane-parallel approximation with the line of sight (LOS) along the direction. The positions of galaxies along the direction were further distorted by their corresponding peculiar velocity, . The MTNG samples with and without the RSD effect are denoted as MTNG(non-RSD) and MTNG(RSD), respectively. In Figure 6, we investigate the relationship between the average radius of filaments and the threshold mass of galaxies for both MTNG(non-RSD) and SDSS(non-RSD). It is important to mention that the threshold mass of galaxies is used to select the sample before conducting the filament search. This results in variations in the filament samples based on different mass thresholds. The average filament radius increases slightly with the threshold mass . At for MTNG(non-RSD), the average filament radius ranges from approximately for to for . SDSS(non-RSD) exhibits a similar increasing trend, with slightly lower average filament radii compared to MTNG(non-RSD), but still consistent within the large errors. The small offsets between SDSS and MTNG are primarily due to differences in the stellar mass functions of the two samples. We also observed similar trends for the MTNG galaxies at higher redshifts. This consistency aligns with the fact that more massive galaxies tend to inhabit denser environments and reside closer to clusters. Although the level of evolution of the filament radius may differ depending on the tracers used, the general trend remains the same.
Filament finder
We used the Discrete Persistent Structures Extractor (DisPerSE41, 42) – one of the most widely used cosmic web finders – to identify cosmic filaments in this study. To extract the filaments using DisPerSE, we first estimate the underlying density field using the Delaunay tessellation field estimator (hereafter DTFE71, 72) by tracing the density field with a galaxy distribution instead of a matter distribution, due to the observation-driven approach. The DTFE densities are then smoothed once by the average density of the surrounding vertices of a given vertex by applying the netconv function to reduce the contamination of the shot noise. Lastly, filaments are identified using the mse function in the DTFE density field. The mse function identifies the critical points where the density gradient vanishes. Filaments are sets of segments connecting maximum-density critical points to saddles along the density field’s ridges. The persistence significance level of filaments can be controlled by adjusting the ratio of the density of the two critical points in the pair. Following the setup parameters suggested in Ref43, we set the persistence significance level at 2 in DisPerSE. The “filament” defined in Disperse connects the maximum point (density peak) and the saddle point of the density along the direction of the density gradient. We then combine two such filaments sharing the same saddle point into a single one to ensure that the filaments connect the nodes. We refer the readers to Ref41, 43 for more details. With the lower stellar mass threshold of , we found 9,839 and 5,758 filaments in the SDSS(non-RSD) and SDSS(RSD) samples, respectively. Similarly, in the MTNG(non-RSD) and MTNG(RSD) samples, we found 138,737 and 80,384 filaments, respectively.
Definition of filament radius
Analogous to the definition of the splashback radius of a dark matter halo 73, 50, 51, 52, we can determine the physical filament radius from positions with the lowest logarithmic gradient in the galaxy number density profile around the filament spines. As in previous studies 37, 43, 44, we construct the number density profiles of galaxies around filament spines by counting galaxies in hollow cylindrical shells of increasing radii. The average galaxy number density profiles are then obtained by stacking the measurements for all filament segments. To ensure that the resulting galaxy number density profile is not influenced by nodes, we exclude filament segments that are within 2 Mpc of any nodes identified in DisPerSE.
Error estimation
Throughout this paper, we estimate the errors of the galaxy number density profiles using the jackknife resampling technique of 32 subsamples with equal volume in both simulation and observational data74.
The MillenniumTNG simulations will be publicly available on https://www.mtng-project.org in the future. The data we use in this article will be shared upon reasonable request to the corresponding author.
The codes used in this study are available from the corresponding authors upon reasonable request.
References
References
- 1 de Lapparent, V., Geller, M. J. & Huchra, J. P. A Slice of the Universe. ApJ 302, L1 (1986).
- 2 York, D. G. et al. The Sloan Digital Sky Survey: Technical Summary. AJ 120, 1579–1587 (2000). astro-ph/0006396.
- 3 Colless, M. et al. The 2dF Galaxy Redshift Survey: spectra and redshifts. MNRAS 328, 1039–1063 (2001). astro-ph/0106498.
- 4 Springel, V. et al. Simulations of the formation, evolution and clustering of galaxies and quasars. Nature 435, 629–636 (2005). astro-ph/0504097.
- 5 Vogelsberger, M., Marinacci, F., Torrey, P. & Puchwein, E. Cosmological simulations of galaxy formation. Nature Reviews Physics 2, 42–66 (2020). 1909.07976.
- 6 Nelson, D. et al. The illustris simulation: Public data release. Astronomy and Computing 13, 12–37 (2015). 1504.00362.
- 7 Springel, V. et al. First results from the IllustrisTNG simulations: matter and galaxy clustering. MNRAS 475, 676–698 (2018). 1707.03397.
- 8 Nelson, D. et al. The IllustrisTNG simulations: public data release. Computational Astrophysics and Cosmology 6, 2 (2019). 1812.05609.
- 9 Bond, J. R., Kofman, L. & Pogosyan, D. How filaments of galaxies are woven into the cosmic web. Nature 380, 603–606 (1996). astro-ph/9512141.
- 10 Kuutma, T., Tamm, A. & Tempel, E. From voids to filaments: environmental transformations of galaxies in the SDSS. A&A 600, L6 (2017). 1703.04338.
- 11 van Haarlem, M. & van de Weygaert, R. Velocity Fields and Alignments of Clusters in Gravitational Instability Scenarios. ApJ 418, 544 (1993).
- 12 Aragón-Calvo, M. A., van de Weygaert, R., Jones, B. J. T. & van der Hulst, J. M. Spin Alignment of Dark Matter Halos in Filaments and Walls. ApJ 655, L5–L8 (2007). astro-ph/0610249.
- 13 Hahn, O., Porciani, C., Carollo, C. M. & Dekel, A. Properties of dark matter haloes in clusters, filaments, sheets and voids. MNRAS 375, 489–499 (2007). astro-ph/0610280.
- 14 Zhang, Y. et al. The Spin and Orientation of Dark Matter Halos Within Cosmic Filaments. ApJ 706, 747–761 (2009). 0906.1654.
- 15 Forero-Romero, J. E., Contreras, S. & Padilla, N. Cosmic web alignments with the shape, angular momentum and peculiar velocities of dark matter haloes. MNRAS 443, 1090–1102 (2014). 1406.0508.
- 16 Guo, Q., Tempel, E. & Libeskind, N. I. Galaxies in Filaments have More Satellites: The Influence of the Cosmic Web on the Satellite Luminosity Function in the SDSS. ApJ 800, 112 (2015). 1403.5563.
- 17 Codis, S. et al. Connecting the cosmic web to the spin of dark haloes: implications for galaxy formation. MNRAS 427, 3320–3336 (2012). 1201.5794.
- 18 Trowland, H. E., Lewis, G. F. & Bland-Hawthorn, J. The Cosmic History of the Spin of Dark Matter Halos within the Large-scale Structure. ApJ 762, 72 (2013). 1201.6108.
- 19 Dubois, Y. et al. Dancing in the dark: galactic properties trace spin swings along the cosmic web. MNRAS 444, 1453–1468 (2014). 1402.1165.
- 20 Zhang, Y. et al. Spin Alignments of Spiral Galaxies within the Large-scale Structure from SDSS DR7. ApJ 798, 17 (2015). 1409.7150.
- 21 Wang, P. & Kang, X. A general explanation on the correlation of dark matter halo spin with the large-scale environment. MNRAS 468, L123–L127 (2017). 1703.04726.
- 22 Wang, P., Guo, Q., Kang, X. & Libeskind, N. I. The Spin Alignment of Galaxies with the Large-scale Tidal Field in Hydrodynamic Simulations. ApJ 866, 138 (2018). 1810.04581.
- 23 Wang, P. et al. Alignment between Satellite and Central Galaxies in the SDSS DR7: Dependence on Large-scale Environment. ApJ 859, 115 (2018). 1802.10105.
- 24 Libeskind, N. I. et al. Tracing the cosmic web. MNRAS 473, 1195–1217 (2018). 1705.03021.
- 25 Malavasi, N. et al. The VIMOS Public Extragalactic Redshift Survey (VIPERS): galaxy segregation inside filaments at z=0.7. MNRAS 465, 3817–3822 (2017). 1611.07045.
- 26 Laigle, C. et al. COSMOS2015 photometric redshifts probe the impact of filaments on galaxy properties. MNRAS 474, 5437–5458 (2018). 1702.08810.
- 27 Kraljic, K. et al. Galaxy evolution in the metric of the cosmic web. MNRAS 474, 547–571 (2018). 1710.02676.
- 28 Sarron, F., Adami, C., Durret, F. & Laigle, C. Pre-processing of galaxies in cosmic filaments around AMASCFI clusters in the CFHTLS. A&A 632, A49 (2019). 1903.02879.
- 29 Colberg, J. M., Krughoff, K. S. & Connolly, A. J. Intercluster filaments in a CDM Universe. MNRAS 359, 272–282 (2005). astro-ph/0406665.
- 30 Dolag, K., Meneghetti, M., Moscardini, L., Rasia, E. & Bonaldi, A. Simulating the physical properties of dark matter and gas inside the cosmic web. MNRAS 370, 656–672 (2006). astro-ph/0511357.
- 31 Aragón-Calvo, M. A., Platen, E., van de Weygaert, R. & Szalay, A. S. The Spine of the Cosmic Web. ApJ 723, 364–382 (2010). 0809.5104.
- 32 Aragón-Calvo, M. A., van de Weygaert, R. & Jones, B. J. T. Multiscale phenomenology of the cosmic web. MNRAS 408, 2163–2187 (2010). 1007.0742.
- 33 González, R. E. & Padilla, N. D. Automated detection of filaments in the large-scale structure of the Universe. MNRAS 407, 1449–1463 (2010). 0912.0006.
- 34 Bond, N. A., Strauss, M. A. & Cen, R. Crawling the cosmic network: identifying and quantifying filamentary structure. MNRAS 409, 156–168 (2010). 1003.3237.
- 35 Cautun, M., van de Weygaert, R., Jones, B. J. T. & Frenk, C. S. Evolution of the cosmic web. MNRAS 441, 2923–2973 (2014). 1401.7866.
- 36 Bonjean, V., Aghanim, N., Douspis, M., Malavasi, N. & Tanimura, H. Filament profiles from WISExSCOS galaxies as probes of the impact of environmental effects. A&A 638, A75 (2020). 1912.06559.
- 37 Galárraga-Espinosa, D., Aghanim, N., Langer, M., Gouin, C. & Malavasi, N. Populations of filaments from the distribution of galaxies in numerical simulations. A&A 641, A173 (2020). 2003.09697.
- 38 Tanimura, H., Aghanim, N., Bonjean, V., Malavasi, N. & Douspis, M. Density and temperature of cosmic-web filaments on scales of tens of megaparsecs. A&A 637, A41 (2020). 1911.09706.
- 39 Wang, P., Libeskind, N. I., Tempel, E., Kang, X. & Guo, Q. Possible observational evidence for cosmic filament spin. Nature Astronomy 5, 839–845 (2021). 2106.05989.
- 40 Xia, Q., Neyrinck, M. C., Cai, Y.-C. & Aragón-Calvo, M. A. Intergalactic filaments spin. MNRAS 506, 1059–1072 (2021). 2006.02418.
- 41 Sousbie, T. The persistent cosmic web and its filamentary structure - I. Theory and implementation. MNRAS 414, 350–383 (2011). 1009.4015.
- 42 Sousbie, T., Pichon, C. & Kawahara, H. The persistent cosmic web and its filamentary structure - II. Illustrations. MNRAS 414, 384–403 (2011). 1009.4014.
- 43 Galárraga-Espinosa, D. et al. Evolution of cosmic filaments in the MTNG simulation. arXiv e-prints arXiv:2309.08659 (2023). 2309.08659.
- 44 Yang, T., Hudson, M. J. & Afshordi, N. A universal profile for stacked filaments from cold dark matter simulations. MNRAS 516, 6041–6054 (2022). 2203.16170.
- 45 Tempel, E., Tuvikene, T., Kipper, R. & Libeskind, N. I. Merging groups and clusters of galaxies from the SDSS data. The catalogue of groups and potentially merging systems. A&A 602, A100 (2017). 1704.04477.
- 46 Alam, S. et al. The Eleventh and Twelfth Data Releases of the Sloan Digital Sky Survey: Final Data from SDSS-III. ApJS 219, 12 (2015). 1501.00963.
- 47 Hernández-Aguayo, C. et al. The MillenniumTNG Project: high-precision predictions for matter clustering and halo statistics. MNRAS 524, 2556–2578 (2023). 2210.10059.
- 48 Kannan, R. et al. The MillenniumTNG project: the galaxy population at z 8. MNRAS 524, 2594–2605 (2023). 2210.10066.
- 49 Pakmor, R. et al. The MillenniumTNG Project: the hydrodynamical full physics simulation and a first look at its galaxy clusters. MNRAS 524, 2539–2555 (2023). 2210.10060.
- 50 Diemer, B. & Kravtsov, A. V. Dependence of the Outer Density Profiles of Halos on Their Mass Accretion Rate. ApJ 789, 1 (2014). 1401.1216.
- 51 Diemer, B. & Kravtsov, A. V. A Universal Model for Halo Concentrations. ApJ 799, 108 (2015). 1407.4730.
- 52 More, S., Diemer, B. & Kravtsov, A. V. The Splashback Radius as a Physical Halo Boundary and the Growth of Halo Mass. ApJ 810, 36 (2015). 1504.05591.
- 53 Galárraga-Espinosa, D., Langer, M. & Aghanim, N. Relative distribution of dark matter, gas, and stars around cosmic filaments in the IllustrisTNG simulation. A&A 661, A115 (2022). 2109.06198.
- 54 Libeskind, N. I., Knebe, A., Hoffman, Y. & Gottlöber, S. The universal nature of subhalo accretion. MNRAS 443, 1274–1280 (2014). 1407.0394.
- 55 Kang, X. & Wang, P. The Accretion of Dark Matter Subhalos within the Cosmic Web: Primordial Anisotropic Distribution and its Universality. ApJ 813, 6 (2015). 1509.06804.
- 56 Odekon, M. C., Jones, M. G., Graham, L., Kelley-Derzon, J. & Halstead, E. Infall Profiles for Supercluster-scale Filaments. ApJ 935, 130 (2022). 2207.07600.
- 57 Sunseri, J., Li, Z. & Liu, J. Effects of baryonic feedback on the cosmic web. Phys. Rev. D 107, 023514 (2023). 2212.05927.
- 58 Blanton, M. R. et al. New York University Value-Added Galaxy Catalog: A Galaxy Catalog Based on New Public Surveys. AJ 129, 2562–2578 (2005). astro-ph/0410166.
- 59 Abazajian, K. N. et al. The Seventh Data Release of the Sloan Digital Sky Survey. ApJS 182, 543–558 (2009). 0812.0649.
- 60 Yang, X., Mo, H. J. & van den Bosch, F. C. Observational Evidence for an Age Dependence of Halo Bias. ApJ 638, L55–L58 (2006). astro-ph/0509626.
- 61 Yang, X. et al. Galaxy Groups in the SDSS DR4. I. The Catalog and Basic Properties. ApJ 671, 153–170 (2007). 0707.4640.
- 62 Lim, S. H., Mo, H. J., Lu, Y., Wang, H. & Yang, X. Galaxy groups in the low-redshift Universe. MNRAS 470, 2982–3005 (2017). 1706.02307.
- 63 Planck Collaboration et al. Planck 2015 results. XIII. Cosmological parameters. A&A 594, A13 (2016). 1502.01589.
- 64 Huchra, J. P. & Geller, M. J. Groups of Galaxies. I. Nearby groups. ApJ 257, 423–437 (1982).
- 65 Davis, M., Efstathiou, G., Frenk, C. S. & White, S. D. M. The evolution of large-scale structure in a universe dominated by cold dark matter. ApJ 292, 371–394 (1985).
- 66 Springel, V., White, S. D. M., Tormen, G. & Kauffmann, G. Populating a cluster of galaxies - I. Results at z=0. MNRAS 328, 726–750 (2001). astro-ph/0012055.
- 67 Dolag, K., Borgani, S., Murante, G. & Springel, V. Substructures in hydrodynamical cluster simulations. MNRAS 399, 497–514 (2009). 0808.3401.
- 68 Springel, V., Pakmor, R., Zier, O. & Reinecke, M. Simulating cosmic structure formation with the GADGET-4 code. MNRAS 506, 2871–2949 (2021). 2010.03567.
- 69 Brinchmann, J. et al. The physical properties of star-forming galaxies in the low-redshift Universe. MNRAS 351, 1151–1179 (2004). astro-ph/0311060.
- 70 Taylor, E. N. et al. Galaxy And Mass Assembly (GAMA): stellar mass estimates. MNRAS 418, 1587–1620 (2011). 1108.0635.
- 71 Schaap, W. E. & van de Weygaert, R. Continuous fields and discrete samples: reconstruction through Delaunay tessellations. A&A 363, L29–L32 (2000). astro-ph/0011007.
- 72 van de Weygaert, R. & Schaap, W. The Cosmic Web: Geometric Analysis. In Martínez, V. J., Saar, E., Martínez-González, E. & Pons-Bordería, M. J. (eds.) Data Analysis in Cosmology, vol. 665, 291–413 (2009).
- 73 Adhikari, S., Dalal, N. & Chamberlain, R. T. Splashback in accreting dark matter halos. J. Cosmology Astropart. Phys 2014, 019–019 (2014). 1409.4482.
- 74 Guo, H. et al. Redshift-space clustering of SDSS galaxies - luminosity dependence, halo occupation distribution, and velocity bias. MNRAS 453, 4368–4383 (2015). 1505.07861.
This work is supported by the National SKA Program of China (grant No. 2020SKA0110100). PW is sponsored by Shanghai Pujiang Program(No. 22PJ1415100). HG is supported by the CAS Project for Young Scientists in Basic Research (No. YSBR-092) and the science research grants from the China Manned Space Project with NO. CMS-CSST-2021-A02. SB is supported by the UK Research and Innovation (UKRI) Future Leaders Fellowship [grant number MR/V023381/1]. CH-A acknowledges support from the Excellence Cluster ORIGINS which is funded by the Deutsche Forschungsgemeinschaft (DFG, German Research Foundation) under Germany’s Excellence Strategy – EXC-2094 –390783311. We acknowledge the use of the High Performance Computing Resource in the Core Facility for Advanced Research Computing at the Shanghai Astronomical Observatory.
W.W. carried out all measurements and quantitative analysis, contributing to the writing. P.W. conceived the idea of the project, led the writing and discussions. H.G. led the writing, discussions, and the MCMC fitting. All co-authors contributed by their varied contributions to the science interpretation, data analysis All co-authors contributed to the commenting on this manuscript as part of an internal review process.
The authors declare no competing interests.
Correspondence and requests for materials should be addressed to P.W.(pwang@shao.ac.cn) and H.G.(guohong@shao.ac.cn)