12
Simulating the joint evolution of quasars, galaxies
and their large-scale distribution
Volker Springel1, Simon D. M. White1, Adrian Jenkins2, Carlos S. Frenk2,
Naoki Yoshida3, Liang Gao1, Julio Navarro4, Robert Thacker5, Darren Croton1,
John Helly2, John A. Peacock6, Shaun Cole2, Peter Thomas7, Hugh Couchman5,
August Evrard8, Jörg Colberg9 & Frazer Pearce10
1Max-Planck-Institute for Astrophysics, Karl-Schwarzschild-Str. 1, 85740 Garching, Germany
2Inst. for Computational Cosmology, Dep. of Physics, Univ. of
Durham, South Road, Durham DH1 3LE, UK
3Department of Physics, Nagoya University, Chikusa-ku, Nagoya
464-8602, Japan
4Dep. of Physics & Astron., University of
Victoria, Victoria, BC, V8P 5C2, Canada
5Dep. of Physics & Astron., McMaster Univ., 1280 Main
St. West, Hamilton, Ontario, L8S 4M1, Canada
6Institute of Astronomy, University of Edinburgh, Blackford Hill, Edinburgh EH9 3HJ, UK
7Dep. of Physics & Astron., University of
Sussex, Falmer, Brighton BN1 9QH, UK
8Dep. of Physics & Astron., Univ. of Michigan,
Ann Arbor, MI 48109-1120, USA
9Dep. of Physics & Astron., Univ. of Pittsburgh,
3941 O’Hara Street, Pittsburgh PA 15260, USA
10Physics and Astronomy Department, Univ. of Nottingham,
Nottingham NG7 2RD, UK
The cold dark matter model has become the leading theoretical paradigm for the formation of structure in the Universe. Together with the theory of cosmic inflation, this model makes a clear prediction for the initial conditions for structure formation and predicts that structures grow hierarchically through gravitational instability. Testing this model requires that the precise measurements delivered by galaxy surveys can be compared to robust and equally precise theoretical calculations. Here we present a novel framework for the quantitative physical interpretation of such surveys. This combines the largest simulation of the growth of dark matter structure ever carried out with new techniques for following the formation and evolution of the visible components. We show that baryon-induced features in the initial conditions of the Universe are reflected in distorted form in the low-redshift galaxy distribution, an effect that can be used to constrain the nature of dark energy with next generation surveys.
Recent large surveys such as the 2 degree Field Galaxy Redshift Survey (2dFGRS) and the Sloan Digital Sky Survey (SDSS) have characterised much more accurately than ever before not only the spatial clustering, but also the physical properties of low-redshift galaxies. Major ongoing campaigns exploit the new generation of 8m-class telescopes and the Hubble Space Telescope to acquire data of comparable quality at high redshift. Other surveys target the weak image shear caused by gravitational lensing to extract precise measurements of the distribution of dark matter around galaxies and galaxy clusters. The principal goals of all these surveys are to shed light on how galaxies form, to test the current paradigm for the growth of cosmic structure, and to search for signatures which may clarify the nature of dark matter and dark energy. These goals can be achieved only if the accurate measurements delivered by the surveys can be compared to robust and equally precise theoretical predictions. Two problems have so far precluded such predictions: (i) accurate estimates of clustering require simulations of extreme dynamic range, encompassing volumes large enough to contain representative populations of rare objects (like rich galaxy clusters or quasars), yet resolving the formation of individual low luminosity galaxies; (ii) critical aspects of galaxy formation physics are uncertain and beyond the reach of direct simulation (for example, the structure of the interstellar medium, its consequences for star formation and for the generation of galactic winds, the ejection and mixing of heavy elements, AGN feeding and feedback effects …) – these must be treated by phenomenological models whose form and parameters are adjusted by trial and error as part of the overall data-modelling process. We have developed a framework which combines very large computer simulations of structure formation with post-hoc modelling of galaxy formation physics to offer a practical solution to these two entwined problems.
During the past two decades, the cold dark matter (CDM) model, augmented with a dark energy field (which may take the form of a cosmological constant ‘’), has developed into the standard theoretical paradigm for galaxy formation. It assumes that structure grew from weak density fluctuations present in the otherwise homogeneous and rapidly expanding early universe. These fluctuations are amplified by gravity, eventually turning into the rich structure that we see around us today. Confidence in the validity of this model has been boosted by recent observations. Measurements of the cosmic microwave background (CMB) by the WMAP satellite[Bennett2003] were combined with the 2dFGRS to confirm the central tenets of the model and to allow an accurate determination of the geometry and matter content of the Universe about years after the Big Bang[Spergel2003]. The data suggest that the early density fluctuations were a Gaussian random field, as predicted by inflationary theory, and that the current energy density is dominated by some form of dark energy. This analysis is supported by the apparent acceleration of the current cosmic expansion inferred from studies of distant supernovae[Riess1998, Perlmutter1999], as well as by the low matter density derived from the baryon fraction of clusters[White1993].
While the initial, linear growth of density perturbations can be calculated analytically, the collapse of fluctuations and the subsequent hierarchical build-up of structure is a highly nonlinear process which is only accessible through direct numerical simulation[Davis1985]. The dominant mass component, the cold dark matter, is assumed to be made of elementary particles that currently interact only gravitationally, so the collisionless dark matter fluid can be represented by a set of discrete point particles. This representation as an N-body system is a coarse approximation whose fidelity improves as the number of particles in the simulation increases. The high-resolution simulation described here – dubbed the Millennium Simulation because of its size – was carried out by the Virgo Consortium, a collaboration of British, German, Canadian, and US astrophysicists. It follows particles from redshift to the present in a cubic region on a side, where is the expansion factor of the Universe relative to the present and is Hubble’s constant in units of . With ten times as many particles as the previous largest computations of this kind[Colberg2000, Evrard2002, Wambsganss2004] (see Supplementary Information), it offers substantially improved spatial and time resolution within a large cosmological volume. Combining this simulation with new techniques for following the formation and evolution of galaxies, we predict the positions, velocities and intrinsic properties of all galaxies brighter than the Small Magellanic Cloud throughout volumes comparable to the largest current surveys. Crucially, this also allows us to establish evolutionary links between objects observed at different epochs. For example, we demonstrate that galaxies with supermassive central black holes can plausibly form early enough in the standard cold dark matter cosmology to host the first known quasars, and that these end up at the centres of rich galaxy clusters today.
Dark matter halos and galaxies
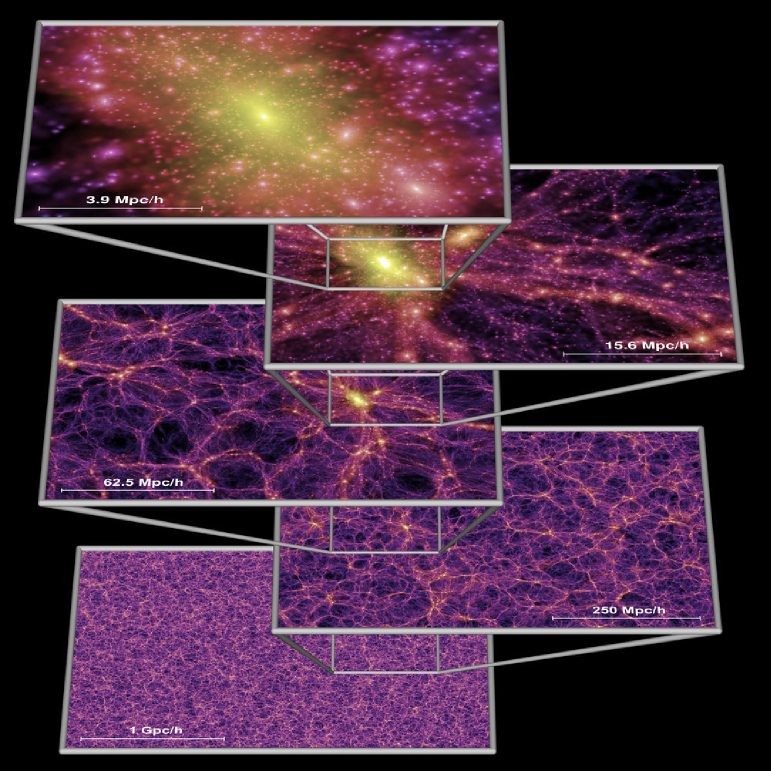
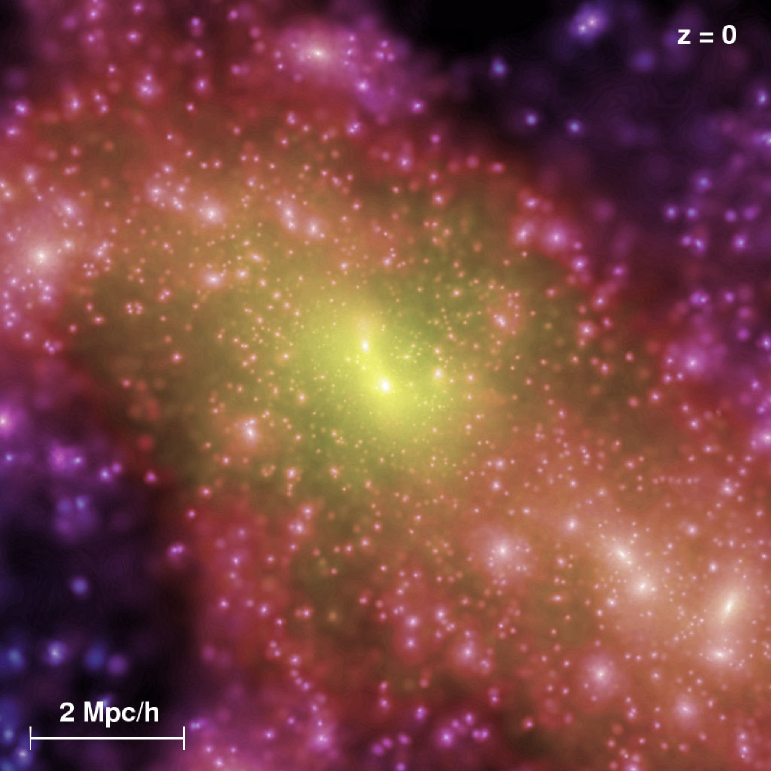
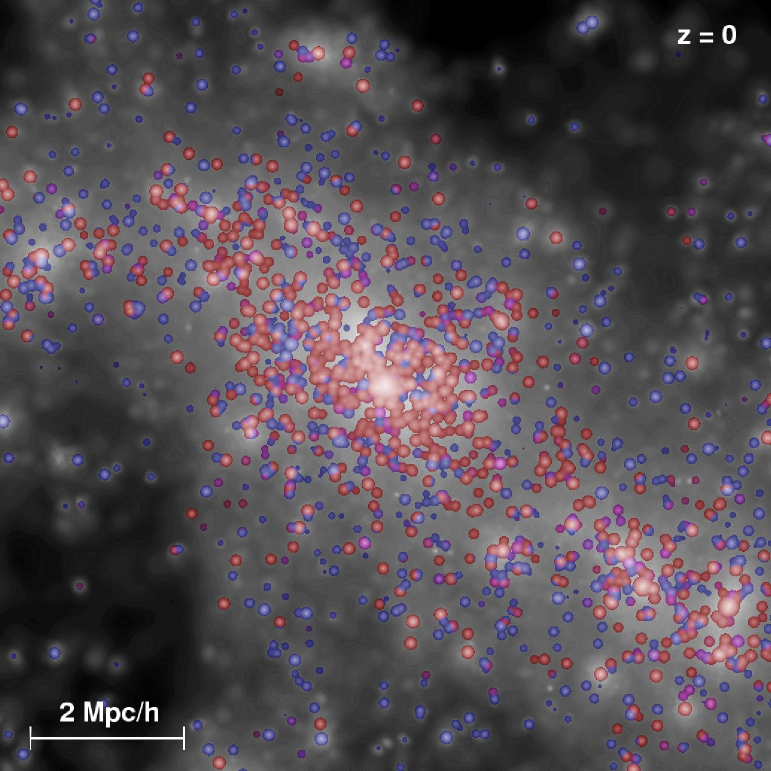
The mass distribution in a CDM universe has a complex topology, often described as a “cosmic web” [Bond1996]. This is visible in full splendour in Fig. 1 (see also the corresponding Supplementary Video). The zoomed out panel at the bottom of the figure reveals a tight network of cold dark matter clusters and filaments of characteristic size . On larger scales, there is little discernible structure and the distribution appears homogeneous and isotropic. Subsequent images zoom in by factors of four onto the region surrounding one of the many rich galaxy clusters. The final image reveals several hundred dark matter substructures, resolved as independent, gravitationally bound objects orbiting within the cluster halo. These substructures are the remnants of dark matter halos that fell into the cluster at earlier times.
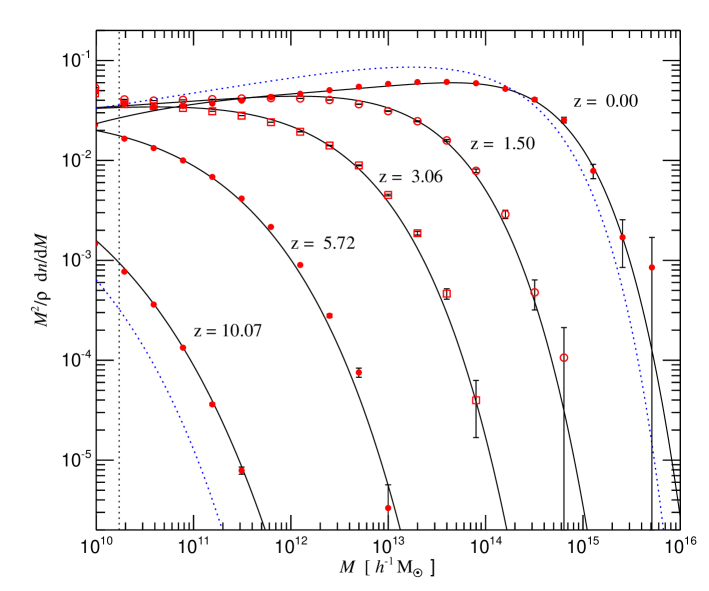
The space density of dark matter halos at various epochs in the simulation is shown in Fig. 2. At the present day, there are about 18 million halos above a detection threshold of 20 particles; 49.6% of all particles are included in these halos. These statistics provide the most precise determination to date of the mass function of cold dark matter halos[Jenkins2001, Reed2003]. In the range that is well sampled in our simulation (, ), our results are remarkably well described by the analytic formula proposed by Jenkins et al.[Jenkins2001] from fits to previous simulations. Theoretical models based on an ellipsoidal excursion set formulation[Sheth2002] give a less accurate, but still reasonable match. However, the commonly used Press-Schechter formula[Press1974] underpredicts the high-mass end of the mass function by up to an order of magnitude. Previous studies of the abundance of rare objects, such as luminous quasars or clusters, based on this formula may contain large errors[Efstathiou1988]. We return below to the important question of the abundance of quasars at early times.
To track the formation of galaxies and quasars in the simulation, we implement a semi-analytic model to follow gas, star and supermassive black hole processes within the merger history trees of dark matter halos and their substructures (see Supplementary Information). The trees contain a total of about 800 million nodes, each corresponding to a dark matter subhalo and its associated galaxies. This methodology allows us to test, during postprocessing, many different phenomenological treatments of gas cooling, star formation, AGN growth, feedback, chemical enrichment, etc. Here, we use an update of models described in[Springel2001b, Kauffmann2000] which are similar in spirit to previous semi-analytic models[WhiteFrenk1991, Kauffmann1993, Cole1994, Baugh1996, Sommerville1999, Kauffmann1999]; the modelling assumptions and parameters are adjusted by trial and error in order to fit the observed properties of low redshift galaxies, primarily their joint luminosity-colour distribution and their distributions of morphology, gas content and central black hole mass. Our use of a high-resolution simulation, particularly our ability to track the evolution of dark matter substructures, removes much of the uncertainty of the more traditional semi-analytic approaches based on Monte-Carlo realizations of merger trees. Our technique provides accurate positions and peculiar velocities for all the model galaxies. It also enables us to follow the evolutionary history of individual objects and thus to investigate the relationship between populations seen at different epochs. It is the ability to establish such evolutionary connections that makes this kind of modelling so powerful for interpreting observational data.
The fate of the first quasars
Quasars are among the most luminous objects in the Universe and can be detected at huge cosmological distances. Their luminosity is thought to be powered by accretion onto a central, supermassive black hole. Bright quasars have now been discovered as far back as redshift (ref. [Fan2003]), and are believed to harbour central black holes of mass a billion times that of the sun. At redshift , their comoving space density is estimated to be (ref. [Fan2004]). Whether such extreme rare objects can form at all in a CDM cosmology is an open question.
A volume the size of the Millennium Simulation should contain, on average, just under one quasar at the above space density. Just what sort of object should be associated with these “first quasars” is, however, a matter of debate. In the local universe, it appears that every bright galaxy hosts a supermassive black hole and there is a remarkably good correlation between the mass of the central black hole and the stellar mass or velocity dispersion of the bulge of the host galaxy[Tremaine2002]. It would therefore seem natural to assume that at any epoch, the brightest quasars are always hosted by the largest galaxies. In our simulation, ‘large galaxies’ can be identified in various ways, for example, according to their dark matter halo mass, stellar mass, or instantaneous star formation rate. We have identified the 10 ‘largest’ objects defined in these three ways at redshift . It turns out that these criteria all select essentially the same objects: the 8 largest galaxies by halo mass are identical to the 8 largest galaxies by stellar mass, only the ranking differs. Somewhat larger differences are present when galaxies are selected by star formation rate, but the 4 first-ranked galaxies are still amongst the 8 identified according to the other 2 criteria.
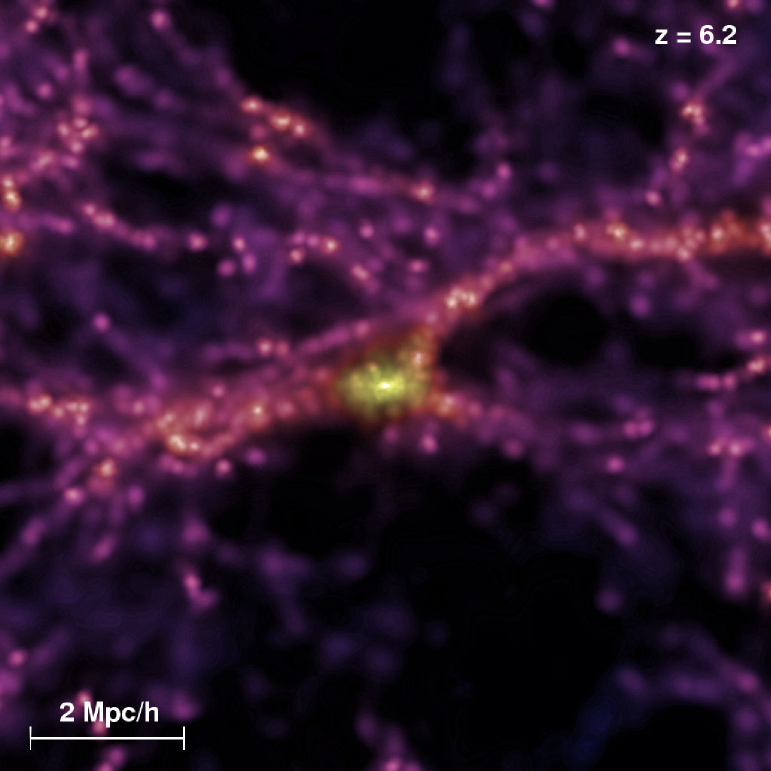
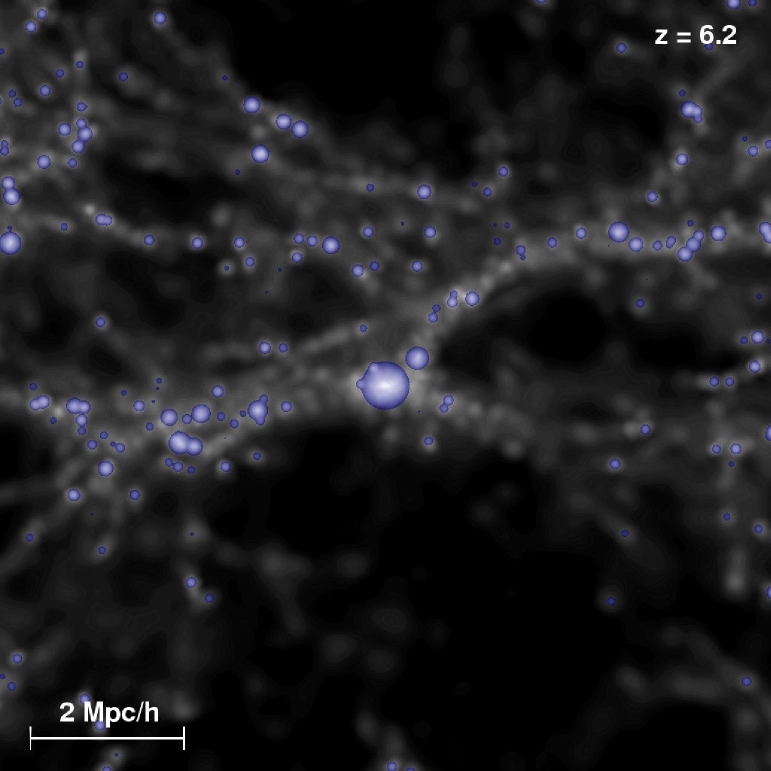
In Figure 3, we illustrate the environment of a “first quasar” candidate in our simulation at . The object lies on one of the most prominent dark matter filaments and is surrounded by a large number of other, much fainter galaxies. It has a stellar mass of , the largest in the entire simulation at , a dark matter virial mass of , and a star formation rate of . In the local universe central black hole masses are typically of the bulge stellar mass[Merrit2001], but in the model we test here these massive early galaxies have black hole masses in the range , significantly larger than low redshift galaxies of similar stellar mass. To attain the observed luminosities, they must convert infalling mass to radiated energy with a somewhat higher efficiency than the expected for accretion onto a non-spinning black hole.
Within our simulation we can readily address fundamental questions such as: “Where are the descendants of the early quasars today?”, or “What were their progenitors?”. By tracking the merging history trees of the host halos, we find that all our quasar candidates end up today as central galaxies in rich clusters. For example, the object depicted in Fig. 3 lies, today, at the centre of the ninth most massive cluster in the volume, of mass . The candidate with the largest virial mass at (which has stellar mass , virial mass , and star formation rate ) ends up in the second most massive cluster, of mass . Following the merging tree backwards in time, we can trace our quasar candidate back to redshift , when its host halo had a mass of only . At this epoch, it is one of just 18 objects that we identify as collapsed systems with particles. These results confirm the view that rich galaxy clusters are rather special places. Not only are they the largest virialised structures today, they also lie in the regions where the first structures developed at high redshift. Thus, the best place to search for the oldest stars in the Universe or for the descendants of the first supermassive black holes is at the centres of present-day rich galaxy clusters.
The clustering evolution of dark matter and galaxies
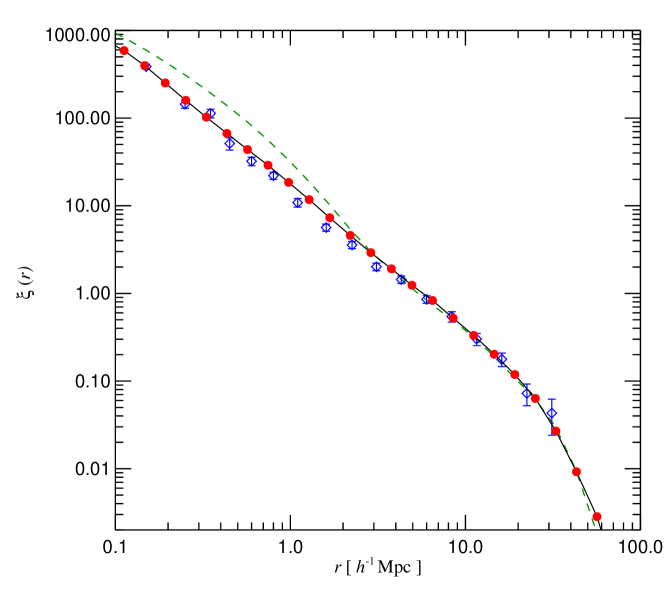
The combination of a large-volume, high-resolution N-body simulation with realistic modelling of galaxies enables us to make precise theoretical predictions for the clustering of galaxies as a function of redshift and intrinsic galaxy properties. These can be compared directly with existing and planned surveys. The 2-point correlation function of our model galaxies at redshift is plotted in Fig. 4 and is compared with a recent measurement from the 2dFGRS[Hawkins2003]. The prediction is remarkably close to a power-law, confirming with much higher precision the results of earlier semi-analytic[Kauffmann1999, Benson2000] and hydrodynamic[Weinberg2004] simulations. This precision will allow interpretation of the small, but measurable deviations from a pure power-law found in the most recent data[Padilla2003, Zehavi2004]. The simple power-law form contrasts with the more complex behaviour exhibited by the dark matter correlation function but is really no more than a coincidence. Correlation functions for galaxy samples with different selection criteria or at different redshifts do not, in general, follow power-laws.
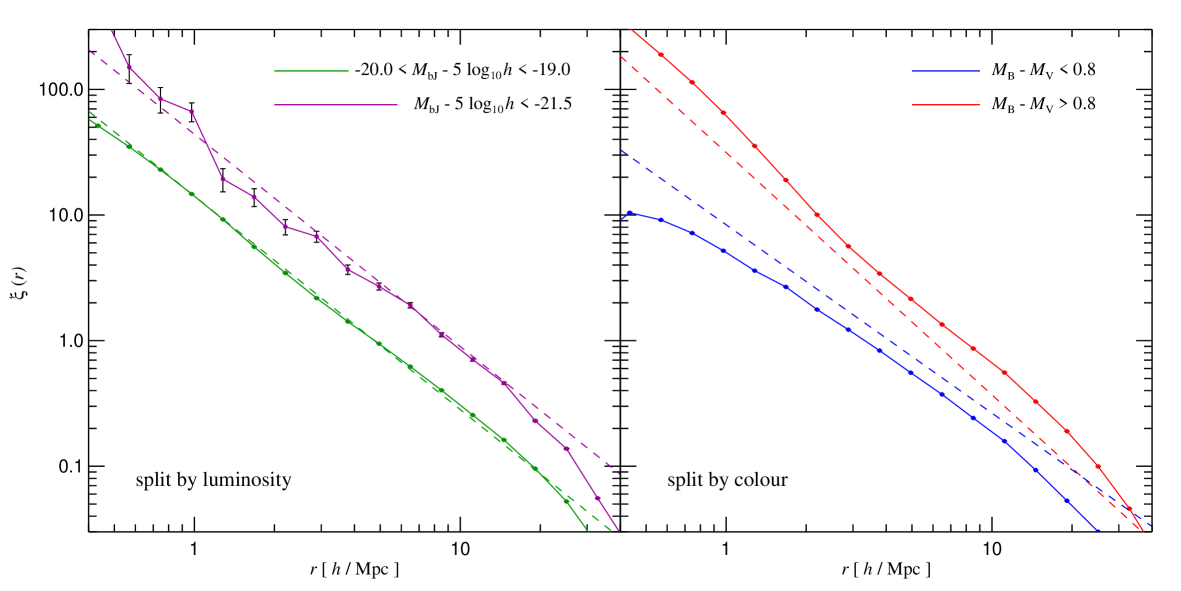
Although our semi-analytic model was not tuned to match observations of galaxy clustering, in not only produces the excellent overall agreement shown in Fig. 4, but also reproduces the observed dependence of clustering on magnitude and colour in the 2dFGRS and SDSS[Norberg2001, Zehavi2002, Madgwick2003], as shown in Figure 5. The agreement is particularly good for the dependence of clustering on luminosity. The colour dependence of the slope is matched precisely, but the amplitude difference is greater in our model than is observed[Madgwick2003]. Note that our predictions for galaxy correlations split by colour deviate substantially from power-laws. Such predictions can be easily tested against survey data in order to clarify the physical processes responsible for the observed difference.
In contrast to the near power-law behaviour of galaxy correlations on small scales, the large-scale clustering pattern may show interesting structure. Coherent oscillations in the primordial plasma give rise to the well-known acoustic peaks in the CMB[deBernardis2000, Mauskopf2000, Spergel2003] and also leave an imprint in the linear power spectrum of the dark matter. Detection of these “baryon wiggles” would not only provide a beautiful consistency check for the cosmological paradigm, but could also have important practical applications. The characteristic scale of the wiggles provides a “standard ruler” which may be used to constrain the equation of state of the dark energy[Blake2003]. A critical question when designing future surveys is whether these baryon wiggles are present and are detectable in the galaxy distribution, particularly at high redshift.
On large scales and at early times, the mode amplitudes of the dark matter power spectrum grow linearly, roughly in proportion to the cosmological expansion factor. Nonlinear evolution accelerates the growth on small scales when the dimensionless power approaches unity; this regime can only be studied accurately using numerical simulations. In the Millennium Simulation, we are able to determine the nonlinear power spectrum over a larger range of scales than was possible in earlier work[Jenkins1998], almost five orders of magnitude in wavenumber .
At the present day, the acoustic oscillations in the matter power spectrum are expected to fall in the transition region between linear and nonlinear scales. In Fig. 6, we examine the matter power spectrum in our simulation in the region of the oscillations. Dividing by the smooth power spectrum of a CDM model with no baryons[Bardeen1986] highlights the baryonic features in the initial power spectrum of the simulation, although there is substantial scatter due to the small number of large-scale modes. Since linear growth preserves the relative mode amplitudes, we can approximately correct for this scatter by scaling the measured power in each bin by a multiplicative factor based on the initial difference between the actual bin power and the mean power expected in our CDM model. This makes the effects of nonlinear evolution on the baryon oscillations more clearly visible. As Fig. 6 shows, nonlinear evolution not only accelerates growth but also reduces the baryon oscillations: scales near peaks grow slightly more slowly than scales near troughs. This is a consequence of the mode-mode coupling characteristic of nonlinear growth. In spite of these effects, the first two “acoustic peaks” (at and , respectively) in the dark matter distribution do survive in distorted form until the present day (see the lower right panel of Fig. 6).
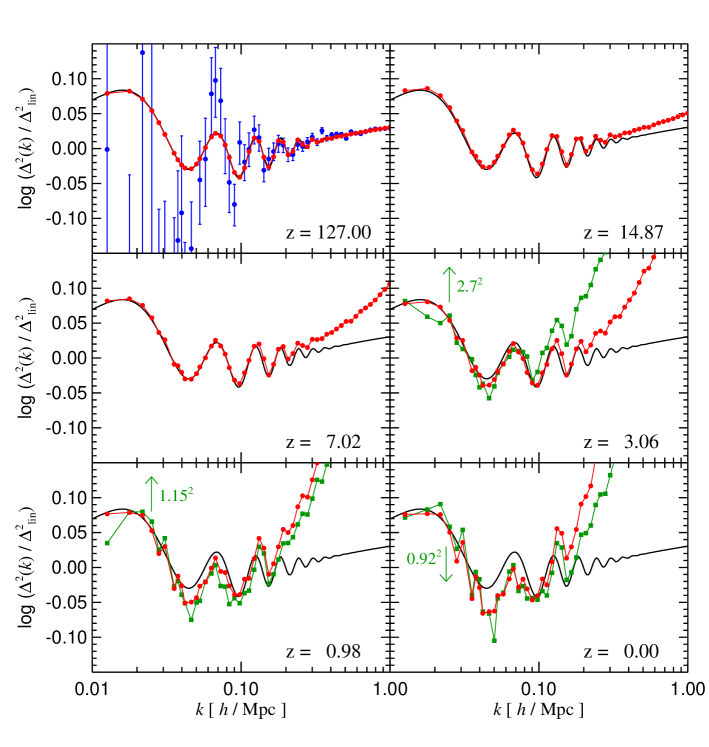
Are the baryon wiggles also present in the galaxy distribution? Fig. 6 shows that the answer to this important question is ‘yes’. The panel shows the power spectrum for all model galaxies brighter than . On the largest scales, the galaxy power spectrum has the same shape as that of the dark matter, but with slightly lower amplitude corresponding to an “antibias” of 8%. Samples of brighter galaxies show less antibias while for the brightest galaxies, the bias becomes slightly positive. The figure also shows measurements of the power spectrum of luminous galaxies at redshifts and . Galaxies at were selected to have a magnitude in the restframe, whereas galaxies at were selected to have stellar mass larger than , corresponding to a space density of , similar to that of the Lyman-break galaxies observed at [Adelberger1998]. Signatures of the first two acoustic peaks are clearly visible at both redshifts, even though the density field of the galaxies is much more strongly biased with respect to the dark matter (by a factor ) than at low redshift. Selecting galaxies by their star formation rate rather than their stellar mass (above for an equal space density at ) produces very similar results.
Our analysis demonstrates conclusively that baryon wiggles should indeed be present in the galaxy distribution out to redshift . This has been assumed but not justified in recent proposals to use evolution of the large-scale galaxy distribution to constrain the nature of the dark energy. To establish whether the baryon oscillations can be measured in practice with the requisite accuracy will require detailed modelling of the selection criteria of an actual survey and a thorough understanding of the systematic effects that will inevitably be present in real data. These issues can only be properly addressed by means of specially designed mock catalogues constructed from realistic simulations. We plan to construct suitable mock catalogues from the Millennium Simulation and make them publicly available. Our provisional conclusion, however, is that the next generation of galaxy surveys offers excellent prospects for constraining the equation of state of the dark energy.
N-body simulations of CDM universes are now of such size and quality that realistic modelling of galaxy formation in volumes matched to modern surveys has become possible. Detailed studies of galaxy and AGN evolution exploiting the unique dataset of the Millennium Simulation therefore enable stringent new tests of the theory of hierarchical galaxy formation. Using the simulation we demonstrated that quasars can plausibly form sufficiently early in a CDM universe to be compatible with observation, that their progenitors were already massive by , and that their descendents lie at the centres of cD galaxies in rich galaxy clusters. Interesting tests of our predictions will become possible if observations of the black hole demographics can be extended to high redshift, allowing, for example, a measurement of the evolution of the relationship between supermassive black hole masses and the velocity dispersion of their host stellar bulges.
We have also demonstrated that a power-law galaxy autocorrelation function can arise naturally in a CDM universe, but that this suggestively simple behaviour is merely a coincidence. Galaxy surveys will soon reach sufficient statistical power to measure precise deviations from power-laws for galaxy subsamples, and we expect that comparisons of the kind we have illustrated will lead to tight constraints on the physical processes included in the galaxy formation modelling. Finally, we have demonstrated for the first time that the baryon-induced oscillations recently detected in the CMB power spectrum should survive in distorted form not only in the nonlinear dark matter power spectrum at low redshift, but also in the power spectra of realistically selected galaxy samples at . Present galaxy surveys are marginally able to detect the baryonic features at low redshifts[Cole2005, Eisenstein2005]. If future surveys improve on this and reach sufficient volume and galaxy density also at high redshift, then precision measurements of galaxy clustering will shed light on one of the most puzzling components of the universe, the elusive dark energy field.
Methods
The Millennium Simulation was carried out with a specially customised version of the GADGET2 (Ref. [Springel2001]) code, using the “TreePM” method[Xu1995] for evaluating gravitational forces. This is a combination of a hierarchical multipole expansion, or “tree” algorithm[Barnes1986], and a classical, Fourier transform particle-mesh method[Hockney1981]. The calculation was performed on 512 processors of an IBM p690 parallel computer at the Computing Centre of the Max-Planck Society in Garching, Germany. It utilised almost all the 1 TB of physically distributed memory available. It required about processor hours of CPU time, or 28 days of wall-clock time. The mean sustained floating point performance (as measured by hardware counters) was about 0.2 TFlops, so the total number of floating point operations carried out was of order .
The cosmological parameters of our CDM-simulation are: , , , , , and . Here denotes the total matter density in units of the critical density for closure, . Similarly, and denote the densities of baryons and dark energy at the present day. The Hubble constant is parameterised as , while is the rms linear mass fluctuation within a sphere of radius extrapolated to . Our adopted parameter values are consistent with a combined analysis of the 2dFGRS[Colless2001] and first year WMAP data[Spergel2003].
The simulation volume is a periodic box of size and individual particles have a mass of . This volume is large enough to include interesting rare objects, but still small enough that the halos of all luminous galaxies brighter than are resolved with at least 100 particles. At the present day, the richest clusters of galaxies contain about 3 million particles. The gravitational force law is softened isotropically on a comoving scale of (Plummer-equivalent), which may be taken as the spatial resolution limit of the calculation. Thus, our simulation achieves a dynamic range of in 3D, and this resolution is available everywhere in the simulation volume.
Initial conditions were laid down by perturbing a homogeneous, ‘glass-like’, particle distribution[White1996] with a realization of a Gaussian random field with the CDM linear power spectrum as given by the Boltzmann code CMBFAST[Seljak1996]. The displacement field in Fourier space was constructed using the Zel’dovich approximation, with the amplitude of each random phase mode drawn from a Rayleigh distribution. The simulation started at redshift and was evolved to the present using a leapfrog integration scheme with individual and adaptive timesteps, with up to timesteps for individual particles. We stored the full particle data at 64 output times, each of size 300 GB, giving a raw data volume of nearly 20 TB. This allowed the construction of finely resolved hierarchical merging trees for tens of millions of halos and for the subhalos that survive within them. A galaxy catalogue for the full simulation, typically containing galaxies at together with their full histories, can then be built for any desired semi-analytic model in a few hours on a high-end workstation.
The semi-analytic model itself can be viewed as a simplified simulation of the galaxy formation process, where the star formation and its regulation by feedback processes is parameterised in terms of simple analytic physical models. These models take the form of differential equations for the time evolution of the galaxies that populate each hierarchical merging tree. In brief, these equations describe radiative cooling of gas, star formation, growth of supermassive black holes, feedback processes by supernovae and AGN, and effects due to a reionising UV background. In addition, the morphological transformation of galaxies and the process of metal enrichment are modelled as well. To make direct contact with observational data, we apply modern population synthesis models to predict spectra and magnitudes for the stellar light emitted by galaxies, also including simplified models for dust obscuration. In this way we can match the passbands commonly used in observations.
The basic elements of galaxy formation modelling follow previous studies[WhiteFrenk1991, Kauffmann1993, Cole1994, Baugh1996, Sommerville1999, Kauffmann1999, Springel2001b] (see also Supplementary Information), but we also use novel approaches in a number of areas. Of substantial importance is our tracking of dark matter substructure. This we carry out consistently and with unprecedented resolution throughout our large cosmological volume, allowing an accurate determination of the orbits of galaxies within larger structures, as well as robust estimates of the survival time of structures infalling into larger objects. Also, we use dark matter substructure properties, like angular momentum or density profile, to directly determine sizes of galactic disks and their rotation curves. Secondly, we employ a novel model for the build-up of a population of supermassive black holes in the universe. To this end we extend the quasar model developed in previous work[Kauffmann2000] with a ‘radio mode’, which describes the feedback activity of central AGN in groups and clusters of galaxies. While largely unimportant for the cumulative growth of the total black hole mass density in the universe, our results show that the radio mode becomes important at low redshift, where it has a strong impact on cluster cooling flows. As a result, it reduces the brightness of central cluster galaxies, an effect that shapes the bright end of the galaxy luminosity function, bringing our predictions into good agreement with observation.
Supplementary Information
accompanies the paper on www.nature.com/nature.
Acknowledgements
We would like to thank the anonymous referees who helped to improve the paper substantially. The computations reported here were performed at the Rechenzentrum der Max-Planck-Gesellschaft in Garching, Germany.
Competing interests
The authors declare that they have no competing financial interests.
Correspondence
and requests for materials should be addressed to V.S. (email: vspringel@mpa-garching.mpg.de).
Simulating the joint evolution of quasars, galaxies
and their large-scale distribution
Supplementary Information
This document provides supplementary information for the above article in Nature. We detail the physical model used to compute the galaxy population, and give a short summary of our simulation method. Where appropriate, we give further references to relevant literature for our methodology.
Characteristics of the simulation
Numerical simulations are a primary theoretical tool to study the nonlinear gravitational growth of structure in the Universe, and to link the initial conditions of cold dark matter (CDM) cosmogonies to observations of galaxies at the present day. Without direct numerical simulation, the hierarchical build-up of structure with its three-dimensional dynamics would be largely inaccessible.
Since the dominant mass component, the dark matter, is assumed to consist of weakly interacting elementary particles that interact only gravitationally, such simulations use a set of discrete point particles to represent the collisionless dark matter fluid. This representation as an N-body system is obviously only a coarse approximation, and improving its fidelity requires the use of as many particles as possible while remaining computationally tractable. Cosmological simulations have therefore always striven to increase the size (and hence resolution) of N-body computations, taking advantage of every advance in numerical algorithms and computer hardware. As a result, the size of simulations has grown continually over the last four decades. Fig. Characteristics of the simulation shows the progress since 1970. The number of particles has increased exponentially, doubling roughly every 16.5 months. Interestingly, this growth parallels the empirical ‘Moore’s Law’ used to describe the growth of computer performance in general. Our new simulation discussed in this paper uses an unprecedentedly large number of particles, more than . We were able to finish this computation in 2004, significantly ahead of a simple extrapolation of the past growth rate of simulation sizes. The simulation represented a substantial computational challenge that required novel approaches both for the simulation itself, as well as for its analysis. We describe the most important of these aspects in the following. As an aside, we note that extrapolating the remarkable progress since the 1970s for another three decades, we may expect cosmological simulations with particles some time around 2035. This would be sufficient to represent all stars in a region as large as the Millennium volume with individual particles.
![[Uncaptioned image]](/html/astro-ph/0504097/assets/x10.png)
Particle number in high resolution N-body simulations of cosmic structure formation as a function of publication date[Peebles1970, Miyoshi1975, White1976, Aarseth1979, Efstathiou1981, Davis1985, White1987, Carlberg1989, Suto1991, Warren1992, Gelb1994, Zurek1994, Jenkins1998, Governato1999, Bode2001, Colberg2000, Wambsganss2004]. Over the last three decades, the growth in simulation size has been exponential, doubling approximately every months (blue line). Different symbols are used for different classes of computational algorithms. The particle-mesh (PM) method combined with direct particle-particle (PP) summation on sub-grid scales has long provided the primary path towards higher resolution. However, due to their large dynamic range and flexibility, tree algorithms have recently become competitive with these traditional schemes, particularly if combined with PM methods to calculate the long-range forces. Plain PM simulations[Klypin1983, White1983, Centrella1983, Park1990, Bertschinger1991] have not been included in this overview because of their much lower spatial resolution for a given particle number. Note also that we focus on the largest simulations at a given time, so our selection of simulations does not represent a complete account of past work on cosmological simulations.
![[Uncaptioned image]](/html/astro-ph/0504097/assets/x11.png)
![[Uncaptioned image]](/html/astro-ph/0504097/assets/x12.png)
Different realizations of the initial power spectrum. The top and bottom panels show measured power-spectra for 20 realizations of initial conditions with different random number seeds, together with the mean spectrum (red symbols). The latter lies close to the input linear power spectrum (black solid line). In the bottom panel, the measurements have been divided by a smooth CDM-only power spectrum[Bardeen1986] to highlight the acoustic oscillations. One of the realizations has been drawn in blue; it shows a fluctuation pattern that superficially resembles the pattern around the second acoustic peak. However, this is a chance effect; the fluctuations of each bin are independent.
Initial conditions.
We used the Boltzmann code CMBFAST[Seljak1996] to compute a linear theory power spectrum of a CDM model with cosmological parameters consistent with recent constraints from WMAP and large-scale structure data[Spergel2003, Seljak2004]. We then constructed a random realization of the model in Fourier space, sampling modes in a sphere up to the Nyquist frequency of our particle load. Mode amplitudes were determined by random sampling from a Rayleigh distribution with second moment equal to , while phases were chosen randomly. A high quality random number generator with period was used for this purpose. We employed a massively parallel complex-to-real Fourier transform (which requires some care to satisfy all reality constraints) to directly obtain the resulting displacement field in each dimension. The initial displacement at a given particle coordinate of the unperturbed density field was obtained by tri-linear interpolation of the resulting displacement field, with the initial velocity obtained from the Zel’dovich approximation. The latter is very accurate for our starting redshift of . For the initial unperturbed density field of particles we used a glass-like particle distribution. Such a glass is formed when a Poisson particle distribution in a periodic box is evolved with the sign of gravity reversed until residual forces have dropped to negligible levels[White1996]. For reasons of efficiency, we replicated a glass file 8 times in each dimension to generate the initial particle load. The Fast Fourier Transforms (FFT) required to compute the displacement fields were carried out on a mesh using 512 processors and a distributed-memory code. We deconvolved the input power spectrum for smoothing effects due to the interpolation off this grid.
We note that the initial random number seed was picked in an unconstrained fashion. Due to the finite number of modes on large scales and the Rayleigh-distribution of mode amplitudes, the mean power of the actual realization in each bin is expected to scatter around the linear input power spectrum. Also, while the expectation value is equal to the input power spectrum, the median power per mode is biased low due to the skew-negative distribution of the mode amplitudes. Hence, in a given realization there are typically more points lying below the input power spectrum than above it, an effect that quickly becomes negligible as the number of independent modes in each bin becomes large. We illustrate this in the top panel of Figure Characteristics of the simulation, where 20 realizations for different random number seeds of the power spectrum on large scales are shown, together with the average power in each bin. Our particular realization for the Millennium Simulation corresponds to a slightly unlucky choice of random number seed in the sense that the fluctuations around the mean input power in the region of the second peak seem to resemble the pattern of the acoustic oscillations (see the top left panel of Figure 6 in our Nature article). However, we stress that the fluctuations in these bins are random and uncorrelated, and that this impression is only a chance effect. In the bottom panel of Figure Characteristics of the simulation, we redraw the measured power spectra for the 20 random realizations, this time normalised to a smooth CDM power spectrum without acoustic oscillations in order to highlight the baryonic ‘wiggles’. We have drawn one of the 20 realizations in blue. It is one that resembles the pattern of fluctuations seen in the Millennium realization quite closely while others scatter quite differently, showing that such deviations are consistent with the expected statistical distribution.
Dynamical evolution.
The evolution of the simulation particles under gravity in an expanding background is governed by the Hamiltonian
| (1) |
where . The are comoving coordinate vectors, and the corresponding canonical momenta are given by . The explicit time dependence of the Hamiltonian arises from the evolution of the scale factor, which is given by the Friedman-Lemaitre model that describes the background cosmology. Due to our assumption of periodic boundary conditions for a cube of size , the interaction potential is the solution of
| (2) |
where the sum over extends over all integer triplets. The density distribution function of a single particle is spread over a finite scale , the gravitational softening length. The softening is necessary to make it impossible for hard binaries to form and to allow the integration of close particle encounters with low-order integrators. We use a spline kernel to soften the point mass, given by , where for , for , and otherwise. For this choice, the Newtonian potential of a point mass at zero lag in non-periodic space is , the same as for a ‘Plummer-sphere’ of size , and the force becomes fully Newtonian for separations larger than . We took , about times smaller than the mean particle separation. Note that the mean density is subtracted in equation (2), so the solution of the Poisson equation corresponds to the peculiar potential, where the dynamics of the system is governed by .
The equations of motion corresponding to equation (1) are simple differential equations, which are however coupled tightly by the mutual gravitational forces between the particles. An accurate evaluation of these forces (the ‘right hand side’ of the equations) is computationally very expensive, even when force errors up to can be tolerated, which is usually the case in collisionless dynamics[Hernquist1993]. We have written a completely new version of the cosmological simulation code GADGET[Springel2001] for this purpose. Our principal computational technique for the gravitational force calculation is a variant of the ‘TreePM’ method[Xu1995, Bode2000, Bagla2002], which uses a hierarchical multipole expansion[Barnes1986] (a ‘tree’ algorithm) to compute short-range gravitational forces and combines this with a more traditional particle-mesh (PM) method[Hockney1981] to determine long-range gravitational forces. This combination allows for a very large dynamic range and high computational speed even in situations where the clustering becomes strong. We use an explicit force-split[Bagla2002] in Fourier-space, which produces a highly isotropic force law and negligible force errors at the force matching scale. The algorithms in our code are specially designed for massively parallel operation and contain explicit communication instructions such that the code can work on computers with distributed physical memory, a prerequisite for a simulation of the size and computational cost of the Millennium Run.
![[Uncaptioned image]](/html/astro-ph/0504097/assets/x13.png)
The power spectrum of the dark matter distribution in the Millennium Simulation at various epochs (blue lines). The gray lines show the power spectrum predicted for linear growth, while the dashed line denotes the shot-noise limit expected if the simulation particles are a Poisson sampling from a smooth underlying density field. In practice, the sampling is significantly sub-Poisson at early times and in low density regions, but approaches the Poisson limit in nonlinear structures. Shot-noise subtraction allows us to probe the spectrum slightly beyond the Poisson limit. Fluctuations around the linear input spectrum on the largest scales are due to the small number of modes sampled at these wavelengths and the Rayleigh distribution of individual mode amplitudes assumed in setting up the initial conditions. To indicate the bin sizes and expected sample variance on these large scales, we have included symbols and error bars in the estimates. On smaller scales, the statistical error bars are negligibly small.
For the tree-algorithm, we first decompose the simulation volume spatially into compact domains, each served by one processor. This domain decomposition is done by dividing a space filling Peano-Hilbert curve into segments. This fractal curve visits each cell of a fiducial grid of cells overlayed over the simulation exactly once. The decomposition tries to achieve a work-load balance for each processor, and evolves over time as clustering progresses. Using the Peano-Hilbert curve guarantees that domain boundaries are always parallel to natural tree-node boundaries, and thanks to its fractal nature provides for a small surface-to-volume ratio for all domains, such that communication with neighbouring processors during the short-range tree force computation can be minimised. Our tree is fully threaded (i.e. its leaves are single particles), and implements an oct-tree structure with monopole moments only. The cell-opening criterion was relative[Salmon1994]; a multipole approximation was accepted if its conservatively estimated error was below of the total force from the last timestep. In addition, nodes were always opened when the particle under consideration lay inside a 10% enlarged outer node boundary. This procedure gives forces with typical errors well below .
For the PM algorithm, we use a parallel Fast Fourier Transform (FFT)111Based on the www.fftw.org libraries of MIT. to solve Poisson’s equation. We used a FFT mesh with cells, distributed into 512 slabs of dimension for the parallel transforms. After clouds-in-cells (CIC) mass assignment to construct a density field, we invoke a real-to-complex transform to convert to Fourier space. We then multiplied by the Greens function of the Poisson equation, deconvolved for the effects of the CIC and the trilinear interpolation that is needed later, and applied the short-range filtering factor used in our TreePM formulation (the short range forces suppressed here are exactly those supplied by the tree-algorithm). Upon transforming back we obtained the gravitational potential. We then applied a four-point finite differencing formula to compute the gravitational force field for each of the three coordinate directions. Finally, the forces at each particle’s coordinate were obtained by trilinear interpolation from these fields.
A particular challenge arises due to the different data layouts needed for the PM and tree algorithms. In order to keep the required communication and memory overhead low, we do not swap the particle data between the domain and slab decompositions. Instead, the particles stay in the domain decomposition needed by the tree, and each processor constructs patches of the density field for all the slabs on other processors which overlap its local domain. In this way, each processor communicates only with a small number of other processors to establish the binned density field on the slabs. Likewise, the slab-decomposed potential field is transfered back to processors so that a local region is formed covering the local domain, in addition to a few ghost cells around it, such that the finite differencing of the potential can be carried out for all interior points.
Timestepping was achieved with a symplectic leap-frog scheme based on a split of the potential energy into a short-range and long-range component. The short-range dynamics was then integrated by subcycling the long-range step[Duncan1998]. Hence, while the short-range force had to be computed frequently, the long-range FFT force was needed only comparatively infrequently. More than 11000 timesteps in total were carried out for the simulation, using individual and adaptive timesteps222Allowing adaptive changes of timesteps formally breaks the symplectic nature of our integration scheme, which is however not a problem for the dynamics we follow here. for the particles. A timestep of a particle was restricted to be smaller than , where is a particle’s acceleration and controls the integration accuracy. We used a binary hierarchy of timesteps to generate a grouping of particles onto timebins.
The memory requirement of the code had to be aggressively optimised in order to make the simulation possible on the IBM p690 supercomputer available to us. The total aggregated memory on the 512 processors was 1 TB, of which about 950 GB could be used freely by an application program. In our code Lean-GADGET-2 produced for the Millennium Simulation, we needed about 400 GB for particle storage and 300 GB for the fully threaded tree in the final clustered particle state, while the PM algorithm consumed in total about 450 GB in the final state (due to growing variations in the volume of domains as a result of our work-load balancing strategy, the PM memory requirements increase somewhat with time). Note that the memory for tree and PM computations is not needed concurrently, and this made the simulation feasible. The peak memory consumption per processor reached 1850 MB at the end of our simulation, rather close to the maximum possible of 1900 MB.
![[Uncaptioned image]](/html/astro-ph/0504097/assets/x14.png)
Measured distribution of mode amplitudes in the Millennium Simulation at redshift . Only modes in the -range are included (in total 341 modes), with their amplitude normalised to the square root of the expected linear power spectrum at that redshift. The distribution of modes follows the expected Rayleigh distribution very well. The bottom panel shows the relative deviations of the measurements from this distribution, which are in line with the expected statistical scatter.
On the fly analysis.
With a simulation of the size of the Millennium Run, any non-trivial analysis step is demanding. For example, measuring the dark matter mass power spectrum over the full dynamic range of the simulation volume would require a 3D FFT with cells per dimension, which is unfeasible at present. In order to circumvent this problem, we employed a two stage procedure for measuring the power spectrum where a “large-scale” and a “small-scale” measurement were combined. The former was computed with a Fourier transform of the whole simulation box, while the latter was constructed by folding the density field back onto itself[Jenkins1998], assuming periodicity for a fraction of the box. The self-folding procedure leads to a sparser sampling of Fourier space on small scales, but since the number of modes there is large, an accurate small-scale measurement is still achieved. Since the PM-step of the simulation code already computes an FFT of the whole density field, we took advantage of this and embedded a measurement of the power spectrum directly into the code. The self-folded spectrum was computed for a 32 times smaller periodic box-size, also using a mesh, so that the power spectrum measurement effectively corresponded to a mesh. We have carried out a measurement each time a simulation snapshot was generated and saved on disk. In Figure Dynamical evolution., we show the resulting time evolution of the dark matter power spectrum in the Millennium Simulation. On large scales and at early times, the mode amplitudes grow linearly, roughly in proportion to the cosmological expansion factor. Nonlinear evolution accelerates the growth on small scales when the dimensionless power approaches unity; this regime can only be studied accurately using numerical simulations. In the Millennium Simulation, we are able to determine the nonlinear power spectrum over a larger range of scales than was possible in earlier work[Jenkins1998], almost five orders of magnitude in wavenumber .
On the largest scales, the periodic simulation volume encompasses only a relatively small number of modes and, as a result of the Rayleigh amplitude sampling that we used, these (linear) scales show substantial random fluctuations around the mean expected power. This also explains why the mean power in the -range lies below the linear input power. In Figure Dynamical evolution., we show the actual distribution of normalised mode amplitudes, , measured directly for this range of wavevectors in the Millennium Simulation at redshift . We see that the distribution of mode amplitudes is perfectly consistent with the expected underlying Rayleigh distribution.
Useful complementary information about the clustering of matter in real space is provided by the two-point correlation function of dark matter particles. Measuring it involves, in principle, simply counting the number of particle pairs found in spherical shells around a random subset of all particles. Naive approaches to determine these counts involve an -scaling of the operation count and are prohibitive for our large simulation. We have therefore implemented novel parallel methods to measure the two-point function accurately, which we again embedded directly into the simulation code, generating a measurement automatically at every output. Our primary approach to speeding up the pair-count lies in using the hierarchical grouping provided by the tree to search for particles around a randomly selected particle. Since we use logarithmic radial bins for the pair counts, the volume corresponding to bins at large radii is substantial. We use the tree for finding neighbours with a range-searching technique. In carrying out the tree-walk, we check whether a node falls fully within the volume corresponding to a bin. In this case, we terminate the walk along this branch of the tree and simply count all the particles represented by the node at once, leading to a significant speed-up of the measurement.
Finally, the exceptionally large size of the simulation prompted us to develop new methods for computing friends-of-friends (FOF) group catalogues in parallel and on the fly. The FOF groups are defined as equivalence classes in which any pair of particles belongs to the same group if their separation is less than 0.2 of the mean particle separation. This criterion combines particles into groups with a mean overdensity that corresponds approximately to the expected density of virialised groups. Operationally, one can construct the groups by starting from a situation in which each particle is first in its own single group, and then testing all possible particle pairs; if a close enough pair is found whose particles lie in different groups already present, the groups are linked into a common group. Our algorithm represents groups as link-lists, with auxiliary pointers to a list’s head, tail, and length. In this way we can make sure that, when groups are joined, the smaller of two groups is always attached to the tail of the larger one. Since each element of the attached group must be visited only once, this procedure avoids a quadratic contribution to the operation count proportional to the group size when large groups are built up. Our parallel algorithm works by first determining the FOF groups on local domains, again exploiting the tree for range searching techniques, allowing us to find neighbouring particles quickly. Once this first step of group finding for each domain is finished, we merge groups that are split by the domain decomposition across two or several processors. As groups may in principle percolate across several processors, special care is required in this step as well. Finally, we save a group catalogue to disk at each output, keeping only groups with at least 20 particles.
In summary, the simulation code evolved the particle set for more than 11000 timesteps, producing 64 output time slices each of about 300 GB. Using parallel I/O techniques, each snapshot could be written to disk in about 300 seconds. Along with each particle snapshot, the simulation code produced a FOF group catalogue, a power spectrum measurement, and a two-point correlation function measurement. Together, over TB of data were generated by the simulation. The raw particle data of each output was stored in a special way (making use of a space-filling curve), which allows rapid direct access to subvolumes of the particle data. The granularity of these subvolumes corresponds to a fiducial mesh overlayed over the simulation volume, such that the data can be accessed randomly in pieces of particles on average. This storage scheme is important to allow efficient post-processing, which cannot make use of an equally powerful supercomputer as the simulation itself.
![[Uncaptioned image]](/html/astro-ph/0504097/assets/x15.png)
Schematic organisation of the merger tree in the Millennium Run. At each output time, FOF groups are identified which contain one or several (sub)halos. The merger tree connects these halos. The FOF groups play no direct role, except that the largest halo in a given FOF group is the one which may develop a cooling flow according to the physical model for galaxy formation implemented for the trees. To facilitate the latter, a number of pointers for each halo are defined. Each halo knows its descendant, and its most massive progenitor. Possible further progenitors can be retrieved by following the chain of ‘next progenitors’. In a similar fashion, all halos in a given FOF group are linked together.
Postprocessing of the simulation data
Substructure analysis.
High-resolution simulations like the present one exhibit a rich substructure of gravitationally bound dark matter subhalos orbiting within larger virialised structures[Ghigna1998]. The FOF group finder built into the simulation code is able to identify the latter, but not the ‘subhalos’. In order to follow the fate of infalling halos and galaxies more reliably, we therefore determine dark matter substructures for all identified FOF halos. We accomplish this with an improved and extended version of the SUBFIND algorithm[Springel2001b]. This computes an adaptively smoothed dark matter density field using a kernel-interpolation technique, and then exploits the topological connectivity of excursion sets above a density threshold to identify substructure candidates. Each substructure candidate is subjected to a gravitational unbinding procedure. If the remaining bound part has more than 20 particles, the subhalo is kept for further analysis and some basic physical properties (angular momentum, maximum of its rotation curve, velocity dispersion, etc.) are determined. An identified subhalo was extracted from the FOF halo, so that the remainder formed a featureless ‘background’ halo which was also subjected to an unbinding procedure. The required computation of the gravitational potential for the unbinding was carried out with a tree algorithm similar to the one used in the simulation code itself.
Finally, we also compute a virial mass estimate for each FOF halo in this analysis step, using the spherical-overdensity approach and the minimum of the gravitational potential within the group as the central point. We identified FOF groups at , down from a maximum of at , where the groups are more abundant yet smaller on average. At , we found a total of subhalos, and the largest FOF group contained 2328 of them.
Merger tree definition and construction.
Having determined all halos and subhalos at all output times, we tracked these structures over time, i.e. we determined the hierarchical merging trees that describe in detail how structures build up over cosmic time. These trees are the key information needed to compute physical models for the properties of the associated galaxy population.
Because structures merge hierarchically in CDM universes, a given halo can have several progenitors but, in general, it has only one descendant because the cores of virialised dark matter structures do not split up into two or more objects. We therefore based our merger tree construction on the determination of a unique descendant for any given halo. This is, in fact, already sufficient to define the merger tree construction, since the progenitor information then follows implicitly.
To determine the appropriate descendant, we use the unique IDs that label each particle and track them between outputs. For a given halo, we find all halos in the subsequent output that contain some of its particles. We count these particles in a weighted fashion, giving higher weight to particles that are more tightly bound in the halo under consideration. In this way, we give preference to tracking the fate of the inner parts of a structure, which may survive for a long time upon infall into a bigger halo, even though much of the mass in the outer parts can be quickly stripped. The weighting is facilitated by the fact that the results of the SUBFIND analysis are stored in order of increasing total binding energy, i.e. the most bound particle of a halo is always stored first. Once these weighted counts are determined for each potential descendant, we select the one with the highest count as the descendant. As an additional refinement (which is not important for any of our results), we have allowed some small halos to skip one snapshot in finding a descendant. This deals with cases where we would otherwise lose track of a structure that temporarily fluctuates below our detection threshold.
In Figure On the fly analysis., we show a schematic representation of the merger tree constructed in this way. The FOF groups are represented at different times with boxes each of which contains one or more (sub)halos. For each halo, a unique descendant is known, and there are link-list structures that allow the retrieval of all progenitors of a halo, or of all other halos in the same FOF group. Not all the trees in the simulation volume are connected with each other. Instead, there are separate trees, each essentially describing the formation history of the galaxies contained in a FOF halo at the present time. The correspondence between trees and FOF halos is not exactly one-to-one because some small FOF halos did not contain a bound subhalo and were dropped, or because some FOF halos can be occasionally linked by feeble temporary particle bridges which then also combines their corresponding trees. We have stored the resulting tree data on a per-tree basis, so that the physical model for galaxy formation can be computed sequentially for all the trees individually, instead of having to apply the model in one single step. The latter would have been impossible, given that the trees contain a total of around 800 million halos.
Physical model for galaxy formation
‘Semi-analytic’ models of galaxy formation were first proposed more than a decade ago[White1991]. They have proven to be a very powerful tool for advancing the theory of galaxy formation[Kauffmann1993, Cole1994, Kauffmann1996, Kauffmann1997, Baugh1998, Sommerville1999, Cole2000, Benson2002], even though much of the detailed physics of star formation and its regulation by feedback processes has remained poorly understood. The term ‘semi-analytic’ conveys the notion that while in this approach the physics is parameterised in terms of simple analytic models, following the dark matter merger trees over time can only be carried out numerically. Semi-analytic models are hence best viewed as simplified simulations of the galaxy formation process. While the early work employed Monte-Carlo realizations of dark matter trees[Kauffmann1993tree, Somerville1999tree], more recent work is able to measure the merging trees directly from numerical dark matter simulations[Kauffmann1999]. In the most sophisticated version of this technique, the approach is extended to include dark matter substructure information as well[Springel2001b]. This offers substantially improved tracking of the orbits of infalling substructure and of their lifetimes. In the Millennium Simulation, we have advanced this method further still, using improved substructure finding and tracking methods, allowing us fully to exploit the superior statistics and information content offered by the underlying high-resolution simulation.
Our semi-analytic model integrates a number of differential equations for the time evolution of the galaxies that populate each hierarchical merging tree. In brief, these equations describe radiative cooling of gas, star formation, the growth of supermassive black holes, feedback processes by supernovae and AGN, and effects due to a reionising UV background. Morphological transformation of galaxies and processes of metal enrichment are modelled as well. Full details of the scheme used to produce specific models shown in our Nature article will be provided in a forthcoming publication[Croton2005], but we here include a very brief summary of the most important aspects of the model. Note, however, that this is just one model among many that can be implemented in post-processing on our stored Millennium Run data-structures. A prime goal of our project is to evaluate such schemes against each other and against the observational data in order to understand which processes determine the various observational properties of the galaxy population.
Radiative cooling and star formation.
We assume that each virialised dark matter halo contains (initially) a baryonic fraction equal to the universal fraction of baryons, , which is consistent with WMAP and Big-Bang nucleosynthesis constraints. A halo may lose some gas temporarily due to heating by a UV background or other feedback processes, but this gas is assumed to be reaccreted once the halo has grown in mass sufficiently. The influence of the UV background is directly taken into account as a reduction of the baryon fraction for small halos, following fitting functions obtained from detailed hydrodynamical models[Gnedin2000, Kravtsov2004].
We distinguish between cold condensed gas in the centre of halos (forming the interstellar medium), and hot gas in the diffuse atmospheres of halos. The latter has a temperature equal to the virial temperature of the halo, and emits bremsstrahlung and line radiation. The corresponding cooling rate is estimated following standard parameterisations[White1991, Springel2001b], which have been shown to provide accurate matches to direct hydrodynamical simulations of halo formation including radiative cooling[Yoshida2002, Helly2003]. We note that, following the procedures established already in reference[White1991], the cooling model accounts for a distinction between a cold infall regime and cooling out of a hot atmosphere. The transition is at a mass scale close to that found in detailed analytic calculations of the cooling process[Forcado1997, Birnboim2003] and in recent hydrodynamical simulations[Keres2004].
The cooling gas is assumed to settle into a disk supported by rotation. We directly estimate the disk size based on the spin parameter of the hosting dark matter halo[Mo1998]. Once the gas surface density exceeds a critical threshold motivated by observations[Kauffmann1996b], we assume that star formation proceeds in the disk, with an efficiency of order on a disk dynamical time. This parameterisation reproduces the phenomenological laws of star formation in observed disk galaxies[Kennicutt1989, Kennicutt1998] and the observed gas fractions at low redshift.
Supernova explosions associated with short-lived massive stars are believed to regulate star formation in galaxies, particularly in small systems with shallow potential wells[Dekel1986]. Observations suggest that supernovae blow gas out of star-forming disks, with a rate that is roughly proportional to the total amount of stars formed[Martin1999]. We adopt this observational scaling, and estimate how much of this gas can join the hot halo of the galaxy given the total amount of energy released by the supernovae, and how much may be blown out of the halo entirely. The efficiency of such mass-loss is a strong function of the potential well depth of the galaxy. In our model, small galaxies may blow away their remaining gas entirely in an intense burst of star formation, while large galaxies do not exhibit any outflows.
Morphological evolution.
We characterise galaxy morphology by a simple bulge-to-disk ratio which can be transformed into an approximate Hubble type according observational trends[Simien1986]. While the generic mode of gas cooling leads to disk formation, we consider two possible channels for the formation of bulges: secular evolution due to disk instabilities, or as a consequence of galaxy merger events.
Secular evolution can trigger bar and bulge formation in disk galaxies. We invoke simple stability arguments for self-gravitating stellar disks[Mo1998] to determine the mass of stars that needs to be put into a nuclear bulge component to render the stellar disk stable.
Galaxy mergers are described by the halo merger tree constructed from the simulation, augmented with a timescale for the final stages of a merger whenever we lose track of a substructure due to finite spatial and time resolution. We then estimate the remaining survival time in a standard fashion based on the dynamical friction timescale. We use the mass ratio of two merging galaxies to distinguish between two classes of mergers. Minor mergers involve galaxies with mass ratio less than . In this case, we assume that the disk of the larger galaxy survives, while the merging satellite becomes part of the bulge component. For larger mass ratios, we assume a major merger takes place, leading to destruction of both disks, and reassembly of all stars in a common spheroid. Such an event is the channel through which pure elliptical galaxies can form. The cold gas in the satellite of a minor merger, or the cold gas in both galaxies of a major merger, is assumed to be partially or fully consumed in a nuclear starburst in which additional bulge stars are formed. The detailed parameterisation of such induced starbursts follows results obtained from systematic parameter studies of hydrodynamical galaxy collision simulations[Mihos1994, Mihos1996, Cox2004].
Spectrophotometric modelling.
To make direct contact with observational data, it is essential to compute spectra and magnitudes for the model galaxies, in the passbands commonly used in observations. Modern population synthesis models allow an accurate prediction of spectrophotometric properties of stellar populations as a function of age and metallicity[Bruzual1993, Bruzual2003]. We apply such a model[Bruzual2003] and compute magnitudes in a number of passbands separately for both bulge and disk components and in both rest- and observer-frames. Dust obscuration effects are difficult to model in general and present a major source of uncertainty, especially for simulated galaxies at high redshift. We apply a rather simple plane-parallel slab dust model[Kauffmann1999], as a first-order approximation to dust extinction.
Metal enrichment of the diffuse gas component can also be important, because it affects both cooling rates in moderately sized halos and galaxy colours through the population synthesis models. Our treatment of metal enrichment and transport is close to an earlier semi-analytic model[DeLucia2004]. In it, metals produced and released by massive stars are placed first into the cold star forming gas, from which they can be transported into the diffuse hot halo or into the intergalactic medium by supernova feedback. We assume a homogenous metallicity (i.e. perfect mixing) within each of the gas components, although the hot and cold gas components can have different metallicities.
Active galactic nuclei.
Supermassive black holes are believed to reside at the centre of most, if not all, spheroidal galaxies, and during their active phases they power luminous quasars and active galactic nuclei. There is substantial observational evidence that suggests a connection between the formation of galaxies and the build-up of supermassive black holes (BH). In fact, the energy input provided by BHs may play an important role in shaping the properties of galaxies[Silk1998, DiMatteo2005, Springel2005a], and in reionising the universe[Haardt1996, Madau2004].
Our theoretical model for galaxy and AGN formation extends an earlier semi-analytic model for the joint build-up of the stellar and supermassive black hole components[Kauffmann2000]. This adopts the hypothesis that quasar phases are triggered by galaxy mergers. In these events, cold gas is tidally forced into the centre of a galaxy where it can both fuel a nuclear starburst and be available for central AGN accretion. We parameterise the efficiency of the feeding process of the BHs as in the earlier work[Kauffmann2000], and normalise it to reproduce the observed scaling relation between the bulge mass and the BH mass at the present epoch[Magorrian1998, Ferrarese2000]. This ‘quasar mode’ of BH evolution provides the dominant mass growth of the BH population, with a total cumulative accretion rate that peaks at , similar to the observed population of quasars.
A new aspect of our model is the addition of a ‘radio mode’ of BH activity, motivated by the observational phenomenology of nuclear activity in groups and clusters of galaxies. Here, accretion onto nuclear supermassive BHs is accompanied by powerful relativistic jets which can inflate large radio bubbles in clusters, and trigger sound waves in the intracluster medium (ICM). The buoyant rise of the bubbles[Churazov2001, Brueggen2002] together with viscous dissipation of the sound waves[Fabian2003] is capable of providing a large-scale heating of the ICM, thereby offsetting cooling losses[Vecchia2004]. These physical processes are arguably the most likely explanation of the ‘cooling-flow puzzle’: the observed absence of the high mass dropout rate expected due to the observed radiative cooling in clusters of galaxies. We parameterise the radio mode as a mean heating rate into the hot gas proportional to the mass of the black hole and to the power of the temperature of the hot gas. The prefactor is set by requiring a good match to the bright end of the observed present-day luminosity function of galaxies. The latter is affected strongly by the radio mode, which reduces the supply of cold gas to massive central galaxies and thus shuts off their star formation. Without the radio mode, central cluster galaxies invariably become too bright and too blue due to excessive cooling flows. The total BH accretion rate in this radio mode becomes significant only at very low redshift, but it does not contribute significantly to the cumulative BH mass density at the present epoch.