Possible observational evidence that cosmic filaments spin
Abstract
Most cosmological structures in the universe spin. Although structures in the universe form on a wide variety of scales from small dwarf galaxies to large super clusters, the generation of angular momentum across these scales is poorly understood. We have investigated the possibility that filaments of galaxies - cylindrical tendrils of matter hundreds of millions of light-years across, are themselves spinning. By stacking thousands of filaments together and examining the velocity of galaxies perpendicular to the filament’s axis (via their red and blue shift), we have found that these objects too display motion consistent with rotation making them the largest objects known to have angular momentum. The strength of the rotation signal is directly dependent on the viewing angle and the dynamical state of the filament. Just as it is easiest to measure rotation in a spinning disk galaxy viewed edge on, so too is filament rotation clearly detected under similar geometric alignment. Furthermore, the mass of the haloes that sit at either end of the filaments also increases the spin speed. The more massive the haloes, the more rotation is detected. These results signify that angular momentum can be generated on unprecedented scales.
Leibniz-Institut für Astrophysik Potsdam, An der Sternwarte 16, D-14482 Potsdam, Germany.
University of Lyon; UCB Lyon 1/CNRS/IN2P3; IPN Lyon (IPNL), France.
Tartu Observatory, University of Tartu, Observatooriumi 1, 61602 Tõravere, Estonia.
Zhejiang University-Purple Mountain Observatory Joint Research Center for Astronomy, Zhejiang University, Hangzhou 310027, China.
Purple Mountain Observatory, No. 10 Yuan Hua Road, 210034 Nanjing, China.
Shanghai Astronomical Observatory, Nandan Road 80, Shanghai 200030, China.
Introduction
How angular momentum is generated in a cosmological context is one of the key unsolved problems of cosmology. In the standard model of structure formation, small overdensities present in the early universe grow via gravitational instability as matter flows from under to overdense regions. Such a potential flow is irrotational or curl-free: there is no primordial rotation in the early universe and angular momentum must be generated as structures form.
Tidal torque theory (1969ApJ…155..393P, ; 1970Afz…..6..581D, ; 1970Ap……6..320D, ; 1984ApJ…286…38W, ; 1987ApJ…319..575B, ; 1993ApJ…418..544V, ; 1996ApJS..103….1B, ; 1999A&A…343..663P, ; 2002MNRAS.332..325P, ) provides one explanation - the misalignment of the inertia tensor of a gravitationally collapsing region of space with the tidal (shear) field can give rise to torques which spin up the collapsing material (1969ApJ…155..393P, ; 1970Ap……6..320D, ; 1999A&A…343..663P, ). Such an explanation is valid only in the linear regime namely in limit where density perturbations are small with respect to the mean and where flows are laminar. As a collapsing region reaches turn-around tidal torques cease to be effective and the final angular momentum of a collapsed region is far from what tidal torque theory would predict (2002MNRAS.332..325P, ; 2016IAUS..308..421P, ). Although one recent study (2020arXiv200304800M, ) has demonstrated that galaxy spin direction (i.e. clockwise versus counter clockwise) can be predicted from initial conditions, revealing a critical clue to the non-linear acquisition of angular momentum, our understanding of spin magnitude, direction and history remains in its infancy. Regions that are still in the linear or quasi-linear phase of collapse could provide a better stage for the application of tidal torque theory.
Cosmic filaments (1996Natur.380..603B, ), being quasi-linear extended topographical features of the galaxy distribution, provide such an environment. Yet, owing to the challenges in characterizing and identifying such objects, potential rotation on the scales of cosmic filaments has been discussed (2020OJAp….3E…3N, ) but never measured until now.
It is known that the cosmic web in general and filaments, in particular, are intimately connected with galaxy formation and evolution (2012MNRAS.427.3320C, ; 2019OJAp….2E…7A, ). They also have a strong effect on galaxy spin (2000ApJ…532L…5L, ; 2007ApJ…671.1248L, ; 2007ApJ…655L…5A, ; 2013MNRAS.428.2489L, ; 2013MNRAS.428.1827T, ; 2015ApJ…798…17Z, ), often regulating the direction of how galaxies 2013ApJ…775L..42T ; 2014MNRAS.444.1453D ; 2014MNRAS.443.1090F ; 2015MNRAS.452.3369C ; 2016MNRAS.457..695P ; 2018ApJ…866..138W ; 2018MNRAS.481.4753C ; 2019ApJ…876…52K ; 2020MNRAS.491.2864W ; 2020MNRAS.493..362K and their dark matter halos rotate 2007MNRAS.375..489H ; 2007MNRAS.381…41H ; 2009ApJ…706..747Z ; 2013ApJ…762…72T ; 2015MNRAS.446.2744L ; 2017MNRAS.468L.123W ; 2018MNRAS.473.1562W ; 2019ApJ…872…37L ; 2018MNRAS.481..414G ; 2019MNRAS.487.1607G . However, it is not known whether the current understanding of structure formation predicts that filaments themselves, being uncollapsed quasi-linear objects should spin. A recent study (published on the ArXiv while this draft was being finalized) (2020arXiv200602418X, ) examined the velocity field around galactic filaments defined by halo pairs in a large -body simulation and found a statistically significant rotation signal. This is an intriguing finding and, although filaments and their rotation speed are defined differently, the current work is in which the observed galaxy distribution is examined in a bid to find possible filament rotation was partly motivated by the theoretical suggestion that filaments may spin (2020arXiv200602418X, ).
Results
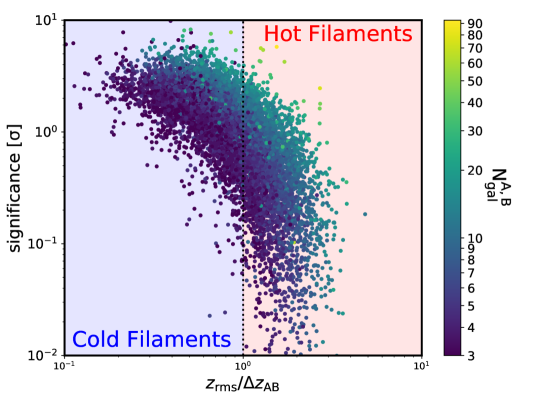
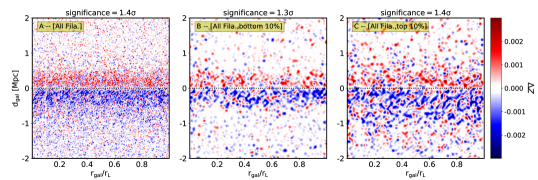
After segmenting the galaxy distribution into filaments using a marked point process known as the Bisous model2007JRSSC..56….1S , each filament can be approximated by rectangle on the sky and thus the galaxies within it may be divided into two regions on either side of the filament spine. The mean redshift difference of galaxies between two regions are considered as a proxy for the line of sight velocity difference and hence for the filament spin signal. Any measured value of needs to be assigned a significance based on a randomization procedure (explained in the methods section). Figure 1 shows the statistical significance of the measureed as a function of - a proxy for the dynamical “temperature” of the filament (see method section for more details). The number of galaxies in each region is denoted by color. Two salient points can be gleaned here. First, The more galaxies in a given filament, the more inconsistent the redshift difference is with random. Second, (as expected) the colder the filament, the more inconsistent the redshift difference is with random. This second point is a generalization - cold filaments with and few galaxies, can have redshift differences only weakly inconsistent with random expectations. However one may note that as a trend, the colder the filament, the more significant the redshift difference is. In other words if is considered a proxy for filament spin, we observe a spectrum of filaments from dynamically hot that are consistent with random to dynamically cold filaments that are completely inconsistent with random at the many sigma level. Note that even for dynamically hot filaments, there are a few that are highly inconsistent with random. The reader will note that the wide distribution of significance seen at a given value of , is also a reflection of the distribution of inclination angle made by the filament axis with the line of sight (see figure A1).
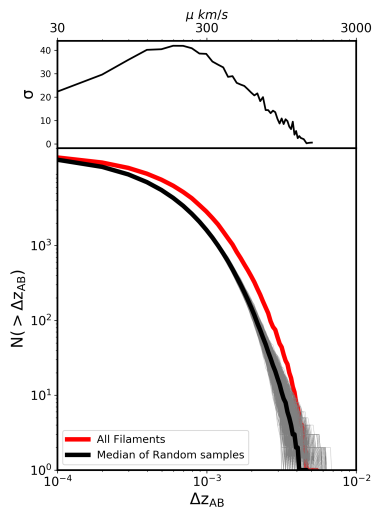
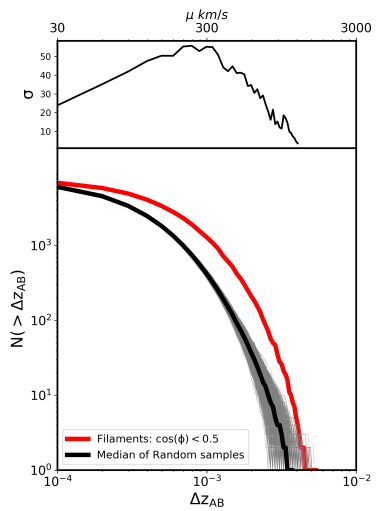
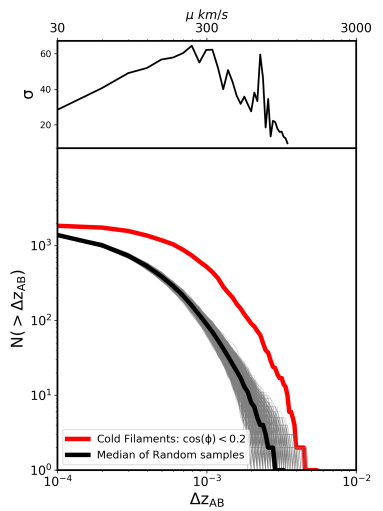
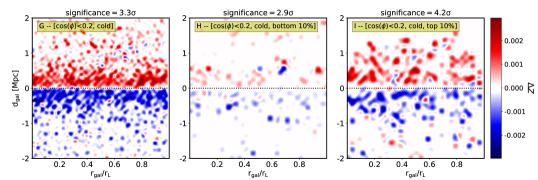
The cumulative distribution of for both the entire observed filament sample as well as the randomized trials, is shown in the three panels of Figure 2. The cumulative distribution is shown for all filaments (left), filaments whose axis is inclined by to the line of sight (middle) and dynamically cold filaments () inclined by (right). The reader will note that even when examining all filaments where inclination angle is completely ignored (and hence includes filaments viewed along their axis which will likely weaken the signal), the full distribution of is inconsistent with randomization tests. This inconsistency increases when considering filaments with and that are cold. To quantify the statistical significance of the cumulative distribution one may simply measure, in units of the 10,000 random trial’s standard deviation, how far the measured signal is from the mean randomized signal. This is plotted in the upper panels of Figure 2 and shows that randomized trails are statistically inconsistent with the measured signal at very high confidence. In other words, shuffling the redshifts of galaxies in a filament is unlikely to produce redshift differences as great as that observed.
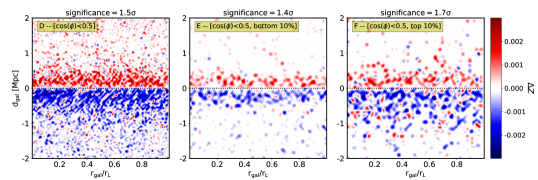
The redshift difference (a proxy for the rotation signal) stacked across various (sub-) samples, is presented in Figure 3. The following conventions have been adopted. Region A (defined as the region with greater mean redshift) is plotted in the upper part of each plot, while region B is plotted in the lower part. The position of each galaxy along and perpendicular to the filament axis is shown on the x and y axis, respectively and, along the x axis, is normalized to the filament’s length. Each galaxy is colored by its redshift difference , with respect to the mean redshift of all galaxies in the filament according to the color bar at right. In the ideal situation where all galaxies exhibit circular or helical motion about the filament axis, such a plot would only have red points in the upper part and blue points in the lower part. The statistical significance of each (sub-) sample is denoted by the significance, in units of and indicated on top of each panel.
In Figure 3 left column (i.e. panels, A, D, G) we show the stacked rotation signal for all filaments, filaments whose axis subtends an angle with the line of sight and filaments whose axis subtends an angle with the line of sight and which have . Comparing panel (A) with (D) the reader will note what has been mentioned before namely that merely changing the inclination angle increases the signal. Panel (G) shows a very strong rotation signal - at 3.3 - when considering dynamically cold filaments that are mostly perpendicular to the line of sight the rotation signal becomes very convincing.
Since filaments are long tendrils of galaxies often connecting nodes of the cosmic web, the mass of the two halos closest to the filament’s two end points are examined for a possible correlation with the signal strength we measure. We thus perform the following procedure. We search the group catalogue (2017A&A…602A.100T, ) for the two groups that are closest to the filament’s two end points. The reader is referred to that paper for details. In sum, the galaxy groups are detected with a modified Friend-of-Friend (FoF) algorithm, where the FoF groups are divided into subgroups so that each subgroup can be considered as a virialized structure. The mass of each group is estimated using the virial theorem, the size of the group in the sky and the group velocity dispersion along the line of sight. By summing these two group masses we can ascribe a single mass abutting each filament. We call this mass the “filament end point mass”.
The three samples of filaments can then be subdivided according to this characteristic. Figure 3 middle and right columns show the stacked signal for the 10 percent of the filaments with the smallest filament end point mass (ie panels B,E,H) and largest 10 percent filament end point mass (panels C, F, I) associated halo end points, respectively. The limits of the 10th and 90th percentile group masses of panel H and I are and , in units of , respectively.
A clear dependence on filament end point mass is seen for all three samples in Figure 3. The smaller the filament end point mass, the weaker the rotation signal. The filaments with the largest end point mass, most perpendicular to the line of sight, and dynamically cold, show an outstanding 4.2 inconsistency with the null hypothesis of random origin. The fact that the mass of the clusters at the end of each filament directly affects the measured signal, is evidence that the signal we are measuring is a physical effect related to gravitational dynamics.
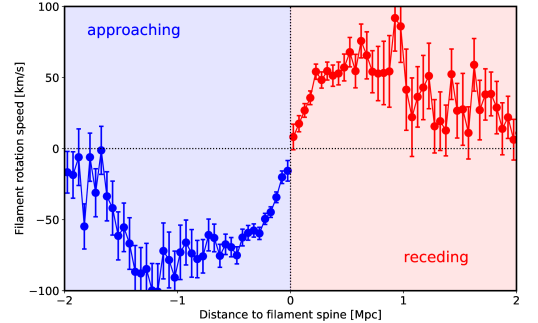
A “rotation curve” can be constructed for the stacked filament sample by converting the redshift difference into a velocity difference computed as , where is the redshift difference between all the galaxies at given distance and the mean redshift of all galaxies in the filament. This is shown in Fig. 4. We adopt the typical convention that negative (positive) velocities corresponds to approaching (receding) motion. Fig. 4 shows that rotation speed increases with distance, reaching a peak of around at a distance Mpc. It then decreases with distance, tending to zero at a distance of greater than 2 Mpc. Incidentally this behavior motivates the choice of filament thickness in this study, and should be kept in mind in future studies of the dynamics of cosmic filaments.
Summary & Discussion
The results presented in this paper are consistent with the detection of a signal one would expect if filaments rotated. What is measured and presented here is the redshift difference between two regions on either side of a hypothesized spin axis that is coincident with the filament spine. The full distribution of this quantity (Figure 2) is inconsistent with random regardless of the viewing angle formed with the line of sight but does strengthen as more perpendicular filaments are examined. It also strengthens when considering dynamically cold filaments - filaments whose galaxies have small rms values of their redshift. We emphasize that this is not a trivial finding. There is no reason – besides an inherent rotation – that filaments that are dynamically cold should exhibit such a signal.
One may draw an analogy with galaxies here: a disk galaxy viewed edge on shows a strong (consider as the Doppler shift from stars on the receding and approaching edge of the galaxy). The value (and significance as measured by the likelihood that it is random) of such a would decrease as the viewing angle of the galaxy is increased until the galaxy is seen face on. At this point the galaxy would appear “hot” - the motion of stars along the line of sight being random. Additionally, there is a degeneracy between morphology and shape in such situations: a very thin galaxy viewed with a large inclination angle appears ellipsoidal. Since not all galaxies are rotationally supported, some galaxies that appear ellipsoidal will be inclined rotating thin disks while others will be dispersion supported ellipsoids with little inherent rotation. It is this combination of inclination angle and inherent rotation which explains the spectrum of and significance seen in both the galaxy distribution as well as the spin of filaments.
We note that it is the unique combination of small and large which returns a strong statistically significant signal. In other words there are filaments with large and small which clearly do not show any signal. This work does not predict that every single filament in the universe is rotating, rather that there are subs-samples - intimately connected to the viewing angle end point mass - which show a clear signal consistent with rotation. This is the main finding of this work. Again, we note that it is not trivial that filaments with low values of exhibit large values of . This is only expected if filaments rotate.
According to the zel’dovich approximation (1970A&A…..5…84Z, ) the motion of galaxy’s is accompanied by larger scale matter flows (1991QJRAS..32…85I, ; 2014MNRAS.441.2923C, ). The mass and velocity flows are usually transported in a “hierarchical” way: at first, matter collapses along the principle axis of compression forming great cosmic walls. Matter then flows in the wall plane along the direction of the intermediate axis of compression to form filaments. The final stage is the full 3 dimensional collapse of an aspherical anisotrpoic density perturbation wherein matter collapses and flows along the filament axes to form clusters. Under such a model of mass flow, one may expect that filament spin is formed at the second stage from the compression along the intermediate axis of compression. As such mass streams in the sheet towards the filament from both sides and could explain the observed signal. In other words the signal we measure is both consistent with a shear caused by galaxy motion in a sheet, or the spin of a filament embedded in that sheet. These two views are not contradictory with each other, since in the picture described above the spin of a filament is engendered by the shear of the sheet in which it is embedded.
When the sample of filaments was divided into sub-samples based on the mass of the halos that sit at the ends of the filaments, those filaments with the most massive clusters have more significantly spinning signals than either the full sample or the filaments abutting the least massive halos. This gives a hint towards what may be driving the filament spin signal. It is also consistent with the idea that the spin is due to tidal fields influenced by the presence of massive aspherical density perturbations. The existence of a mass dependency is also strong evidence that what we have observed is not a systematic effect due to (e.g.) cosmological expansion. Any such systematic effects on the measurement of the redshift difference and its association with a velocity difference, would not manifest as a mass dependency. The mass dependency opens the door to a number of important questions as to the origin of this rotation or shear, questions that will be examined in future (theoretical) work such as: how is the measured effect engendered by the formation of clusters abutting filaments? Is there an angular momentum correlation between spinning filaments and nearby clusters? and perhaps most importantly: at which stage in structure formation do filaments spin up, and how does this affect the galaxies within them?
We know that from studies of the spatial distributions of smaller galaxies that inhabit the regions between large galaxies, that they are accreted in a two fold process: first onto the filament connecting the two larger halos and then secondly an accretion along the line connecting the halos. In other words galaxies are first accreted from a direction perpendicular to the filament spine (2015ApJ…813….6K, ; 2018MNRAS.473.1562W, ), and then along the spine (2018MNRAS.473.1562W, ; 2014MNRAS.443.1274L, ; 2015ApJ…807…37S, ). Assuming filaments can be approximated by a cylindrical potential such a flow would naturally give rise to an rotation about the filament axis, followed possibly by helical accretion. This is consistent with the theoretical picture formed by 2020arXiv200602418X who’s analysis of numerical simulations indicate that the angular momentum of filaments is generated by those particles which collapse along the filament’s potential. Taken together, this paper and 2020arXiv200602418X demonstrate that angular momentum can be generated on unprecedented scales, opening the door to a new understanding of cosmic spin.
References
References
- (1) Peebles, P. J. E. Origin of the Angular Momentum of Galaxies. ApJ 155, 393 (1969).
- (2) Doroshkevich, A. G. The space structure of perturbations and the origin of rotation of galaxies in the theory of fluctuation. Astrofizika 6, 581–600 (1970).
- (3) Doroshkevich, A. G. Spatial structure of perturbations and origin of galactic rotation in fluctuation theory. Astrophysics 6, 320–330 (1970).
- (4) White, S. D. M. Angular momentum growth in protogalaxies. ApJ 286, 38–41 (1984).
- (5) Barnes, J. & Efstathiou, G. Angular Momentum from Tidal Torques. ApJ 319, 575 (1987).
- (6) van Haarlem, M. & van de Weygaert, R. Velocity Fields and Alignments of Clusters in Gravitational Instability Scenarios. ApJ 418, 544 (1993).
- (7) Bond, J. R. & Myers, S. T. The Peak-Patch Picture of Cosmic Catalogs. I. Algorithms. ApJS 103, 1 (1996).
- (8) Pichon, C. & Bernardeau, F. Vorticity generation in large-scale structure caustics. A&A 343, 663–681 (1999). astro-ph/9902142.
- (9) Porciani, C., Dekel, A. & Hoffman, Y. Testing tidal-torque theory - I. Spin amplitude and direction. MNRAS 332, 325–338 (2002). astro-ph/0105123.
- (10) Pichon, C. et al. Why do galactic spins flip in the cosmic web? A Theory of Tidal Torques near saddles. In van de Weygaert, R., Shandarin, S., Saar, E. & Einasto, J. (eds.) The Zeldovich Universe: Genesis and Growth of the Cosmic Web, vol. 308 of IAU Symposium, 421–432 (2016). 1409.2608.
- (11) Motloch, P., Yu, H.-R., Pen, U.-L. & Xie, Y. Observational detection of correlation between galaxy spins and initial conditions. arXiv e-prints arXiv:2003.04800 (2020). 2003.04800.
- (12) Bond, J. R., Kofman, L. & Pogosyan, D. How filaments of galaxies are woven into the cosmic web. Nature 380, 603–606 (1996). astro-ph/9512141.
- (13) Neyrinck, M., Aragon-Calvo, M. A., Falck, B., Szalay, A. S. & Wang, J. Halo Spin from Primordial Inner Motions. The Open Journal of Astrophysics 3, 3 (2020). 1904.03201.
- (14) Codis, S. et al. Connecting the cosmic web to the spin of dark haloes: implications for galaxy formation. MNRAS 427, 3320–3336 (2012). 1201.5794.
- (15) Aragon Calvo, M. A., Neyrinck, M. C. & Silk, J. Galaxy Quenching from Cosmic Web Detachment. The Open Journal of Astrophysics 2, 7 (2019). 1607.07881.
- (16) Lee, J. & Pen, U.-L. Cosmic Shear from Galaxy Spins. ApJ 532, L5–L8 (2000). astro-ph/9911328.
- (17) Lee, J. & Erdogdu, P. The Alignments of the Galaxy Spins with the Real-Space Tidal Field Reconstructed from the 2MASS Redshift Survey. ApJ 671, 1248–1255 (2007). 0706.1412.
- (18) Aragón-Calvo, M. A., van de Weygaert, R., Jones, B. J. T. & van der Hulst, J. M. Spin Alignment of Dark Matter Halos in Filaments and Walls. ApJ 655, L5–L8 (2007). astro-ph/0610249.
- (19) Libeskind, N. I. et al. The velocity shear tensor: tracer of halo alignment. MNRAS 428, 2489–2499 (2013). 1210.4559.
- (20) Tempel, E., Stoica, R. S. & Saar, E. Evidence for spin alignment of spiral and elliptical/S0 galaxies in filaments. MNRAS 428, 1827–1836 (2013). 1207.0068.
- (21) Zhang, Y. et al. Spin Alignments of Spiral Galaxies within the Large-scale Structure from SDSS DR7. ApJ 798, 17 (2015). 1409.7150.
- (22) Tempel, E. & Libeskind, N. I. Galaxy Spin Alignment in Filaments and Sheets: Observational Evidence. ApJ 775, L42 (2013). 1308.2816.
- (23) Dubois, Y. et al. Dancing in the dark: galactic properties trace spin swings along the cosmic web. MNRAS 444, 1453–1468 (2014). 1402.1165.
- (24) Forero-Romero, J. E., Contreras, S. & Padilla, N. Cosmic web alignments with the shape, angular momentum and peculiar velocities of dark matter haloes. MNRAS 443, 1090–1102 (2014). 1406.0508.
- (25) Codis, S., Pichon, C. & Pogosyan, D. Spin alignments within the cosmic web: a theory of constrained tidal torques near filaments. MNRAS 452, 3369–3393 (2015). 1504.06073.
- (26) Pahwa, I. et al. The alignment of galaxy spin with the shear field in observations. MNRAS 457, 695–703 (2016). 1512.02236.
- (27) Wang, P., Guo, Q., Kang, X. & Libeskind, N. I. The Spin Alignment of Galaxies with the Large-scale Tidal Field in Hydrodynamic Simulations. ApJ 866, 138 (2018). 1810.04581.
- (28) Codis, S. et al. Galaxy orientation with the cosmic web across cosmic time. MNRAS 481, 4753–4774 (2018). 1809.06212.
- (29) Krolewski, A. et al. Alignment between Filaments and Galaxy Spins from the MaNGA Integral-field Survey. ApJ 876, 52 (2019). 1902.09797.
- (30) Welker, C. et al. The SAMI Galaxy Survey: first detection of a transition in spin orientation with respect to cosmic filaments in the stellar kinematics of galaxies. MNRAS 491, 2864–2884 (2020). 1909.12371.
- (31) Kraljic, K., Davé, R. & Pichon, C. And yet it flips: connecting galactic spin and the cosmic web. MNRAS 493, 362–381 (2020). 1906.01623.
- (32) Hahn, O., Porciani, C., Carollo, C. M. & Dekel, A. Properties of dark matter haloes in clusters, filaments, sheets and voids. MNRAS 375, 489–499 (2007). astro-ph/0610280.
- (33) Hahn, O., Carollo, C. M., Porciani, C. & Dekel, A. The evolution of dark matter halo properties in clusters, filaments, sheets and voids. MNRAS 381, 41–51 (2007). 0704.2595.
- (34) Zhang, Y. et al. The Spin and Orientation of Dark Matter Halos Within Cosmic Filaments. ApJ 706, 747–761 (2009). 0906.1654.
- (35) Trowland, H. E., Lewis, G. F. & Bland-Hawthorn, J. The Cosmic History of the Spin of Dark Matter Halos within the Large-scale Structure. ApJ 762, 72 (2013). 1201.6108.
- (36) Laigle, C. et al. Swirling around filaments: are large-scale structure vortices spinning up dark haloes? MNRAS 446, 2744–2759 (2015). 1310.3801.
- (37) Wang, P. & Kang, X. A general explanation on the correlation of dark matter halo spin with the large-scale environment. MNRAS 468, L123–L127 (2017). 1703.04726.
- (38) Wang, P. & Kang, X. The build up of the correlation between halo spin and the large-scale structure. MNRAS 473, 1562–1569 (2018). 1709.07881.
- (39) Lee, J. Revisiting the Galaxy Shape and Spin Alignments with the Large-scale Tidal Field: An Effective Practical Model. ApJ 872, 37 (2019). 1808.08559.
- (40) Ganeshaiah Veena, P. et al. The Cosmic Ballet: spin and shape alignments of haloes in the cosmic web. MNRAS 481, 414–438 (2018). 1805.00033.
- (41) Ganeshaiah Veena, P., Cautun, M., Tempel, E., van de Weygaert, R. & Frenk, C. S. The Cosmic Ballet II: spin alignment of galaxies and haloes with large-scale filaments in the EAGLE simulation. MNRAS 487, 1607–1625 (2019). 1903.06716.
- (42) Xia, Q., Neyrinck, M. C., Cai, Y.-C. & Aragón-Calvo, M. A. Intergalactic filaments spin. arXiv e-prints arXiv:2006.02418 (2020). 2006.02418.
- (43) Stoica, R. S., Martínez, V. J. & Saar, E. A three-dimensional object point process for detection of cosmic filaments. Journal of the Royal Statistical Society: Series C (Applied Statistics) 56 (4 56, 1 (2007).
- (44) Tempel, E., Tuvikene, T., Kipper, R. & Libeskind, N. I. Merging groups and clusters of galaxies from the SDSS data. The catalogue of groups and potentially merging systems. A&A 602, A100 (2017). 1704.04477.
- (45) Zel’Dovich, Y. B. Reprint of 1970A&A…..5…84Z. Gravitational instability: an approximate theory for large density perturbations. A&A 500, 13–18 (1970).
- (46) Icke, V. & van de Weygaert, R. The galaxy distribution as a Voronoi foam. QJRAS 32, 85–112 (1991).
- (47) Cautun, M., van de Weygaert, R., Jones, B. J. T. & Frenk, C. S. Evolution of the cosmic web. MNRAS 441, 2923–2973 (2014). 1401.7866.
- (48) Kang, X. & Wang, P. The Accretion of Dark Matter Subhalos within the Cosmic Web: Primordial Anisotropic Distribution and its Universality. ApJ 813, 6 (2015). 1509.06804.
- (49) Libeskind, N. I., Knebe, A., Hoffman, Y. & Gottlöber, S. The universal nature of subhalo accretion. MNRAS 443, 1274–1280 (2014). 1407.0394.
- (50) Shi, J., Wang, H. & Mo, H. J. Flow Patterns around Dark Matter Halos: The Link between Halo Dynamical Properties and Large-scale Tidal Field. ApJ 807, 37 (2015). 1501.07764.
Correspondence and requests for materials should be addressed to P.W. (pwang@aip.de) or N.I.L (nlibeskind@aip.de).
We acknowledge stimulating discussions with Marcel S. Pawlowski, Stefan Gottlöeber, Yehuda Hoffman and Zhao-zhou Li. We acknowledge Rain Kipper for a double-blind examination at the beginning of this project. P.W. especially acknowledge his wife Nan Wang and daughter Tian-en Wang for their understanding and their help of his home office during the COVID-19 pandemic. P.W., N.I.L., X.K. and Q.G. acknowledge support from the joint Sino-German DFG research Project “The Cosmic Web and its impact on galaxy formation and alignment” (DFG-LI 2015/5-1, NSFC No. 11861131006). N.I.L acknowledges financial support of the Project IDEXLYON at the University of Lyon under the Investments for the Future Program (ANR-16-IDEX-0005). E.T. was supported by ETAg grants IUT40-2, PRG1006 and by EU through the ERDF CoE TK133. X.K. acknowledges financial supported by the NSFC (No. 11825303, 11333008), the 973 program (No. 2015CB857003), also partially supported by China Manned Space Program through its Space Application System. Q.G. acknowledges financial support of Shanghai Pujiang Program (No.19PJ1410700).
P.W. carried out all measurements and quantitative analysis, contributing to the writing of the method and results. N.I.L. conceived the idea of the project and led the writing. E.T. contributed observational data, filament catalogue and essential discussions. X.K. and Q.G. contributed significantly to the overall science interpretation and essential discussions. All co-authors contributed by their varied contributions to the science interpretation, data analysis All co-authors contributed to the commenting on this manuscript as part of an internal review process.
The authors declare no competing interests.
The method presented here is fairly straightforward. We begin by using a publicly available catalog of filaments constructed from the SDSS DR12 galaxy survey (2011AJ….142…72E, ; 2015ApJS..219…12A, ). Such a catalog is built using the Bisous algorithm (2007JRSSC..56….1S, ) which identifies curvi-linear structures in the galaxy distribution111The Bisous algorithm is not astronomy specific and was developed to identify roads in satellite imaging. (2014MNRAS.438.3465T, ; 2016A&C….16…17T, ; 2018MNRAS.473.1195L, ). Each filament is approximated by a cylinder with a given axis that makes a viewing angle with the line of sight. Our hypothesis rests on the assumption that if filaments rotate then there should be a statistically significant component of a galaxy’s velocity that is perpendicular to the filament spine. Furthermore, this component should have opposite signs on either side of the filament spine: one receding and one approaching. In order to detect such a signal in principle we would only want to examine filaments whose spine is perpendicular to the line of sight such that a galaxy’s redshift (a proxy for the radial component of its velocity) would coincide with its angular velocity. However restricting the filament sample this way dramatically reduces the sample size. Therefore we divide the filament catalog according to viewing angle into three bins: all filaments irrespective of viewing angle, those inclined by more than 60 degrees () with respect to the line of sight, those dynamically cold (see blow) and viewing angle more than 80 degrees (). This last sample is chosen for the reason that as demonstrated in Figure A1, filaments inclined by more than 80 degrees are perpendicular enough that the measured value of is likely a good approximation to the inherent one. A consequence of this is there are more cold filaments with than hot filaments with inclined by . In the appendix section the effect of viewing angle is examined in more detail. We find that the filaments whose spines are closer to perpendicular to the line of sight have more significant rotation signals (see figure A1).
Each filament axis delineates two regions on either side of the filament spine. The Bisous filament’s have an inherent scale of around 1 Mpc. However all galaxies which are within a 2 Mpc distance from the filament axis are considered to be in one of these two regions. Galaxies further afield are not considered. We note that most of the galaxies that are within 2 Mpc are within 1Mpc and that including galaxies further away from the filament spine will “dilute” the signal as the regions further from the filament axis will, by construction, include random interlopers.
The mean redshift of galaxies in both regions is calculated. The region with the greater mean redshift is arbitrarily called region A, the region with smaller mean redshift is called region B. The redshift difference =- is computed. The relative speed is then simply , where is the speed of light. Next we examine if the filament is dynamically hot or cold by using the redshift of all galaxies in each filament to compute the rms namely . This is then compared with . Dynamically hot filaments have while cold filaments have rms values less than the redshift difference. Such a definition precludes the ability to search for a signal consistent with rotation in hot filaments since it is by definition flawed to ascribe a physical significance to a if it is less than . Thus we do not expect to be able to find a discernible rotation signal in dynamically hot filaments.
The median value of , (as well the standard deviation) is shown in Figure A1 as a function of the angle subtended between the filament spine and the line of sight. Two important points can be observed by this plot: (1) the filament’s dynamical temperature () increases as filaments become parallel to the line of sight. Because the actual value of for a given filament is independent of , this fact demonstrates that the viewing angle is critical in measuring this quantity and that can indeed be used to measure rotation for filaments that are close to perpendicular to the line of sight. Furthermore such a relationship is natural if a significant component of a galaxy’s velocity is perpendicular to the filament spine and consistent with rotation or shear. (2) The standard deviation of increases as filaments become parallel to the line of sight. This expected if in addition to rotational motion about the filament spine, galaxies are also traveling along the filament axis - perhaps with helical motion.
A lower limit on the number of galaxies in each region of A and B of each filament must be assumed. Without such a limit we would introduce pathological cases into the analysis, namely filaments with no or just one or two galaxies in region A or B. Therefore we only consider filaments with at least 3 galaxies in each region - it is difficult to justify the computation of an rms for anything less than this. The three galaxy per region A and B is a conservative choice and is the least arbitrary limit that can be applied. Despite this choice, the signal is examined as a function of galaxy number in the appendix section. In sum: increasing the minimum number of galaxies in each region decreases the sample size and increases the significance of the measured signal.The final fiducial sample consists of 17,181 filaments, and 213,625 galaxies in total.
A statistical significance to each measured value of must be obtained to ensure that the measured signal is not simply the result of stochasticity. In other words we wish to ask the question “What is the chance that the observed distribution or could be reproduced given a random distribution of redshifts (in a given filament)?” In order to answer this question, the following test is performed. The redshifts of all galaxies in a given filament are randomly shuffled, keeping the position fixed. This is performed 10,000 times per filament.222In the poorest filaments with only 6 galaxies (say), there are less than 10,000 unique permutations. However performing this test 10,000 times, although redundant, will not affect the determination of the significance. For each of these trials, the procedure described above is carried out: namely two regions are defined, their mean redshifts are measured and is computed. The “real” can then be compared to the distribution of random on a filament by filament basis. The chance that a measured is consistent with random can then be quantified by where (how many standard deviations from the mean) the measured is, in the distribution of .
Appendix A The effect of filament viewing angle and galaxy number
In this section we examine how the signal changes based on two arbitrary choices we are forced to take in this work: the orientation of filaments with respect to the line of sight and the lower limit for the number of galaxies in each region to be considered.
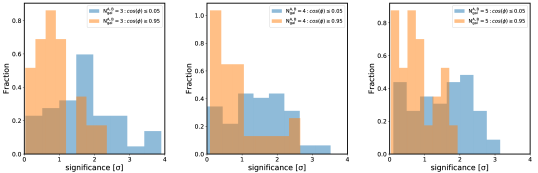
In order to examine how the orientation of filaments changes the significance of the signal we wish to measure, we perform the following test. Let be the angle subtended between the filament spine and the line of sight. We compare filaments where since these are nearly perpendicular to the line of sight with those where corresponding to filaments nearly parallel to the line of sight. These are shown by the blue and orange histograms (respectively) in Figure A2. Predictably we find that the filaments whose spines are closer to perpendicular to the line of sight have more significant rotation signals. Since the likelihood that a filament rotates does not depend on the orientation of the filament, we may ascribe the decrease in significance to projection effects.
Figure A2 left, middle, and right panels consider the effect of changing the number of galaxies in each filament region A and B for 3, 4, and 5 galaxies respectively. Note that because each filament has two regions so this corresponds to a minimum of 6, 8 and 10 galaxies in the filament. We note that changing Ngal has little effect on the distribution of the estimated significance. Hence the choice of N used throughout the paper is not biasing the result towards or away from significant detections.

The galaxy data used in this paper is drawn from the publicly available SDSS DR12 (https://www.sdss.org/dr12/) and can be found here: http://cosmodb.to.ee. The Bisous filament catalogue can be found here: http://cosmodb.to.ee.
The codes used in this study are available from the corresponding authors upon reasonable request.
References
References
- (1)
- (2) Eisenstein, D. J. et al. SDSS-III: Massive Spectroscopic Surveys of the Distant Universe, the Milky Way, and Extra-Solar Planetary Systems. AJ 142, 72 (2011). 1101.1529.
- (3) Alam, S. et al. The Eleventh and Twelfth Data Releases of the Sloan Digital Sky Survey: Final Data from SDSS-III. ApJS 219, 12 (2015). 1501.00963.
- (4) Tempel, E. et al. Detecting filamentary pattern in the cosmic web: a catalogue of filaments for the SDSS. MNRAS 438, 3465–3482 (2014). 1308.2533.
- (5) Tempel, E., Stoica, R. S., Kipper, R. & Saar, E. Bisous model-Detecting filamentary patterns in point processes. Astronomy and Computing 16, 17–25 (2016). 1603.08957.
- (6) Libeskind, N. I. et al. Tracing the cosmic web. MNRAS 473, 1195–1217 (2018). 1705.03021.