Observational detection of correlation between galaxy spins and initial conditions
Abstract
Galaxy spins can be predicted from the initial conditions in the early Universe through the tidal tensor twist. In simulations, their directions are well preserved through cosmic time, consistent with expectations of angular momentum conservation. We report a detection of correlation between observed oriented directions of galaxy angular momenta and their predictions based on the initial density field reconstructed from the positions of SDSS galaxies. The detection is driven by a group of spiral galaxies classified by the Galaxy Zoo as (anti-)clockwise, with a modest improvement from adding galaxies from MaNGA and SAMI surveys. This is the first such detection of the oriented galaxy spin direction, which opens a way to use measurements of galaxy spins to probe fundamental physics in the early Universe.
I Introduction
Galaxy surveys such as Huchra et al. (1983); Colless et al. (2001); York et al. (2000) have taught us a great deal about the rules that govern our Universe. So far, our knowledge has been based on measurements of galaxy positions and velocities. However, galaxies also have rotational degrees of freedom, that we can utilize to learn more about the Universe.
In papers Yu et al. (2019, 2020) we pointed out that measurements of galaxy angular momenta can be used to measure the sum of the neutrino masses and to probe primordial chirality violations. Beyond these applications, it seems possible to use galaxy spins to constrain primordial non-Gaussianity and gravitational waves, though detailed prospects for these measurements are currently unknown and under investigation (see Schmidt et al. (2015); Biagetti and Orlando (2020) for similar efforts using intrinsic alignments). Measurements of galaxy spins can be also utilized to better constrain the initial conditions in the observed parts of the Universe Lee and Pen (2001, 2000), improving the reconstruction algorithms based on galaxy positions and velocities Jasche and Wandelt (2013); Wang et al. (2014); Zhu et al. (2017); Schmittfull et al. (2017); Hada and Eisenstein (2018); Zhu et al. (2019). Finally, understanding the origin of galaxy rotation can inform models of galaxy formation and provide a useful input for studies of the intrinsic alignment and its effect on the weak lensing surveys Kirk et al. (2015).
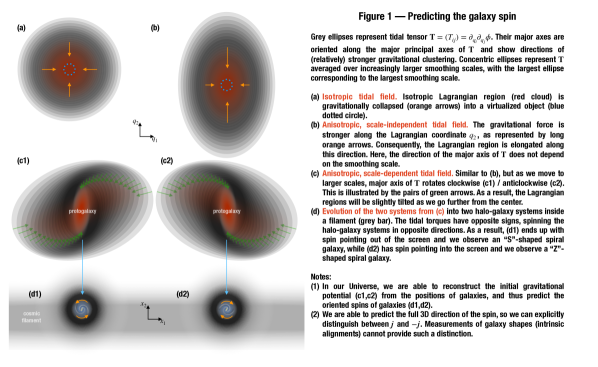
To be able to make good on any of the exciting prospects, it is necessary to connect the galaxy spins with the conditions in the early Universe. In Fig. 1 we present a schematic illustration of how galaxy spins arise. Tidal-Torque Theory White (1984) provides the basic mathematical framework, relating the angular momentum of a dark matter (DM) halo to the initial misalignment of the protohalo moment of inertia and the Hessian of the nearby gravitational potential. In Yu et al. (2020) we found that directions*1*1*1Not necessarily the amplitudes. of the DM halo angular momenta*2*2*2For brevity, we shorten “direction of angular momentum” to spin. are well described by a second order quantity. Because galaxy spins tend to align with the spins of their DM haloes Teklu et al. (2015); Jiang et al. (2018), it is expected that this second order quantity can be used to predict galaxy spins as well.
In this paper, we study galaxy survey data to investigate to what degree it is possible to observationally confirm the connection between galaxy spins and initial conditions. To achieve this, we compare direct measurements of galaxy angular momenta directions with their predictions based on initial density fluctuations reconstructed using a traditional reconstruction technique Wang et al. (2014).
Previous related studies (Kirk et al. (2015) for a review, Krolewski et al. (2019); Welker et al. (2020)) have dealt either with intrinsic alignments of galaxies or with alignments of galaxy spins and the large scale structure in their neighborhood. Unlike our work, that makes the connection to the initial conditions explicit, these earlier studies only provide indirect evidence about the origin of galaxy spins. Additionally, we consider the additional information contained in the orientation or the galaxy’s spin, as opposed to the earlier studies that focused on the unoriented (headless) directions.
II Summary of results from simulations
In Yu et al. (2020) we proposed that the direction of the angular momentum of DM halo can be well predicted from the initial gravitational potential as
| (1) |
where is the Levi-Civita symbol, (resp. ) is the initial gravitational potential smoothed with a Gaussian kernel of scale (resp. ) and repeated indices are summed over. The right hand side of (1) is evaluated at the Lagrangian center of mass of the halo. Geometrically, Eqn. (1) measures the twisting of the tidal tensor between scales and , as shown in a 2-D projection in Fig. 1.
Specifically, in N-body simulations we studied correlation strength, defined as mean cosine of the misalignment angle between the true spin of the halo and the spin constructed according to (1), averaged over haloes present in the simulation. can range from (vectors perfectly anti-aligned) to (perfectly aligned) and for uncorrelated distributions . For a random , is uniformly distributed, with mean 0 and standard deviation . For haloes heavier than we in our simulations found , which means that (1) predicts direction of the angular momentum of a single DM halo with an uncertainty of . This is roughly the same amount of information as if the halo spin was perfectly predicted in 50% of the cases and fully random in the other 50% of the cases. For comparison, weak gravitational lensing typically has correlations at the percent level per object.
We found that optimal results are achieved with . In this limit and using the Poisson equation, we can rewrite (1) as
| (2) |
where is the initial DM density smoothed with a Gaussian kernel of scale . This formula was earlier proposed as a proxy for galaxy spins in Codis et al. (2015). We can think of Eqn. (2) as estimating the instantaneous tidal twist at scale . In simulations we found that for perfectly known initial conditions should be near the virial scale, i.e. , and mass dependent. In practice, most galaxies surveys are sparsely sampled, limiting the accessible values of , with a resulting degradation in predicability. We revisit the question of below.
III Data sets
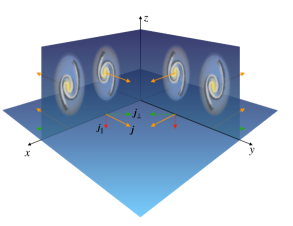
In this section we summarize the data sets used in this work. We first describe the data set that is used to calculate , galaxy spins predicted from the initial conditions, and then the data sets that are used to measure the galaxy spins directly. For most galaxies, we can currently only determine either the radial, , or perpendicular to the line of sight, , components of their spin (see Fig. 2 for illustration).
III.1 ELUCID
We use the nearby Universe initial density field as determined by the ELUCID collaboration. Here we only summarize their approach, details can be found in Wang et al. (2014, 2016).
They start with a catalog of galaxy groups Yang et al. (2007) derived from the SDSS York et al. (2000) data using a halo-based group finder. After determining masses of individual groups through luminosity-based abundance matching, only groups in the Northern Galactic Cap, redshift range and with masses above are retained. Peculiar velocities are corrected to form a real space catalog. Using this group catalog, the space is tessellated according to which galaxy group is the closest. Within such sub-volumes, particles are placed randomly, in accordance with the expected density profile of halo of given mass. This represents today’s density field.
In the second step of the reconstruction, the best fit initial conditions are determined using a Hamiltonian Monte Carlo method using a Particle-Mesh (PM) dynamics code. For random initial conditions, the PM code is used to calculate the corresponding value of today’s density field. By comparing this density field with that determined from the SDSS data, it is possible to construct a probability measure on the space of the initial conditions. Due to inaccuracies of the PM code on small scales, before comparison both density fields are smoothed on a scale of . Iteratively probing the space of initial conditions then allows ELUCID to find the initial conditions that best describe the local galaxy data.
From these best fit initial conditions, we use (2) to predict the galaxy spins . While we currently do not know what the optimal smoothing scale to be applied to the data is and such study is beyond the scope of this paper, the ELUCID pipeline provides us with a natural upper bound on the smoothing scale, . From the simulations we know that with known initial conditions, for haloes that form the majority of our sample the best results are achieved with . In what follows, we will thus only consider smoothing scales between and and search for that leads to the strongest correlation between and the direct measurements of galaxy spins. We use a single, halo mass independent, smoothing scale for the entire galaxy sample.
III.2 Galaxy Zoo
For spiral galaxies, sense of rotation of their spiral arms (clockwise or anti-clockwise, i.e. in the sense of the letters Z or S) is closely related to the direction of the angular momentum of the galaxy’s gas. While about 4% of galaxies have angular momentum that is pointed in the opposite direction than that inferred from the orientation of the spiral arms Pasha and Smirnov (1982), this effect is not expected to bias the results. Determining the sense of rotation of a spiral galaxy is then a measurement of the sign of the radial component of the galaxy’s angular momentum (one bit of information), with the galaxy’s position vector aligned with its spin for the “clockwise” galaxies and anti-aligned for the “anti-clockwise” galaxies.
We use data from Galaxy Zoo (GZ) Lintott et al. (2008), a citizen science project where members of the public visually classified properties of almost objects. “Clockwise spiral galaxy” and “anticlockwise spiral galaxy” were among the six choices available, which gives us a catalog of galaxies with a known sense of rotation. For each object, summary statistics of the voting results are publicly available and we obtained them through CasJobs*3*3*3https://skyserver.sdss.org/CasJobs/.
For each object we label the fraction of votes for the (anti-)clockwise spiral. As our default sample, we choose those with , with . We also investigate other choices of in what follows.
III.3 MaNGA
Using the MaNGA survey Bundy et al. (2015), it is possible to determine orientation of for several thousand galaxies. For each galaxy, MaNGA measures integral field spectroscopy (IFS), which allows determination of a 2D map of velocity of the baryonic component (see Fig. 3 for an example). These maps can then be used to determine the rotational state of individual galaxies. In this paper we use data that is part of the SDSS DR15 Blanton et al. (2017); Aguado et al. (2019).
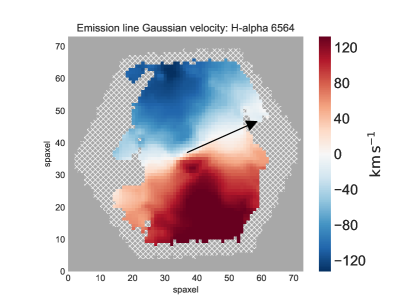
To analyze this data, we use Marvin*4*4*4https://www.sdss.org/dr15/manga/marvin/ Cherinka et al. (2019) and focus exclusively on the line. For each galaxy we first construct mask from the measurements of flux by extending the default masks to further remove pixels with signal to noise ratio (SNR) below 10. We then apply this extended mask on the 2D map of the -inferred gas velocity. Because of the galaxy’s rotation, gas in approximately half of the galaxy is observed to be moving away from us, while the gas in the opposite half of the galaxy is observed to be moving towards us, both relative to the galaxy’s overall motion. The projection of the axis of galaxy’s rotation into the plane of the sky can be then determined as the direction of zero velocity gradient in the map.
For each galaxy we assume the gas velocity is well described by a linear gradient in the angular coordinates and find the best fit direction of this gradient. The direction of is then set perpendicular to this gradient, with the orientation determined by the regions of positive/negative velocity. Using the known projection of into the plane of the sky and the angular position of the galaxy, we can determine the three-dimensional vector in galactic coordinates. We neglect the uncertainty on the direction of , as it is significantly smaller than the uncertainty on the reconstructed spin direction.
We perform several cuts. We first remove galaxies with less than 25 good pixels and those that are blue shifted and are thus too close to be part of the volume probed by ELUCID. We then visually inspected gas velocity maps of the galaxies passing these preliminary cuts and additionally remove 159 of them. These include galaxies for which it is difficult to estimate their rotation, for example because of a more complicated morphology.
III.4 SAMI
SAMI Galaxy Survey Bryant et al. (2015) is a collection of IFS data obtained at the Anglo-Australian Telescope. We use data*5*5*5https://datacentral.org.au/services/download/, specifically the “Recommended-component Ionised Gas Velocity” maps, released in the DR2 of the survey Scott et al. (2018). Our analysis is analogous to that performed on the MaNGA data, only we do not mask pixels with SNR 10. This presumably leads to a higher fraction of galaxies that are removed upon visual inspection ().
III.5 Combining surveys and ELUCID cuts
In the combined MaNGA and SAMI data, for 44 galaxies we have multiple observations. For each such galaxy, we averaged over all the observations. We checked these multiple measurements are mutually consistent.
With , for about 600 galaxies we know both and the sign of . If we assume these galaxies are very thin disks, from known axis ratio it is in principle possible to construct full 3D vectors . To avoid complications and given the relatively small number of affected galaxies, for these galaxies we treat and independently, as if they described two different galaxies. For each galaxy we then set either or to zero.
Looking only at galaxies in the volume for which ELUCID provides initial conditions and those for which the closest galaxy group in the ELUCID catalog weights at least , we are left with 1609 galaxies for which we have measurement of and, for (), with 13546 (5581) galaxies for which we know .
IV Results
For the 15155 galaxies () for which we have direct measurement of either or we calculate the correlation strength between the direct measurement of galaxy spin and its prediction from the ELUCID initial conditions as where we use the displacement field determined by ELUCID to move to the Lagrangian space.
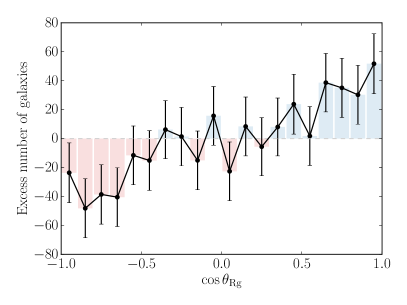
In Fig. 4 we show excess number of galaxies in bins of over what would be expected if there was no relationship between and . This is for our fiducial sample and for the smoothing scale that leads to the strongest correlation between the two sets of vectors, . We see a clear excess near , where the two vectors are aligned, and deficit on the opposite end. The mean value averaged over all the galaxies in our sample is .
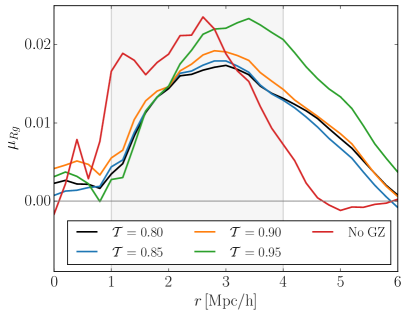
In Fig. 5 we show dependence of on the smoothing scale for our fiducial sample, together with several sub-samples where we are more strict on the GZ classification. In all samples we find that is close to optimal, with correlation strengths between 0.015 and 0.025. We see a trend where being more restrictive on the GZ sample leads to higher correlations. As expected, for small and large the correlation drops.
To evaluate probability we have observed just a random fluctuation, we simulate 40 000 random sets of galaxy spins and use them instead of . To parallel what we do with the data as closely as possible, for the galaxies from MaNGA and SAMI we only simulate . For the galaxies from GZ, we randomly shuffle the “clockwise” or “anticlockwise” classifications and the component accordingly. This takes into account the bias of human observers Land et al. (2008), and keeps the number of “clockwise” galaxies constant. For each random set of galaxy spins we then find between and that leads to the maximal correlation. This gives us a distribution of when there is no relationship between and . This distribution is well described by a Gaussian, with mean and standard deviation . Notice the positive mean, caused by choosing the optimal in each case. Possibility that the we see in the data is caused by chance is thus ruled out at .
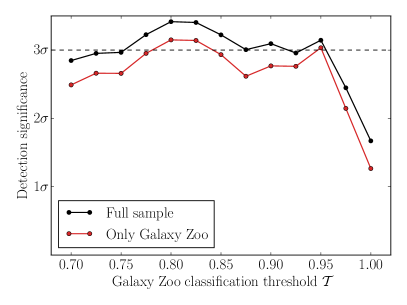
In Fig. 6 we show dependence of the detection significance as a function of the purity of the GZ sample . The significance is fairly constant all the way to , after which it starts dropping, mainly due to the decreasing number of galaxies and correspondingly increasing and . The detection significance is about 3.0, with majority of it coming from the GZ galaxies. MaNGA and SAMI together only allow detection at a 1.0 level due to the limited number of galaxies. Shrinking (extending) the range over which we vary by increases (decreases) the detection significance by .
V Discussion
In this paper we confirmed, with significance, that formula (2) can be used to predict directions of galaxy angular momenta. While the correlation strength is only , this is most likely a consequence of poorly reconstructed initial conditions at , the scale the DM halo spins are the most sensitive to.
With better reconstruction algorithms and new data, it should be possible to significantly improve on this initial result. Especially DESI Levi et al. (2013), with its high density of spectroscopically detected galaxies, is expected to push this science forward. While DESI is ramping up, MaNGA and HECTOR Bryant et al. (2016) are expected to at least double the catalog of galaxies with IFS. Classification of galaxies into clockwise and anticlockwise then seems to be well suited for application of machine learning techniques, which could potentially also increase the galaxy sample and thus the detection significance.
In principle, the signal could be caused by a systematic effect that correlates the reconstructed density field with the direct measurements, especially the clockwise/anticlockwise classification. While we do not know of any such systematic, one should keep this possibility in mind. With larger data sets and automated classification, ruling out this issue might become possible.
With this in mind, establishing connection between initial conditions and galaxy spins allows us to start probing exciting physical phenomena in the early Universe.
Acknowledgements.
We thank Huiyuan Wang for providing the catalog of ELUCID galaxy groups and useful discussions.References
- Huchra et al. (1983) J. Huchra, M. Davis, D. Latham, and J. Tonry, ApJS 52, 89 (1983).
- Colless et al. (2001) M. Colless et al., MNRAS 328, 1039 (2001), arXiv:astro-ph/0106498 [astro-ph] .
- York et al. (2000) D. G. York et al. (SDSS), AJ 120, 1579 (2000), arXiv:astro-ph/0006396 [astro-ph] .
- Yu et al. (2019) H.-R. Yu, U.-L. Pen, and X. Wang, Phys. Rev. D99, 123532 (2019), arXiv:1810.11784 [astro-ph.CO] .
- Yu et al. (2020) H.-R. Yu, P. Motloch, U.-L. Pen, Y. Yu, H. Wang, H. Mo, X. Yang, and Y. Jing, Phys. Rev. Lett. 124, 101302 (2020), arXiv:1904.01029 [astro-ph.CO] .
- Schmidt et al. (2015) F. Schmidt, N. E. Chisari, and C. Dvorkin, JCAP 1510, 032 (2015), arXiv:1506.02671 [astro-ph.CO] .
- Biagetti and Orlando (2020) M. Biagetti and G. Orlando, (2020), arXiv:2001.05930 [astro-ph.CO] .
- Lee and Pen (2001) J. Lee and U.-L. Pen, Astrophys. J. 555, 106 (2001), arXiv:astro-ph/0008135 [astro-ph] .
- Lee and Pen (2000) J. Lee and U.-L. Pen, Astrophys. J. 532, L5 (2000), arXiv:astro-ph/9911328 [astro-ph] .
- Jasche and Wandelt (2013) J. Jasche and B. D. Wandelt, MNRAS 432, 894 (2013), arXiv:1203.3639 [astro-ph.CO] .
- Wang et al. (2014) H. Wang, H. J. Mo, X. Yang, Y. P. Jing, and W. P. Lin, ApJ 794, 94 (2014), arXiv:1407.3451 [astro-ph.CO] .
- Zhu et al. (2017) H.-M. Zhu, Y. Yu, U.-L. Pen, X. Chen, and H.-R. Yu, Phys. Rev. D 96, 123502 (2017), arXiv:1611.09638 [astro-ph.CO] .
- Schmittfull et al. (2017) M. Schmittfull, T. Baldauf, and M. Zaldarriaga, Phys. Rev. D96, 023505 (2017), arXiv:1704.06634 [astro-ph.CO] .
- Hada and Eisenstein (2018) R. Hada and D. J. Eisenstein, Mon. Not. Roy. Astron. Soc. 478, 1866 (2018), arXiv:1804.04738 [astro-ph.CO] .
- Zhu et al. (2019) H.-M. Zhu, M. White, S. Ferraro, and E. Schaan, (2019), arXiv:1910.02318 [astro-ph.CO] .
- Kirk et al. (2015) D. Kirk et al., Space Sci. Rev. 193, 139 (2015), arXiv:1504.05465 [astro-ph.GA] .
- White (1984) S. D. M. White, ApJ 286, 38 (1984).
- Teklu et al. (2015) A. F. Teklu et al., ApJ 812, 29 (2015), arXiv:1503.03501 [astro-ph.GA] .
- Jiang et al. (2018) F. Jiang et al., ArXiv e-prints (2018), arXiv:1804.07306 .
- Krolewski et al. (2019) A. Krolewski et al., Astrophys. J. 876, 52 (2019), arXiv:1902.09797 [astro-ph.GA] .
- Welker et al. (2020) C. Welker et al., Mon. Not. Roy. Astron. Soc. 491, 2864 (2020), arXiv:1909.12371 [astro-ph.GA] .
- Codis et al. (2015) S. Codis, C. Pichon, and D. Pogosyan, Mon. Not. Roy. Astron. Soc. 452, 3369 (2015), arXiv:1504.06073 [astro-ph.CO] .
- Wang et al. (2016) H. Wang et al., Astrophys. J. 831, 164 (2016), arXiv:1608.01763 [astro-ph.CO] .
- Yang et al. (2007) X. Yang et al., Astrophys. J. 671, 153 (2007), arXiv:0707.4640 [astro-ph] .
- Pasha and Smirnov (1982) I. I. Pasha and M. A. Smirnov, Ap&SS 86, 215 (1982).
- Lintott et al. (2008) C. J. Lintott et al., Mon. Not. Roy. Astron. Soc. 389, 1179 (2008), arXiv:0804.4483 [astro-ph] .
- Bundy et al. (2015) K. Bundy et al., Astrophys. J. 798, 7 (2015), arXiv:1412.1482 [astro-ph.GA] .
- Blanton et al. (2017) M. R. Blanton et al. (SDSS), Astron. J. 154, 28 (2017), arXiv:1703.00052 [astro-ph.GA] .
- Aguado et al. (2019) D. S. Aguado et al., Astrophys. J. Suppl. 240, 23 (2019), arXiv:1812.02759 [astro-ph.IM] .
- Cherinka et al. (2019) B. Cherinka et al., Astrophys. J. 158, 74 (2019), arXiv:1812.03833 [astro-ph.IM] .
- Bryant et al. (2015) J. J. Bryant et al., MNRAS 447, 2857 (2015), arXiv:1407.7335 [astro-ph.GA] .
- Scott et al. (2018) N. Scott et al., MNRAS 481, 2299 (2018), arXiv:1808.03365 [astro-ph.GA] .
- Land et al. (2008) K. Land et al., Mon. Not. Roy. Astron. Soc. 388, 1686 (2008), arXiv:0803.3247 [astro-ph] .
- Levi et al. (2013) M. Levi et al. (DESI), (2013), arXiv:1308.0847 [astro-ph.CO] .
- Bryant et al. (2016) J. J. Bryant et al., in Proc. SPIE, Vol. 9908 (2016) p. 99081F.