The accretion of dark matter subhaloes within the cosmic web: primordial anisotropic distribution and its universality
Abstract
The distribution of galaxies displays anisotropy on different scales and it is often referred as galaxy alignment. To understand the origin of galaxy alignments on small scales, one must investigate how galaxies were accreted in the early universe and quantify their primordial anisotropic at the time of accretion. In this paper we use N-body simulations to investigate the accretion of subhaloes, focusing on their alignment with halo shape and the orientation of mass distribution on large scale, defined using the hessian matrix of the density field. The large/small (e1/e3) eigenvalues of the hessian matrix define the fast/slow collapse direction of matter on large scale. We find that: 1) the halo major axis is well aligned with the e3 (slow collapse) direction, and it is stronger for massive haloes; 2) subhaloes are predominately accreted along the major axis of the host halo, and the alignment increases with the host halo mass. Most importantly, this alignment is universal; 3) accretion of subhaloes with respect to the e3 direction is not universal. In massive haloes, subhaloes are accreted along the e3 (even stronger than the alignment with the halo major axis), but in low-mass haloes subhaloes are accreted perpendicular to e3. The transit mass is lower at high redshift. The last result well explains the puzzled correlation (both in recent observations and simulations ) that massive galaxies/haloes have their spin perpendicular to the filament, and the spin of low-mass galaxies/haloes is slightly aligned with the filament, under the assumption that the orbital angular momentum of subhaloes is converted to halo spin.
Subject headings:
cosmology: theory – dark matter – large-scales structure of Universe – galaxies: halos - methods: statistical1. Introduction
In the cold dark matter universe (CDM), structures emerge from the initial seed of perturbations via gravitational instability. On large scales, the mass distribution is characterized as cosmic web (filaments, sheets, clusters, voids), which can be fairly described by a linear theory and the Zel’dovich approximation (Zel’dovich 1970). On small scales, dark matter haloes form by collapse of matter at the intersection of filaments, and they gradually merge and grow in a hierarchical and non-linear way. The detail of the dark matter halo properties and mass distribution on large scales can be accurately studied by N-body simulations (e.g. Springel et al. 2006). Under such a formation scenario, it is naturally expected that the properties of haloes are correlated with the large-scale structure (LSS). For example, the halo shape is well aligned with the cosmic filament (e.g., van Haarlen & van de Weygaert 1993; Hahn et al. 2007a; Aragon-Calvo et al. 2007a; Zhang et al. 2009; for a summary, see Forero-Romero et al. 2014 ), the halo spin is originated from the tidal torque force by the mass distribution on large scales (White 1984), and its direction is well correlated with the cosmic web (e.g., van de Weygaert & Bertschinger 1996; Bond et al. 1996; Lee 2004; Bailin & Steinmetz 2005; Hahn et al. 2007a; Zhang et al. 2009; Libeskind et al. 2012). Most importantly, the alignment between halo spin and the LSS has a dependence on halo mass (e.g., Aragon-Calvo et al. 2007a; Hahn et al. 2007b; Codis et al. 2012; Trowland et al. 2013; Dubois et al. 2014; Zhang et al. 2015).
These theoretically predicted correlations of the halo properties with LSS are manifested by the distribution of galaxies inside dark matter haloes, as galaxies are ’luminous’ tracers of merged haloes formed at early times. For example, satellite galaxies are found to be aligned with the major axis of central galaxies, with strong dependence on galaxy colors and halo mass (Brainerd 2005; Yang et al. 2006). Local dwarf satellites in the Milky Way and M31 are distributed anisotropically and most are in a large thin disk (Kroupa et al. 2005; Metz et al. 2007; Ibata et al. 2013). The shapes of luminous red galaxies are correlated with each other up to very large scales (e.g., Faltenbachler et al. 2007; Okumura et al. 2009; Li et al. 2013). Galaxy spin is also found to correlate with LSS although the measurements of the galaxy spin are not straightforward (e.g., Trujillo et al. 2006; Jones et al. 2010). More interestingly, it has been recently found that the correlation of the galaxy spin with the LSS depends on galaxy type/mass, such that the spin of early type galaxies is perpendicular to the filament around, but late-type galaxies have their spin slightly parallel to the filament (Tempel & Libeskind 2013; Zhang et al. 2015), in amazing good agreement with the theoretical expectations (e.g., Aragon-Calvo et al. 2007a).
The observed anisotropic distribution of galaxies on different scales raises the question of its origin. Some studies (e.g., Benson et al. 2005; Wang et al. 2005; Libeskind et al. 2005) have shown that satellite galaxies are accreted anisotropically during the formation of dark matter haloes, and this primordial anisotropy is the origin of the current anisotropic distribution of satellite galaxies. However, the observed distribution of galaxies within DM haloes involves complicated baryonic processes (e.g., Kang et al. 2005; Vogelsberger et al. 2014) and galaxies have experienced the non-linear dynamical evolution inside dark matter haloes. Along with the fact that the signal of the galaxy anisotropic distribution is much weaker, it is therefore difficult to infer how much of the currently observed anisotropic distribution of galaxies is from the primordial anisotropy set on large scales before galaxies were accreted, and how much of it is from the non-linear evolution inside the dark matter halo. For example, the anisotropic distribution of satellites respect to central galaxies can be purely ascribed to the non-linear evolution or the non-spherical nature of dark matter haloes (e.g.,Jing & Suto 2002; Kang et al. 2007; Wang et al., 2014; Dong et al. 2014; Debattista et al. 2015). For a recent review on galaxy alignments and its relation with the halo shape or the LSS, see Joachimi et al. (2015). The flip of the halo spin-LSS correlation (e.g. Aragon-Calvo et al. 2007a) also attracts great attention recently. Using hydrodynamical simulations, it was found that the flip is related to the halo merger history and cold gas accretion during the formation of elliptical and spiral galaxies (e.g., Codis et al. 2012; Welker et al. 2014; Codis et al. 2015).
To understand the observed correlation of the galaxy distribution with respect to the halo shape or the LSS in detail, one needs to trace galaxies back to the time of their accretion, to quantify the degree of the primordial correlation with DM haloes or the LSS at that time. This is often done by tracing subhaloes back to early times using N-body simulations. In this paper we study the spatial alignment of subhaloes with respect to the host halo shape and the LSS, and in a future paper we will focus on the velocity/spin correlation with LSS at the time of accretion. There were only a few studies using this kind of approach. Benson et al. (2005) found that subhaloes are preferentially accreted in the planes defined by the major and middle axes of the host haloes. Wang et al. (2005) also found that subhaloes are accreted along halo major axis and massive subhaloes show a stronger trend. However, they both ignored the correlation with the LSS. Recently, Libeskind et al. (2014) and Shi et al. (2015) find that subhaloes are predominantly accreted along the filament, but their classification of cosmic web is based on velocity shear or tidal field. In our paper we classify the cosmic web by means of the density field in order to classify the LSS environment, and our analysis goes to very low-mass haloes. In particular, we will show that our results are helpful to explain the puzzled non-universality in the correlation between halo/galaxy spin with the LSS.
The paper is organized as follows. In Section.2 we introduce the simulations and the methods to quantify the halo shape and the LSS. In section.3 we show how the halo shape is correlated with the LSS and the anisotropic distribution of accreted subhaloes with respect to the halo shape and the LSS. Then, we present their dependence on halo mass and redshift. In section.4 we summarize our results and briefly discuss how our results help to explain the correlation between the halo spin and the LSS.
2. N-body simulation and LSS classification
In this work we use two N-body simulations with different box sizes. Both simulations are run with the Gadget-2 code (Springel 2005) using the same number of particles of and the same cosmological parameters from the WMAP7 data (Komatsu et al. 2011, namely: , , and . The box sizes are and , and the particle masses in these two simulations are , and , respectively. With the larger simulation box we get more well resolved massive haloes, while the smaller box one allows us to resolve haloes down to low masses, about . We note that in the following analysis the results for haloes with mass below are from the simulation with small box size (), and for massive haloes we use the results from the simulation.
From the simulation output we firstly identify dark matter haloes using the standard friend-of-friend (FOF) algorithm, and each FOF halo should contain at least 20 particles. Then, subhaloes in each FOF halo are found using the SUBFIND algorithm (Springel et al. 2001) and their merger trees are also constructed. For details the readers can refer to Kang et al. (2005). We trace each subhalo back to the time when it was last identified as an independent FOF halo (labeled as ). In a very short time period (the next snapshot) the small halo will merge with a larger halo (host halo, labeled as ). By means of positions and velocities of the haloes and , we can obtain the time and position when the halo crosses the virial radius of halo for the first time. Note that in the following, when we refer to the subhalo distribution at accretion, we are actually referring to either the distribution of the halo with respect to the host halo , or with the large scale around the halo at the time when halo crosses the virial radius of for the first time.
For each FOF halo its virial mass is the enclosed mass within the virial radius inside which the mean density is times the critical density of the Universe (Bryan & Norman 1998). To measure the shape of each halo, we follow the traditional method to calculate the normalized inertia tensor defined as (Bailin & Steinmetz 2005),
| (1) |
where is the distance component of the particle to the halo center, and the summation is over all particles inside the virial radius. The three eigenvectors of define the orientation of the three axes of a halo, and the direction of the largest eigenvalue defines the major axis. Note that the minimum number of particles in each host halo is taken as 500, so the halo shape is more accurately determined (Jing & Suto 2002). We also tested the halo shapes (the three eigenvectoes) using all particles of the FOF halo, and found that they agree quite good with those from those using the particles inside the virial radius.
To define the LSS environment around each halo, we follow the most used method (e.g., Hahn et al. 2007a; Arag’on-Calvo et al. 2007b; Zhang et al. 2009,) by calculating the Hessian matrix at the position of each halo. The Hessian matrix of the smoothed mass density field is defined as,
| (2) |
where is the smoothed density with smooth length . There is lack of systematic census on which smooth length is the best to characterize the mass distribution on large scales (for partial discussions, see Hahn et al. 2007b; Forero-Romero et al. 2014). In most studies, a constant smooth length () is used at (e.g., Hahn et al. 2007a; Zhang et al. 2009; Codis et al. 2012; Trowland et al. 2013). However, it is found that an evolving smooth length is more physical reasonable and can better describe the evolution of the LSS environment (e.g., Hahn et al. 2007b; Libeskind et al. 2014). Following Hahn et al. (2007b), we adopt a smooth length roughly scaled as the virial radius of the typical mass for halo collapse at different redshfit (often written as ). To be able to compare with other studies at , we adopt . Actually, we also found that our results are not significantly affected by using other constant smooth length (1, 2, 5 Mpc/h) at all redshifts. We will show some comparison in Fig. 2.
The eigenvalues () of the Hessian matrix define the LSS environment around a halo, and it is classified as and depending on the number of positive eigenvalues. For example, there is no positive eigenvalue for a , one positive eigenvalue for a , and two positives for a . This classification of halo environment well mimics the description of Zel’dovich theory (for a review, see Cautun et al. 2014). Basically, the eigenvector (corresponding to the largest eigenvalue ) defines the fast collapse direction, and corresponds to the slowest collapse direction. For example, for a halo in a filament environment, gives the direction where the matter has not collapsed on large scales, and future mass accretion will mostly happen along . As the matter distribution along has not strongly collapsed, the halo is less compressed along this direction, and this is why the halo major axis will then have a tendency to align with , which has been shown in many studies (e.g., van Harrlem & van de Weygaert 1993).
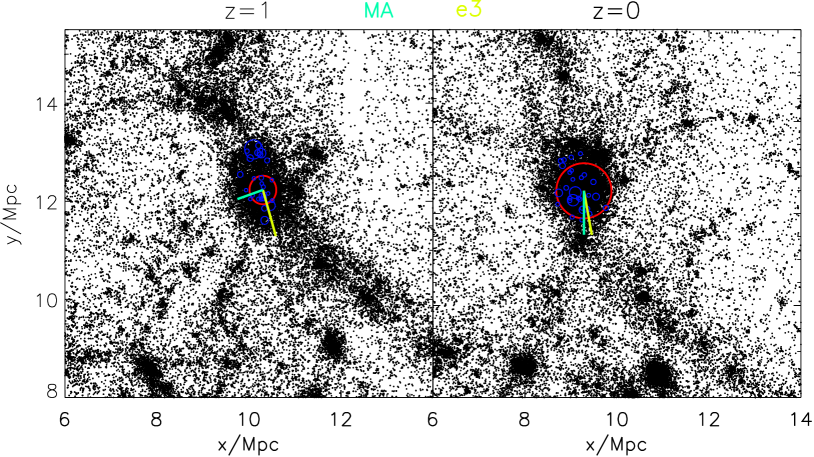
Fig. 1 illustrates the space configuration described above. The left panel shows the mass distribution around a selected host halo at , with virial radius labelled as the red circle. The blue circles denote the subhaloes which will merge with the host halo in a short time scales. The yellow line shows the direction, which is seen to be well aligned with the mass distribution on large scales. Cyan line is the direction along the major axis of the host halo. The position angles of subhaloes with the cyan/yellow line are and respectively. The right panel shows the distribution of those accreted subhalo at , their anisotropic distribution with respect to the host major axis can also be seen in the plot.
With the above descriptions, we are able to derive the spatial distribution of subhaloes with respect to the host halo and its LSS environment around. The angular position of the halo at the time of accretion with respect to the major axis of the halo is labeled as , and the angle respect to the slowest collapse direction () centered on is labeled as . For a random distribution, the expected value of is 0.5, and if is larger than 0.5, we refer to it as an alignment with the halo major axis or the LSS.
3. Results
3.1. Accretion along halo major axis and the LSS
Observations of galaxy distributions have found that satellite galaxies are aligned with the major axes of their host galaxies, and this alignment is dependent on the mass/color of the hosts (e.g., Yang et al. 2006). Due to the fact that the observed signal is weak compared to that from N-body simulations (e.g., Kang et al. 2007), satellite galaxies alignments can be explained if the central galaxy roughly follows the shape of the dark matter halo and the tracing becomes stronger with halo mass (e.g., Dong et al. 2014). Such an explanation implies that the observed alignment can be purely ascribed to the non-linear evolution inside DM haloes.
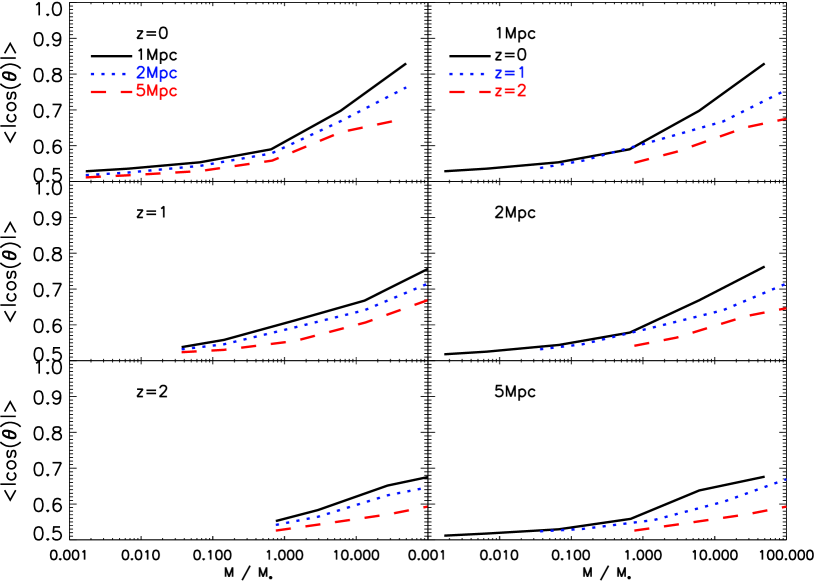
In the first part of this section we study if such an alignment between subhaloes positions and halo major axis (or of the LSS) can be seen at the time of accretion, and investigate which kind of alignment is stronger ( or ). Before discussing our results, we first check how the shape of dark matter haloes is correlated with the tidal field around them. In Fig. 2 we plot the average angle between the major axis of the halo and , the slowest collapse direction of the mass on LSS. In the left panel, we show the dependence of the alignment on smooth length (), and in the right panel we show the redshift evolution for a fixed smooth length. Note that here the halo mass is scaled by the characteristic mass () of halo collapsing at given different. By scaling the halo mass with we are actually studying the peak of the density field (with given height) with its LSS around, which has a more physical meaning (Hahn et al. 2007b; Trowland et al. 2013;)
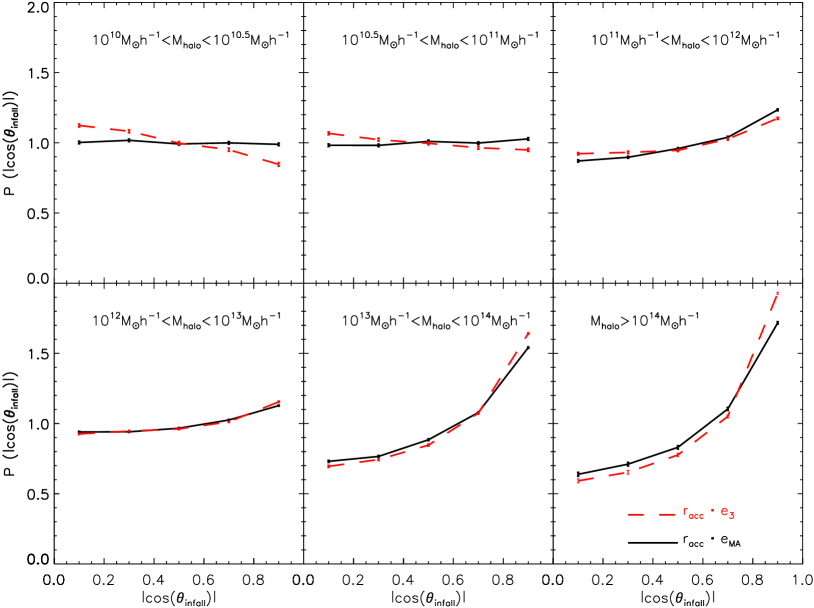
Fig. 2 shows that the major axis of the DM halo is well aligned with its LSS (), and the alignment increases with halo mass. The left panel shows that at given redshift, the alignment is stronger for a smaller smooth length (1Mpc/h), indicating that the mass distribution at large scale is better described by this smooth length. The right panel shows that at a given smooth length, the alignment is evolving with redshift, and being stronger at low redshift due to the non-linear evolution. The universal alignment between halo major axis with the orientation of the density field () agrees well with the published results so far (e.g., Forero-Romero et al. 2014, and references therein). The results clearly show that when a halo collapses its internal mass will be strongly compressed along the fast collapse direction where the mass over-density is highest, so the particles will more likely move along the least compressed direction . Such a scenario well captures the spirit of Zel’dovich theory and is a manifestation of the correlation between halo shape (density peak) and the orientation of the density field on large scale (van de Weygaert & Bertschinger 1996; Bond et al. 1996; Lee & Pen 2000; Porciani et al. 2002; Rossi 2013; Libeskind et al. 2014).
Now we investigate the primordial anisotropy of subhaloes at the time of accretion. As found in observations, the alignment of satellites is stronger in massive host haloes. For this reason, we investigate if the primordial anisotropy is also dependent on the mass of host haloes. We select host haloes at with a wide range of mass from to , and trace their subhaloes back to the accretion times. For each accretion event, we can get the angle between the infalling position of a subhalo (halo ) and the major axis of the host halo, , and the angle with the direction, , respectively. The distributions of them are shown in Fig. 3, and different panels are for host haloes with different virial mass at . The black solid lines are distributions of and red dashed lines are for .
Some interesting results can be seen from Fig. 3. Firstly, the infalling subhaloes have a tendency to align with halo major axes, and the alignment increases with host halo mass. However, the alignment with is different and, more importantly, it is not universal. In massive haloes (lower right panel), the alignment is even stronger than the halo major axis, but it is anti-aligned in low-mass host haloes (upper left panels), where subhaloes are accreted perpendicularly to . So, the accretion in low-mass haloes is preferentially along the fast collapse direction. This has important implication in explaining why the spin of low-mass haloes is aligned with the filament. We will show the results in detail in Section. 3.2.
The Zel’dovich theory predicts that structure formation proceeds subsequently along the three eigenvectors of LSS, i.e, it firstly collapse along to form a sheet, and then the second collapse happens along to form a filament. A halo will form if the matter along the filament () continues to collapse. In this secnario, the accretion of a growing halo is expected to along the recent collapsed direction (). Although the Zel’dovich approximation is only valid on linear scale in Lagrangian space, it remains valid to describe the feature in the Eulerian non-linear regime, as we see in the lower panels. Only on very small scales the accretion departs from the predictions of the Zel’dovich theory (upper left panels). On small scales, the mass accretion is more randomly, and being slightly aligned with the halo major axis, implying that mass accretion is more likely determined by the local halo potential. Departure of anisotropic accretion from the Zel’dovich prediction has been realized for a long time (e.g., Icke 1973; Silk & White 1978; Eisenstein & Loeb 1996). Bond & Myers (1996) provided a comprehensive description about the nonlinear anisotropic collapse of ellipsoids, which matches better the simulation results than the Zel’dovich theory.
Our results about subhalo accretion with marginally agree with the recent results of Libeskind et al. (2014) and Shi et al. (2015), who have also studied the accretion of subhaloes with respect to the LSS. Libeskind et al. (2014) found that subhaloes are predominantly accreted along the direction, and this effect increases with both the subhalo and host halo masses. As we will see in the next section, they obtained a positive alignment because their bins of host halo mass is wider, thus the anti-alignment from low-mass haloes is immersed in the positive alignment signal from high-mass haloes. Shi et al. (2015) use a method similar to ours to define the large scale structure, and they also found that subhaloes are accreted along the direction. However, their analysis is only for massive haloes () where their results are consistent with ours. It is not clear what are the results for subhalo accretion in the low-mass haloes in Shi et al. (2015).
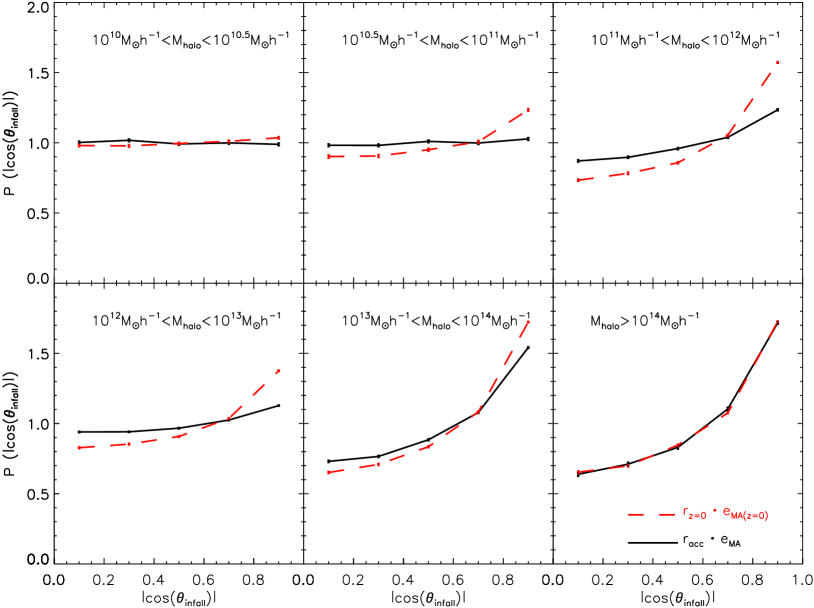
In Fig. 4 we compare the current alignment of subhaloes (using subhaloes’ positions and the host halo major axes at ) with that at infall. The black solid lines are the same as in Fig. 3, and the red dashed ones show the current alignment in different host haloes. It is seen that the alignment is stronger in massive haloes, which is consistent with what the data suggests. In general, the current alignment of subhaloes with their hosts is larger than the alignment at the time of accretion. A stronger evolution is more obvious in haloes with mass around . However, observed galaxies often live in haloes with mass larger than (Yang et al. 2006), and the observed alignment of galaxies is much weaker, even compared with the primordial alignment (black solid lines). So, it is still difficult to quantify how much of the observed signal is from the primordial alignment and from the evolution.
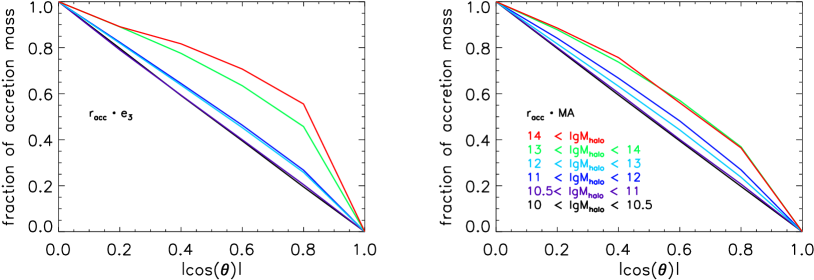
In Fig. 3 the distribution of accretion angle is a pure number counting, and not weighted by the mass of subhaloes. In Fig. 5 we plot the cumulative fraction of mass accreted along the direction (left panel) and along the major axes of haloes (right panel). Note that in our analysis the minimum halo mass counts only 20 particles, so we neglect the smooth mass accretion and consider only the resolved mass in subhaloes. It is seen that in massive haloes (), the net mass accretion is along the major axis of the host or along , and the latter is slightly stronger. For example, more than 50% of the resolved mass is accreted with . For low-mass host haloes, the mass accretion is close to be isotropic.
3.2. Dependence on accretion mass and redshift
Above we have shown the overall accretion of subhaloes along the halo major axis and of the LSS. However, in that analysis we fix the host halo mass at and study the accretion of their progenitors at high redshift. Doing that is to understand the primordial alignment of accreted subhaloes and to compare with their current alignment in the hosts. In this case, the main progenitors and the accreted subhalo mass are all evolved with redshift. In this part, we do not fix the host, but study the alignment for fixed host halo mass at different redshift. In this way, we can quantify the mass dependence and being able to compare with the recent study by Libeskind et al. (2014).
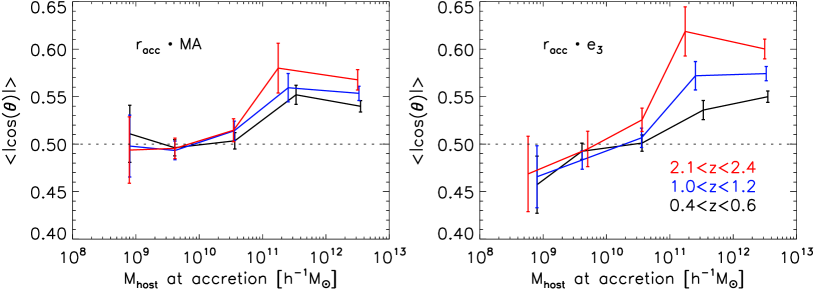
In Fig. 6 we show the alignment along the host halo major axis (left panel) and the direction (right panel). The left panel shows that the alignment with halo major axis increases with host halo mass, and it is stronger for haloes at high redshift. Note that here we do not scale the halo mass by the characteristic mass of halo collapsing (), as we did in Fig. 2. So for given halo mass, the density contrast is higher at high redshift. Note that for massive haloes the alignment from the simulation of box is systematically lower than that from the small box simulation, and this is due to some low-mass subhaloes that have not been resolved in the large-box simulation. Basically, our results agree with previous studies (e.g., Benson 2005; Wang et al. 2005; Shi et al. 2015) which state that the alignment with the halo major axis is stronger for massive haloes. It is also seen that the alignment is universal, i.e., that subhaloes are always accreted along the major axis although it is close to be isotropic for low-mass haloes.
The results in the right panel are more interesting. First, the accretion with of the LSS is stronger than the alignment with the halo major axis shown in the left panel, and it also increases with host halo mass and redshift. Moreover, such dependences on halo mass and accretion time are much stronger than the alignment with the halo major axis. Second, it is seen that the alignment with the is not universal. For low-mass haloes, th accretion is actually perpendicular to , and the transit mass of the alignment is around at , and it decreases to at .
Libeskind et al. (2014) also studied the alignment of subhaloes with the axis of the LSS around host haloes. However, their approaches are different from ours. Firstly, they use the velocity shear to define LSS, whereas we use the density field (see Forero-Romero et al. (2014) for discussion and comparison between the classification of the LSS based on density and velocity field). Secondly, the alignment of subhaloes in their analysis are measured when subhaloes cross a few virial radius () of the host halo. Although the approaches are quite different, we get similar dependences on host halo mass and redshift compared with their results. The main difference is that they found that the accretion is always along , while we find that for very low mass haloes, the accretion of subhaloes are perpendicular to . Regardness of the different approached, there are two possible additional reasons for the difference with our results. Firstly, In Libeskind et al. (2014) they combine the signal for host halo mass normalized by the characteristic mass, , of halo collapse. At , is about . They found that for all haloes with the accretion is along . For a rough comparison, if we also combine the accretion signal for haloes with at , we also find that the alignment is along . Secondly, the smooth length in Libeskind et al. is not constant for all haloes, but it is related to the virial radius of each halo. As we see in Fig. 2 using a small smooth length produces a stronger alignment between the halo major axis and the orientation of density field around, thus it is expected that the alignment with the LSS is close to the alignment with the halo major axis, and being more universal.
4. Conclusion and Discussion
In this paper, we use N-body simulations to study the anisotropy of subhalo accretion with respect to the halo shape (major axis) and the large scale structure around (, the least compressed direction). We have obtained these main results:
-
•
The major axis of dark matter halo is well aligned with the least compressed direction, , of the large scale structure around the halo, in agreement with the expectation from the Zel’dovich theory.
-
•
Subhaloes are accreted along the major axis of the host halo, and the alignment increases with host halo mass and redshift (stronger at high redshift). Most importantly, this alignment is universal (positive) across all halo mass.
-
•
The accretion of subhalo along is not universal. In massive host haloes, the accretion is aligned with , while in low-mass host haloes, the accretion of subhaloes is perpendicular to . The transit mass for this flip is lower at high redshift.
Our results show that there is a primordial anisotropy of subhaloes at accretion, and the degree of alignment is stronger than the observed alignment of satellites galaxies at . Thus, it is still difficult to conclude how much of the observed signal of galaxies is from the primordial alignment or from the evolution effect inside dark matter haloes. In any case, the misalignment between central galaxies and host haloes is needed so as to explain the observed degree of alignment between satellites and the shape of central galaxies (e.g., Dong et al. 2014).
Our result about the accretion with the direction has important implications on the correlation between the halo spin and the the LSS. Previous studies using N-body simulations (e.g., Zhang et al. 2015 and references therein) have reached convergent conclusion that the relation between halo spin and the LSS is not universal. For massive haloes, their spin is parallel with , while for low-mass haloes, their spin is perpendicular to . The characteristic mass for the flip of this correlation decreases with increasing redshift (e.g., Trowland et al. 2013). Some studies (Codis et al. 2012; Welker et al. 2014; Aragon-Calvo et al. 2014; Codis et al. 2015) pointed out that this is due to the disparity in the merger history of haloes with different mass. They speculated that for massive haloes, their subhaloes are accreted along the filament, and for low-mass haloes, their subhaloes are accreted perpendicular to the filament. Under the assumption that the orbital angular momentum of accreted subhaloes is transferred into the host halo spin, it is naturally to expected a non-universality of the halo spin with filaments. However, such a spectulation for mass accretion disparity is not clearly shown in their analysis. Our results, for the first time, show that the accretion along is really not universal, and the redshift dependence also agrees with the results from simulations.
In deriving the above non-universality of the alignment between subhalo accretion angle with the orientation of the LSS (), we use a constant smooth length for all haloes (although being evolving with reshift). Most previous results (see Forero-Romero et al. 2014 for references) used a constant smooth length (ranging between Mpc, well covered by our choice of smooth length), and most of them (if not all) reached agreement on the non-universality of the halo spin-LSS correlation. It implies that by using a constant smooth length for all halo mass, the non-universality on the accretion angle of subhaloes must be in place so as to explain the simulation results. Our results do support this implication. Nevertheless, our choice of smooth length means that we are actually looking at the mass accretion pattern on a fixed scale at given redshift. As shown by some studies (e.g., Aragon-Calvo et al. 2007a) using the multi-scale morphology filter to the density field, and they also found that the halo spin-LSS correlation has a mass dependence. This implies that the anisotropic accretion of subhalo could be both mass and redshift dependent, and it calls for a more complete study on subhalo accretion using different smooth length.
In addition to the subhalo accretion anisotropy, to further understand in detail the correlation between halo spin and LSS, one needs to study the formation history of the halo spin in different environment of the LSS, in order to identify which kind of mergers contribute to the final correlation. Such an analysis should make use of the velocity and spin information from N-body simulations. Also, one has to understand why the correlation between subhalo accretion and of LSS is different for high and low mass haloes. We will investigate these issues in a future paper.
5. Acknowledgments
We thank the anonymous referee for useful comments and suggestions. We also thank Emanuele Contini for careful reading of the manuscript and Noam Libeskind for discussions. This work is supported by the NSF of Jiangsu Province (No. BK20140050), 973 program (No. 2015CB857003, 2013CB834900), the NSFC (No. 11333008) and the Strategic Priority Research Program the emergence of cosmological structures of the Chinese Academy of Science (No. XDB09000000). The simulations are run on the Supercomputing center of CAS.
References
- Aragón-Calvo et al. (2007) Aragón-Calvo M. A., van de Weygaert R., Jones B. J. T., van der Hulst J. M., 2007a, ApJ, 655, L5
- Aragón-Calvo et al. (2007) Aragón-Calvo M. A.,Jones B. J. T., van de Weygaert R., van der Hulst J. M., 2007b, A&A, 474, 315
- Aragón-Calvo & Yang (2014) Aragón-Calvo M. A., Yang L. F., 2014, MNRAS, 440, L46
- Bailin & Steinmetz (2005) Bailin J., Steinmetz M., 2005, ApJ, 627, 647
- Benson (2005) Benson A. J., 2005, MNRAS, 358, 551
- Bond (1996) Bond J.R., Kofman L., Pogosyan D., 1996, Nature, 380, 603
- Bond & myers (1996) Bond J.R. & Myers S.T., 1996, ApJS, 103, 1
- Brainerd (2005) Brainerd T. G., 2005, ApJ, 628, L101
- Bryan & Norman (1998) Bryan G. L., Norman M. L., 1998, ApJ, 495, 80
- Cautun et al. (2014) Cautun M., van de Weygaert R., Jones B. J. T., Frenk C. S., 2014, MNRAS, 441, 2923
- Codis et al. (2012) Codis S., Pichon C., Devriendt J., Slyz A., Pogosyan D., Dubois Y., Sousbie T., 2012, MNRAS, 427, 3320
- Codis et al. (2015) Codis S., Pichon C., Pogosyan D., 2015, MNRAS, 452, 3369
- Debattista et al. (2015) Debattista V. P., van den Bosch F. C., Roškar R., Quinn T., Moore B., Cole D. R., 2015, MNRAS, 452, 4094
- Dong et al. (2014) Dong X. C., Lin W. P., Kang X., Ocean Wang Y., Dutton A. A., Macciò A. V., 2014, ApJ, 791, L33
- Dubois et al. (2014) Dubois Y., et al., 2014, MNRAS, 444, 1453
- Eisenstein & Loeb (1996) Eisenstein D.J. & Loeb A., 1996, ApJ, 459, 432
- Faltenbacher et al. (2007) Faltenbacher A., Li C., Mao S., van den Bosch F. C., Yang X., Jing Y. P., Pasquali A., Mo H. J., 2007, ApJ, 662, L71
- Forero-Romero, Contreras, & Padilla (2014) Forero-Romero J. E., Contreras S., Padilla N., 2014, MNRAS, 443, 1090
- Hahn et al. (2007a) Hahn O., Porciani C., Carollo C. M., Dekel A., 2007, MNRAS, 375, 489
- Hahn et al. (2007b) Hahn O., Carollo C. M., Porciani C., Dekel A., 2007, MNRAS, 381, 41
- Ibata et al. (2013) Ibata R. A., et al., 2013, Nature, 493, 62
- Icke (1973) Icke V., 1973, A&A, 27, 1
- Jing & Suto (2002) Jing Y. P., Suto Y., 2002, ApJ, 574, 538
- Joachimi et al. (2015) Joachimi B., et al., 2015, SSRv, 65
- Jones, van de Weygaert, & Aragón-Calvo (2010) Jones B. J. T., van de Weygaert R., Aragón-Calvo M. A., 2010, MNRAS, 408, 897
- Kang et al. (2005) Kang X., Jing Y. P., Mo H. J., Börner G., 2005, ApJ, 631, 21
- Kang et al. (2007) Kang X., van den Bosch F. C., Yang X., Mao S., Mo H. J., Li C., Jing Y. P., 2007, MNRAS, 378, 1531
- Komatsu et al. (2011) Komatsu E., et al., 2011, ApJS, 192, 18
- Kroupa, Theis, & Boily (2005) Kroupa P., Theis C., Boily C. M., 2005, A&A, 431, 517
- Lee (2004) Lee J., 2004, ApJ, 614, L1
- Lee & Pen (2000) Lee J., Pen U.-L., 2000, ApJ, 532, L5
- Libeskind et al. (2005) Libeskind N. I., Frenk C. S., Cole S., Helly J. C., Jenkins A., Navarro J. F., Power C., 2005, MNRAS, 363, 146
- Libeskind et al. (2012) Libeskind N. I., Hoffman Y., Knebe A., Steinmetz M., Gottlöber S., Metuki O., Yepes G., 2012, MNRAS, 421, L137
- Libeskind et al. (2014) Libeskind N. I., Knebe A., Hoffman Y., Gottlöber S., 2014, MNRAS, 443, 1274
- Metz, Kroupa, & Jerjen (2007) Metz M., Kroupa P., Jerjen H., 2007, MNRAS, 374, 1125
- Okumura, Jing, & Li (2009) Okumura T., Jing Y. P., Li C., 2009, ApJ, 694, 214
- Porciani, Dekel, & Hoffman (2002) Porciani C., Dekel A., Hoffman Y., 2002, MNRAS, 332, 325
- Rossi (2013) Rossi G., 2013, MNRAS, 430, 1486
- Shi, Wang, & Mo (2015) Shi J., Wang H., Mo H. J., 2015, ApJ, 807, 37
- Silk White (1978) Silk J. & White S.D.M., 1978, ApJ, 223, L59
- Springel (2005) Springel V., 2005, MNRAS, 364, 1105
- Springel, Frenk, & White (2006) Springel V., Frenk C. S., White S. D. M., 2006, Natur, 440, 1137
- Springel et al. (2001) Springel V., White S. D. M., Tormen G., Kauffmann G., 2001, MNRAS, 328, 726
- Tempel & Libeskind (2013) Tempel E., Libeskind N. I., 2013, ApJ, 775, L42
- Trowland, Lewis, & Bland-Hawthorn (2013) Trowland H. E., Lewis G. F., Bland-Hawthorn J., 2013, ApJ, 762, 72
- Trujillo, Carretero, & Patiri (2006) Trujillo I., Carretero C., Patiri S. G., 2006, ApJ, 640, L111
- van de Weygaert & (1996) van de Weygaert R. & Bertschinger E., 1996, MNRAS, 281, 84
- van Haarlem & van de Weygaert (1993) van Haarlem M., van de Weygaert R., 1993, ApJ, 418, 544
- Vogelsberger et al. (2014) Vogelsberger M., et al., 2014, MNRAS, 444, 1518
- Wang et al. (2005) Wang H. Y., Jing Y. P., Mao S., Kang X., 2005, MNRAS, 364, 424
- Wang et al. (2014) Wang Y. O., Lin W. P., Kang X., Dutton A., Yu Y., Macciò A. V., 2014, ApJ, 786, 8
- Welker et al. (2014) Welker C., Devriendt J., Dubois Y., Pichon C., Peirani S., 2014, MNRAS, 445, 46
- White (1984) White S. D. M., 1984, ApJ, 286, 38
- Yang et al. (2006) Yang X., van den Bosch F. C., Mo H. J., Mao S., Kang X., Weinmann S. M., Guo Y., Jing Y. P., 2006, MNRAS, 369, 1293
- Zel’dovich (1970) Zel’dovich Y. B., 1970, A&A, 5, 84
- Zhang et al. (2009) Zhang Y., Yang X., Faltenbacher A., Springel V., Lin W., Wang H., 2009, ApJ, 706, 747
- Zhang et al. (2015) Zhang Y., Yang X., Wang H., Wang L., Luo W., Mo H. J., van den Bosch F. C., 2015, ApJ, 798, 17