Spin alignments of spiral galaxies within the large-scale structure from SDSS DR7
Abstract
Using a sample of spiral galaxies selected from the Sloan Digital Sky Survey Data Release 7 (SDSS DR7) and Galaxy Zoo 2 (GZ2), we investigate the alignment of spin axes of spiral galaxies with their surrounding large scale structure, which is characterized by the large-scale tidal field reconstructed from the data using galaxy groups above a certain mass threshold. We find that the spin axes only have weak tendency to be aligned with (or perpendicular to) the intermediate (or minor) axis of the local tidal tensor. The signal is the strongest in a cluster environment where all the three eigenvalues of the local tidal tensor are positive. Compared to the alignments between halo spins and local tidal field obtained in N-body simulations, the above observational results are in best agreement with those for the spins of inner regions of halos, suggesting that the disk material traces the angular momentum of dark matter halos in the inner regions.
Subject headings:
cosmology: observations, large-scale structure of universe, methods: statistical1. Introduction
The galaxy distribution in large spectroscopic surveys, such as Sloan Digital Sky Survey (SDSS; York et al., 2000), have revealed a complex hierarchical network of structure, called the cosmic web, composed of clusters, filaments, sheets, and voids (e.g. Bond et al., 1996). In the current paradigm of galaxy formation, these structures arise from the linear growth of Gaussian density fluctuations in a nearly homogeneous early universe. Dark matter tends to flow out of the voids, accretes onto the sheets, collapses to the filaments, and finally accumulates onto the clusters at the intersections of the filaments. Due to the accretion history of the Universe, the angular momentum of dark matter halos and galaxies are generated and affected by their large-scale environment.
According to the tidal torque theory (TTT), protogalaxies acquire their angular momentum by the asymmetric interaction between their inertia tensor and the local tidal field (Peebles, 1969; Doroshkevich, 1970; White, 1984; Hoffman, 1986; Porciani et al., 2002a, b). The galaxy and halo spin directions are expected to be correlated with the principal axes of the local tidal tensor. Over the past decades, both numerical simulations and real redshift surveys have revealed such correlation between halos/galaxies and their local large-scale structure (Faltenbacher et al., 2002; Cuesta et al., 2008; Paz et al., 2008; Zhang et al., 2009; Wang et al., 2011; Codis et al., 2012; Trowland et al., 2013; Zhang et al., 2013; Tempel et al., 2013; Tempel & Libeskind, 2013; Cen, 2014; Dubois et al., 2014).
Using numerical simulations, Wang et al. (2011) found that halo spin vectors are preferentially aligned with the intermediate axes of the tidal field, which is consistent with the theoretical prediction using the linear tidal torque theory. Similar trends are also claimed from observational data. Based on the real-space tidal field reconstructed from the 2MASS redshift survey, Lee & Erdogdu (2007) claimed that there is a clear intrinsic alignment between the galaxy spins and the intermediate principal axes of the tidal tensor.
For halos in filaments from N-body simulations, recent studies reported a mass-dependence alignment signal between halo spins and filaments. The spins of low-mass halos tend to be parallel to filaments, while high-mass halos have orthogonal alignment (Aragón-Calvo et al., 2007; Hahn et al., 2007a; Codis et al., 2012; Trowland et al., 2013). For halos in sheets, the spin vectors tend to lie in the plane of the sheets, independent of halo mass (Aragón-Calvo et al., 2007; Hahn et al., 2007a, b; Zhang et al., 2009; Libeskind et al., 2012).
Observationally, the picture is not as clear because of limited statistics and because of the difficulty of properly defining cosmic filaments from observational data. Several studies have endeavored to solve this problem but give partly contradictory results (Trujillo et al., 2006; Lee & Erdogdu, 2007; Paz et al., 2008; Slosar & White, 2009; Cervantes-Sodi et al., 2010; Jones et al., 2010; Varela et al., 2012; Tempel et al., 2013; Tempel & Libeskind, 2013). For instance, while Trujillo et al. (2006); Lee & Erdogdu (2007); Paz et al. (2008) found alignment signals between the spin vectors of galaxies and the surrounding large-scale structures (e.g. filament and sheet), Cervantes-Sodi et al. (2010); Slosar & White (2009) found no statistical evidence for departure from random orientations. Using 2dFGRS and SDSS, Trujillo et al. (2006) found that spiral galaxies located on the shells of cosmic voids have their spins aligned preferentially in the void surface, whereas, Varela et al. (2012), who used the SDSS DR7 and Galaxy Zoo samples, found that the spins of spiral galaxies around voids tend to be perpendicular to the void surface. Based on SDSS DR7, a recent study by Tempel et al. (2013); Tempel & Libeskind (2013) showed that there is a different alignment between spiral and elliptical galaxies, arguing that the spin of spiral galaxies tends to lie parallel to their host filaments, whereas the spin of elliptical galaxies are aligned preferentially perpendicular to their filaments.
In short, observationally the spin alignment with the surrounding large-scale structure is still somewhat contradictory and inconclusive. In our previous paper (Zhang et al., 2013), we examined the alignment between the major axes of galaxies and their surrounding large-scale structure. We found that red galaxies are very significantly aligned with their filaments, while blue galaxies are only marginally aligned with respect to their filaments. In this paper, we investigate the spin vectors of spiral galaxies with respect to the surrounding large-scale environments. Here again we use the galaxy group catalog constructed from the SDSS DR7 (Abazajian et al., 2009). The cosmic tidal field we used is directly reconstructed from the group catalog using the method described in Wang et al. (2012). Based on the signs of the eigenvalues of this tidal field, we classify the environments of groups into four categories: clusters, filaments, sheets, and voids. The morphologies of galaxies used here are those obtained from the Galaxy Zoo 2 catalog (GZ2; Willett et al., 2013). We measure the spin vectors of spiral galaxies with respect to the principal axes of the local tidal tensor and study how these alignments depend on galaxy properties.
The paper is organized as follows. In Section 2, we present the observational data and the methodology used to measure the various alignment signals. The alignments of spiral galaxies with respect to cosmic web are present in Section 3. We compare the observational results with dark matter halos from N-body simulations in Section 4. Finally we summarize our results in Section 5.
2. Data and methodology
In what follows we describe the observational data we adopt to characterize the cosmic web and measure the alignment between the spin axes of galaxies relative to the large-scale structures.
2.1. The SDSS samples
The galaxy sample we use here is the New York University Value-Added Galaxy Catalog111http://sdss.physics.nyu.edu/vagc/ (NYU-VAGC; Blanton et al., 2005; Padmanabhan et al., 2008; Adelman-McCarthy et al., 2008), which is based on the multi-band imaging and spectroscopic survey SDSS DR7 (Abazajian et al., 2009). As the completion of the survey phase SDSS-II, DR7 features an imaging survey in five bands over a continuous region in the Northern Galactic Cap. The continuity over this large area is essential and critical to reconstruct the real-space tidal field from the SDSS survey. From the NYU-VAGC, we select galaxies in the Main Galaxy Sample with an extinction-corrected apparent magnitude brighter than , with redshifts in the range and with redshift completeness . A small subset galaxies have redshifts adopted from the Korea Institute from Advanced Study (KIAS) Value-Added Galaxy Catalog (Choi et al., 2007; Choi et al., 2010).
Using the adaptive halo-based group finder developed by Yang et al. (2005, 2007), we construct a catalog of galaxy groups (about groups with single galaxies). For each group, we assign a halo mass according to the ranking of its characteristic group luminosity, defined as the total luminosity of all group members with , where is the -band absolute magnitude, -corrected and evolution corrected to , using the method described by Blanton et al. (2003). In order to ensure sample completeness, in what follows we focus our analysis on the volume covering the redshift range , and within the largest continuous region in the Northern Galactic Cap. Using the complete galaxy groups with mass , Wang et al. (2012) constructed the mass, tidal and velocity (SDSS-MTV) fields in this volume. We use the method developed by Wang et al. (2009) to correct for the peculiar motion of groups as well as the finger-of-god effect. We have tested that our alignment signals are insensitive to the boundary effect. The smoothing length scale we used to reconstruct the tidal field is , as this value provides the best agreement with the visual classification of the large-scale structure (Hahn et al., 2007a, b). The smoothing scale is related to the mass contained in the Gaussian filter at mean density via , thus a smoothing scale corresponds to the mass .
2.2. The Cosmic Web
Following Wang et al. (2012), we calculate the tidal tensor using
| (1) |
where and are indices with values of , , or , and is the peculiar gravitational potential, which can be calculated from the distribution of dark matter halos with mass above some threshold value through the Poisson equation. At the position of each group, the tidal tensor is diagonalized to obtain the eigenvalues and (), as well as the corresponding eigenvectors , , and .
According to the Zel’dovich theory (Zeldovich, 1970), the sign of the eigenvalues of local tidal tensor can be used to classify the group’s environment into one of four categories (Hahn et al., 2007a, b):
-
•
cluster : a point where all three eigenvalues are positive;
-
•
filament : a point where has one negative and two positive eigenvalues;
-
•
sheet : a point where has two negative and one positive eigenvalues;
-
•
void : a point where all three eigenvalues are negative.
The direction of a filament at the location of a filament group can be identified with the eigenvector corresponding to the single negative eigenvalue. Likewise, the normal vector of a sheet for a sheet group is the eigenvector corresponding to the single positive eigenvalue of the tidal tensor.
2.3. Spin vectors of galaxies

We adopt the morphological classifications of galaxies from the Galaxy Zoo (GZ2) catalog (Willett et al., 2013)222http://data.galaxyzoo.org, which provides robust classifications into elliptical and spiral for galaxies. In the following analysis, we only use spiral galaxies with strings beginning with ’S’. This results in a sample of spirals in our survey volume. Based on group catalog, the sample contains centrals and satellite galaxies, among which centrals and satellites have reliable halo masses. To compare with the results from N-body simulations, we focus on the central galaxies with reliable halo masses. Based on local tidal fields described in the last subsection, galaxies () are located in cluster environments, () in filament , () in sheet , and () in void .
In order to obtain a more reliable detection of the spin vectors of galaxies, in this paper we only use a sample of spiral galaxies. If a spiral galaxy were a thin circular disk, the inclination angle , between the plane of the disk and the line of sight, can be determined from the projected minor-to-major axis ratio . Many studies used a simple model for the finite disk thickness to relate the apparent axis ratio and an intrinsic flatness parameter to obtain the inclination angles 333Note that in some analyses, the inclination angle is defined as the angle between the line of sight and the normal to the galaxy disk, so that ., , of galaxies (Haynes & Giovanelli, 1984; Lee & Erdogdu, 2007; Varela et al., 2012). Here we follow the same practice and obtain through
| (2) |
for and set for . According to Haynes & Giovanelli (1984), the intrinsic flatness depends on the morphological type of galaxies. However, we will use an average value of (Varela et al., 2012), since the variation of the flatness does not affect the calculation of the inclination angle significantly. We have repeated our entire calculation of the alignment assuming , and found that the results are very similar to those using .
Figure 1 shows the probability distribution of the inclination angles of galaxies. We find that the distribution differs significantly from a uniform distribution. This is mostly likely due to the fact that spiral galaxies have bulges which distort the projected axis ratio. If the axis ratio is measured around an isophote where the bulge contributes significantly, then the result can be affected. This effect becomes more and more significant for systems that are close to edge-on. Because of this, our following analysis will focus on galaxies with , which results in a sample of centrals and satellites.
From a two-dimensional image of a galaxy, projected on the sky, we can not decide which side of the galaxy is closer to us, which means that in the determination of using equation (2), a single value of corresponds to two values of the inclination angle: . To avoid this problem, many studies constrain their analysis to edge-on () and face-on () galaxies, which usually results in small samples of about a few hundreds of galaxies (e.g. Trujillo et al., 2006; Slosar & White, 2009; Jones et al., 2010). In this paper, we use all the spirals selected from GZ2 catalog. Throughout we apply the positive sign of for all the spirals. We have tested and found no difference in the alignment signal if using the negative sign for . However, the sign ambiguity is expected to reduce the strength of the alignment signal, as we quantify in the following section.
Following Trujillo et al. (2006); Lee & Erdogdu (2007); Varela et al. (2012), we compute the components of the spin vector as
| (3) |
where and are the right ascension and declination of a galaxy, respectively, is the inclination angle calculated from equation (2). The position angle increases counterclockwisely from north to east in the plane of the sky, and is specified by the magnitudes per square arc-second isophote in the -band.
2.4. Computation of the alignment


To estimate the correlation between spin vectors of galaxies and the large-scale structure, we compute the cosine of the angle, , defined as the angle between the spin axis of the galaxy, , and the three principal axes , , and of the local tidal tensor. To quantify the alignments and their significance, we generate random samples in which the orientations of the principal axes of the tidal tensors are kept fixed, but the spin axes of the galaxies are randomized. The alignment strength is then expressed by the normalized pair count (e.g. Yang et al. 2006):
| (4) |
where is the number of pairs for each bin in , and is the average number of such pairs obtained from the random samples. We use , where is the s.d. of obtained from the 100 random samples, to assess the significance of alignment in each bin. Since the significance is quantified with respect to the null hypothesis, we plot the error bars on top of the line. In addition to the normalized pair count, we also calculate the mean angle and , which is the standard deviation of for the random samples. In this paper, is restricted to the range . In the absence of any alignment, and . implies that the galaxy spin is parallel to the vector in question, while indicates it is perpendicular to it.
3. Results
3.1. Alignment between Galaxy Spin and Tidal Tensor

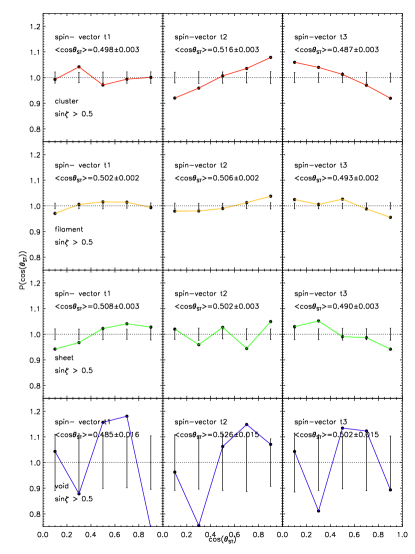
Figure 2 shows the normalized pair count of the cosine of the angle between the galaxy spin vector and the eigenvectors , , and of the local tidal tensor. In the left panel, the calculation of the alignment is based on all centrals and satellite spiral galaxies selected from GZ2. In the right panel, we repeat the measurements for galaxies with . As expected, galaxies with have stronger alignment signals because of the reduced uncertainty in the values of . The average cosines and their errors are displayed for reference.
Figure 2 shows that the galaxy spin vector has a weak tendency to be aligned with the intermediate axis , of the local tidal tensor, which is consistent with the theoretical prediction using the linear tidal torque theory (Lee & Erdogdu, 2007). Similar trends have been also found in simulation data. Based on the tidal field traced by halos from N-body simulation, Wang et al. (2011) found that the spin vector of halos with masses larger than shows significant alignment with the intermediate axis of the tidal field. Using a cosmological hydrodynamic simulation of galaxy formation in a cosmic filament, Hahn et al. (2010) found that the spin vector has a weak alignment with the intermediate axis of the tidal field for their medium mass sample at (see their figure ). We can also see that the galaxy spin tends to be perpendicular to the minor axis , which is consistent with the result shown in the right panel of figure in Lee & Erdogdu (2007). The alignment with the major axis is almost random.
It is interesting to see that the alignment signal for satellites is as strong as that for centrals. This may suggest that satellites can preserve their alignment with the large scale tidal field after they have fallen into their host halos.
Since we have the halo mass for each central galaxy, we can investigate how the spin-tidal field alignment signal depends on the halo mass of groups. To that extent we split the central galaxies into four sub-samples of halo masses. Figure 3 shows the alignment signals as a function of halo mass. As one can see, the alignment signals in middle panels appear to be slightly stronger for centrals in more massive halos. It’s also interesting to see that there is a transition of the alignment signals in the lower left panel, although the error bars are very large due to the small number galaxies with halo mass larger than .
3.2. Alignment of galaxies in different environments
Figure 4 shows the alignment between the three eigenvectors of the local tidal tensor and the spin vector of central galaxies which are located in cluster (red), filament (orange), sheet (green), and void (blue) environments. Here we see that for spiral galaxies in cluster environments (first row), the spin vectors have a significant alignment with the intermediate axis of the local tidal tensor. The upper right panel indicates that the spin vectors of galaxies in cluster environments have a strong anti-alignment with the minor axis of the local tidal tensor. For galaxies in sheet and filament environments, the alignments between spin vectors and the intermediate eigenvectors are rather weak. Due to the small number of galaxies in void environments, we can not obtain any useful information for these galaxies.
According to the definition of filament , the right panel in the second row in Figure 4 can be considered as the normalized pair count for the cosine of the angle between the spin vector and the direction of the filament in which the galaxy resides. There is a weak tendency that filament galaxies tend to have their spins preferentially perpendicular to their filaments, consistent with the prediction from the tidal torque theory. However, some of previous investigations found opposite alignments. Using edge-on galaxies () in filaments detected from SDSS DR5, Jones et al. (2010) found that only galaxies have their spin axes aligned perpendicular to their host filaments. This indicates that the spin of the edge-on galaxies tends to be parallel to their hosted filaments. However, as we have tested, if one only use edge-on or face-on galaxies, one needs to have a fairly large sample of filament directions to get statistically meaningful results. Otherwise the signals may not be reliable. For example, if we have only one filament which lies along the line of sight direction, the edge-on or face-on galaxies will all have perfect perpendicular or alignment signals by selection.
Based on a galaxy sample constructed from SDSS DR8, Tempel & Libeskind (2013) found that the spin axes of spiral galaxies tend to align with the host filaments, which is opposite to our alignment signal. This discrepancy may be due to the different methods used to identify filamentary structures. In their investigation, filaments are traced by thin cylinders placed on the galaxy number density field, while the filaments in our samples are obtained from the continuous potential field constructed with the use of the method of (Wang et al., 2009).
For spiral galaxies in sheet environments, the left panel in the third row in Figure 4 may be considered as the normalized pair count for the cosine of the angle between the spin and the normal of the sheet in which the galaxy resides. The results indicate that the spin vectors of sheet galaxies have a very weak tendency to align along the normal of the sheet. Using a sample of disk galaxies lying in the surfaces of voids obtained from SDSS DR7, Varela et al. (2012) found a significant tendency of galaxies around very large voids to have their spins aligned with the radial direction of the voids. This trend is consistent with our results. Using edge-on and face-on galaxies from the 2dFGRS and SDSS DR3, Trujillo et al. (2006) found that spiral galaxies located on the walls of the largest voids have spins lying preferentially on the void surface. The disagreement may again be due to the small number of galaxies Trujillo et al. (2006) used.
4. Comparison with N-body Simulations


To facilitate the interpretation of our results, we adopt two different N-body simulations using the massively parallel TreeSPH GADGET-2 code (Springel, 2005). The simulations evolved dark matter particles in and periodic boxes. The ‘glass-like’ initial conditions (White, 1996) were generate using the Zel’dovich approximation at redshift . The simulations adopted the cosmological parameters with , , , , and .
For the box simulation, the mass resolution and softening lengths are, respectively, and . This small volume simulation can give better statistics for halos with mass less than . The box simulation (mass resolution of ) is used for computing the alignment signals for halos with mass larger than .
Dark matter halos are identified at redshift using the standard FOF algorithm (Davis et al., 1985) with a linking length of times the mean inter-particle separation. To obtain a reliable measurement, only halos with more than dark matter particles are included for further analysis, resulting in a catalog including () halos with mass larger than () for () simulation. As comparison, we also use the SO (spherical over-density) algorithm to identify halos. Beginning with the most bound particles from the FOF halos, a sphere is grown around the particle until the mean interior density is equal to the input value , where is the over-density within a sphere with respect to the critical density of the universe. Here, we adopt and , representing the entire halo and the inner region, respectively.
To obtain a spin vector of a halo containing particles, we compute the total angular momentum using
| (5) |
where is the mass of a dark matter particle, denotes the position vector of particle relative to the center of mass, and is the velocity relative to the bulk velocity of the halo.
As mentioned before, the spin vectors of galaxies in observation are not uniquely defined because we do not know which side of the galaxy is closer to us. In order to check this projection effect, we construct a control halo catalog in which we have changed the spin vectors of halos randomly selected from the original halo catalog. The changed spin unit vector is computed by
| (6) |
where , is the original spin unit vector of a halo, and is the position unit vector of the halo, where we place a virtual observer at the corner of the simulation box. Note that the original and changed spin vector of a halo are symmetric with respect to the line-of-sight direction .
In the simulation, we have classified the cosmic web environment of a dark matter halo using the Density Field Hessian Matrix Method (Zhang et al., 2009), similar to the method used above based on the tidal tensor. Here, in order to compare with the alignment signals detected in the SDSS data, we compute the probability distribution function , where is the angle between the halo spin and the eigenvectors of the tidal tensor.
Figure 5 shows the normalized pair count of the cosine of the angle between the halo spin and the eigenvectors of the tidal tensor. The solid line corresponds to the control sample, in which the spin vectors of halos have been changed to model the projection effect in observation. The dashed line denotes the alignment signal from the original halo catalog in the N-body simulation, which is consistent with the results described in Zhang et al. (2009). From Figure 5, we find that the alignment strength for control sample decreases about , which means the indetermination of the spin vector in observation can reduce the alignment strength significantly.
The middle panels in Figure 5 show that the halo spin vector is aligned with the intermediate axis of the tidal tensor, and the strength of the alignment is stronger for higher mass halos. The results plotted in the right panels show that halo spin vector is aligned with the minor axis of the tidal field for low mass halos but tends to be perpendicular to it for massive halos. This mass dependence is consistent with recent results obtained for halo spin alignments with respect to filaments (Aragón-Calvo et al., 2007; Hahn et al., 2007a; Codis et al., 2012; Trowland et al., 2013). As comparison, Figure 6 shows the alignment signals for SO halos with the over-density . The strength of the alignment signals is only slightly weaker than that for FOF halos. The observational alignment signals shown in Figure 2 are in general agreement with N-body simulation results, in that only galaxies in halos with masses larger than show significant alignments with the intermediate axis. Figure 7 shows the alignment signals for SO halos where spin vectors are calculated only by using the inner regions within which the over-density . Here we see that the alignment signals are weaker than those for the entire halos. In particular the tendency that spin vectors are perpendicular to the major axis seen for the total FOF and SO halos is now replaced by a weak alignment. There is a stronger tendency for spin axes of the inner halos to be perpendicular to for halos with mass larger than . These results match better the observational results for spiral galaxies, suggesting that disk material may follow better the angular momentum of the halo material in the inner parts.
5. SUMMARY
Using spiral galaxies selected from the SDSS DR7 and the GZ2, we have investigated the alignment between the spin of galaxies and their surrounding large-scale structure, which is characterized by the local tidal tensor. Based on the eigenvalues of the tidal tensor at the location of each galaxy group, we have classified the galaxy population into four different environments: cluster , filament , sheet and void . We have found that the spin axes of central spiral galaxies selected from the GZ2 have a weak tendency to be aligned with the intermediate direction of the local tidal tensor. This is consistent with the theoretical prediction using the linear tidal toque theory (Lee & Erdogdu, 2007). There is almost no significant alignment between the spin axes of spiral galaxies and the major axis of the local tidal tensor, while the spins of spiral galaxies have a weak tendency to be perpendicular to the minor axis vector (defined as the direction of the eigenvector of the tidal tensor associated with the single negative eigenvalue ).
The galaxies in cluster environment show the most prominent alignment signals. For all spiral galaxies in filament environment, the spin axes show a weak tendency to be perpendicular to their filaments. For galaxies in sheet environment, there is a weak tendency for their spins to align with the norm of the sheet.
Using large N-body simulations, we check the projection effect in observation by constructing a control halo catalog, in which the spin vectors of halos have been changed to mimic the fact that it is impossible to determine which side of the galaxy is closer to us from the observed axis ratio. This indetermination can reduce the alignment strength significantly. The simulations also show that the spin vectors of the inner regions of halos have weaker alignments with the local tidal field than the spin vectors obtained for the whole halos. The observational results are consistent with the alignments obtained for the inner regions of halos, suggesting that the disk material traces the angular momentum of dark matter halos in the inner region.
Acknowledgements
This work is supported by the 973 Program (No. 2015CB857002), national science foundation of China (grant Nos. 11203054, 11128306, 11121062, 11233005, 11073017), NCET-11-0879, the Strategic Priority Research Program “The Emergence of Cosmological Structures” of the Chinese Academy of Sciences, Grant No. XDB09000000 and the Shanghai Committee of Science and Technology, China (grant No. 12ZR1452800).
This work is supported by the High Performance Computing Resource in the Core Facility for Advanced Research Computing at Shanghai Astronomical Observatory.
References
- Abazajian et al. (2009) Abazajian, K. N., Adelman-McCarthy, J. K., Agüeros, M. A., et al. 2009, ApJS, 182, 543
- Adelman-McCarthy et al. (2008) Adelman-McCarthy, J. K., Agüeros, M. A., Allam, S. S., et al. 2008, ApJS, 175, 297
- Aragón-Calvo et al. (2007) Aragón-Calvo, M. A., van de Weygaert, R., Jones, B. J. T., & van der Hulst, J. M. 2007, ApJ, 655, L5
- Blanton et al. (2003) Blanton M. R. et al., 2003, AJ, 125, 2348
- Blanton et al. (2005) Blanton, M. R. et al., 2005, AJ, 129, 2562
- Bond et al. (1996) Bond J. R., Kofman L., Pogosyan D., 1996, Nature, 380, 603
- Cen (2014) Cen, R. 2014, ApJ, 785, L15
- Cervantes-Sodi et al. (2010) Cervantes-Sodi, B., Hernandez, X., & Park, C. 2010, MNRAS, 402, 1807
- Choi et al. (2007) Choi, Y., Park, C., & Vogeley, M. S. 2007, ApJ, 658, 884
- Choi et al. (2010) Choi, Y.-Y., Park, C., Kim, J., et al. 2010, ApJS, 190, 181
- Codis et al. (2012) Codis, S., Pichon, C., Devriendt, J., et al. 2012, MNRAS, 427, 3320
- Cuesta et al. (2008) Cuesta, A. J., Betancort-Rijo, J. E., Gottlöber, S., et al. 2008, MNRAS, 385, 867
- Davis et al. (1985) Davis, M., Efstathiou, G., Frenk, C. S., & White, S. D. M. 1985, ApJ, 292, 371
- Doroshkevich (1970) Doroshkevich, A. G. 1970, Astrofizika, 6, 581
- Dubois et al. (2014) Dubois, Y., Pichon, C., Welker, C., et al. 2014, arXiv:1402.1165
- Faltenbacher et al. (2002) Faltenbacher, A., Gottlöber, S., Kerscher, M., Müller, V. 2002, A&A, 395, 1
- Hahn et al. (2007a) Hahn, O., Carollo, C. M., Porciani, C., & Dekel, A. 2007a, MNRAS, 381, 41
- Hahn et al. (2007b) Hahn, O., Porciani, C., Carollo, C. M., & Dekel, A. 2007b, MNRAS, 375, 489
- Hahn et al. (2010) Hahn, O., Teyssier, R., & Carollo, C. M. 2010, MNRAS, 405, 274
- Haynes & Giovanelli (1984) Haynes, M. P., & Giovanelli, R. 1984, AJ, 89, 758
- Hoffman (1986) Hoffman, Y. 1986, ApJ, 301, 65
- Jones et al. (2010) Jones, B. J. T., van de Weygaert, R., & Aragón-Calvo, M. A. 2010, MNRAS, 408, 897
- Lee & Pen (2000) Lee, J., & Pen, U.-L. 2000, ApJ, 532, L5
- Lee & Erdogdu (2007) Lee, J., & Erdogdu, P. 2007, ApJ, 671, 1248
- Libeskind et al. (2012) Libeskind, N. I., Hoffman, Y., Knebe, A., et al. 2012, MNRAS, 421, L137
- Padmanabhan et al. (2008) Padmanabhan, N., Schlegel, D. J., Finkbeiner, D. P., et al. 2008, ApJ, 674, 1217
- Paz et al. (2008) Paz, D. J., Stasyszyn, F., & Padilla, N. D. 2008, MNRAS, 389, 1127
- Peebles (1969) Peebles, P. J. E. 1969, ApJ, 155, 393
- Porciani et al. (2002a) Porciani, C., Dekel, A., & Hoffman, Y. 2002, MNRAS, 332, 325
- Porciani et al. (2002b) Porciani, C., Dekel, A., & Hoffman, Y. 2002, MNRAS, 332, 339
- Slosar & White (2009) Slosar, A., & White, M. 2009, JCAP, 6, 9
- Springel (2005) Springel, V. 2005, MNRAS, 364, 1105
- Tempel et al. (2013) Tempel, E., Stoica, R. S., & Saar, E. 2013, MNRAS, 428, 1827
- Tempel & Libeskind (2013) Tempel, E., & Libeskind, N. I. 2013, ApJ, 775, L42
- Trowland et al. (2013) Trowland, H. E., Lewis, G. F., & Bland-Hawthorn, J. 2013, ApJ, 762, 72
- Trujillo et al. (2006) Trujillo, I., Carretero, C., & Patiri, S. G. 2006, ApJ, 640, L111
- Wang et al. (2009) Wang, H., Mo, H. J., Jing, Y. P., Guo, Y., van den Bosch, F. C., & Yang, X. 2009, mnras, 394, 398
- Wang et al. (2011) Wang, H., Mo, H. J., Jing, Y. P., Yang, X., & Wang, Y. 2011, MNRAS, 413, 1973
- Wang et al. (2012) Wang, H., Mo, H. J., Yang, X., & van den Bosch, F. C. 2012, MNRAS, 420, 1809
- White (1984) White, S. D. M. 1984, ApJ, 286, 38
- White (1996) White S. D. M. 1996, in Cosmology and Large-Scale Structure, ed. R. Schaefer, J. Silk, M. Spiro, & J. Zinn-Justin, (Dordrecht: Elsevier), 39
- Willett et al. (2013) Willett, K. W., Lintott, C. J., Bamford, S. P., et al. 2013, MNRAS, 435, 2835
- Varela et al. (2012) Varela, J., Betancort-Rijo, J., Trujillo, I., & Ricciardelli, E. 2012, ApJ, 744, 82
- Yang et al. (2005) Yang, X., Mo, H. J., van den Bosch, F. C., & Jing, Y. P. 2005, MNRAS, 356, 1293
- Yang et al. (2006) Yang, X., van den Bosch, F. C., Mo, H. J., et al. 2006, MNRAS, 369, 1293
- Yang et al. (2007) Yang, X., Mo, H. J., van den Bosch, F. C., et al. 2007, ApJ, 671, 153
- York et al. (2000) York, D. G., Adelman, J., Anderson, J. E., Jr., et al. 2000, AJ, 120, 1579
- Zeldovich (1970) Zel’dovich, Y. B. 1970, A&A, 5, 84
- Zhang et al. (2009) Zhang, Y., Yang, X., Faltenbacher, A., et al. 2009, ApJ, 706, 747
- Zhang et al. (2013) Zhang, Y., Yang, X., Wang, H., et al. 2013, ApJ, 779, 160