On the star formation efficiency in high redshift Lyman- emitters
Abstract
We present semi-analytical models of high redshift Lyman- emitters (LAEs) in order to constrain the star formation efficiency in those galaxies. Our supernova feedback induced star formation model along with Sheth-Tormman halo mass function correctly reproduces the shape, amplitude and the redshift evolution of UV and Lyman- luminosity functions of LAEs in the redshift range to 7.3. We show that the fraction of Lyman- emitting galaxies increases with increasing redshifts reaching to unity just after the reionisation. However, we show that star formation efficiency in those LAEs does not show any redshift evolution within the uncertainty in available observations. This would have significant repercussion on the reionisation of the intergalactic medium.
Galaxies: high-redshift, intergalactic medium, stars: supernovae: general
1 Introduction
High redshift galaxies with strong Lyman- emission (i.e. Lyman- emitters) are detected using narrow band searches with targeted redshifts. Such narrow band technique is successful in detecting Lyman- emitters (LAEs) in the redshift range [i.e. 1, 2, 3, 4, 5, 6, 7, 8, 9, 10, 11, 12, 13, 14]. However, their detectability depends on the emissivity of Lyman- line and the radiative transport of it through the galaxy as well as through the intergalactic medium (IGM). In addition to narrow band searches galaxies are regularly identified using “drop-out” technique [i.e. 15] even upto a redshift [16, 17, 18, 19, 20]. Galaxies detected by this technique are known as Lyman break galaxies (LBGs). Unlike narrow band searches, the dropout technique is very efficient in selecting galaxies with strong stellar UV continuum and hence biased by the UV luminosity of galaxies. Thus, these two techniques are successful in detecting galaxies with different selection bias and provide useful constraints on different physical properties of such galaxies. Therefore, one should consider both of them together in any theoretical study of galaxy evolution. Even though present day improved observational technology has made an impressive number of observational studies of LAEs available, the theoretical understanding of them is still in preliminary stages. This is because, the Lyman- line is a resonant transition and the Lyman- emissivity depends on many physical properties of the host galaxy such as amount of star formation, initial mass function of stars, the dust and neutral hydrogen content and the velocity field of the interstellar medium that governs the Lyman- escape fraction, the duty cycle of Lyman- phase etc. These are still poorly constraint from the present day observations. Several studies of Lyman- emitters are available in the literature using simulation [21, 22, 23, 24, 25, 26, 27, 28] and semi-analytical models [29, 30, 31, 32, 33, 34, 35, 36, 33].
However, recent advancement of observations extending to higher redshifts, especially the constraints on the escape fraction of Lyman- photons in high redshift galaxies [i.e. 37] has enabled us to revisit it again. Further, it is well demonstrated that the supernova feedback is very important in determining the star formation in galaxies even in high redshifts [i.e. 38]. Therefore, in this work, we explore the luminosity functions of high redshift Lyman- emitters taking into the supernova feedback in the star formation[39, 40, 41, 42].
Further note that star formation efficiency (SFE) of high redshift galaxies is a very important physical property as it plays the key role in any processes associated with galaxy evolution[43]. Especially it decides galaxy driven processes such as reionisation history and Lyman- emitting galaxies are likely to play important role in reionisation. The star formation efficiency is basically defined as the fraction of baryonic gas that is converted to stars in a virialized dark matter halo. In any semi-analytical model it is the most basic parameter that one assumes. Thus it is important to constrain this from available observations. Some previous works such as [44], using cosmological simulation, claimed that SFE around is enough to fit the observed Lyman- luminosity function at . Further, [33] found a non evolving nature in SFE and suggesting the SFE be 10% between and 6.5. By considering early reionization model(ERM) and late reionization model(LRM), [30] also provided a constant SFE value for to 6.56 ( 10% for ERM and 8% for LRM). In this work we also constrain the star formation efficiency in Lyman- emitting galaxies in a wide redshift range of using all updated observations.
The paper is organised as follows. In next section we briefly describe our semi-analytical model. Our results are discussed in section 3 and finally in section 4 we conclude. Here, we consider the CDM cosmology frame work and use the cosmological parameters of data [e.g., 45] (, , , and ).
2 Lyman- Luminosity Function
We first proceed to estimate Lyman- luminosity functions of galaxies at different redshifts. In order to do so, we consider the supernova feedback regulated star formation model of [41] for individual galaxies. We briefly describe the model here.
2.1 Star formation model
The baryonic gas inside a dark matter halo, after virialization, is heated up to the virial temperature of the halo. The gas then cools down due to radiative cooling and accretes to the centre of the halo. Such accretion of cold baryonic gas towards the centre of halo enhances the baryonic density at the central part and leads to star formation in a galaxy [46].
On the other hand, massive stars explode as supernovae in relatively short time scale, which drives the cold baryonic gas out of the galaxy. Such outflow reduces the star formation in the host galaxy as availability of cold baryonic gas goes down. We assume that the outflowing mass is proportional to the instantaneous star formation and the star formation is proportional to the available cold gas. Such an assumption is motivated by Kennicutt-Schmidt law [47] that says the star formation rate is proportional to gas density. Finally, the star formation rate () in a halo of total mass evolves as [41]
| (1) |
Here, governs the star formation efficiency of the galaxy and determines the duration of star formation activity in terms of the dynamical time scale, . Throughout this work we have assumed = 4, which is determined by constraining UV lumniosity functions of LBGs [38]. Further, is the total baryonic gas mass in the halo which is taken to be . The supernova feedback process is regulated by the parameter , defined as [41], where is the baryonic mass driven out from the host galaxy by the outflow and over dot represents the time derivative. Note that, depending on the outflow mechanism, can be related to the circular velocity of the galaxy () as [e.g., 48, 49, 50, 51, 52]; is the circular velocity for the galaxy where . Further, if the outflow is driven by the hot gas and/or cosmic rays produced in supernovae shocks, then . On the other hand, if the momentum of the gas drives the outflow, [42, 46] . It was shown by [41] [also see 38] that model is preferred by various observations of high redshift galaxies and hence we use it here along with km/s.
Note that, the baryonic gas in halos collapsed in the neutral region of the universe can cool in presence of atomic hydrogen and host star formation, if the virial temperature () of the halo is greater than K. Below this temperature (and hence in halos with K) gas can cool only in presence of molecular hydrogen. In this work, we only consider galaxies that are cooled via atomic hydrogen cooling. This leads to a minimum halo mass of M⊙ that can host star formation at . Further because of radiative feedback, galaxies collapsed in ionized region of the universe, due to the increased in the Jean’s mass, can host star formation if the circular velocity is km/s [see 53, 54, 55, 41]. For this we assume a complete suppression of star formation in galaxies with km/s and no suppression in galaxies with km/s. In the intermediate halo mass region, i.e. for halo mass with 35 km/s km/s , we have used a linear suppression factor from to by which the star formation is reduced in such halos. Further, AGNs activities in high mass galaxies are likely to produce a negative feedback on star formation in those galaxies [56, 57]. In order to model that, we also consider a suppression factor of on star formation in high mass halos due to possible AGN feedback. Such a scenario explains the bright end of the UV luminosity functions of LBGs [38].
2.2 Luminosity functions
The star formation described above will produce stars of different masses (we assume a Salpeter initial mass function of stars in the mass range M⊙). The UV photons coming from massive stars can ionize neutral hydrogen of interstellar medium (ISM). Recombination of those ionised hydrogen can lead to production of Lyman- photons. In a case B recombination scenario, of ionising photons produce Lyman- photons [58]. Thus, the star formation rate (i.e. Eq. 1) can be used to calculate the Lyman- luminosity() produced in a star forming galaxies, i.e. [31],
| (2) |
Here, is the energy of a Lyman- photon, i.e. eV and is the escape fraction of the hydrogen ionizing photons from the host galaxy. Further, represents number of hydrogen ionizing photons produced per unit baryonic mass of star formation and it depends on the initial mass function and the metalicity of the gas. For our work we have taken per baryonic mass [59, 60]. Escape fraction of ionizing photon () from host galaxy is a poorly known quantity from observation [44, 61, 62]. In our work we have used [63] that self consistently reproduces the observational constraints on reionisation. We will also consider how our model predictions differ for a range of as it is constrained from observations[64, 65].
Note that Eq. 2 provides the intrinsic Lyman- luminosity of a galaxy. However, Lyman- luminosity that we observe is less than that because it can be absorbed in the host galaxy ISM as well as in the IGM by the dust as well as neutral hydrogen. We consider a fraction of the total Lyman- finally reaches to us. Thus the observed Lyman- luminosity of a galaxy is given by
| (3) |
In order to calculate the Lyman- luminosity functions we need the formation rate of halos/galaxies at different redshifts. We use the redshift derivative of Sheth-Tormen (ST) mass function [66] to calculate the formation rate of dark matter halo. Note that redshift derivative of mass function provides the difference of the formation and the destruction rate of halos. Here we assume that redshift derivative of ST mass function closely follows the formation rate of halos [see 67, for a detail discussion on it]. The Lyman- luminosity function for luminosity at a given observed redshift is given by [41]
| (4) |
Here, is the number density of the dark matter halos having masses between to + and collapsed between and , obtained from the ST mass function. The delta function , ensures that the integral survives only for those galaxies with mass which formed at greater than the observed redshift and having observed Lyman- luminosity, . Further, the lower limit of the mass integral, , is decided by the cooling criteria discussed above.
Note that not all galaxies are likely to show up as Lyman- emitters. In fact it has been found observationally that only a fraction of galaxies that are found using the Lyman-break technique is detectable as Lyman- emitters [see 68, 69, 70].
Thus, in our work we assume that a fraction, of all galaxies shows up as Lyman- emitters. We simultaneously fit observed UV luminosity function of Lyman-break galaxies (LBGs) and UV luminosity function of Lyman- selected sample at a similar redshift to obtained the value of . In order to obtained UV luminosity functions of LBGs we follow [41]. Note that Eq. 4 can be used to calculate UV luminosity function of LBGs if the luminosity is the UV luminosity of the galaxy that can be obtained by convolving the star formation rate with UV luminosity of a single burst of star formation [see 60, for detail]. Further, the UV luminosity is also affected by the dust in the galaxies i.e. dust attenuation and like the Lyman- luminosity we assume that only a fraction of the intrinsic UV luminosity is finally reached to us. Thus, we use the combination, as a free parameter of our model and fit the observed UV luminosity function of LBGs at different redshifts by varying that [60]. On the other hand we vary combination with redshifts to fit observed Lyman- luminosity functions at different redshifts.
3 Results
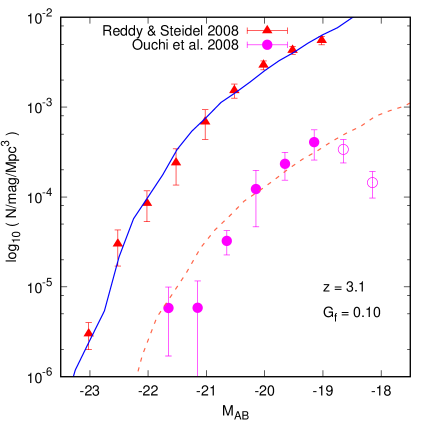
In this section we show our model predictions and compare them with the available observations in order to constrain our model parameters. We first concentrate at redshift . In Fig. 1 we have shown the UV luminosity functions of LBGs at as predicted by our model by the solid red line. The corresponding observational data are shown by the red filled triangles with error bars adopted from [71]. We have used minimization technique to match our model with observation. It is clear from the figure that a reasonably good agreement is obtained between the model and observed data with value of . We now turn to the UV luminosity function of Lyman- emitters in the similar redshift, i.e. . As mentioned above we assume that a fraction of all LBGs shows up as LAEs. Thus we scaled the above fitted UV luminosity function of LBGs by factor to match with the observational UV luminosity function of LAEs keeping all other parameters the same.
The model prediction and the observational data from [7] are also shown in Fig. 1 by the dashed red curve and solid magenta filled circles with error bars respectively. We see that a good agreement is obtained with . Similar values were obtained by [68] and [52]. Thus we conclude that only 10% of total galaxies shows up as LAEs at . Note that, due to larger uncertainties in the UV luminosity function of LAEs we do not use -mechanism to obtain the value of . Further, due to incompleteness in the observed data points of the two lowest luminosity bins (as shown by open circles) we omitted them from fitting [see 7, for details]. This has been used in finding the Lyman- luminosity functions of Lyman- emitters that we consider next.
| 2.0 | 0.05 | 0.83 | ||||
| 0.10 | 1.04 | |||||
| 3.1 | 0.10 | 0.52 | ||||
| 3.7 | 0.10 | 0.46 | ||||
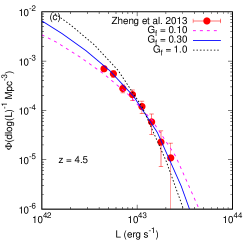
| 4.5 | 0.10 | 1.87 | ||||
| 0.30 | 0.82 | |||||
| 1.0 | 1.40 | |||||
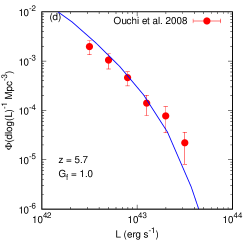
| 5.7 | 1.0 | 2.07 | ||||
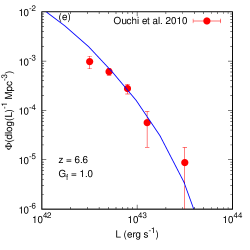
| 6.6 | 1.0 | 2.00 | ||||
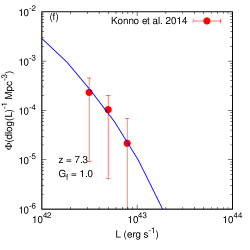
| 7.3 | 1.0 | 0.72 |
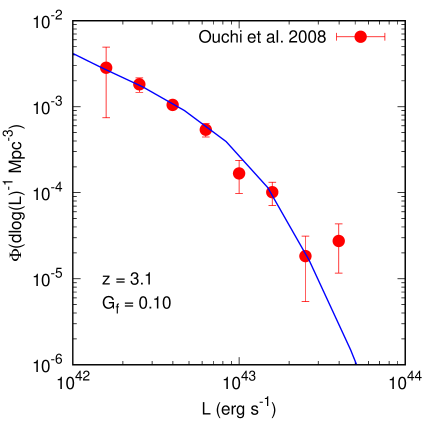
Fig. 2 shows our model prediction of Lyman- luminosity function at by solid line and the observed data points from [7] (filled circles). Here also, we use -minimization to fit the model with observation by varying . We can see that our model well reproduces the shape and amplitude of the Lyman- luminosity function of LAEs. Thus our feedback induced star formation model provides a good description of Lyman- emitters at . The fitted value along with uncertainty for is at . Now, as already mentioned [37] has measured from observations at . Using this we estimate where we add the observational uncertainty in and the fitting uncertainty of in quadrature. Note that the bright end of the observed Lyman- luminosity function suffer from cosmic variance due to limited survey volume and future large volume survey will help us to understand the nature of such bright LAEs.
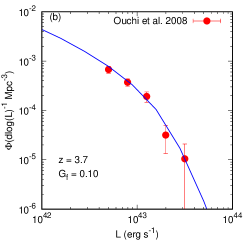
The procedure described above for has been followed for all other redshift bins, 3.7, 4.5, 5.7, 6.6 and 7.3. The resulting values of , and hence the are tabulated in Table 1. We also provide the best fit values. The fitted Lyman- luminosity functions of LAEs and the observational data are shown in Fig. 3. Note that the observed UV luminosity function of LAEs in all these redshifts are not available except for , 3.7 and 5.7 and hence can not be estimated at those redshifts (i.e. at , 4.5, 6.6 and 7.3) using the procedure describe earlier for . In absence of this, at we have used as obtained from near by redshift (i.e. at ) as well as because of the trend seen from other redshifts that decreases with decreasing redshift. From the value of we see that both these values provide similar fit the observed Lyman- luminosity function. For , using as obtained at or our model predictions do not provide a good fit to the observational data as can be seen from the value of . An intermediate value provide the best fit in this redshifts. This is also consistent with the increasing trend of with increasing redshift. For we have used as obtained at , and we get good fit of the model predictions with observational data. Thus we conclude that even though the fraction of galaxies, that are detected through narrow band Lyman- emission is only % at , it increases rapidly with increasing redshift and reaches to unity just after the end of the reionisation process. Hence, during the reionisaton period all galaxies are expected to have strong Lyman- emission. Similar results were obtained by [52] in spite of the fact that they did not take account of supernova feedback in star formation. Further, it is clear from the Fig. 3 and the per degrees of freedom as given in Table 1 that our models provide a good fit to the observed Lyman- luminosity function of LAEs in the entire redshift range from to 2.0. The best fit values of along with uncertainty are reported in column 4 of Table 1. Thus we can say that the SNe feedback is operating in the high redshift galaxies with strong Lyman- emission.
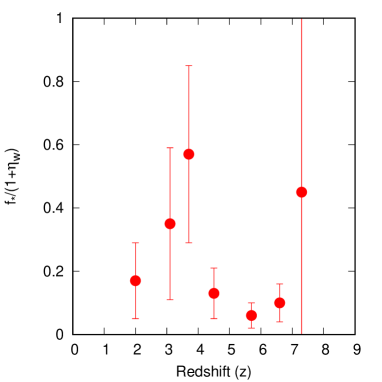
Most interesting result of our work is the redshift evolution of star formation efficiency in LAEs as can be seen from the values of at different redshifts (see Table 1). Note that the parameter used here in not exactly the canonically used star formation efficiency. The fraction of total baryonic gas that will eventually convert to stars in the galaxy is in presence of supernova feedback and this should be compared with the observations of . It is clear from the Table 1 as well as Fig. 4 where we have plotted as a function of redshift that within the uncertainty the star formation efficiency does not show any evolution in the LAEs for the entire redshift range of to 7.3. Thus, we conclude that even though the fraction of galaxies that shows up as LAEs changes drastically from reionisation to late universe, the star formation efficiency does not change significantly in those Lyman- emitting galaxies. In particular, given the observational uncertainty and hence the uncertainty in derived star formation efficiency, no trend can be identified in the redshift evolution of star formation efficiency.
3.1 Variation of model parameters
There are two crucial model parameters that are poorly constraint from observations, namely the escape fraction of UV photon, and the fraction of galaxies that are detected as LAEs, i.e. . Here we show how these two parameters affect our results.
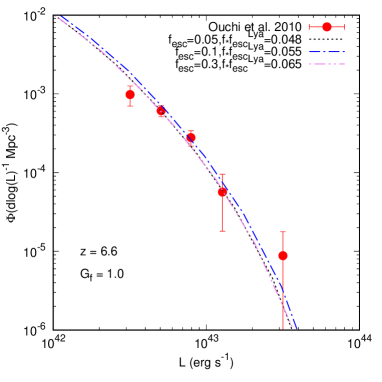
First we concentrate on that appear in the Eqn. 2. Note that this parameter also regulate the reionisation history and hence we show our results only for i.e. when the IGM is likely to have significant neutral fraction. Various observations have reported value of in the range of 0.05 to 0.3 [61, 62] for high redshift galaxies. In Fig. 5 we show the model predicted Lyman- luminosity function along with observed data for , 0.1 and 0.3. It is clear from the figure that all three models produce similar fit for the observed data. The per d.o.f for these three models are 2.30, 2.00, 2.27 respectively for , 0.1 and 0.3. The resulting values of star formation efficiency are . Thus within the uncertainty, the star formation efficiency does not change significantly for a wide variation in the value of escape fraction of UV photon from the galaxy. We note that similar results are also obtained from any other redshifts that are being considered in this work.
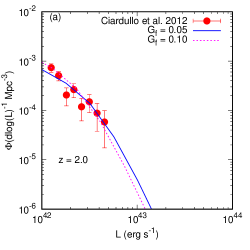
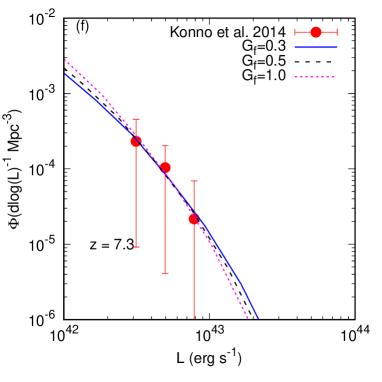
Next we consider the variation of . Note that recent observations have resulted very low value of for [72, 73, 74]. Thus it is important to see how such variation affect our results. We show in Fig. 6 the Lyman- luminosity functions at for different 0.5 and 0.3. All three models predict luminosity functions that are consistent with the observation. Fitted values of minimum are unable to distinguish between models given the large uncertainty in the observed data. However, for lower value of we need unrealistic value of the star formation efficiency parameter, . Thus an improved measurement of the Lyman- luminosity functions at is needed in order to understand the physical processes happening inside these Lyman- emitting galaxies.
4 Conclusion
We have presented semi-analytical models of galaxy formation and evolution to understand the redshift evolution of luminosity functions of LAEs and their physical properties. In particular we have used star formation model regulated by supernova feedback along with Sheth-Tormen halo mass function to obtain simultaneously the UV and Lyman- luminosity functions of LAEs in the redshift range to 7.3. Our models correctly reproduce the shape and redshift evolution of both UV and Lyman- luminosity functions of LAEs demonstrating the fact that the supernova feedback is indeed operational in high redshift Lyman- emitters. Finally we derive the average star formation efficiency of the Lyman- emitting galaxies at different redshifts using observational constraint of escape fraction of Lyman- emission from galaxies.
We show that the fraction of Lyman- emitting galaxies increases with increasing redshift, reaching to unity just after the end of reionisation, i.e. at . On the other hand the star formation efficiency does not vary significantly before and after reionisation in those Lyman- emitting galaxies. This conclusion is independent of the uncertainty in the escape of UV photon from those galaxies. Such a result was also obtained by previous work by [33, 28] who showed that the change in the Lyman- emitter fraction compared to LBGs are due to change in the IGM or surrounding halo gas, not due to change in the physical properties of LAEs. Further, we show that one needs to fit all available data of LAEs in order to constraint the physical properties of LAEs (also see [28]. [28] also showed that a highly fluctuating is needed to match recent observations that shows very small fraction of LAEs at . Our models also require unphysical parameters such as star formation efficiency of order unity in order to understand such a low fraction of LAEs while fitting simultaneously the UV and Lyman- luminosity functions of LAEs. However, we also wish to point out that this conclusion is highly biased due to large uncertainty in the observed luminosity functions of LAEs and also in the measurements of the escape fraction of Lyman- photons from the galaxy. Precise estimation of these in a large volume survey would enable us to more accurately constrain the evolution of the star formation efficiency in the Lyman- emitters.
References
- [1] Taniguchi Y, Ajiki M, Nagao T, Shioya Y, Murayama T, Kashikawa N, Kodaira K, Kaifu N, Ando H, Karoji H, Akiyama M, Aoki K, Doi M, Fujita S S, Furusawa H, Hayashino T, Iwamuro F, Iye M, Kobayashi N, Kodama T, Komiyama Y, Matsuda Y, Miyazaki S, Mizumoto Y, Morokuma T, Motohara K, Nariai K, Ohta K, Ohyama Y, Okamura S, Ouchi M, Sasaki T, Sato Y, Sekiguchi K, Shimasaku K, Tamura H, Umemura M, Yamada T, Yasuda N and Yoshida M 2005 PASJ 57 165–182 (Preprint astro-ph/0407542)
- [2] Kashikawa N, Shimasaku K, Malkan M A, Doi M, Matsuda Y, Ouchi M, Taniguchi Y, Ly C, Nagao T, Iye M, Motohara K, Murayama T, Murozono K, Nariai K, Ohta K, Okamura S, Sasaki T, Shioya Y and Umemura M 2006 ApJ 648 7–22 (Preprint astro-ph/0604149)
- [3] Shimasaku K, Kashikawa N, Doi M, Ly C, Malkan M A, Matsuda Y, Ouchi M, Hayashino T, Iye M, Motohara K, Murayama T, Nagao T, Ohta K, Okamura S, Sasaki T, Shioya Y and Taniguchi Y 2006 PASJ 58 313–334 (Preprint astro-ph/0602614)
- [4] Gronwall C, Ciardullo R, Hickey T, Gawiser E, Feldmeier J J, van Dokkum P G, Urry C M, Herrera D, Lehmer B D, Infante L, Orsi A, Marchesini D, Blanc G A, Francke H, Lira P and Treister E 2007 ApJ 667 79–91 (Preprint 0705.3917)
- [5] Murayama T, Taniguchi Y, Scoville N Z, Ajiki M, Sanders D B, Mobasher B, Aussel H, Capak P, Koekemoer A, Shioya Y, Nagao T, Carilli C, Ellis R S, Garilli B, Giavalisco M, Kitzbichler M G, Le Fèvre O, Maccagni D, Schinnerer E, Smolčić V, Tribiano S, Cimatti A, Komiyama Y, Miyazaki S, Sasaki S S, Koda J and Karoji H 2007 ApJS 172 523–544 (Preprint astro-ph/0702458)
- [6] Dawson S, Rhoads J E, Malhotra S, Stern D, Wang J, Dey A, Spinrad H and Jannuzi B T 2007 ApJ 671 1227–1240 (Preprint 0707.4182)
- [7] Ouchi M, Shimasaku K, Akiyama M, Simpson C, Saito T, Ueda Y, Furusawa H, Sekiguchi K, Yamada T, Kodama T, Kashikawa N, Okamura S, Iye M, Takata T, Yoshida M and Yoshida M 2008 ApJS 176 301-330 (Preprint 0707.3161)
- [8] Ouchi M, Shimasaku K, Furusawa H, Saito T, Yoshida M, Akiyama M, Ono Y, Yamada T, Ota K, Kashikawa N, Iye M, Kodama T, Okamura S, Simpson C and Yoshida M 2010 ApJ 723 869–894 (Preprint 1007.2961)
- [9] Ciardullo R, Gronwall C, Wolf C, McCathran E, Bond N A, Gawiser E, Guaita L, Feldmeier J J, Treister E, Padilla N, Francke H, Matković A, Altmann M and Herrera D 2012 ApJ 744 110 (Preprint 1109.4685)
- [10] Zheng Z Y, Finkelstein S L, Finkelstein K, Tilvi V, Rhoads J E, Malhotra S, Wang J X, Miller N, Hibon P and Xia L 2013 MNRAS 431 3589–3607 (Preprint 1111.3386)
- [11] Konno A, Ouchi M, Ono Y, Shimasaku K, Shibuya T, Furusawa H, Nakajima K, Naito Y, Momose R, Yuma S and Iye M 2014 ApJ 797 16 (Preprint 1404.6066)
- [12] Sobral D, Matthee J, Best P, Stroe A, Röttgering H, Oteo I, Smail I, Morabito L and Paulino-Afonso A 2017 MNRAS 466 1242–1258 (Preprint 1609.05897)
- [13] Sobral D, Matthee J, Darvish B, Smail I, Best P N, Alegre L, Röttgering H, Mobasher B, Paulino-Afonso A, Stroe A and Oteo I 2018 MNRAS 477 2817–2840 (Preprint 1802.10102)
- [14] Ouchi M, Harikane Y, Shibuya T, Shimasaku K, Taniguchi Y, Konno A, Kobayashi M, Kajisawa M, Nagao T, Ono Y, Inoue A K, Umemura M, Mori M, Hasegawa K, Higuchi R, Komiyama Y, Matsuda Y, Nakajima K, Saito T and Wang S Y 2018 PASJ 70 S13 (Preprint 1704.07455)
- [15] Steidel C C, Adelberger K L, Shapley A E, Pettini M, Dickinson M and Giavalisco M 2003 ApJ 592 728–754 (Preprint astro-ph/0305378)
- [16] Bouwens R J, Thompson R I, Illingworth G D, Franx M, van Dokkum P G, Fan X, Dickinson M E, Eisenstein D J and Rieke M J 2004 ApJ 616 L79–L82 (Preprint astro-ph/0409488)
- [17] Hopkins A M and Beacom J F 2006 ApJ 651 142–154 (Preprint astro-ph/0601463)
- [18] Richard J, Pelló R, Schaerer D, Le Borgne J F and Kneib J P 2006 A&A 456 861–880 (Preprint astro-ph/0606134)
- [19] Bouwens R J, Illingworth G D, Oesch P A, Trenti M, Labbé I, Bradley L, Carollo M, van Dokkum P G, Gonzalez V, Holwerda B, Franx M, Spitler L, Smit R and Magee D 2015 ApJ 803 34 (Preprint 1403.4295)
- [20] Oesch P A, Bouwens R J, Illingworth G D, Labbé I and Stefanon M 2018 ApJ 855 105 (Preprint 1710.11131)
- [21] Barton E J, Davé R, Smith J D T, Papovich C, Hernquist L and Springel V 2004 ApJ 604 L1–L4 (Preprint astro-ph/0310514)
- [22] Davé R, Finlator K and Oppenheimer B D 2006 MNRAS 370 273–288 (Preprint astro-ph/0511532)
- [23] Tasitsiomi A 2006 ApJ 645 792–813 (Preprint astro-ph/0510347)
- [24] Shimizu I, Umemura M and Yonehara A 2007 MNRAS 380 L49–L53 (Preprint 0706.1596)
- [25] Laursen P, Razoumov A O and Sommer-Larsen J 2009 ApJ 696 853–869 (Preprint 0805.3153)
- [26] Zheng Z, Cen R, Trac H and Miralda-Escudé J 2011 ApJ 726 38 (Preprint 1003.4990)
- [27] Sadoun R, Zheng Z and Miralda-Escudé J 2017 ApJ 839 44 (Preprint 1607.08247)
- [28] Inoue A K, Hasegawa K, Ishiyama T, Yajima H, Shimizu I, Umemura M, Konno A, Harikane Y, Shibuya T, Ouchi M, Shimasaku K, Ono Y, Kusakabe H, Higuchi R and Lee C H 2018 PASJ 70 55 (Preprint 1801.00067)
- [29] Kobayashi M A R, Totani T and Nagashima M 2007 ApJ 670 919–927 (Preprint 0705.4349)
- [30] Dayal P, Ferrara A and Gallerani S 2008 MNRAS 389 1683–1696 (Preprint 0807.2975)
- [31] Samui S, Srianand R and Subramanian K 2009 MNRAS 398 2061–2068 (Preprint 0906.2312)
- [32] Haiman Z and Spaans M 1999 ApJ 518 138–144 (Preprint astro-ph/9809223)
- [33] Dijkstra M, Wyithe J S B and Haiman Z 2007 MNRAS 379 253–259 (Preprint astro-ph/0611195)
- [34] Mao J, Lapi A, Granato G L, de Zotti G and Danese L 2007 ApJ 667 655–666 (Preprint astro-ph/0611799)
- [35] Stark D P, Loeb A and Ellis R S 2007 ApJ 668 627–642 (Preprint astro-ph/0701882)
- [36] Fernandez E R and Komatsu E 2008 MNRAS 384 1363–1376
- [37] Hayes M, Schaerer D, Östlin G, Mas-Hesse J M, Atek H and Kunth D 2011 ApJ 730 8 (Preprint 1010.4796)
- [38] Samui S, Srianand R and Subramanian K 2018 ArXiv e-prints (Preprint 1805.05945)
- [39] Springel V and Hernquist L 2003 MNRAS 339 289–311 (Preprint astro-ph/0206393)
- [40] Dayal P, Ferrara A, Dunlop J S and Pacucci F 2014 MNRAS 445 2545–2557 (Preprint 1405.4862)
- [41] Samui S 2014 New Astronomy 30 89–99 (Preprint 1401.7675)
- [42] Furlanetto S R, Mirocha J, Mebane R H and Sun G 2017 MNRAS 472 1576–1592 (Preprint 1611.01169)
- [43] Sun G and Furlanetto S R 2016 MNRAS 460 417–433 (Preprint 1512.06219)
- [44] Tilvi V, Malhotra S, Rhoads J E, Scannapieco E, Thacker R J, Iliev I T and Mellema G 2009 ApJ 704 724–732 (Preprint %****␣PASP_ver3.tex␣Line␣875␣****0906.5159)
- [45] Dunkley J, Komatsu E, Nolta M R, Spergel D N, Larson D, Hinshaw G, Page L, Bennett C L, Gold B, Jarosik N, Weiland J L, Halpern M, Hill R S, Kogut A, Limon M, Meyer S S, Tucker G S, Wollack E and Wright E L 2009 ApJS 180 306–329 (Preprint 0803.0586)
- [46] Dayal P and Ferrara A 2018 PHYSREP 780 1–64 (Preprint 1809.09136)
- [47] Kennicutt Jr R C 1998 ApJ 498 541–552 (Preprint astro-ph/9712213)
- [48] Weaver R, McCray R, Castor J, Shapiro P and Moore R 1977 ApJ 218 377–395
- [49] Ostriker J P and McKee C F 1988 Reviews of Modern Physics 60 1–68
- [50] Scannapieco E, Ferrara A and Madau P 2002 ApJ 574 590–598 (Preprint astro-ph/0201463)
- [51] Veilleux S, Cecil G and Bland-Hawthorn J 2005 ARA&A 43 769–826 (Preprint astro-ph/0504435)
- [52] Samui S, Subramanian K and Srianand R 2008 MNRAS 385 783–808 (Preprint 0801.1401)
- [53] Bromm V and Loeb A 2002 ApJ 575 111–116 (Preprint astro-ph/0201400)
- [54] Benson A J, Lacey C G, Baugh C M, Cole S and Frenk C S 2002 MNRAS 333 156–176 (Preprint astro-ph/0108217)
- [55] Dijkstra M, Haiman Z, Rees M J and Weinberg D H 2004 ApJ 601 666–675 (Preprint astro-ph/0308042)
- [56] Bower R G, Benson A J, Malbon R, Helly J C, Frenk C S, Baugh C M, Cole S and Lacey C G 2006 MNRAS 370 645–655 (Preprint astro-ph/0511338)
- [57] Best P N, Kaiser C R, Heckman T M and Kauffmann G 2006 MNRAS 368 L67–L71 (Preprint astro-ph/0602171)
- [58] Osterbrock D E 1989 Annals of the New York Academy of Sciences 571 99–109
- [59] Leitherer C, Schaerer D, Goldader J D, Delgado R M G, Robert C, Kune D F, de Mello D F, Devost D and Heckman T M 1999 ApJS 123 3–40 (Preprint astro-ph/9902334)
- [60] Samui S, Srianand R and Subramanian K 2007 MNRAS 377 285–299 (Preprint astro-ph/0612271)
- [61] Shapley A E, Steidel C C, Pettini M, Adelberger K L and Erb D K 2006 ApJ 651 688–703 (Preprint astro-ph/0606635)
- [62] Iwata I, Inoue A K, Matsuda Y, Furusawa H, Hayashino T, Kousai K, Akiyama M, Yamada T, Burgarella D and Deharveng J M 2009 ApJ 692 1287–1293 (Preprint 0805.4012)
- [63] Giri S K, Zackrisson E, Binggeli C, Pelckmans K, Cubo R and Mellema G 2018 Constraining Lyman continuum escape using Machine Learning Peering towards Cosmic Dawn (IAU Symposium vol 333) ed Jelić V and van der Hulst T pp 254–258
- [64] Matthee J, Sobral D, Best P, Khostovan A A, Oteo I, Bouwens R and Röttgering H 2017 MNRAS 465 3637–3655 (Preprint 1605.08782)
- [65] Chisholm J, Gazagnes S, Schaerer D, Verhamme A, Rigby J R, Bayliss M, Sharon K, Gladders M and Dahle H 2018 AAP 616 A30 (Preprint 1803.03655)
- [66] Sheth R K and Tormen G 1999 MNRAS 308 119–126 (Preprint astro-ph/9901122)
- [67] Samui S, Subramanian K and Srianand R 2010 MNRAS 402 2778–2791 (Preprint 0909.3854)
- [68] Shapley A E, Steidel C C, Pettini M and Adelberger K L 2003 ApJ 588 65–89 (Preprint astro-ph/0301230)
- [69] Kornei K A, Shapley A E, Erb D K, Steidel C C, Reddy N A, Pettini M and Bogosavljević M 2010 ApJ 711 693–710 (Preprint 0911.2000)
- [70] Stark D P, Ellis R S, Chiu K, Ouchi M and Bunker A 2010 MNRAS 408 1628–1648 (Preprint 1003.5244)
- [71] Reddy N A and Steidel C C 2009 ApJ 692 778–803 (Preprint 0810.2788)
- [72] Ono Y, Ouchi M, Mobasher B, Dickinson M, Penner K, Shimasaku K, Weiner B J, Kartaltepe J S, Nakajima K, Nayyeri H, Stern D, Kashikawa N and Spinrad H 2012 ApJ 744 83 (Preprint 1107.3159)
- [73] Schenker M A, Stark D P, Ellis R S, Robertson B E, Dunlop J S, McLure R J, Kneib J P and Richard J 2012 ApJ 744 179 (Preprint 1107.1261)
- [74] Schenker M A, Ellis R S, Konidaris N P and Stark D P 2014 ApJ 795 20 (Preprint 1404.4632)