Photoionization Feedback in Low–Mass Galaxies at High Redshift
Abstract
The cosmic ultraviolet (UV) ionizing background impacts the formation of dwarf galaxies in the low–redshift universe () by suppressing gas infall into galactic halos with circular velocities up to . Using a one–dimensional, spherically symmetric hydrodynamics code (Thoul & Weinberg 1995), we examine the effect of an ionizing background on low–mass galaxies forming at high redshifts (). We find that the importance of photoionization feedback is greatly reduced, because (1) at high redshift, dwarf–galaxy sized objects can self–shield against the ionizing background, (2) collisional cooling processes at high redshift are more efficient, (3) the amplitude of the ionizing background at high redshift is lower, and (4) the ionizing radiation turns on when the perturbation that will become the dwarf galaxy has already grown to a substantial overdensity. We find that because of these reasons, gas can collect inside halos with circular velocities as low as at . This result has important implications for the reionization history of the universe.
Submitted to ApJ
1 Introduction
The recent detection of a large optical depth to electron scattering () by the Wilkinson Microwave Anisotropy Probe (WMAP, Bennett et al. 2003) suggests that the first sources of light significantly ionized the intergalactic medium (IGM) as early as redshift (Kogut et al. 2003; Spergel et al. 2003). A number of papers (see a recent review and summary in Haiman 2003) have tried to reconcile this observation with the preceding discovery of a significant global neutral hydrogen fraction inferred from Gunn-Peterson troughs in quasars at redshift (Becker et al. 2001; Fan et al. 2003; White, Becker, Fan & Strauss. 2003). Haiman & Holder (2003) and Onken & Miralda-Escudé (2003), in particular, have emphasized the role that radiative feedback mechanisms can play in regulating the evolution of the global emissivity of ionizing radiation, and simultaneously accounting for these two apparently conflicting observational results. What is suggested by these observations is that reionization is completed at redshifts of , but that in addition, there is a significant “tail” of (perhaps only partial) ionization extending to much higher redshift ().
If the reionization history is regulated by radiative feedback effects, such a tail of ionization can naturally be produced. The first ionizing sources form in low–mass dark matter (DM) halos with virial temperatures between and K around , in which cooling by molecules can bring the Jeans mass down to several hundred . The UV photons produced by these early population of stars or miniquasars photo-ionize and photo-heat the gas surrounding them (Shapiro et al. 2003; Oh & Haiman 2003) and dissociate , the main coolant (Haiman, Rees & Loeb 1997). This limits the star formation rate and the contribution of these halos to reionization (Haiman, Abel & Rees 2000).
The global star–formation can increase again once more massive halos form, with virial temperatures of K (or circular velocities of ). In these halos, gas can condense and cool via an initial phase of atomic cooling (Oh & Haiman 2002). In practice, however, previous models of the reionization history have excluded star formation in halos up to much higher virial temperatures, with K () in regions of the IGM that have already been ionized (e.g. Haiman & Loeb 1997, 1998; Wyithe & Loeb 2003; Haiman & Holder 2003). The motivation for this exclusion is that the collapse and cooling of gas is thought to be significantly suppressed in these photo–heated regions. The critical halo size up to which such a suppression is important has been addressed by several authors (Efstathiou 1992; Thoul & Weinberg 1996, hereafter TW96; Navarro & Steinmetz 1997; Kitayama & Ikeuchi, hereafter KI00), who found a critical value of . The exact value of this threshold plays a crucial role in the reionization history. This motivates us in the present paper to revisit the effects of the UV feedback at high redshift.
It is important to realize that existing studies of the UV feedback mainly focus on low–redshifts (), addressing the suppression of the formation of dwarf galaxies in the relatively nearby universe. Whether or not the same feedback occurs at high redshift is especially important to clarify in light of the WMAP results. Specifically, a strong photoionization feedback can significantly delay the completion of reionization, provided the ionizing photon production efficiency is high in these halos (see Figure 4 in Haiman & Holder 2003). In general, one would expect photoionization feedback to have less of an effect at high redshift, because cooling times are shorter, the intensity of the ionizing background is lower, and halos are more compact and can be self–shielding. For example, KI00 included radiative transfer effects in one–dimensional simulations similar to those of TW96. They found that this lowered the critical velocities by , at low redshift, and that this decrease was more significant () at high redshifts. In three–dimensional simulations, Gnedin (2000) found that the characteristic mass scale for suppressing the gas fraction in non–linear halos decreases towards high redshifts, with a dependence that roughly corresponds to a fixed circular velocity of km/s at all redshifts (and provided a fitting formula that has been adopted in the reionization models of Cen 2003).
In the present paper, we extend previous calculations of the photoionization feedback to high redshifts, using spherically symmetric simulations adapted from Thoul & Weinberg (1995). Our goal is to quantify the suppression of gas infall into halos that form at , and to elucidate the physics that distinguishes the effects of the UV background at from that at . The recent WMAP results suggest that an ionizing background is already in place at high redshift, and much of early structure formation takes place under the influence of an ionizing background. Previous works nevertheless suggests a diminishing importance of the background towards high redshifts (KI00, Gnedin 2000). In this paper, we confirm these results, and explicitly compute the change in the characteristic circular velocity with redshift. Using a range of simulation runs, we also quantify the relative importance of different physical effects that determine the condensed gas fractions we obtain. Finally, we discuss the significance of (the lack of) feedback for the high redshift reionization history in light of the WMAP results.
The rest of this paper is organized as follows. In § 2, we give a brief description of the code we adapted, together with a few modifications we made for the present application. In § 3, we describe the results of our runs, which are then discussed in more detail in § 4. In § 5, we summarize our conclusions and the implications of this work. Throughout this paper, we adopt the background cosmological parameters as measured by the WMAP experiment, , , , (Spergel et al. 2003).
2 Description of the Code
The code we use is a modified version of a one–dimensional, spherically symmetric code (Thoul & Weinberg 1995, hereafter TW95). It evolves a mixture of dark matter and baryon fluids by moving concentric spherical shells of fixed mass in the radial direction. A description of the numerical method and details of the code can be found in the above reference. We start all runs with an initial density profile following the average shape of a 2 peak in a Gaussian random field (Bardeen et al. 1986; BBKS). The initial density profile is sampled by 6000 dark matter and 1000 gas shells out to the outermost shell at , where is the filter radius for the BBKS profile. We have explicitly verified that increasing and decreasing the number of shells by a factor of three changes our answers for the cold gas fraction below by at most 5 percent. This will introduce an error in the circular velocities of at most km/s. The total mass (baryons + dark matter) of the object collapsing at redshift is denoted by . This mass is initially contained in a sphere of radius , in which we fix the mean overdensity to be . Note that this places the redshift of collapse at , where is the initial redshift. We chose based on the desired collapse redshift (e.g., for ). The total mass of the collapsing object in our simulation is (see TW95 and TW96 for more details).
The code was originally written for a standard cold dark matter (SCDM) cosmology (, km/s/Mpc). In this paper, we adopted the CDM cosmology favored by the WMAP results. However, we are concerned with the collapse of objects at high redshift, where the dynamical effect of the dark energy is negligible. In practice, we therefore needed to change only the ratio (which sets the number ratio of dark matter and gas shells), and the time-redshift relation ( Myr in the redshift range ). Because the time–scale for Compton cooling off the cosmic microwave background (CMB) is shorter than the Hubble time for , we added Compton cooling to the other cooling terms in the code (e.g., Katz, Weinberg, & Hernquist, 1996),
| (1) |
where is the number density of electrons, the temperature of the electrons (equal to the gas temperature), and is the temperature of the CMB (Fixsen & Mather 2002). Finally, it will be useful to recall the relation between the circular velocity of a dark matter halo and its virial temperature:
| (2) |
Below, we study the collapse of galaxies with circular velocities in the range km/s, for which the mean molecular weight is . Note that below 10 km/s, molecule formation and cooling has to be considered. The effect of the UV background on such minihalos has recently been studied elsewhere (Oh & Haiman 2003). The circular velocity of halos is related to their mass and collapse redshift (in the absence of any pressure or radiation field) as
| (3) |
where is the mass of the halo that collapses at redshift .
3 Runs and Results
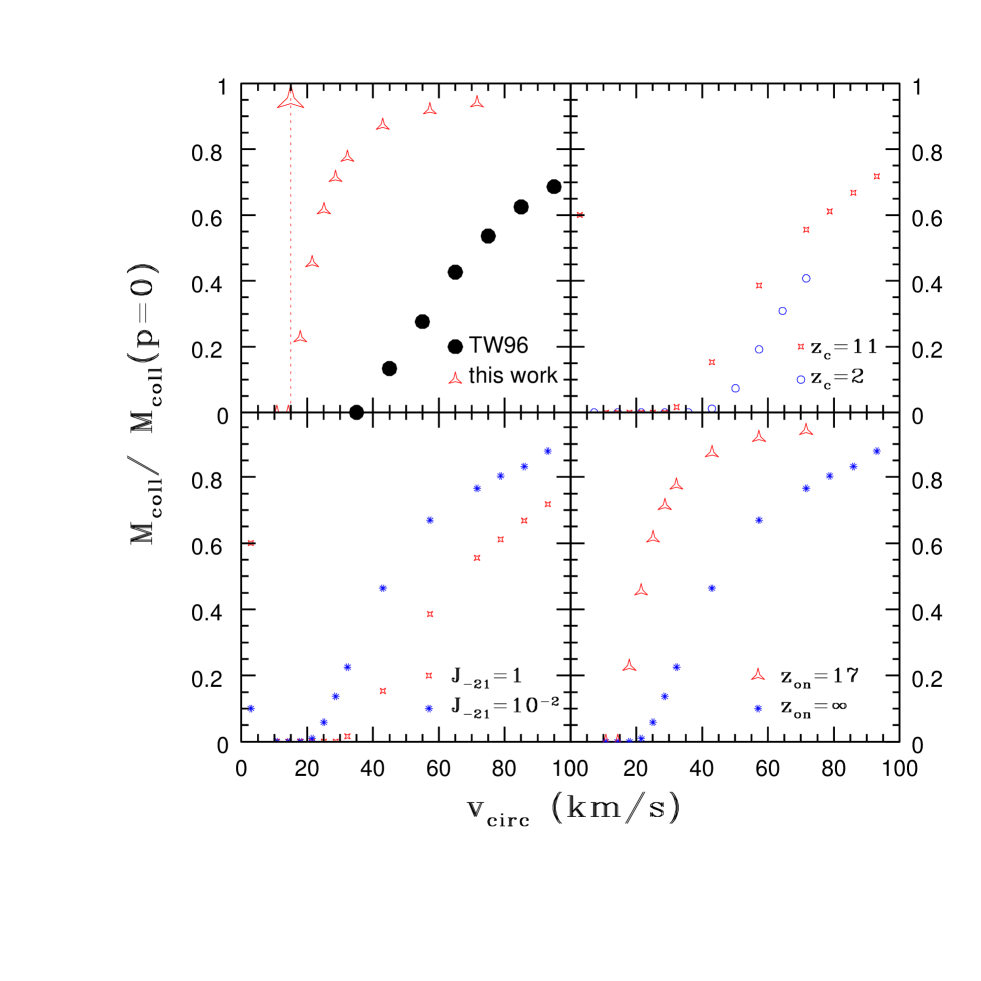
Although the WMAP data suggest that there is an ionizing UV background at , its evolution is poorly constrained. For simplicity, in our simulations we adopt a power–law ionizing background that is described by two parameters, erg/s/Hz/cm2/sr, where is the Lyman limit frequency. In addition, the postulated ionizing background is assumed to turn on suddenly at the location of the collapsing object at a redshift . This sudden turn–on is appropriate before reionization is complete, i.e. when the Strömgren surface from a single ionizing source passes by a newly forming halo (see more discussion of the adopted background below). We consider two different amplitudes ( or , justified below) and the spectral slope , characteristic of quasars or massive, metal–free stars. The choice of would be more appropriate for a normal stellar population (TW96), but since making the spectrum softer would only reduce the importance of feedback further, we are conservative in our choice of . For the turn–on redshift, we adopt (motivated by WMAP ) or (to obtain a maximal effect). We run each simulation to redshift . In each simulation run, following TW96, we define the fraction of the baryonic mass that has collapsed () at redshift , relative to the amount of baryonic mass that would have collapsed in absence of pressure (). Since we are considering halos well above the cosmological Jeans mass, in the absence of a radiation field we expect . A background flux has an increasingly larger effect on smaller halos, so that in the presence of a radiation field, we expect to increase monotonically with circular velocity.
In Figure 1, we show the collapsed fraction as a function of circular velocity under various assumptions. To begin, we first reproduced the results of TW96, by adopting their redshift–evolution for the background flux, and considering halos collapsing at in their SCDM cosmology. Our results for this case are shown by the the circles in the upper left panel of Figure 1. The circles show that gas infall in systems with circular velocities of km/s is suppressed almost completely, while the collapse of structures with circular velocities of km/s is suppressed by 50% (Note that the often quoted value of km/s is obtained by defining at the time . Here we consider instead, as explained in § 4.3).
Hereafter, we will denote these two velocities by and , respectively. To facilitate comparison with previous studies, throughout this paper we focus on , which conveys the size of a halo that is strongly affected by the radiation. In the context of reionization, a question that may be more relevant is whether any gas may be available for star formation in the halo. The answer to the latter question is better conveyed by , for which we also quote values below.
The rest of Figure 1 describes collapse calculations in the CDM cosmology. First, the triangles in the upper left panel show the main result of this paper, and correspond to halos that collapse at . We use the set of parameters , , and . As the figure clearly shows, the values of and change dramatically relative to the low–redshift case: we obtain km/s, and km/s. In the remaining three panels of Figure 1, we investigate the physical reasons for the change in the critical circular velocities, by varying each parameter in succession. Our approach is to start from a fiducial set of parameters that describe the typical low–redshift case: , , , and (in practice, ), and then change each parameter in succession, until we arrive at the high redshift model described by , , and . The order in which we change the parameters is arbitrary (and could somewhat modify the relative importance of each effect).
Gas Density: Cooling through two–body processes, such as recombination and collisional excitation cooling, is more efficient at high densities. The influence of increasing the density by a factor of on the collapsed fraction is shown in the upper right panel, by adopting (stars) vs (empty circles). The other parameters are held at their fiducial values. As the panel reveals, the density increase shifts the entire curve by km/s to the left. In particular, is decreased from to km/s (a factor of ).
Radiation Intensity: At redshift , the UV background is expected to be significantly lower than at redshift . We therefore next decrease the amplitude of the flux by a factor of 100 to . This value is motivated below in § 4.1. The lower left panel shows the result of this decrease (asterisks) vs. (stars, reproduced from the upper right panel). Lowering the flux yields an additional factor of decrease in from to km/s.
Turn-on time of ionizing flux: A primordial perturbation that collapses at redshift is already turning around at . As a result, one expects that such a perturbation evolves significantly without the presence of any UV flux before any flux turns–on (see discussion below). To include this effect in a simple way, in the lower right panel we change (empty circles, reproduced from the lower left panel) to (triangles; we have arrived back at the “original” curve shown in triangles in the upper left panel). The late turn–on results in an additional factor of decrease in from to km/s. Note that photoheating of halos that collapse at redshift (such as the cases considered in TW96) starts well before they turn around, and the precise turn–on redshift is unimportant. The strong influence of the turn–on time in our high–redshift collapse case can also be seen directly in the evolution of shells in the upper pair of panels in Figure 2.
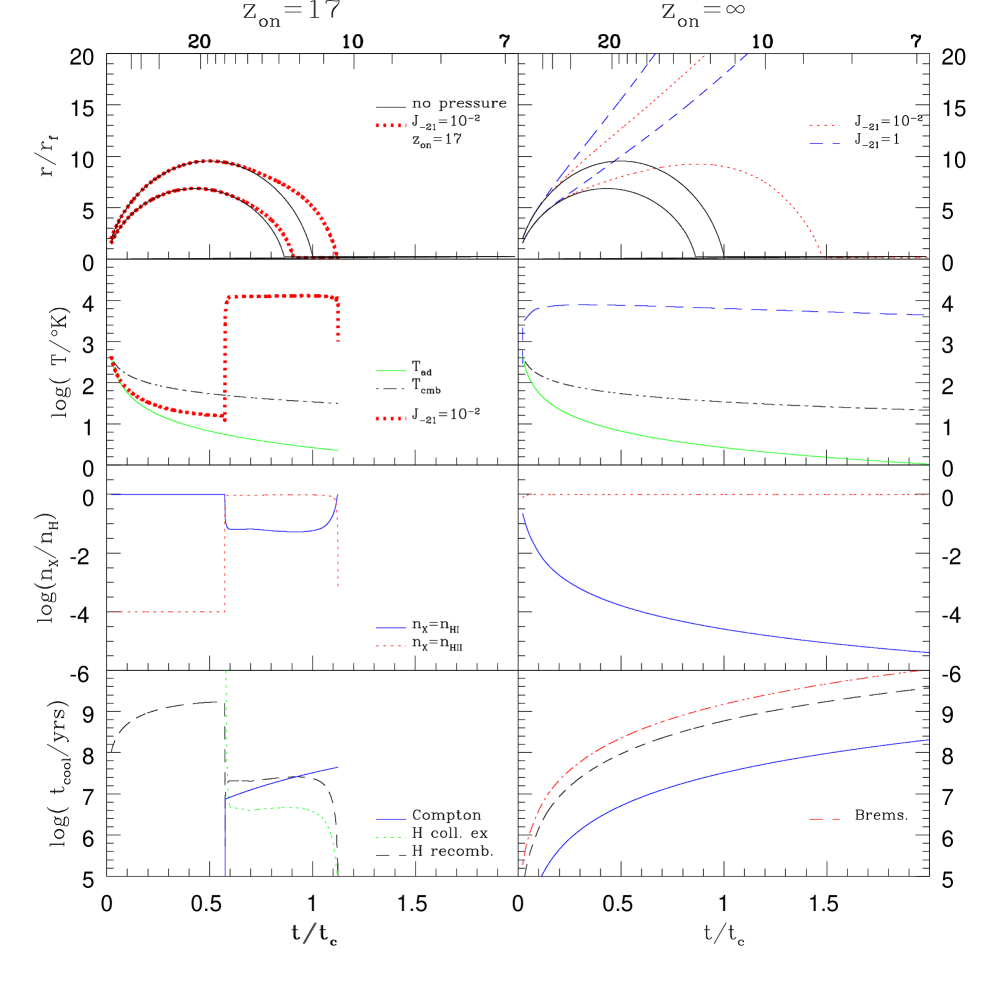
In Figure 2, we investigate the various physical effects determining the strength of the UV feedback in more detail. The figure shows (upper to lower panels, respectively) the evolution of individual shells, together with their temperatures, ionization fractions, and cooling times, during the collapse of a halo with km/s. The set of panels on the left assume that the UV background is switched on at , and the panels on the right describe runs in which the flux is on during the entire simulation. All quantities are shown as a function of cosmic time normalized to the collapse time Myr (the age of the universe at ; the upper horizontal axes show corresponding redshifts). We next describe the individual panels.
Evolution of gas shells. The uppermost row of panels shows the evolution of two gas shells, initially enclosing masses of and (we will hereafter refer to these shells as shell 0.5 and shell 1). The radii are shown in units of the filter radius . The pair of solid curves shows the evolution of shells in the absence of any pressure in both panels. Shell 1 collapses approximately at as desired. 111The exact collapse time is sensitive to the initial velocities assigned to the shells. We adopted velocities derived from linear theory for the growing modes: , where is the mean initial overdensity enclosed by shell (see TW96 for details). The dotted and dashed curves in the right panel correspond to and , respectively, showing that the shells collapse later (or do not collapse at all) as the the intensity of the UV background is increased. In the left panel, the thick dotted line shows the evolution of the shells when the UV background (with ) is turned on at redshift . At this redshift, both shell 1 and 0.5 have already turned around. The figure shows that shell 0.5 was further along its evolution that shell 1, and therefore the background has a smaller influence in its subsequent evolution than in that of shell 1.
Evolution of gas temperature. The second row of panels from the top shows the evolution of the temperature of gas shell 1, with the dotted curve in the left panel representing the cases with and the dashed curve on the right when . For reference, we also show the CMB temperature (dot-dashed curves), and the adiabatic temperature evolution (, solid curves). Initially, heating takes place through adiabatic compression of the gas shells. Some heating will take place through inverse Compton scattering of the CMB photons by electrons, however this is very inefficient. We set the fraction of free electrons to (the approximately constant value expected after decoupling, e.g., Peebles 1993). The left panel shows that the gas temperature is locked between the adiabatic the CMB temperature and an adiabatic evolution, until the background turns on. At , the shell is rapidly photo–heated to K, irrespective of the amplitude of (this is enforced by the assumption of ionization equilibrium in our code; however, this assumption is justified since the photoionization time–scale is short, yr for ).
Evolution of ionization fractions. The third row of panels from the top shows the evolution of the neutral (solid curves) and ionized (dashed curves) fractions of hydrogen for shell 1. The left panel shows the model with and with the UV background switched on at . As mentioned above, the free–electron fraction is set to before the UV background turns on. Once the flux turns on, the gas is highly ionized. However, as shown by the solid curve in the left panel, significant neutral hydrogen remains in this case. This implies that collisional excitation cooling can dominate over other cooling processes, and also that self–shielding effects can be important (see discussion below and in § 4.2). For clarity, the right panel only shows the case with , and demonstrates that the halo gas is quickly highly ionized, with the neutral fraction declining due to the dilution of the density in the expanding shell.
Evolution of cooling timescales. The dominant cooling mechanisms are Compton, recombination and excitation cooling. The timescales for all processes are shown in the bottom row of panels for shell 1. The left panel shows that for shells that do collapse, collisional excitation cooling (mostly by Lyman emission) dominates over recombination and Compton cooling. This is because the densities of the shells shown in the left panel are higher (the UV flux is lower), and the fraction of neutral hydrogen is higher, than in the corresponding curves in the right panel. The right panel shows that for the case, Compton cooling dominates at high redshift, followed by recombination. Collisional cooling of neutral hydrogen is so inefficient that it is off the plot. The fact that Compton cooling is dominating over the other cooling mechanisms is because this shell never collapses and remains at relatively low densities. In this case, Bremsstrahlung also contributes to the total cooling rate at the percent level, as shown by the dot–dashed curve in the lower right panel.
4 Discussion
The main result of the previous section is that the suppression of gas infall by photoionization heating is much less severe in halos collapsing at than at . At redshift the presence of a UV background photo–heats the baryons to K, which prevents a fraction of the baryons from condensing inside dark matter halos. This fraction is for halos with a circular velocity of km/s, in agreement with previous results by TW96.
We found that for halos collapsing at redshift , the critical velocity is reduced to km/s. This is a change in by a factor of , corresponding to a decrease in the halo mass by a factor of (eq. 3). We found that several factors contribute to this reduction. The largest factor of came from our assumption that for halos collapsing at , the UV background is not always “on” - we choose to turn on the flux when the perturbation has just turned around (see the lower right panel in Figure 1). This corresponds to , the redshift where WMAP indicates that a significant fraction of the volume of the IGM is ionized. At high redshift, the densities are higher, and therefore cooling is more efficient. This was responsible for a factor of (see the upper right panel in Figure 1)). A comparable factor () came from lowering the flux from to (in the next section, we discuss our choice for the amplitude ). In comparison, TW96 found that the influence of photoionization came from the suppression of turnaround and collapse by heating, rather than from reduction in cooling rates, and that therefore the amplitude of the background was unimportant (though the slope was significant because of its influence on temperature). This agrees well with our conclusion that the late turn–on of the background flux (relative to ), accounts for most of the reduction in . However, in our high redshift case, the effect of photoionization on cooling does have an additional impact, and the amplitude of the flux is therefore important, as well.
Two of the simplifying assumptions in our treatment are that the gas is optically thin and in ionization equilibrium. In reality, when the collapsing gas is illuminated by a flux that turns on suddenly, the initial heating rate can significantly exceed the values we assume. This is because neither the extra heat input from the initial ionization of each atom (e.g., Hui & Gnedin 1997), nor the temporary hardening of the spectrum due to absorption by the large initial column of neutral atoms (Abel & Haehnelt 1999), are captured by our treatment. However, efficient cooling at high redshift tends to mitigate these effects. In addition, we note that the gas in our high–redshift collapse runs, is never highly ionized, and so the equilibrium heating rates are not significant underestimates. In order to explicitly verify these assertions, we performed a run analogous to the fiducial high–redshift run shown in the left panels in Figure 2, except that (1) we artificially set the temperature at to 50,000 K (the highest temperature to which the gas could get photo–heated due to self–shielding effects), and (2) then follow the non–equilibrium evolution of the ionization fractions and heating rates. We find that these effects decrease by less than .
So far our main focus was to differentiate the value of at and . In semi-analytic models, it is useful to know how changes as a function of redshift. This is shown in Figure 3. The circles denote the case with for all redshifts (the error–bars show the range obtained using a different number of shells ). Since this flux is not appropriate at lower redshifts, the triangles denote the case with the UV background evolving as a function of redshift The evolution for is taken from KI00 (their eq. 4), and has for and monotonically decreasing after this to at . This demonstrates that at lower redshifts the value of moves up further, because of the higher value of . Since in this evolution scenario, is too high at redshifts , the triangles may be viewed as upper limits. In § 4.2 we will discuss that the the value of will decrease, when self–shielding and radiative transfer are included.

4.1 Ionizing Background
As mentioned above, the evolution of the UV background is poorly constrained beyond . Under the assumption that the IGM is in photoionization equilibrium with a uniform background flux, several authors have used the presence of the Gunn–Peterson trough in a redshift quasar (Becker et al. 2001) to place the upper limit on the background flux at (McDonald & Miralda-Escudé 2001; Cen & McDonald 2002; Fan et al. 2002; Lidz et al. 2002). The background at higher redshifts would be expected to be lower; in general, under the assumption of photoionization equilibrium implies the relation
| (4) |
between the neutral fraction (by number) of hydrogen atoms , and the background flux . While is believed to be at , our assumption of at is equivalent to at this redshift.
A uniform background at , however, is likely to be an overly simplistic assumption. Indeed, our main motivation here for examining the photoionization feedback effect is to quantify the ability of halos with to contribute to reionization – a question that would be less relevant once the discrete ionized regions percolate to establish a uniform background, implying that the IGM has already been fully ionized. As a result, a picture that is more relevant to consider (and which is also more realistic), is that of a swiss–cheese topology for the IGM: discrete HII regions (or perhaps the overlapping cluster of a few HII regions) populate the otherwise still neutral IGM. In this case, we can estimate the UV flux seen by the gas inside an individual HII region. For example, let us consider a dark matter halo, in which a fraction of the baryons turns into stars, generating ionizing photons per stellar baryon at a steady rate over a period of yrs, of which a fraction escapes into the IGM (these fiducial numbers were adopted from Haiman & Holder 2003). At a distance away from the central source, we then have the flux
| (5) | |||
where the fiducial radius kpc is the maximum physical radius the HII region can obtain (in the absence of recombination). More generally, the maximum physical radius the halo of mass can ionize is
| (6) |
It is most likely to locate another halo in the edge of an HII sphere, simply because the volume is largest there. We conclude that the ionizing flux seen by a collapsing object at is small, , regardless of whether or not the individual HII regions have overlapped.
It is also interesting to consider the effect of spatial correlations between ionizing sources and forming halos. The mean separation between halos of mass at is physical kpc (Jenkins et al. 2001). Thus, the random chance of finding a second, similar–size halo within the HII sphere is . However, the halos are highly correlated (with a bias parameter (Mo & White 1996), and a correlation function ), bringing the probability of finding a second halo within the HII region to . Furthermore, we are interested in would–be halos, in addition to fully formed ones. The mean separation between halos which are at their turn–around stage at is times smaller than that of fully formed halos ( peaks, rather than peaks). One or two such halos in their formative stages should therefore be found in a typical HII region, experiencing photo–ionization feedback. This implies, in turn, that the fraction of halos potentially subject to the feedback is significantly larger than the simple “volume filling factor” of the HII regions.
4.2 Optical Depth Effects
Another important issue is that towards higher redshifts, halos with a fixed circular velocity can self–shield against the ionizing radiation more effectively. If the gas is in hydrostatic equilibrium within an NFW halo (Makino, Sasaki, & Suto (1998), with concentration parameter ), a line of sight across a halo with circular velocity at redshift has a total hydrogen column density (from the center to the virial radius of the halo)
| (7) |
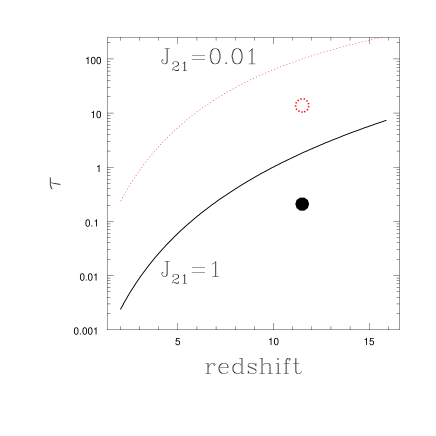
When such a halo resides in a photo–ionizing background, the gas is ionized and the column density of neutral atoms is reduced. In general, a simple expression analogous to equation (7) does not exist in this case. Here we assume that the gas is optically thin (), and in ionization equilibrium with a background flux with amplitude . We then show the numerically computed optical depth (, where is the photoionization cross section for hydrogen) for km/s halos as a function of redshift in Figure 4. The solid/dotted curve corresponds to (both at the temperature of K). The curves show the optical depth from shell 1 inward to shell 0.5, i.e. to the shell containing 50% of the gas mass, and are therefore relevant for computing the value of . The figure demonstrates that self–shielding can become important at high redshift: typical column densities at are several order of magnitudes higher than at , both because of the increased densities and the lower amplitude of the ionizing background.
Of course, NFW halos are collapsed structures, and therefore have densities times the mean density of the universe at any given redshift. Therefore they are more efficient self shielders than the objects in our simulations, which are exposed to a UV background at turnaround, when the mean density interior to shell 1 is only times the mean density. Furthermore, the curves in Figure 4 implicitly assume that within the virial radius of the dark matter halo, the mass fraction of baryons is equal to the universal value, i.e., that a fraction of the baryons has collapsed in the dark matter halo. In our simulations runs, this fraction is reduced by the UV background to be less than unity, which further reduces the optical depth relative to the simple analytical cases shown in Figure 4.
We therefore next measure optical depth directly in our simulations runs. Since these runs do not include radiative transfer and assume the gas is optically thin, we are effectively checking whether these runs are self–consistent. We measure the optical depth in runs with , immediately after the UV background is turned on, and when the gas shells are just turning around. We find that high–redshift halos can easily reach and can therefore self–shield even at the time of turn–around. More precisely, in our fiducial high–redshift runs with , , and , we find that at the redshift , the smallest halo we simulated (), has a column density of between shell 1 (which roughly represents the edge of our object) and shell 0.5. The corresponding optical depth () is shown as an open dashed circle in Figure 4. Likewise, the lower, solid circle in Figure 4 shows the optical depth at turnaround when is changed to 1. As expected, the optical depth in both cases is lower than that for the gas in the NFW halo. 222When the optical depth to the center of the halos is calculated, a large contribution comes from the innermost shells, where the density, and therefore the neutral fraction, is high. However, the evolution of the innermost few shells is known to depend on the choice of the numerical boundary condition at (e.g., Haiman, Thoul & Loeb 1996; Forcada-Miro & White 1997), and we therefore chose to remain conservative, and to exclude these shells from our calculation of the optical depth. As a result of the high optical depth () in the 15 km/s fiducial high–redshift run, shell 0.5 will see only a fraction of the UV background. This fraction is decreased by an additional factor of when the average transmission, , is considered. The above makes it clear that self–shielding is important at high redshift, and the triangles shown in the upper left panel of Figure 1 should therefore be regarded only as lower limits.
To demonstrate the importance of shelf shielding more accurately, we performed one run which takes into account radiative transfer. We follow the approach of Kepner, Babul, & Spergel(1997). To keep the computing time relatively short, only the opacity due to hydrogen is included in a self consistent way (ignoring helium). For each shell, we calculate the transmission, averaged over solid angle, and obtain the processed spectrum and reduced photo-ionization and heating rates. Although this approach still underestimates the total opacity, it gives us much more stringent constraints on and .
We show in Figure 1 how the point with km/s shifts upwards from to 1, when the opacity due to hydrogen is taken into account in the simulations. Including radiative transfer further increases the optical depths of our halos, since the inner shells see (much) lower fluxes than we are assuming in our optically thin runs, and therefore collapse more rapidly and to higher densities. These conclusions are consistent with those of KI00, who apply solutions of the radiative transfer equation, obtained in a plane parallel geometry, to spherical 1-D simulations. This causes them to overestimate the true optical depth. They found that the value of is decreased by 5 km/s at low redshift, and by as much as 10 km/s at higher redshift, as compared to the transparent case studied by us and by TW96.
Finally, as argued above, the question of photoionization feedback studied in this paper is most relevant to halos forming inside existing HII regions of a single ionizing source. The UV radiation field is then very asymmetric. This is not, of course, captured in our spherically symmetric simulations. If, however, only one side of the collapsing halo is exposed to the UV radiation, this will make it easier for gas on the shadowed side to collapse. In summary, the issues of radiative transfer and three–dimensional topology are likely very important and should be addressed in future work. Here we simply note that our main conclusion – namely that feedback is less important towards higher redshifts – is likely to be significantly strengthened by both effects.
| : | : | |||
|---|---|---|---|---|
| change | ||||
| data | 80 | 45 | 55 | 30 |
| raising z (or ) | 65 | 30 | 37 | 20 |
| lowering | 40 | 20 | 25 | 15 |
| turn on at | 20 | 15 | 20 | 15 |
| self–shielding | 10 | 10 | 10 | 10 |
4.3 Clustering and Merging
Another issue is the epoch at which we define to look at how much gas has cooled and collapsed in a halo. An often quoted value from TW96 for the critical velocity for suppressing gas infall, km/s, refers to defined at twice the pressureless collapse time, . This particular choice can be motivated by the time–scale of mergers between halos. Typical halos merge into more massive halos on a timescale that is approximately the Hubble time (Lacey & Cole 1993), so that requiring gas to cool and collapse by is roughly equivalent to requiring this to occur before the halo undergoes significant mergers (at which stage, gas can, in any case, cool and condense more effectively into the deeper potential well of the the newly formed merger product). In the context of reionization, we are interested in potentially more prompt feedback, since the global neutral fraction at high redshift, when the rare, high–sigma peaks are collapsing, can be evolving on a shorter time–scale ( of the Hubble time, e.g., Haiman & Loeb 1997, 1998). It is therefore useful to know the amount of the baryons available immediately after the collapse of the halo for star–formation, and thus for contributing to reionization. For completeness, the values of and after are shown in Table 1, and compared to these values measured after . It can be seen from this table that the final results for the velocities (bottom row) remain unchanged. However, the relative importance of the three causes (§ 3) determining their value, and driving them to be smaller than in our runs, are different (cooling contributing more when is used).
4.4 The Impact on the Global Reionization History
The presence or absence of a strong UV feedback on halos with circular velocities just above the threshold has a strong influence on the global reionization history. As argued by Oh & Haiman (2003; see also Ricotti et al. 2002; Haiman, Abel & Rees 2000; Ciardi et al. 2000), halos with are unlikely to significantly contribute to reionization. As a result, the onset of the reionization epoch, when a significant fraction of the IGM can first be ionized, hinges on the efficiency of ionizing photon production in halos with . Realistically, however, the UV feedback cannot have a global impact until a significant fraction of the IGM is already ionized (although see notes about clustering above). On the other hand, the UV feedback –if important – would impede the late stages of reionization and percolation, and delay the epoch when the Gunn–Peterson ’breakthrough’ occurs.
To illustrate this more clearly, we can make the following simple comparison. Let us assume that halos with circular velocities up to are excluded from by strong feedback from completing the reionization epoch (e.g., Haiman & Holder 2003; Wyithe & Loeb 2003). In this case, percolation will be achieved by halos with . For example, using the mass function in Jenkins et al. (2001), we find that the universal fraction of baryons collapsed into halos of this size at is . With reasonable choices of the efficiency parameters (e.g. Haiman & Holder 2003; Cen 2003), the IGM will be fully ionized close to this redshift at . In comparison, if we assume that all halos with can contribute to reionization (representing the other extreme case of no UV feedback at all), then we find the collapsed fraction at is , and the fraction of is achieved already by , making percolation feasible at this earlier epoch. In other words, under the assumption of fixed efficiencies, the presence/absence of the feedback would make a factor of difference for the redshift of the “break–through” epoch. Assuming the IGM is suddenly fully ionized at this break–through, this translates to a factor of increase in the electron scattering optical depth, from at to at .
We found in this paper that UV feedback is unimportant at high redshift. Naively, this would suggest that relatively smaller halos can contribute to reionization, and help explain the large optical depth measured by WMAP. On the other hand, as explained in the introduction, the WMAP results suggest that the reionization history is more complex – with a “percolation” being completed at redshifts of , but with a significant tail of (perhaps only partial) ionization extending to much higher redshift. As clear from the preceding paragraph, a strong UV feedback would, in fact, have naturally helped to produce this behavior (as argued, e.g., in Haiman & Holder – see Figure 4 in that paper). Indeed, provided halos near the km/s threshold otherwise have a high efficiency of ionizing photon production, a strong UV feedback would result in an extended episode during which the IGM is kept partially ionized. Full percolation could then be achieved only around when halos with , impervious to feedback, start appearing. The absence of the UV feedback means that some other physics must then be responsible for the effective decrease in the global emissivity of ionizing radiation. Such a decrease is required to explain the complex reionization history suggested by the combination of WMAP and lower redshift data.
5 Conclusions
In this paper, we investigated the importance of photoionization heating in suppressing gas cooling and infall in halos with circular velocities in the range km/s, collapsing at high redshift. We used a modified version of the one–dimensional, spherically symmetric, Lagrangian hydro code written by Thoul & Weinberg (1995), thereby directly extending the earlier calculations by Thoul & Weinberg (1996) to redshifts . We reproduced the results of TW96, namely that UV background has a strong impact in the low–redshift universe (), suppressing gas infall by a factor of in galactic halos with circular velocities of . The main new result of the present paper is that suppression is much less significant at high redshift. For halos collapsing at , we found km/s, and that a few percent of the gas can cool and condense in halos with circular velocities as low as =10 km/s.
In § 4, we identified three reasons for this result, namely, (1) the amplitude of the ionizing background at high redshift is lower, (2) the ionizing radiation turns on when the perturbation that will become the dwarf galaxy has already grown to a substantial overdensity, and (3) collisional cooling processes at high redshift are more efficient. We find that the relative importance of these three effects depends on the details of how and at what epoch the collapsed gas is identified, but we find that the combined effect is to essentially eliminate strong UV feedback in all halos with .
In our simulations, the halos were assumed to be optically thin, and spherically symmetric. We explicitly showed that the halos are, in fact, self–shielding, and the radiation field is expected to be very anisotropic (the halos being illuminated by a single nearby source). Issues of radiative transfer and three–dimensional topology are therefore crucial in more detailed modeling of the UV feedback studied here. However, both effects will significantly strengthen our main result, namely that feedback is largely eliminated in high–redshift halos.
The presence or absence of a strong photoheating feedback, which determines whether stars can or cannot form in halos just above the threshold , has a strong influence on this reionization history. While the lack of a UV feedback, as suggested here, can help explaining the high electron scattering optical depth detected by WMAP, it leaves the puzzle that some other physics must be responsible for the complex reionization history suggested by combining the WMAP results with data from lower redshifts.
References
- Abel & Haehnelt (1999) Abel, T., Haehnelt, M. G. 1999, ApJL, 520, 13
- Adams (1972) Adams, T. F. 1972, ApJ, 174, 439
- (3) Bardeen, J. M., Bond, J. R., Kaiser, N., & Szalay, A.S. 1986, ApJ, 304, 15
- Becker et al. (2001) Becker, R. H. et al. 2001, AJ, 122, 2850
- Bennett et al. (2003) Bennett, C. L., et al. 2003, ApJ, submitted, astro-ph/0302207
- Cen & McDonald (2001) Cen, R., & McDonald, P. 2002, ApJ, 570, 457
- Ciardi et al. (2000) Ciardi, B., Ferrara, A., & Abel, T. 2000, ApJ, 533, 594
- Efstathiou (1992) Efstathiou, G. 1992, MNRAS, 256, 43P
- (9) Fan, X., et al. 2002, AJ, 123, 1247
- (10) Fan, X., et al. 2003, AJ, 125, 1649
- Fixsen & Mather (2002) Fixsen, D. J., & Mather, J. C. 2002, ApJ, 581, 817
- Forcada-Miro & White (1997) Forcada-Miro, M. I. & White, S. D. M. 1997, preprint astro-ph/9712204
- Haiman (2003) Haiman, Z. 2003, to appear in Carnegie Observatories Astrophysics Series, Vol. 1: Coevolution of Black Holes and Galaxies, ed. L. C. Ho (Cambridge: Cambridge Univ. Press), astro-ph/0304131
- Haiman, Abel, and Rees (2000) Haiman, Z., Abel, T., & Rees, M. J. 2000, ApJ, 534, 11
- Haiman and Loeb (1997) Haiman, Z., & Loeb, A. 1997, ApJ, 483, 21
- (16) Haiman, Z., & Loeb, A. 1998, ApJ, 503, 505
- Haiman, Rees, and Loeb (1997) Haiman, Z., Rees, M. J., & Loeb, A. 1997, ApJ, 476, 458 [erratum: 1997, ApJ, 484, 985]
- (18) Holder, G. P., Haiman, Z., Kaplinghat, M., & Knox, L. 2003, ApJL, submitted, astro-ph/0302404 (paper II)
- Hui & Gnedin (1997) Hui, L. & Gnedin, N. Y., 1997, MNRAS, 292, 27
- (20) Hui, L., & Haiman, Z. 2003, to be submitted to ApJ
- Jenkins et al. (2001) Jenkins, A., Frenk, C. S., White, S. D. M., Colberg, J. M., Cole, S., Evrard, A. E., Couchman, H. M. P., & Yoshida, N. 2001, MNRAS, 321, 372
- Katz, Weinberg, & Hernquist (1996) Katz, N., Weinberg, D. H., & Hernquist, L. 1996, ApJS, 105, 19
- Kepner, Babul, & Spergel (1997) Kepner, J. V., Babul, A., & Spergel, D. N. 1997, ApJ, 487, 61
- Kitayama & Ikeuchi (2000) Kitayama, T. & Ikeuchi, S. 2000, ApJ, 529, 615
- Kogut et al. (2003) Kogut, A. 2003, ApJ, submitted, astro-ph/0302213
- Lacey & Cole (1993) Lacey, C. G., & Cole, S. 1993, MNRAS, 262, 627
- Lidz et al. (2002) Lidz, A., Hui, L., Zaldarriaga, M., & Scoccimarro, R. 2002, ApJ, 579, 491
- Makino, Sasaki, & Suto (1998) Makino, N., Sasaki, S., & Suto, Y. 1998, ApJ, 497, 555
- McDonald & Miralda-Escudé (2002) McDonald, P., & Miralda-Escudé, J. 2001, ApJ, 549, 11L
- Mo & White (1996) Mo, H. J., & White, S. D. M. 1996, MNRAS, 282, 347
- Navarro & Steinmetz (1997) Navarro, J. F. & Steinmetz, M. 1997, ApJ, 478, 13
- Oh & Haiman (2002) Oh, S.-P., & Haiman, Z. 2002, ApJ, 569, 558
- Oh & Haiman (2003) Oh, S.-P., & Haiman, Z. 2003, MNRAS, submitted, astro-ph/0307135
- Onken & Miralda-Escudé (2003) Onken, C. A., & Miralda-Escudé, J. 2003, ApJ, submitted, astro-ph/0307184
- Rees & Ostriker (1977) Rees, M. J. & Ostriker, J. P. 1977, MNRAS, 179, 541
- Ricotti et al. (2002) Ricotti, M., Gnedin, N. Y., & Shull, J. M. 2002, ApJ, 575, 49
- Shapiro et al. (2003) Shapiro, P. R., Iliev, I. T., & Raga, A. C. 2003, MNRAS, submitted, astro-ph/0307266
- Spergel et al. (2003) Spergel, D. N. et al. 2003, ApJ, submitted, astro-ph/0302209
- Thoul & Weinberg (1995) Thoul, A. A. & Weinberg, D. H. 1995, ApJ, 442, 480
- Thoul & Weinberg (1996) Thoul, A. A. & Weinberg, D. H. 1996, ApJ, 465, 608
- White, Becker, Fan, & Strauss (2003) White, R. L., Becker, R. H., Fan, X., & Strauss, M. A. 2003, AJ, 126, 1
- Wyithe & Loeb (2003) Wyithe, J. S. B. & Loeb, A. 2003, ApJ, 588, L69