Millimeter VLBI and Variability in AGN Jets
Abstract
Millimeter-VLBI images probe as deep as never before the nuclei of AGN. VLBI at 147 GHz yields transatlantic fringes for the first time. Now we can begin to study the relation between jet kinematics and spectral activity with a few ten micro-arcsecond resolution.
Max-Planck-Institut für Radioastronomie, Auf dem Hügel 69, D-53121 Bonn, Germany
Institut de Radioastronomie Millimétrique, 300 Rue de la Piscine, F-38460 St. Martin d’Hères, Grenoble, France
1. Present Status of 3mm-VLBI
The main advantage of VLBI observations at short millimeter wavelengths (mm-VLBI) is the very high angular resolution and the ability to study emission regions, which are self-absorbed at longer wavelengths. The small observing beam (up to as at 86 GHz) not only provides a spatial resolution of a few hundred to thousand Schwarzschild radii for a typical quasar, but also facilitates to locate and trace the motion of moving jet components with unprecedented accuracy and at early times after initial flux density outbursts.
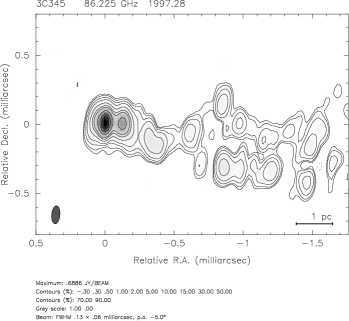
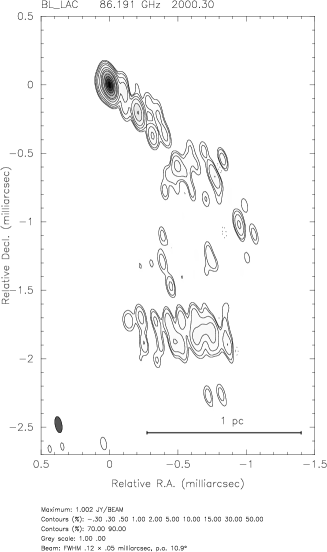
To date, global VLBI observations at 86 GHz are performed regularly, however, with regard to the relatively fast motion seen in many quasars ( mas/yr), not yet with dense enough time sampling (typically 2 observations per year). The worldwide combination of stations in the US – like the VLBA (presently 7 antennas equipped with receivers) and Haystack (37 m) – and sensitive antennas in Europe (Effelsberg 100 m, Pico Veleta 30 m Onsala 20 m and Metsahovi 14 m) forms the most powerful global mm-VLBI array. With a typical single baseline detection sensitivity () of typically Jy between Effelsberg and Pico Veleta and Jy on VLBA baselines, sources with Jy can be reliably imaged with a dynamic range of up to a few hundred. In Figure 1 we show examples of 3 mm-VLBI images for the quasar 3C 345 and for BL Lac.
2. VLBI at Higher Frequencies
Although sensitivity limitations and remaining calibration uncertainties still restrict the imaging capabilities of VLBI in the 3 mm band a bit, such VLBI observations nowadays can be regarded as more or less standard.
Efforts to push VLBI to even shorter wavelengths started in the late 1980’s and led to various successful detections of bright AGN at 1.3 mm, however, only on relatively short (continental) VLBI baselines (e.g. Greve et al. 1995, Krichbaum et al. 1997). Between 1995 – 2000 several attempts with various telescopes were made to achieve fringe detections also on the longer transatlantic baselines. These experiments were performed in the 2 mm and 1.3 mm bands, but failed due to technical difficulties. The recent promising detection of 3C 273 and 3C 279 at 147 GHz on the 3100 km (1.5G) baseline between Pico Veleta (Spain) and Metsähovi (Finland) in spring 2001 (Greve et al. 2002), and the availability of VLBI equipment and a new 2 mm receiver at the Heinrich Hertz telescope (HHT) on Mt. Graham (Arizona), stimulated a new transatlantic VLBI experiment at 147 GHz, which was performed in April 2002. We now are able to report fringe detections also on the very long inter-continental VLBI baselines (Krichbaum et al. 2002). The detection of the 3 sources NRAO 150, 3C 279, and 1633+382 on the VLBI baselines between Arizona and Spain at a fringe spacing of 4.2 G (corresponding to as resolution) with signal-to-noise ratios of up to 75 (for 3C 279) demonstrates for the first time that global VLBI at 2 mm-wavelength is possible and that the previous technical and sensitivity limitations can be overcome.
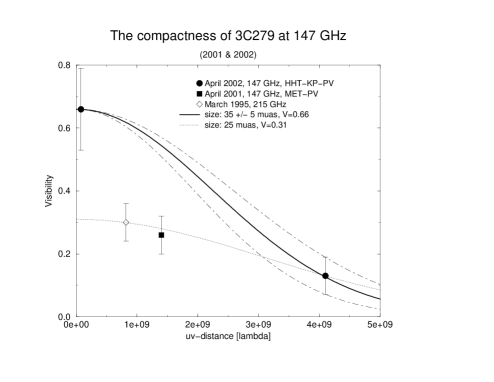
The present 2 mm and 1 mm VLBI observations were performed in snapshot mode (only few VLBI scans available per source) and it is therefore not yet possible to make maps of the detected sources. However, some estimates for the source sizes can be made. In Figure 2 we show the normalized visibility amplitude (=correlated flux / total flux) of 3C 279 plotted versus the projected baseline length (data for April 2002: filled circles). The comparison of the flux density between long and short VLBI baselines (assuming a simple Gaussian point source structure) gives a size of the VLBI core of 3C 279 of as at 147 GHz. For comparison, we also show visibility points from the previous 2 mm VLBI observation of 2001 (filled square) and the 1.3 mm VLBI observation of 1995 (open diamond). These data points indicate that the source structure is most likely variable in time and probably not pointlike, both of which is not unexpected knowing the source properties at longer wavelengths.
It is possible that the factor of two difference between the visibility amplitudes near and below 1 G reflects a temporal variation of the core size between and 2002. It is also possible that the lower amplitude in this uv-range, is due to structural beating introduced by the known sub-mas jet (1 G corresponds to 0.2 mas). A second estimate of the source size therefore can be made, if we combine the visibility points from all 3 experiments (dotted line). This yields a more compact source size of as.
For an incoherently radiating compact synchrotron source with a brightness temperature close to the inverse Compton limit of K, the theoretically expected size is 10–20 as, which is about a factor of 1.5–2 smaller than the two sizes derived above. It is therefore possible that one sees at 2 mm wavelength the VLBI core component of 3C 279 (the jet base) already spatially resolved. In this case, its intrinsic size would be of order of 0.2–0.3 pc. Of course, this estimate depends critically on the accuracy of the calibration of the VLBI antennas. Future experiments with an improved gain calibration will be necessary to check, if the rather low visibility amplitudes at G uv-spacings (only % of the total flux density is seen) are real.
3. Variability and new jet components in 3C 273
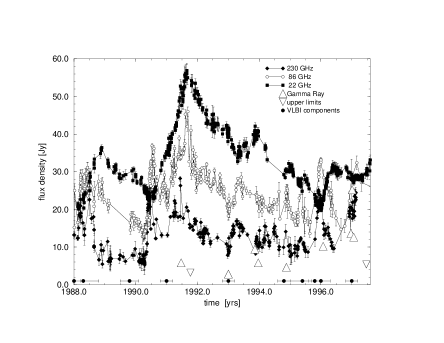
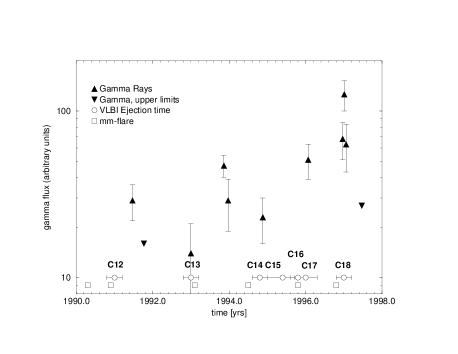
For many AGN, a correlation between flux density variability and ejection of VLBI components is suggested. From our multi-frequency VLBI monitoring of 3C 273 (1987 – 1997, Krichbaum et al. 2002), we identified 13 jet components (C6 – C18). These components move with apparent speeds of 4–8 c and seem to accelerate as they separate from the VLBI core. Our high frequency VLBI data (15-100 GHz) allow to trace the component motion back to the ejection from the VLBI core and by this to determine the times of zero separation from the core. The typical measurement uncertainty for the ejection times ranges between 0.2 – 0.5 yr. In Figure 3 (left), we plot and the millimeter-variability (22 – 230 GHz, data: H. Ungerechts, H. Teräsranta). We also add the Gamma-ray detections of 3C 273 from EGRET. In Figure 3 (right) we plot the onset times of the mm-flares derived from these light-curves (Türler et al. 1999) together with the VLBI ejection time () and the Gamma-ray fluxes. Except for component C15, which may be not related to a flux density outburst, a clear correlation between component ejection and onset times of mm-flares is seen.
For the Gamma-rays, the search for a correlation with mm-flares and VLBI component ejections is complicated by the coarse time sampling of the Gamma-ray light-curve, which does not exclude presence of more rapid variations. However, since at least 3 of the Gamma-ray detections shown in Figure 3 (left) are followed by lower Gamma-ray fluxes (with maxima near 1991.5, 1993.9, 1997.0), it is tempting to identify these with local maxima in a heavily undersampled light-curve. With this assumption, it is possible to assign the ejection time of component C12 to the Gamma-flare of 1991.5, C13 to a flare peaking somewhere between 1993.0 and 1993.9 and C18 to the flare peaking near 1997.0. For the Gamma-flare of 1997.0 it is very likely that the true maximum of the light-curve has been detected, since this measurement is surrounded by two measurements of lower intensity. For the components C14 and C15–C17 the situation is less clear. We note, however, that the components C15–C16–C17 were ejected nearly at the same time and are probably physically related to each other (shock-post-shock structure). Therefore, one of the 3 components is likely to be related with the Gamma-flare peaking around 1996.0. For C14, the ejection time correlates well with a mm-flare (peak: 1994.9) and a nearly contemporaneous Gamma-ray detection of moderate strength.
From a more detailed analysis (Krichbaum et al. 2002) we obtain for the time lag between component ejection and onset of a mm-flare: yr. If we assume that the observed peaks in the Gamma-ray light-curve are located near the times of flux density maxima, we obtain yr. Although the Gamma-ray variability may be faster, this result is fully consistent with the more general finding of enhanced Gamma-ray fluxes mainly during the rising phase of millimeter flares. Thus, we suggest the following sequence of events: – the onset of a millimeter flare is followed by the ejection of a new VLBI component and, either simultaneously or slightly time-delayed, an increase of the Gamma-ray flux. If we focus only on those VLBI components, which were ejected close to the main maxima of the Gamma-ray light-curve in Figure 3, we obtain time lags of of yr for C12, yr for C13, yr for C16 and yr for C18. In all cases the Gamma-rays seem to peak a little later than the time of component ejection. With near the core, the Gamma-rays would then escape at a radius mas. This corresponds to Schwarzschild radii (for a M black hole) or cm, consistent with theoretical expectations, in which Gamma-rays escape the horizon of photon-photon pair production at separations of a few hundred to a few thousand Schwarzschild radii.
4. Summary and Future Outlook
In summary, global mm-VLBI observations of Blazars (QSO’s, BL Lac’s) generally show a very compact core radiating near the inverse Compton limit, but also a considerable ( %) amount of flux and jet-like sub-structure on the sub-mas- to mas scale. VLBI observations at 2 & 1 mm indicate that the brightness temperatures of the VLBI cores of mm-bright blazars is not significantly different from those, observed at longer wavelengths. The VLBI-jets often are helically bent and in many cases the jet curvature increases towards the VLBI-core. There is evidence that the helicity of the jets and the component motion along spatially curved paths is related to internal rotation of the jet and precession at the jet base. In 3C 273, 3C 345, BL Lac, 0716+714 and many other sources, new superluminally moving jet components appear weeks to months after the of flux density outbursts, which propagate through the whole electromagnetic spectrum. In 3C 273 Gamma-ray flares and the ejection of relativistic jet components are closely related.
The relatively fast motion and the complexity of the source structures requires for the future more sensitive mm-VLBI antennas, which observe with denser (weekly to monthly) time sampling. Present day mm-VLBI suffers from the lack of short uv-spacings. As a consequence, it is presently not possible to reliably image all of the source flux visible at mm-wavelengths. The relatively high surface brightness of the sources on the short (100-1000 km long) baselines facilitates easy VLBI detection and therefore gives room also for less sensitive and smaller antennas to play a significant role in future high resolution mm-VLBI imaging.
The addition of more collecting area through sensitive antennas specially designed for the millimeter and sub-millimeter bands is most important for future mm-VLBI, particularly at the shorter wavelengths (2 & 1 mm). This includes existing antennas, which are not yet participating in mm-VLBI (eg. JCMT, SMA, NRO), but also new antennas like e.g. the 50 m LMT in Mexico and the ALMA prototype antenna APEX. Owing to their outstanding sensitivity, phased interferometers will play a particular important role. For the near future (2002/3), the participation of the IRAM interferometer at Plateau de Bure (France) is planned (first at 3 & 1 mm, later also at 2 mm). This will increase the present sensitivity by a factor of to the Jy level. In the more distant future CARMA - the merger of the BIMA and OVRO interferometers - and ALMA should lower the detection threshold to 1–10 mJy and by this largely enhance the observational possibilities. In parallel, higher data recording rates and observing bandwidths (GBit/s recording using the MKV system) and correction of atmospheric phase degradation (water vapor radiometry, phase referencing) will help to further improve the sensitivity.
All this will facilitate the imaging of Quasars, nearby Radio-Galaxies and of the Galactic Center source with the fascinating angular resolution of only arcseconds !
References
Greve, A., et al., 1995, A&A, 299, L33.
Greve, A., et al., 2002, A&A, 390, 19.
Krichbaum, T.P., et al. 1997, A&A, 323, L17.
Krichbaum, T.P., et al. 2002, in: Proc. of the 6th European VLBI Network Symposium, eds. E. Ros, R.W. Porcas, A.P. Lobanov, & J.A. Zensus (Bonn: MPIfR), 125.
Krichbaum, T.P., et al. 2002, A&A, submitted.
Türler, M., et al. 1999, A&A, 349, 45.