LYMAN EMITTERS AT REDSHIFT 5.7 IN THE COSMOS FIELD 11footnotemark: 1
Abstract
We present results from a narrow-band optical survey of a contiguous area of 1.95 deg2, covered by the Cosmic Evolution Survey (COSMOS). Both optical narrow-band ( Å and Å) and broad-band (, , , , , and ) imaging observations were performed with the Subaru prime-focus camera, Suprime-Cam on the Subaru Telescope. We provide the largest contiguous narrow-band survey, targetting Ly emitters (LAEs) at . We find a total of 119 LAE candidates at . Over the wide-area covered by this survey, we find no strong evidence for large scale clustering of LAEs. We estimate a star formation rate (SFR) density of yr-1 Mpc-3 for LAEs at , and compare it with previous measurements.
Subject headings:
cosmology: observations — cosmology: early universe — galaxies: formation — galaxies: evolution1. INTRODUCTION
Understanding of the formation and early evolution of galaxies requires study of rest-frame properties of well-defined samples of high-redshift galaxies. These are needed to address the comsic star formation history and growth of large scale structures in the early Universe and the source of cosmic reionization of intergalactic space. There are two widely used techniques to select such high-redshift galaxies: (1) Lyman Break technique, aiming for Lyman Break Galaxies (LBGs; Steidel et al. 1999; Iwata et al. 2003; Ouchi et al. 2004; Bouwens & Illingworth 2006 and references therein), and (2) narrow-band imaging surveys, targeting Ly emitters (LAEs; Hu & McMahon 1996; Rhoads & Malhotra 2001; Ajiki et al. 2003; Hu et al. 2004; Taniguchi et al. 2005 and references therein). The narrow-band surveys are mainly aimed at star-forming population while Lyman Break technique also selects galaxies with older age.
Recently, LAE surveys have extended study of the clustering and morphology of star-forming galaxies to the highest redshifts (Shimasaku et al. 2004; Ouchi et al. 2005; Ajiki et al. 2006; Mobasher et al. 2006). Indeed, some of the previous LAE surveys have shown signs of large scale structures, either using 2-D projected distribution of galaxies or 3-D distribution, also using redshifts. For example, evidence for clustering of LAEs at was found over an area of 0.5 degree 0.5 degree, covered by the Subaru Deep Field (SDF) (Shimasaku et al. 2004; see also Ouchi et al. 2003), extending to 20 Mpc 50 Mpc. However, no such structures were found for LAEs at (Shimasaku et al. 2006) and (Taniguchi et al. 2005; Kashikawa et al. 2006). Although, using a spectroscopically confirmed sample of 34 LAEs at , Shimasaku et al. (2006) found evidence for weak clustering. In an independent study, using a spectroscopically confirmed sample of 19 LAEs at , Hu et al. (2004) found structures extending to angular scales of Mpc with evidence for filamentary structures. This result was further confirmed by Ouchi et al. (2005) who found filamentary structures of size 10 – 40 Mpc in the Subaru XMM-Newton Deep Survey (SXDS: Sekiguchi et al. 2004), using a photometric sample of 515 LAEs. In addition to the above results, based on deep narrow-band surveys in so-called “blank fields”, evidence has been accumulating in support of clustering at to 5.2, with a few Mpc scales around high-redshift radio galaxies (Venemans et al. 2002, 2004; Overzier et al. 2006) and quasar SDSS J0836+0054 (Zheng et al. 2006; Ajiki et al. 2006b).
These studies are useful in investigating early formation of galaxies and large-scale structures. Furthermore, they provide important constraints on both the star formation and cosmic re-ionization history. A detailed study of clustering of galaxies at high-redshifts requires deep and wide-area surveys to allow a homogeneously selected sample of galaxies and to minimise effects of cosmic variance. This is the subject of the present paper.
In this paper we present the largest survey of LAEs at , covering the entire 2 square degree field of the Cosmic Evolution Survey (COSMOS), centered at (J2000.0) = and (J2000.0) = (Scoville et al. 2007). The full COSMOS field has been observed in -band with the Advanced Camera for Surveys (ACS) on-board the Hubble Space Telescope (HST). In addition to the ACS data, the multi-wavelength broad and narrow-band observations were also performed using the Supreme-Cam (Miyazaki et al. 2002) on the Subaru Telescope (Kaifu et al. 2000; Iye et al. 2004). The narrow-band filter NB816 has an effective wavelength of Å with a width Å (see Ajiki et al. 2003 for details), allowing to select LAEs in the range . We assume standard cosmology with , , and km s-1 Mpc-1. Throughout this paper, we use magnitudes in the AB system.
2. OBSERVATIONS AND SAMPLE SELECTION
2.1. Data and Source Detection
We carried out an optical narrow-band (NB816) imaging survey of the entire 2-deg2 area of the COSMOS field, using the Suprime-Cam on the Subaru Telescope. These observations, combined with the broad-band (, , , , , and ) Suprime-Cam and ACS () photometric data will be used to identify LAE candidates at and to study their properties. Details of the narrow-band and ground-based observations and data reduction are given in Taniguchi et al. (2007) and Capak et al. (2007a) and for the HST-ACS observations in Koekemoer et al. (2007).
For the ground-based observations, the seeing size varies between the exposures. The PSF size of each NB816 images is between and . To optimize source detection in NB816, we only use exposures with PSF sizes smaller than to construct a combined image.
The limiting magnitude of the NB816 has a variance of mag, depending on the location on the image. We only confine our LAE search to areas with low noise where the 5 limiting magnitude with a diameter aperture in NB816 is . This corresponds to a total effective area of 1.95 deg2. The transverse co-moving area of the LAE survey at is Mpc2. The FWHM of the filter, which has a Gaussian-like shape, corresponds to a co-moving depth of 45 Mpc, spanning the redshift range along the line-of-sight. Therefore, our NB816 survey probes a volume of Mpc3.
We have performed source detection and photometry on the NB816 image with SExtractor version 2.3 (Bertin & Arnouts 1996). A source is selected as a contiguous 9-pixel area above the 3 noise level (corresponding to 26.48 mag arcsec-2) on the NB816 image. Photometry is performed on the NB816 and the broadband images over , , and diameter apertures. To the magnitude limit of the survey [], we find sources.
2.2. Selection of LAE Candidates
Our main aim in the present survey is to identify reliable LAE candidates at by first selecting NB816 excess objects, using the following criteria:
| (1) | |||||
| (2) | |||||
| (3) | |||||
| (4) | |||||
| (5) | |||||
| (6) |
where is the continuum magnitude at Å, estimated by linear interpolation between and flux densities (). The first criterion ensures that objects are detected above the 5 level in the NB816. The criterion 2 allows selection of emission-line objects with observed equivalent width, Å. The of is estimated from the local-background noise measurement of the most noisy region in the survey area. This is illustrated in Figure 1 where the LAE candidates are identified on vs. NB816 color—magnitude diagram. The criteria (3), (4), (5), and (6) ensure that candidates are undetected (at noise level) in , , , and bands. We adopt magnitudes in a 05 diameter aperture to avoid possible contamination by low- foreground objects.
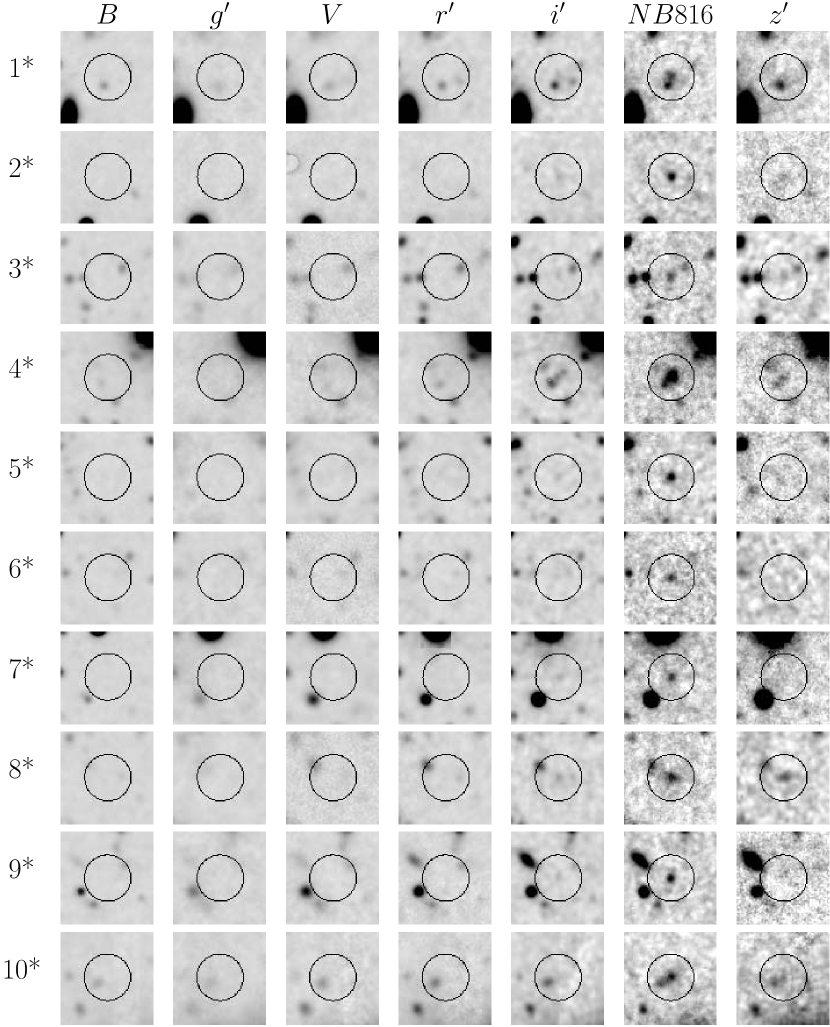
We find a total of 119 LAE candidates at that satisfy the above criteria and confirm these by careful eye inspection for apparent false detections. Our first spectroscopic followup observation of 50 LAE candidates indicates a 95% or better confirmation rate (Capak et al. 2007b). We also find that there is no low-luminosity radio-loud AGN with W Hz-1 among our final LAE candidates (Carilli et al. 2007). The coordinates and photometric data for the LAE candidates are listed in Table 1. All magnitudes are corrected for Galactic extinction; (Capak et al. 2007a). In Table 1 we also list emission line fluxes and observed equivalent widths estimated from NB816 and flux densities in a aperture.
As shown by the criterion 2, the detection limit of LAEs depends on the depth of both the NB816 and and band images. However, we did not impose any noise threshold on the and band images when we selected the LAE candidates. To ensure homogeneity, we make a subsample of the LAE candidates in areas with low noise, both in the and bands where the 5 limiting magnitude over a diameter aperture is brighter than 25.4 or 24.8 mag in and bands respectively. This subsample (hereafter, the statistical sample) contains 111 LAE candidates which are identified by asterisks in Table 1. We use this “statistical sample” to estimate statistical properties of LAEs, including their number density and luminosity function. The size of the effective area corresponding to this statistical sample is reduced to 1.86 deg2, equivalent to Mpc2 of the transverse co-moving area at =5.7. The survey volume for the statistical sample is Mpc3.
3. Results and Discussion
3.1. Spatial Distribution and Angular Two-Point Correlation Function
In Figure 3, we show the spatial distribution of all the LAE candidates in our sample. There appears to be little evidence for strong clustering. When dividing the survey area into four tiles with 0.7 degree 0.7 degree each, we find 26, 28, 26, and 31 LAEs in the SW, NW, SE, and NE quadrant respectively. Therefore, the 111 LAE candidates in the statistical sample are almost randomly distributed at least in large scale.
We derive the angular two-point correlation function (ACF), , for the 111 LAE candidates in the “statistical sample” using the estimator defined by Landy & Szalay (1993)
| (7) |
where , , and are normalized numbers of galaxy-galaxy, galaxy-random, and random-random pairs, respectively. The random sample consists of 100,000 sources with the same geometrical constraints as the LAE sample.
In the left panel of Figure 4, we show the ACF for the statistical LAE sample (large filled circles). There is a clustering signal with 2.8 significance at 25 arcsec ( 1.0 Mpc at ). We also find possible signals at 63 arcsec, 100 arcsec, 158 arcsec, and 251 arcsec although their detection significance is as low as 1.3. We compare this with the ACF for LAE candidates at in the SDF (Shimasaku et al. 2006) using their whole sample; (small filled circles) and their bright sample; (open circles). Most of data points are consistent within 1 errors among the three samples. However, there seems to be possible difference among the three samples at small angular scales. Since our LAE sample is limited at , the brighter sample seems to show the larger at arcsec.
Although the clustering signals are not high, particularly at larger scales (e.g., arcsec), the LAE candidates in the COSMOS field follow a power-law relation between and , as shown in the right panel (i.e. ). We find a best fit power law with an index of and an amplitude at 1 arcsec of . For this power law fit, we only used data points between 25 arcsec and 1585 arcsec except the point at 398 arcsec. The value of is steeper than (at ) and (at ) found for Lyman break galaxies in the SDF (Kashikawa et al. 2006). The semi-analytic models predict that the ACF for higher halo mass has a steeper slope and a stronger amplitude (Kashikawa et al. 2006), our results imply that the LAEs are embedded in massive dark matter halo, e.g., heavier than (Ouchi et al. 2004). However, absence of significant clustering signal for LAEs at in the SDF (Shimasaku et al. (2006)) may be indicative of cosmic variance in these studies.
3.2. Ly Luminosities of LAE Candidates
Using our total sample of LAE candidates at and a volume of Mpc3, we estimate a space density of (Ly) Mpc-3 for the LAE candidates in our “statistical sample”. This is a factor of 1.6 lower than those in previous LAE surveys with nearly the same NB816 limits (NB816 ) (Ajiki et al. 2003; Hu et al. 2004). The observed difference is likely caused by cosmic variance.
We measure the Ly luminosity, (Ly), of our LAE candidates, assuming all the LAEs to be at . The rest-frame equivalent widths and Ly luminosities as listed in Table 2. We adopted aperture magnitudes measured over a aperture diameter for estimation of the Ly luminosity. We find that the magnitudes measured over and apertures are well correlated with a small systematic offset. However, the total magnitudes from SExtractor (MAGAUTO) show large scatter when compared with the aperture magnitudes measured over and diameter apertures due to contamination by neighboring objects. The derived Ly luminosities range from ergs s-1 to ergs s-1.
Using the 111 LAE candidates in our “statistical sample”, we constructed the Ly luminosity function, as shown in the left panel of Figure 5. We compare this with other Ly luminosity functions at (Rhoads & Malhotra 2001; Ajiki et al. 2003, 2006a; Hu et al. 2004). Our survey has a luminosity limit of (Ly) ergs s-1, corresponding to a LAE with , undetected in and in . This limit is similar to those in Ajiki et al. (2003) and Hu et al. (2004). The luminosity functions do not show any significant difference at the luminous part [(Ly) ergs s-1], although the number density of Rhoads & Malhotra (2001) is smaller compared to those in other surveys. Because of the improved Poisson statistics in the COSMOS LAE sample, the errorbars in this survey are relatively smaller. Therefore, the brighter part of the LAE luminosity function is relatively well established. Also, the wide area covered by the COSMOS survey enables us to improve the statistics at the brighter part of the luminosity function ((Ly) ergs s-1) by increasing the number of luminous LAEs per luminosity bin compared to previous surveys. At (Ly) ergs s-1, the number density from this study is almost the same as that of Rhoads & Malhotra (2001) and Ajiki et al. (2006a) while is smaller (by a factor of 2) than that estimated in Hu et al. (2004) and Ajiki et al. (2003). This is, at least partly, due to both spatial variance and incompleteness at (Ly) ergs s-1 in our survey.
In Figure 5 (right panel), we also compare our result with those of previous LAE surveys as a function of redshift. The LAE luminosity functions at , , and are taken from Cowie & Hu (1998), Ouchi et al. (2003), and Taniguchi et al. (2005), respectively. COSMOS () and Taniguchi et al. 2005 () give almost the same result within errors at the bright end ((Ly) ergs s-1). No LAE with (Ly) ergs s-1 is found in the previous LAE surveys at and . While there are differences on the detection completeness and the contamination rates among the surveys, this may provide evidence for the number and/or luminosity evolutions of LAEs.
3.3. Star Formation Rates
We now estimate the contribution from LAEs to the star formation rate (SFR) at , using the following relation (Kennicutt 1998; Brocklehurst 1971),
| (8) |
where Ly is in ergs s-1. We assume Salpeter initial mass function with (, ) = (0.1 , 100 ).
The estimated SFRs are given in the forth column of Table 2. They range from 5.7 to 28.3 yr-1 with a median value of 9.6 yr-1. The SFRs derived here can be underestimated due to the effect of absorption by H i gas both in the host galaxies and in the intergalactic medium and dusts in the host galaxies. SFRs independent of the absorption are estimated by the radio data; an upper limit to the mean massive star formation rate (5 to 100 ) for the LAE sample is derived as yr-1 (Carilli et al. 2007).
The estimated SFRs from the Ly luniomsities here are comparable to those of LAEs at 5.7 – 6.6 (e.g., Ajiki et al. 2003; Taniguchi et al. 2005). The SFR density at is estimated by summing up the Ly luminosities of the 111 “statistical candidates” and corresponds to yr-1 Mpc-3, similar to those obtained in previous narrow-band surveys.
It would be instructive to examine whether the SFRs derived from the Ly luminosity here are consistent with those based on the UV continuum luminosity from the broad-band data. The observed magnitudes, measured over aperture diameters, are converted to UV continuum luminosities at Åand used to estimate the SFRs, using the relation (Kennicutt 1998; see also Madau et al. 1998),
| (9) |
where is the UV continuum luminosity in ergs s-1 Hz-1. For each object, we estimate the SFR from its rest-frame UV (Å) continuum luminosity, with the results summarized in Table 2. Comparison between (Ly) and (UV) in Figure 6 shows that, on average, (UV) is relatively higher than (Ly) for most of the LAE candidates. We find an average ratio of (Ly) / (UV), where (Ly) and (UV) are, respectively, the sum of SFRs of all our 119 LAE candidates from Ly line and continuum. The relatively lower (Ly) compared to (UV) is likely due to the effect of the differential absorption. However, some of our LAE candidates have (Ly)/(UV) , e.g., those ratios of #13, #27, #50, #71, and #114 are greater than unity with 2 significance. They may be in a very early phase ( yr) of star formation activity in which (UV) is underestimated (Schaerer 2000; see also Nagao et al. 2004, 2005).
4. SUMMARY
We have presented results from our narrow-band deep imaging survey of the COSMOS field, targetting LAEs at . This is the largest contiguous survey of LAEs. Our main results are summarized below:
(1) We found 119 LAE candidates in our narrow-band survey. Allowing for changes in the noise level over the entire field, we extracted a subsample of 111 LAEs that is used to make our statistical analysis.
(2) We find no significant evidence for clustering of LAEs at contrary to some of the previous LAE surveys.
(3) An analysis of angular two-point correlation function gives the power-law relation , with . The power-law index here is steeper than that found for Lyman break galaxies at and 5. This suggests that LAEs at 5.7 might be located in massive dark matter halos with mass of .
(4) The number density of LAEs and the average star formation rate are similar to those measured in previous surveys. We estimate a star formation rate density of yr-1 Mpc-3 at .
(5) We measure the Ly luminosity function at and extend this to (Ly) ergs s-1, not explored by previous LAE surveys. We compare the estimated Ly luminosity function here with those in previous studies in the range .
References
- (1) Ajiki, M., et al. 2003, AJ, 126, 2091
- (2) Ajiki, M., Mobasher, B., Taniguchi, Y., Shioya, Y., Nagao, T., Murayama, T., & Sasaki, S. S., 2006a, ApJ, 638, 596
- (3) Ajiki, M., et al. 2006b, PASJ, 58, 499
- (4) Bertin, E., & Arnouts, S. 1996, A&AS, 117, 393
- (5) Bouwens, R. J., & Illingworth, G. D. 1996, Nature, 443, 189
- (6) Brocklehurst, M. 1971, MNRAS, 153, 471
- (7) Capak, P., et al. 2007a, ApJ, submitted
- (8) Capak, P., et al. 2007b, in preparation
- (9) Carilli, C. L., et al. 2007, ApJ, submitted
- (10) Cowie, L. L., & Hu, E. M. 1998, AJ, 115, 1319
- (11) Hu, E. M., Cowie, L. L., Capak, P., McMahon, R. G., Hayashino, T., & Komiyama, Y. 2004, AJ, 127, 563
- (12) Hu, E. M., & McMahon, R. G. 1996, Nature, 382, 281
- (13) Iwata, I., Ohta, K., Tamura, N., Ando, M., Wada, S., Watanabe, C., Akiyama, M., & Aoki, K. 2003, PASJ, 55, 415
- (14) Iye, M., et al. 2004, PASJ, 56, 381
- (15) Kaifu, N., et al. 2000, PASJ, 52, 1
- (16) Kashikawa, N., et al. 2006, ApJ, 637, 631
- (17) Kennicutt, R. C., Jr. 1998, ARA&A, 36, 189
- (18) Koekemoer, A. et al. 2007 , ApJ, submitted
- (19) Landy, S., & Szalay, A. S. 1993, ApJ, 412, 64
- (20) Madau, P., Pozzetti, L., & Dickinson, M. 1998, ApJ, 498, 106
- (21) Miyazaki, S. et al. 2002, PASJ, 54, 833
- (22) Nagao, T., et al. 2004, ApJ, 613, L9
- (23) Nagao, T., et al. 2005, ApJ, 634, 142
- (24) Ouchi, M., et al. 2003, ApJ, 582, 60
- (25) Ouchi, M., et al. 2004, ApJ, 611, 685
- (26) Ouchi, M., et al. 2005, ApJ, 620, L1
- (27) Overzier, R. A. et al. 2006, ApJ, 637, 58
- (28) Rhoads, J. E., & Malhotra, S. 2001, ApJ, 563, L5
- (29) Schaerer, D. 2000, in Building the Galaxies: From the Primordial Universe to the Present, eds. F. Hammer, et al. (Gif-sur-Yvette: Editions Frontières), 389
- (30) Scoville, N. Z., et al. 2007, ApJ, submitted
- (31) Sekiguchi, K., et al. 2004,ApSS Library, 301, 169
- (32) Shimasaku, K., et al. 2004, ApJ, 605, L93
- (33) Shimasaku, K., et al. 2006, PASJ, 58, 313
- (34) Steidel, C. C., Adelberger, K. L., Giavalisco, M., Dickinson, M., & Pettini, M. 1999, ApJ, 519, 1
- (35) Taniguchi, Y., et al. 2005, PASJ, 57, 165
- (36) Taniguchi, Y., et al. 2007, ApJ, submitted
- (37) Venemans, B. P., et al. 2002, ApJ, 569, L11
- (38) Venemans, B. P., et al. 2004, A&A, 424, L17
- (39) Zheng, W., et al. 2006, ApJ, 640, 574
| No.aaAsterisks denote the statistical sample. | (J2000) | (J2000) | NB816bbAB magnitude. An entry of “99.0” indicates that no excess flux was measured. All of our LAE candidates are undetected in the -, -, -, -band data. | bbAB magnitude. An entry of “99.0” indicates that no excess flux was measured. All of our LAE candidates are undetected in the -, -, -, -band data. | bbAB magnitude. An entry of “99.0” indicates that no excess flux was measured. All of our LAE candidates are undetected in the -, -, -, -band data. | bbAB magnitude. An entry of “99.0” indicates that no excess flux was measured. All of our LAE candidates are undetected in the -, -, -, -band data. | NB816bbAB magnitude. An entry of “99.0” indicates that no excess flux was measured. All of our LAE candidates are undetected in the -, -, -, -band data. | bbAB magnitude. An entry of “99.0” indicates that no excess flux was measured. All of our LAE candidates are undetected in the -, -, -, -band data. | ccFlux densities of the NB816 band and the band in unit of erg s-1 cm-2 Hz-1. Errors and upper-limits represent 1 significance. | ccFlux densities of the NB816 band and the band in unit of erg s-1 cm-2 Hz-1. Errors and upper-limits represent 1 significance. | ddEstimated line fluxes in unit of erg s-1 cm-2. Errors represent 1 significance. | eeEstimated observed equivalent widths. Errors and lower-limits represent 1 significance. |
|---|---|---|---|---|---|---|---|---|---|---|---|---|
| () | () | (20) | (20) | (20) | (20) | (30) | (30) | (30) | (30) | (Å) | ||
| 1* | 149.4786 | +2.2116 | 24.9 | 26.3 | 26.4 | 26.3 | 24.5 | 25.9 | ||||
| 2* | 149.5460 | +2.7640 | 24.8 | 26.7 | 26.0 | 26.3 | 24.6 | 25.9 | ||||
| 3* | 149.5790 | +1.5183 | 25.1 | 26.9 | 26.2 | 26.5 | 24.7 | 26.3 | ||||
| 4* | 149.6052 | +2.4476 | 23.7 | 25.2 | 25.3 | 25.2 | 23.2 | 24.8 | ||||
| 5* | 149.6320 | +2.3466 | 24.7 | 27.1 | 26.7 | 26.9 | 24.4 | 26.2 | ||||
| 6* | 149.6331 | +1.8223 | 25.0 | 27.7 | 27.3 | 27.5 | 24.7 | 26.4 | ||||
| 7* | 149.6361 | +2.3276 | 24.9 | 26.5 | 26.3 | 26.4 | 24.6 | 25.6 | ||||
| 8* | 149.6537 | +1.5394 | 24.7 | 26.1 | 25.0 | 25.5 | 24.2 | 24.8 | ||||
| 9* | 149.6804 | +2.7076 | 24.8 | 27.2 | 27.2 | 27.2 | 24.6 | 30.4 | ||||
| 10* | 149.6886 | +2.9180 | 24.5 | 26.0 | 25.3 | 25.6 | 24.1 | 24.6 | ||||
| 11 | 149.7334 | +1.4765 | 24.7 | 25.7 | 25.5 | 25.6 | 24.1 | 24.8 | ||||
| 12* | 149.7362 | +1.5594 | 25.0 | 27.9 | 99.0 | 99.0 | 24.7 | 99.0 | ||||
| 13* | 149.7457 | +2.7519 | 24.1 | 27.1 | 27.4 | 27.2 | 23.9 | 99.0 | ||||
| 14* | 149.7493 | +2.7609 | 24.1 | 25.6 | 25.4 | 25.5 | 23.6 | 25.0 | ||||
| 15* | 149.7537 | +2.2380 | 24.8 | 26.3 | 25.4 | 25.8 | 24.6 | 25.1 | ||||
| 16* | 149.7725 | +1.7967 | 25.1 | 27.2 | 27.7 | 27.4 | 24.9 | 27.5 | ||||
| 17* | 149.7810 | +1.5176 | 24.6 | 25.9 | 25.8 | 25.9 | 24.2 | 25.2 | ||||
| 18* | 149.7812 | +1.4940 | 24.1 | 25.8 | 25.8 | 25.8 | 23.8 | 25.7 | ||||
| 19* | 149.8019 | +1.8274 | 24.6 | 25.7 | 26.3 | 25.9 | 24.2 | 25.9 | ||||
| 20* | 149.8023 | +2.2251 | 25.0 | 27.0 | 26.2 | 26.6 | 24.7 | 26.0 | ||||
| 21* | 149.8082 | +2.6360 | 25.1 | 27.5 | 27.0 | 27.3 | 24.8 | 27.5 | ||||
| 22 | 149.8085 | +1.5439 | 24.8 | 26.2 | 26.5 | 26.4 | 24.3 | 99.0 | ||||
| 23* | 149.8186 | +1.7204 | 25.0 | 26.1 | 26.2 | 26.1 | 24.4 | 25.9 | ||||
| 24* | 149.8203 | +2.7823 | 24.5 | 26.6 | 26.4 | 26.5 | 24.3 | 26.4 | ||||
| 25* | 149.8323 | +2.0561 | 25.1 | 26.9 | 26.5 | 26.7 | 24.6 | 26.7 | ||||
| 26* | 149.8380 | +1.6948 | 25.1 | 26.8 | 30.2 | 27.4 | 25.1 | 28.7 | ||||
| 27* | 149.8443 | +2.7615 | 24.3 | 26.2 | 26.2 | 26.2 | 24.0 | 25.8 | ||||
| 28* | 149.8466 | +2.7517 | 25.1 | 26.8 | 99.0 | 99.0 | 24.8 | 27.0 | ||||
| 29* | 149.8776 | +2.3317 | 24.9 | 25.9 | 26.4 | 26.1 | 24.4 | 26.0 | ||||
| 30* | 149.8893 | +2.8322 | 24.6 | 26.4 | 26.8 | 26.6 | 24.3 | 25.8 | ||||
| 31* | 149.9107 | +1.6147 | 24.1 | 26.3 | 26.0 | 26.2 | 23.8 | 26.2 | ||||
| 32 | 149.9197 | +1.4827 | 24.2 | 26.9 | 25.8 | 26.3 | 23.9 | 26.1 | ||||
| 33* | 149.9303 | +1.5980 | 24.5 | 26.3 | 25.4 | 25.8 | 24.2 | 25.1 | ||||
| 34* | 149.9336 | +2.0141 | 25.0 | 26.9 | 26.0 | 26.4 | 24.7 | 25.5 | ||||
| 35* | 149.9422 | +2.1286 | 24.8 | 26.1 | 26.0 | 26.1 | 24.4 | 25.6 | ||||
| 36* | 149.9447 | +1.5357 | 24.8 | 27.2 | 25.9 | 26.4 | 24.5 | 25.9 | ||||
| 37* | 149.9586 | +2.9017 | 24.6 | 27.0 | 27.4 | 27.2 | 24.4 | 99.0 | ||||
| 38* | 149.9625 | +2.5397 | 24.8 | 26.9 | 30.2 | 27.5 | 24.5 | 99.0 | ||||
| 39* | 149.9672 | +1.6231 | 24.4 | 26.2 | 26.1 | 26.2 | 24.2 | 26.0 | ||||
| 40* | 149.9719 | +2.1182 | 24.2 | 25.9 | 24.7 | 25.2 | 23.9 | 24.4 | ||||
| 41* | 149.9735 | +2.8166 | 24.6 | 27.2 | 28.3 | 27.5 | 24.5 | 99.0 | ||||
| 42* | 149.9772 | +2.2546 | 24.9 | 27.1 | 27.1 | 27.1 | 24.8 | 27.3 | ||||
| 43* | 149.9783 | +2.1776 | 24.5 | 26.5 | 26.3 | 26.4 | 24.2 | 26.1 | ||||
| 44* | 149.9792 | +1.7890 | 24.6 | 26.6 | 26.3 | 26.5 | 24.3 | 26.0 | ||||
| 45* | 150.0021 | +1.8278 | 24.8 | 26.4 | 26.0 | 26.2 | 24.5 | 25.9 | ||||
| 46* | 150.0638 | +1.4831 | 24.2 | 25.4 | 25.4 | 25.4 | 23.8 | 24.9 | ||||
| 47* | 150.0653 | +2.0156 | 24.4 | 26.2 | 25.7 | 26.0 | 24.1 | 25.2 | ||||
| 48* | 150.0710 | +2.7698 | 24.5 | 27.7 | 27.5 | 27.6 | 24.2 | 99.0 | ||||
| 49* | 150.0832 | +2.0176 | 25.1 | 27.1 | 26.8 | 27.0 | 24.8 | 28.3 | ||||
| 50* | 150.0937 | +2.6843 | 23.8 | 26.0 | 27.5 | 26.4 | 23.5 | 99.0 | ||||
| 51* | 150.1005 | +2.7901 | 24.9 | 27.2 | 99.0 | 99.0 | 24.9 | 99.0 | ||||
| 52* | 150.1019 | +2.9165 | 24.6 | 26.2 | 25.5 | 25.8 | 24.2 | 25.0 | ||||
| 53* | 150.1090 | +1.5444 | 23.9 | 25.5 | 25.2 | 25.4 | 23.5 | 24.9 | ||||
| 54* | 150.1214 | +2.6877 | 25.1 | 25.9 | 99.0 | 99.0 | 24.5 | 26.9 | ||||
| 55* | 150.1267 | +2.2874 | 24.8 | 27.3 | 26.7 | 27.0 | 24.5 | 26.6 | ||||
| 56* | 150.1335 | +1.5006 | 25.0 | 26.6 | 25.8 | 26.1 | 24.6 | 25.9 | ||||
| 57* | 150.1376 | +2.2597 | 23.9 | 25.8 | 25.5 | 25.6 | 23.5 | 24.9 | ||||
| 58* | 150.1566 | +2.8614 | 25.0 | 28.9 | 27.7 | 28.2 | 24.8 | 99.0 | ||||
| 59* | 150.1676 | +2.3177 | 24.9 | 27.6 | 27.0 | 27.3 | 24.7 | 26.3 | ||||
| 60* | 150.1919 | +1.5765 | 24.5 | 25.8 | 25.8 | 25.8 | 24.1 | 25.5 | ||||
| 61* | 150.2032 | +2.2278 | 24.3 | 25.7 | 25.0 | 25.3 | 24.0 | 24.3 | ||||
| 62* | 150.2166 | +2.7730 | 24.8 | 27.5 | 99.0 | 99.0 | 24.5 | 99.0 | ||||
| 63* | 150.2254 | +1.5436 | 24.6 | 26.5 | 25.8 | 26.1 | 24.2 | 25.5 | ||||
| 64* | 150.2314 | +1.6086 | 24.9 | 27.6 | 26.6 | 27.0 | 24.5 | 25.8 | ||||
| 65* | 150.2434 | +1.6119 | 25.0 | 26.6 | 26.7 | 26.6 | 24.8 | 26.4 | ||||
| 66* | 150.2471 | +1.5555 | 24.6 | 26.5 | 24.8 | 25.4 | 24.3 | 24.5 | ||||
| 67* | 150.2521 | +2.8980 | 23.9 | 25.4 | 24.5 | 24.9 | 23.3 | 23.7 | ||||
| 68* | 150.2623 | +1.8624 | 24.9 | 26.9 | 26.8 | 26.9 | 24.5 | 26.7 | ||||
| 69* | 150.2807 | +1.8730 | 24.9 | 27.4 | 28.4 | 27.7 | 24.6 | 99.0 | ||||
| 70 | 150.2852 | +1.4858 | 24.5 | 27.0 | 28.2 | 27.4 | 24.3 | 27.5 | ||||
| 71* | 150.2905 | +2.2538 | 23.5 | 25.9 | 26.0 | 25.9 | 23.3 | 25.3 | ||||
| 72* | 150.2973 | +2.8944 | 25.0 | 27.3 | 26.7 | 27.0 | 24.8 | 25.8 | ||||
| 73* | 150.3267 | +1.9511 | 24.2 | 25.7 | 26.1 | 25.8 | 24.0 | 25.7 | ||||
| 74* | 150.3400 | +2.8002 | 24.9 | 26.6 | 26.0 | 26.3 | 24.4 | 25.6 | ||||
| 75* | 150.3493 | +1.9334 | 24.4 | 26.7 | 26.2 | 26.4 | 24.2 | 26.0 | ||||
| 76* | 150.3621 | +1.7417 | 24.3 | 28.0 | 25.9 | 26.6 | 24.0 | 25.6 | ||||
| 77* | 150.3657 | +2.5017 | 24.7 | 26.8 | 26.2 | 26.5 | 24.3 | 25.6 | ||||
| 78* | 150.3712 | +1.8250 | 23.9 | 26.1 | 25.4 | 25.8 | 23.5 | 25.0 | ||||
| 79* | 150.3795 | +2.5183 | 24.6 | 27.1 | 26.7 | 26.9 | 24.4 | 26.1 | ||||
| 80* | 150.3978 | +2.7734 | 24.8 | 26.5 | 26.4 | 26.4 | 24.3 | 25.5 | ||||
| 81* | 150.4005 | +1.8018 | 24.9 | 25.9 | 25.8 | 25.9 | 24.6 | 26.4 | ||||
| 82* | 150.4078 | +2.9117 | 24.8 | 26.4 | 25.8 | 26.1 | 24.6 | 25.4 | ||||
| 83* | 150.4079 | +2.1133 | 25.0 | 26.5 | 25.9 | 26.2 | 24.7 | 25.6 | ||||
| 84* | 150.4091 | +2.8063 | 24.1 | 25.3 | 24.5 | 24.9 | 23.5 | 24.0 | ||||
| 85* | 150.4274 | +2.4974 | 24.1 | 25.8 | 25.0 | 25.4 | 23.8 | 24.5 | ||||
| 86* | 150.4339 | +2.4867 | 25.0 | 27.1 | 27.0 | 27.0 | 24.8 | 26.3 | ||||
| 87* | 150.4393 | +2.7860 | 25.1 | 26.7 | 26.5 | 26.6 | 24.7 | 25.9 | ||||
| 88* | 150.4444 | +1.8076 | 24.7 | 27.5 | 99.0 | 99.0 | 24.5 | 99.0 | ||||
| 89* | 150.4685 | +2.7071 | 25.0 | 28.1 | 99.0 | 99.0 | 24.5 | 29.6 | ||||
| 90* | 150.4766 | +1.5314 | 25.0 | 26.7 | 99.0 | 99.0 | 24.7 | 99.0 | ||||
| 91* | 150.4890 | +1.6883 | 25.1 | 26.3 | 28.0 | 26.8 | 24.6 | 29.7 | ||||
| 92* | 150.4984 | +2.8138 | 25.0 | 27.5 | 99.0 | 99.0 | 24.7 | 99.0 | ||||
| 93* | 150.5114 | +2.7640 | 25.0 | 27.4 | 99.0 | 99.0 | 24.9 | 99.0 | ||||
| 94* | 150.5131 | +1.6066 | 25.0 | 26.6 | 28.2 | 27.1 | 24.8 | 27.1 | ||||
| 95* | 150.5362 | +2.0874 | 24.9 | 27.0 | 27.2 | 27.1 | 24.7 | 26.9 | ||||
| 96* | 150.5367 | +1.9125 | 24.5 | 26.5 | 26.1 | 26.3 | 24.1 | 25.5 | ||||
| 97* | 150.5543 | +2.8230 | 24.7 | 26.8 | 26.1 | 26.4 | 24.4 | 25.6 | ||||
| 98* | 150.5677 | +2.5774 | 24.2 | 26.2 | 25.5 | 25.9 | 24.0 | 25.5 | ||||
| 99* | 150.5711 | +2.3625 | 24.9 | 26.1 | 26.3 | 26.2 | 24.6 | 26.1 | ||||
| 100* | 150.5773 | +1.6153 | 25.1 | 27.3 | 27.5 | 27.4 | 24.8 | 26.3 | ||||
| 101* | 150.6079 | +2.4935 | 25.0 | 28.2 | 99.0 | 99.0 | 24.8 | 99.0 | ||||
| 102* | 150.6386 | +2.3956 | 25.1 | 27.1 | 26.7 | 26.9 | 24.7 | 26.0 | ||||
| 103 | 150.6596 | +2.6453 | 24.7 | 27.5 | 26.6 | 27.1 | 24.4 | 26.1 | ||||
| 104 | 150.6806 | +2.7643 | 23.9 | 26.1 | 26.7 | 26.3 | 23.7 | 26.2 | ||||
| 105* | 150.6927 | +1.8712 | 25.1 | 99.0 | 99.0 | 99.0 | 25.1 | 99.0 | ||||
| 106* | 150.7034 | +2.7397 | 25.0 | 27.5 | 99.0 | 99.0 | 24.7 | 99.0 | ||||
| 107* | 150.7111 | +2.2247 | 24.8 | 27.0 | 27.2 | 27.1 | 24.6 | 27.7 | ||||
| 108* | 150.7150 | +2.2342 | 24.4 | 26.8 | 26.8 | 26.8 | 24.2 | 26.1 | ||||
| 109* | 150.7475 | +2.8532 | 24.6 | 26.8 | 25.8 | 26.2 | 24.3 | 25.3 | ||||
| 110* | 150.7548 | +2.0434 | 24.6 | 26.6 | 25.1 | 25.7 | 24.3 | 24.7 | ||||
| 111* | 150.7576 | +1.8365 | 24.4 | 25.8 | 25.1 | 25.4 | 23.9 | 24.3 | ||||
| 112* | 150.7722 | +1.8614 | 25.1 | 27.3 | 26.5 | 26.9 | 24.6 | 26.0 | ||||
| 113* | 150.7747 | +2.1644 | 24.9 | 26.1 | 99.0 | 99.0 | 24.6 | 99.0 | ||||
| 114* | 150.7756 | +1.7953 | 24.3 | 27.0 | 99.0 | 99.0 | 24.0 | 99.0 | ||||
| 115* | 150.7863 | +2.6448 | 23.7 | 25.4 | 25.2 | 25.3 | 23.4 | 24.6 | ||||
| 116* | 150.7906 | +2.2222 | 25.0 | 26.8 | 26.2 | 26.5 | 24.7 | 25.4 | ||||
| 117 | 150.8054 | +2.9250 | 24.5 | 25.8 | 25.1 | 25.4 | 24.1 | 24.8 | ||||
| 118* | 150.8211 | +2.2498 | 24.0 | 26.0 | 25.8 | 25.9 | 23.6 | 25.5 | ||||
| 119 | 150.8342 | +2.3398 | 25.0 | 27.0 | 26.4 | 26.7 | 24.5 | 25.2 |
| No.aaAsterisks denote the statistical sample. | bbErrors and lower-limits represent 1 significance. | bbErrors and lower-limits represent 1 significance. | (Ly)bbErrors and lower-limits represent 1 significance. | b,cb,cfootnotemark: | (UV)bbErrors and lower-limits represent 1 significance. | bbErrors and lower-limits represent 1 significance. |
|---|---|---|---|---|---|---|
| (Å) | ( ergs s-1) | ( yr-1) | ( ergs s-1 Hz-1) | ( yr-1) | ||
| 1* | ||||||
| 2* | ||||||
| 3* | ||||||
| 4* | ||||||
| 5* | ||||||
| 6* | ||||||
| 7* | ||||||
| 8* | ||||||
| 9* | ||||||
| 10* | ||||||
| 11 | ||||||
| 12* | ||||||
| 13* | ||||||
| 14* | ||||||
| 15* | ||||||
| 16* | ||||||
| 17* | ||||||
| 18* | ||||||
| 19* | ||||||
| 20* | ||||||
| 21* | ||||||
| 22 | ||||||
| 23* | ||||||
| 24* | ||||||
| 25* | ||||||
| 26* | ||||||
| 27* | ||||||
| 28* | ||||||
| 29* | ||||||
| 30* | ||||||
| 31* | ||||||
| 32 | ||||||
| 33* | ||||||
| 34* | ||||||
| 35* | ||||||
| 36* | ||||||
| 37* | ||||||
| 38* | ||||||
| 39* | ||||||
| 40* | ||||||
| 41* | ||||||
| 42* | ||||||
| 43* | ||||||
| 44* | ||||||
| 45* | ||||||
| 46* | ||||||
| 47* | ||||||
| 48* | ||||||
| 49* | ||||||
| 50* | ||||||
| 51* | ||||||
| 52* | ||||||
| 53* | ||||||
| 54* | ||||||
| 55* | ||||||
| 56* | ||||||
| 57* | ||||||
| 58* | ||||||
| 59* | ||||||
| 60* | ||||||
| 61* | ||||||
| 62* | ||||||
| 63* | ||||||
| 64* | ||||||
| 65* | ||||||
| 66* | ||||||
| 67* | ||||||
| 68* | ||||||
| 69* | ||||||
| 70 | ||||||
| 71* | ||||||
| 72* | ||||||
| 73* | ||||||
| 74* | ||||||
| 75* | ||||||
| 76* | ||||||
| 77* | ||||||
| 78* | ||||||
| 79* | ||||||
| 80* | ||||||
| 81* | ||||||
| 82* | ||||||
| 83* | ||||||
| 84* | ||||||
| 85* | ||||||
| 86* | ||||||
| 87* | ||||||
| 88* | ||||||
| 89* | ||||||
| 90* | ||||||
| 91* | ||||||
| 92* | ||||||
| 93* | ||||||
| 94* | ||||||
| 95* | ||||||
| 96* | ||||||
| 97* | ||||||
| 98* | ||||||
| 99* | ||||||
| 100* | ||||||
| 101* | ||||||
| 102* | ||||||
| 103 | ||||||
| 104 | ||||||
| 105* | ||||||
| 106* | ||||||
| 107* | ||||||
| 108* | ||||||
| 109* | ||||||
| 110* | ||||||
| 111* | ||||||
| 112* | ||||||
| 113* | ||||||
| 114* | ||||||
| 115* | ||||||
| 116* | ||||||
| 117 | ||||||
| 118* | ||||||
| 119 |
![[Uncaptioned image]](/html/astro-ph/0702458/assets/x3.png)
Fig. 2. — continued.
![[Uncaptioned image]](/html/astro-ph/0702458/assets/x4.png)
Fig. 2. — continued.
![[Uncaptioned image]](/html/astro-ph/0702458/assets/x5.png)
Fig. 2. — continued.
![[Uncaptioned image]](/html/astro-ph/0702458/assets/x6.png)
Fig. 2. — continued.
![[Uncaptioned image]](/html/astro-ph/0702458/assets/x7.png)
Fig. 2. — continued.
![[Uncaptioned image]](/html/astro-ph/0702458/assets/x8.png)
Fig. 2. — continued.
![[Uncaptioned image]](/html/astro-ph/0702458/assets/x9.png)
Fig. 2. — continued.
![[Uncaptioned image]](/html/astro-ph/0702458/assets/x10.png)
Fig. 2. — continued.
![[Uncaptioned image]](/html/astro-ph/0702458/assets/x11.png)
Fig. 2. — continued.
![[Uncaptioned image]](/html/astro-ph/0702458/assets/x12.png)
Fig. 2. — continued.
![[Uncaptioned image]](/html/astro-ph/0702458/assets/x13.png)
Fig. 2. — continued.