Breaking the hierarchy of galaxy formation
Abstract
Recent observations of the distant Universe suggest that much of the stellar mass of bright galaxies was already in place at . This presents a challenge for models of galaxy formation because massive halos are assembled late in the hierarchical clustering process intrinsic to the cold dark matter (CDM) cosmology. In this paper, we discuss a new implementation of the Durham semi-analytic model of galaxy formation in which feedback due to active galactic nuclei (AGN) is assumed to quench cooling flows in massive halos. This mechanism naturally creates a break in the local galaxy luminosity function at bright magnitudes. The model is implemented within the Millennium N-body simulation. The accurate dark matter merger trees and large number of realisations of the galaxy formation process enabled by this simulation result in highly accurate statistics. After adjusting the values of the physical parameters in the model by reference to the properties of the local galaxy population, we investigate the evolution of the K-band luminosity and galaxy stellar mass functions. We calculate the volume-averaged star formation rate density of the Universe as a function of redshift and the way in which this is apportioned amongst galaxies of different mass. The model robustly predicts a substantial population of massive galaxies out to redshift and a star formation rate density which rises at least out to in objects of all masses. Although observational data on these properties have been cited as evidence for “anti-hierarchical” galaxy formation, we find that when AGN feedback is taken into account, the fundamentally hierarchical CDM model provides a very good match to these observations.
1 Introduction
The most basic property of the galaxy population is the number density of galaxies of different luminosity – the luminosity function. Simple scaling arguments suggested that the observed break in the luminosity function at bright magnitudes would naturally arise from the long cooling time of gas in large halos (Binney 1977; Rees & Ostriker 1977; Silk 1977; White & Rees 1978). Semi-analytic models of galaxy formation in the CDM cosmology initially seemed to lend substance to this view (White & Frenk 1991, Kauffmann et al. 1993, Cole et al. 1993, 2000; Somerville & Primack 1999). However, these models assumed a low value of the mean baryon density in the Universe, , which has now been ruled out by better determinations. These indicate values twice as large (Spergel et al. 2003, 2006, Cuoco et al. 2004, Sanchez et al. 2006). Benson et al. (2003) explicitly showed that in a cold dark matter universe with such a high baryonic content, the cooling time argument alone is insufficient to explain the characteristic size of present-day galaxies, the sharpness of the break in the local galaxy luminosity function and the relatively low observed number of very bright galaxies.
Recent measurements of stellar mass reveal a substantial population of large galaxies at and beyond (Drory et al. 2003, 2005, Pozzetti et al. 2003, Kodama et al. 2004, Fontana et al. 2004, Bundy et al. 2005). Semi-analytic models that match the luminosity function at reasonably well often predict far fewer large galaxies at high redshift than is observed (Baugh et al. 1998, 2004; Somerville, Primack & Faber 2001); on the other hand, models that give a better match to the abundance of high redshift massive galaxies have typically failed to give good matches to the shape of the luminsoity function locally (Kauffmann et al. 1999a, 1999b). In spite of large uncertainties, observations also suggest that the star formation rate in massive galaxies was larger at high redshift than it is in the local Universe (Cowie et al. 1996, Juneau et al. 2005). These observations are contrary to naive expectations for the hierarchical growth of structure in a CDM universe in which large halos form late by the coalescence of smaller ones. Observational astronomers have highlighted this apparent contradiction by coining phrases such as “cosmic downsizing” (Cowie et al. 1996) or “anti-hierarchical galaxy formation.”
In this paper, we consider not only the conundrum of the galaxy luminosity function and its evolution, but also two closely related problems. The first is the observation that the most massive galaxies today tend to be old and red, not young and blue as naively expected in a hierarchical model. The second is the apparent absence of cooling flows at the centres of rich clusters where the cooling times are sufficiently short that large amounts of gas ought to be cooling but very little is observed to do so (Tamura et al. 2001, Peterson et al. 2003). In simple galaxy formation models it is this seemingly missing cooling gas that results in the formation of the unobserved population of extremely massive, blue galaxies. These are all facets of the same problem and, in this paper, we argue that they all stem from the neglect of a key phenomenon whose importance for galaxy formation has only recently been recognised: the impact of the formation of supermassive black holes at the centres of galaxies. Granato et al. (2004) and Croton et al. (2006) have proposed models of galaxy formation that include this phenomenon. The work of Croton et al. in particular explicitly shows how these three intertwined problems can be solved in the CDM cosmology by taking into account the heating of gas in massive halos by energy injected by active galactic nuclei. De Lucia et al. (2005) show further how this same model naturally accounts for the apparently anti-hierarchical nature of the star formation history of massive ellipticals. Our work has many aspects in common with that of Croton et al. but our model is different from theirs (particularly the treatment of feedback from AGN) and, in this paper, we focus on its application to the high redshift Universe 111While Croton et al., Springel et al. (2005a) and De Lucia et al. (2005) present a number of results on the high redshift Universe, they do not focus on the evolution of the mass and luminosity functions..
The shape of the mass function of dark matter halos is very different from the shape of the galaxy luminosity function (see Fig. 1 in Benson et al. 2003). In its most basic form, a theory of galaxy formation may be seen as a set of physical processes that transform the halo mass function into the galaxy luminosity function, that is, as a model for populating halos of different mass with galaxies. The most powerful methodology to achieve this is semi-analytic modelling, a technique that has revolutionised our way of understanding galaxy formation. The key components are a background cosmology (e.g. the CDM model) which determines the formation and merger histories of dark matter halos; the cooling of gas in halos; the formation of stars from cooled gas and feedback processes that couple gas heating to the efficiency of star formation. In their 15 years of existence, semi-analytic models have met with many successes (e.g. White & Frenk 1991, Kauffmann et al. 1993, 1999a, 1999b, Cole et al. 1994, 2000; Somerville & Primack 1999, Somerville et al. 20001, Menci et al. 2005, Baugh et al. 2005; and references therein). Yet, a number of fundamental challenges remain, notably the problems just discussed.
The Durham semi-analytic model laid out in Cole et al. (2000; see also Benson et al. 2002 and Baugh et al. 2005) was applied to the problem of the galaxy luminosity function by Benson et al. (2003), adopting consistent with recent determinations. If no feedback processes are included, the halo mass function is much steeper at the low mass end than the galaxy luminosity function is at the low luminosity end. In Benson et al. (2003) we showed that plausible feedback processes (photoionization of pre-galactic gas at high redshift and energy injection from supernovae and stellar winds) would make galaxy formation sufficiently inefficient in small halos to account for the relative paucity of low luminosity galaxies. However, solving the faint-end problem in this way gave rise to a problem at the bright end: the reheated leftover gas would eventually cool in massive halos giving rise to an excessive number of bright galaxies. We considered two plausible processes that could, in principle, prevent this from happening: heat conduction near the centre of massive halos and superwinds that would eject gas from these halos. Unfortunately, neither of these solutions proved completely satisfactory. To be effective, conduction would need to be implausibly efficient, while supernovae do not generate enough energy to power the required superwinds. We concluded that solving the bright-end problem would involve tapping the energy released by accretion onto black holes.
The mechanism that prevents the formation of extremely bright galaxies in massive halos is almost certainly the same mechanism that prevents cooling flows in clusters. An idea that has gained popularity in recent years is that energy injected from AGN in the form of radio jets is responsible for switching off cooling at the centre of massive halos (Quilis et al. 2001; Bruggen & Kaiser 2002; Churazov et al. 2002; Dalla Vecchia et al. 2004, Sijacki & Springel 2006). At the same time, a number of recent papers have considered the impact of AGN energy on galaxy formation (e.g. Silk & Rees 1998; Kauffmann & Haehnelt 2000; Granato et al. 2004; Monaco & Fontanot 2005, Cattaneo et al 2005; Croton et al. 2006, De Lucia et al. 2005) although only Croton et al. have calculated the resulting galaxy luminosity function222Granato et al. (2004) also computed a luminosity function, but this was for high redshifts, and only included the spheroidal component of galaxies.. As emphasised by them and also previously, amongst others, by White & Frenk (1991), Benson et al. (2003), and Binney (2004), the sharp break at the bright end of the luminosity function suggests a preferred physical scale in the problem. Such a scale arises naturally from the interplay between two timescales: the timescale for a parcel of gas to cool and the timescale for it to free fall to the centre of the halo. For halo masses below , cooling is faster than the free-fall rate, but in larger halos the cooling timescale exceeds the sound crossing time and the cooling material is always close to hydrostatic equilibrium. The transition between the rapidly cooling and the hydrostatic regimes provides the physical basis for understanding the sharp break in the galaxy luminosity function. Binney (2004) argued that heat input from a central source can only effectively prevent cooling in the hydrostatic case and Croton et al. explicitly constructed a model demonstrating how this process can explain the galaxy luminosity function.
In this paper, we include AGN feedback in the Durham semi-analytic galaxy formation model, galform, using the physical model just described. The motivation for our treatment is similar to that of Croton et al. (2006), but our implementation differs in key respects. In particular, Croton et al. parametrised the injection of AGN energy as a semi-empirical function of the black hole and dark halo masses. In contrast, our model assumes that the AGN energy injection is determined by a self-regulating feedback loop. The black hole mass only enters through the Eddington limit on the available power. The power produced by the AGN does not depend on the mass of the dark matter halo explicitly since this only enters through the cooling luminosity of the cooling flow. Like Croton et al., we implement our semi-analytic model on the Millennium simulation of the growth of dark matter structure in the CDM cosmology recently carried out by the Virgo Consortium (Springel et al. 2005a). In this way, we generate an alternative galaxy catalogue to that of Croton et al. which is available at http://www.icc.dur.ac.uk/.
Our feedback prescription results in a model that provides a good description of many observed properties of the local galaxy population. In particular, it produces a good match to the luminosity function and the distribution of colours. However, the successes of this model go beyond the properties of the local Universe. We find that the model also successfully explains the evolution of the galaxy stellar mass function out to and greater and that it provides a natural explanation for the “anti-hierarchical” behaviour championed by observational astronomers.
The model presented here differs in important ways from that of Baugh et al. (2005) who calculated a model without AGN feedback and found that, in that case, a top-heavy stellar initial mass function (IMF) in bursts seemed to be required in order to reproduce the observed numbers of “sub-millimeter” and “Lyman-break” galaxies. Using this model, Nagashima et al. (2005a,b) argued that the observed chemical enrichment of the intracluster gas and of elliptical galaxies is consistent with such a top-heavy IMF. In this paper, we adopt a standard IMF throughout, but in future papers we plan to investigate the impact of AGN on these issues.
The remainder of the paper is structured as follows. In §2, we outline the differences between the present model and earlier versions of galform. In §3, we briefly describe how we have adjusted the parameters of the new model and present an overview of the comparison with galaxy properties in the local Universe. In §4, we fix this parametrisation and examine the predicted properties of galaxies at higher redshift. In §5, we turn our attention to the volume averaged star formation history of the Universe, focusing in particular on how this is apportioned amongst galaxies of different mass. We summarise our results in §6. Throughout the paper, we adopt the cosmological model assumed in the Millennium simulation: a flat universe in which the density of cold dark matter, baryons and dark energy (in units of the critical density), have the values , and respectively, the Hubble parameter is , the power spectrum normalisation is and the primordial spectral index is . (We quote our results in terms of the Hubble variable .)
2 A new galaxy formation model
The basic model that we use, galform, is described in detail by Cole et al. (2000) and Benson et al. (2003), and follows the fundamental principles outlined by White & Frenk (1991). We have extended the model to track explicitly the evolution of AGN and the impact of the energy emitted by AGN on the cooling of gas in the host halo. The revised model also incorporates a better treatment of the gas reheated by star formation activity, allowing this material to mix with an existing hot gas atmosphere and participate in any ongoing cooling.
The starting point for our new model is the implementation described by Benson et al. (2003) (not the version by Baugh et al. 2005 in which a top-heavy stellar initial mass function was assumed in starbursts). The substantial changes in parameters relative to that model are an increase in the strength of feedback from supernovae (see §3), a slightly longer timescale for star formation in galactic disks () and an increase in the dynamical friction timescale333The reader is referred to Cole et al. (2000) for equations defining the model parameters discussed in the text. The parameter is defined in eqn. 4.16., . We intend to present a full examination of the effects of parameter variations on our model in a future paper. We adopt a Kennicutt (1983) IMF with no correction for brown dwarf stars (ie., in the language of Cole et al. 2000).
Our model follows Benson et al. (2003) in including a simple prescription for the effects of the reionization of the Universe on the formation of galaxies. In this approximation, we assume that gas cooling is completely suppressed in dark matter halos with virial velocities below at redshifts below . This treatment of photoheating is a simple parametrisation of the results of the detailed model calculated by Benson et al. (2002). These authors computed the thermal history of the IGM and calculated the filtering mass defined by Gnedin (2000) as the mass of the halo which, because of photoheating, accretes only 50% of the gas it would have accreted from a cold IGM. Benson et al. (2002) find that the virial velocity corresponding to the filtering mass lies between 50 and between redshifts 0 and 6 and drops rapidly for higher redshifts. Our simple model thus captures the overall behaviour of the more detailed model and, as shown by Benson et al. (2003), it gives very similar results.
Besides these parameter changes the main enhancements in our current calculation relative to Benson et al. (2003) are:
-
1.
Formation and growth of black holes. Our model of black hole formation is described in detail by Malbon et al. (2006), where we explore the properties of AGN emission and its evolution. It is based on the model of Kauffmann & Haehnelt (2000). In brief, black holes are assumed to grow through gas accretion triggered by galaxy mergers and disk instabilities as well as through mergers with other black holes. The growth rate is set by an efficiency parameter, , defined as the ratio of the gas mass accreted onto the black hole to that formed into stars during a starburst induced either by a merger or by a disk instability. In addition, we allow for black hole growth during the feedback phase (see below). The results below correspond to . This value was chosen to match the normalisation of the observed relation between black hole mass and galaxy bulge mass.
-
2.
Disk instability. This process was briefly discussed by Mo, Mao & White (1998) and by Cole et al. (2000). If a disk becomes sufficiently massive that its self-gravity is dominant, then it is unstable to small perturbations by minor satellites or dark matter substructures. We find that this process plays an important role in the growth of black holes in the Millennium simulation in which low mass companions are not resolved. We follow Cole et al. (2000) and use as the stability criterion the quantity
(1) where is the circular velocity at the disk half-mass radius, , and is the disk mass. If, at any timestep, is less than , the disk is considered to be unstable. The entire mass of the disk is then transferred to the galaxy bulge, with any gas present assumed to undergo a starburst.
When a bulge is formed in this way, we compute its size using energy conservation arguments as described by Cole et al. (2000). We have, however, made an improvement in the way in which we determine the size of a disk that becomes unstable. Cole et al. (2000) assumed that disks shrink to a size at which they become rotationally supported and then estimated their total energy at this size. We find that this method can occasionally produce disks of very small size and very high circular velocity (several times that of the host halo). As a result, spheroids formed from such disks are also unrealistically small. These disks have low angular momentum and have been forced to become almost entirely self-gravitating in order to be rotationally supported. They are therefore very unstable, with well below . A more realistic approach is to assume that the disk shrinks only until it first becomes unstable (as judged by the above criteria) at which time a spheroid is formed. This ensures that unstable disks have reasonable sizes and circular velocities. Therefore, for any disk deemed to be unstable, we find the largest radius at which the disk would first become unstable and compute its energy based on that radius.
As described above, when a disk becomes unstable, a fraction of the gas goes into feeding the central black hole. We consider values of (Efstathiou, Lake & Negroponte 1982).
-
3.
Improved cooling calculation. To calculate the amount of gas that cools in a halo, Cole et al. (2000) chopped the merger trees of halos up into branches defined by the time it takes for a halo to double its mass. The propagation of the cooling radius (defined as the radius within which the cooling time of the gas equals the current age of the halo) is tracked during these segments, but gas accreted from the intergalactic medium or through infalling halos during the lifetime of the halo, or gas returned to the halo by stellar feedback, was not allowed to cool until the start of the next segment.
We have improved our cooling calculation by allowing for cooling of material accreted by the halo during the current segment as well as material reheated from galaxies by stellar feedback. This new calculation explicitly transfers reheated gas back to the reservoir of hot gas on a timescale comparable to the halo’s dynamical timescale. We define and, over a timestep , increment the mass available for cooling by , where we have included a parameter to modulate this timescale, anticipating .
The model implicitly assumes that the gas in a halo is shock-heated during collapse to the virial temperature before it begins to cool. Birnboim & Dekel (2003)and Kereš et al. (2005) have argued that this is not realistic for galactic-sized halos in which gas cooling may be so rapid that an initial shock may not form (see also Navarro & White 1993, Kay et al. 2000). As White & Frenk (1991) pointed out and Croton et al. (2006) have discussed in detail, the propagation of the nominal cooling radius is so fast in these halos (much faster than the halo dynamical time), that the supply of gas from the halo is limited by the free-fall time and the halo’s gas accretion rate. The cooling time is irrelevant in small halos.
It is useful to distinguish between cooling that occurs on a free-fall timescale and cooling that occurs from a quasistatic hot atmosphere. Following the methodology of Cole et al. (2000), we compute the evolution of the cooling radius and the free-fall radius as a function of halo age. If the free-fall radius is significantly smaller than the cooling radius, gas is accreted on a free-fall timescale. Conversely, if the free-fall radius is significantly larger than the cooling radius, cooling occurs in a quasi-hydrostatic cooling flow.
-
4.
AGN Feedback. We assume that AGN feedback is effective only in halos undergoing quasi-hydrostatic cooling. Only in this situation do we expect energy input from a central energy source to be able to stabilise the flow and regulate the cooling rate. To establish which halos are susceptible to this kind of feedback, we compare the cooling time at the cooling radius (, which is equal to the age of the halo) with the free-fall time at this radius. If
(2) (where is an adjustable tuning parameter) we examine whether the central AGN is able to inject sufficient power to offset the energy being radiated away in the cooling flow. If the available AGN power is greater than the cooling luminosity, we assume that the cooling flow is indeed quenched. We parametrise the available AGN power as a fraction, , of the Eddington luminosity of the central galaxy’s black hole so that a halo is prevented from cooling if:
(3) Croton et al. (2006) also assumed that AGN feedback operates in quasi-hydrostatically cooling halos (their “radio” mode). Unlike their scheme, however, our model for AGN feedback does not assume a phenomenological dependence of the strength of the feedback on the gas temperature or black hole mass. Instead, we simply assume that the flow will adjust itself so as to balance heating and cooling whenever the Eddington luminosity of the black hole is sufficiently large. A model is deemed acceptable if and . Note that although the Eddington luminosity provides a useful measure of the energy scale, the jet power can, in principle, exceed this limit since the outflow is strongly beamed. In practise, however, we find that it is unnecessary to make this large.
During this feedback phase, the mass of the black hole grows as a result of accretion from the quiescent inflow of gas cooling from the halo’s hot atmosphere. We assume that jets are efficiently powered with the black hole mass growing as (ie., the jet extracts half the available accretion energy in the case of a rapidly spinning black hole). This growth channel, however, is relatively unimportant until late times. In our model, black holes gain most of their mass when they accrete gas funnelled to the galactic centre during disk instabilities. Adopting a lower accretion efficiencies results in a larger contribution to the black hole mass density from this form of feedback but has very little effect on galaxy properties.
-
5.
N-body merger trees. We have implemented our new model on merger trees constructed from the Millennium simulation using similar techniques to those described by Helly et al. (2003). The Millennium simulation, carried out by the Virgo consortium and described by Springel et al. (2005a), followed the evolution of 10 billion dark matter particles in a cubic volume of side . The particle mass is so that about 20 million halos with more than 20 particles form in the simulation. We take care to treat halos close to the resolution limit (and those affected by the halo deblending algorithm) correctly and, in particular, we ensure that their chemical history is consistent with higher resolution trees. The smallest resolved halos typically host galaxies with luminosities less than around 0.03. Our sample of model galaxies is therefore complete for luminosities brighter than this value.
The properties of our merger trees have been described by Harker et al. (2006). These were constructed independently of the trees presented by Springel et al. (2005a) which were used by Croton et al (2006). The two sets of trees differ in several respects most notably in the criteria used for separating halos spuriously linked by the group finder, in the definition of independent halos, and in the way in which the descendants of halos are identified at subsequent times.
3 The Local Universe
In keeping with the philosophy advocated by the Durham semi-analytic modelling group, we require that any acceptable model should match basic properties of the local galaxy population, particularly the galaxy luminosity function. We fix the adjustable parameters of our model to achieve this. In this application, we also require that the model should match the observed relationship between black hole mass and galaxy bulge mass. This is important since we find that AGN feedback plays an important role in shaping the local luminosity function.
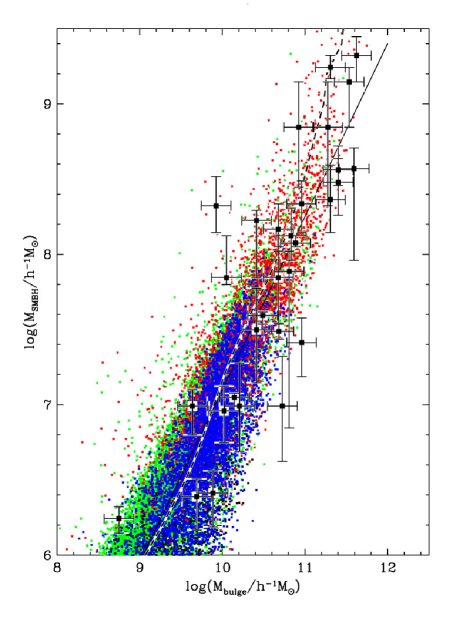
The recent observational determination of the present-day black hole-bulge mass relation by Haering & Rix (2004) is illustrated in Fig. 1. The symbols with error bars show the observational data, with the best-fit from that paper shown as a black line. Our model was adjusted to match this relation by varying both the level at which disks become unstable () and the fraction of the cold gas mass that is fed to the black hole during a starburst (). Some iteration was required to obtain an acceptable model since the growth of black holes and bulges depends on other parameters of the model. Setting and achieves the match shown in Fig. 1. This value of is reasonably close to the value of 1.1 for the stability threshold found by Efstathiou et al. (1982) (who, however, used slightly different definitions of the quantities that enter into eqn. 1), but results in a somewhat larger fraction of disks becoming unstable. It is interesting to note that the model black hole-bulge mass relation steepens at high bulge masses. This is a result of the growth of the black hole during the feedback phase. This steepening ensures that the Eddington luminosity of the black hole is sufficient to quench cooling even in the most massive clusters.
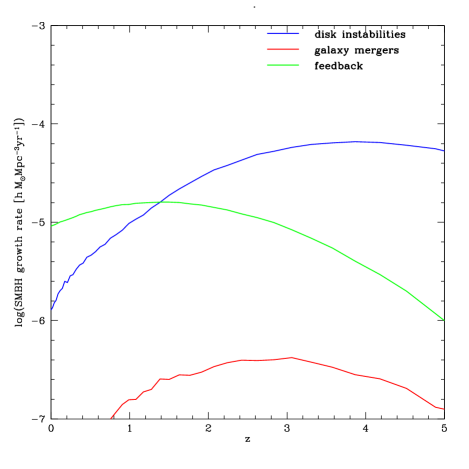
The relative importance of the different channels that lead to the growth of black hole mass is illustrated in Fig. 2. The colour lines represent different black hole growth mechanisms. Because of the limited mass resolution of the Millennium simulation, we can only follow mergers of relatively massive satellites (mass ratios greater than 0.1). Central gas flows triggered by mergers therefore play a relatively minor role in the build-up of black holes. At high redshift, black hole growth is dominated by instabilities in rapidly forming “disks”, while at lower redshift it is dominated by the mass accreted during the feedback cycle that quenches cooling in massive halos.
Accounting for the sharp cutoff at the bright end of the luminosity function has proved challenging for previous semi-analytic models, particularly if the baryon density is as large as implied by modern determinations (Benson et al. 2003). In our new model, four key parameters control the shape of the luminosity function: , , and . The first two are the parameters introduced by Cole et al. (2000) to describe the conventional feedback produced by energy injected by supernovae and stellar winds. They essentially determine the faint end slope of the luminosity function.
The new parameter associated with AGN feedback, (which controls when a halo is considered to be cooling quasi-hydrostatically as defined in eqn. 2), determines the position of the exponential break in the galaxy luminosity function. Increasing shifts the break to lower luminosities. Finally, the overall normalisation of the luminosity function is strongly affected by the parameter that determines the timescale on which reheated disk gas is added to the hot gas reservoir.
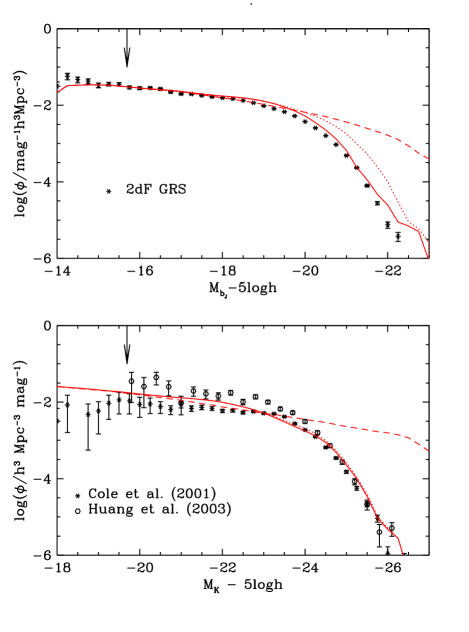
The models presented here have , , , and . For this choice, the model gives an excellent match to the local and K-band galaxy luminosity functions, as shown in Fig. 3. (The dashed lines in this figure show the luminosity function when feedback from AGN is switched off. The match to the observational data is then very poor, due in part to the large value of . Benson et al. (2003) and Baugh et al. (2005) were able to obtain better matches to the luminosity function—albeit not as good as in our model including AGN feedback—through the inclusion of alternative means of suppressing gas cooling in massive halos.)
The values of and that we have adopted are somewhat larger than the values used in our previous work and imply that stellar feedback is extremely strong, especially in small galaxies. As a result, the energy involved in feedback (i.e. the energy required to heat cold disk gas to the halo virial temperature) is equal to the total energy produced by supernovae in galaxies with and exceeds the available supernovae energy by in lower mass galaxies. It should be noted, however, that our model does not make use of any of the available AGN energy to eject material from the galaxy itself. Numerical simulations of merging galaxies with central supermassive black holes indicate that this can be a significant source of additional feedback even though the outflow is strongly beamed (Di Matteo et al. 2005, Springel et al. 2005b). We also require that the material be heated to the virial temperature of the halo. Both of these assumptions are likely to lead to an overestimate of the energy injection that is required. In addition, the values of these feedback parameters should be treated with caution since our model of star formation is undoubtedly simplified. We intend to present a more detailed investigation of the star formation and cooling model in future work.
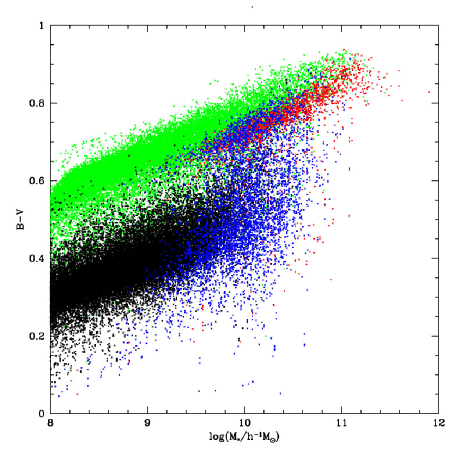
Fig. 3 shows how AGN feedback can solve one of the two problems highlighted in the Introduction: the absence of the very bright galaxies that unquenched cooling flows would generate at the centres of very massive halos. Fig. 4 shows how our model solves the second problem: the red colours observed for the most massive observed galaxies. The colour distribution in the model is clearly bimodal (c.f. Menci et al. 2005) and shows a very well defined red sequence which, at the red end, is populated by the most massive galaxies. The transition in mean colour occurs at around a mass of . Our model gives a qualitatively good match to observational data ( Kauffmann et al. 2003, Baldry et al. 2004).
The colour distribution displayed in Fig. 4 is influenced strongly both by AGN feedback and by the improvements to our cooling model which now allows reheated disk gas to be added to a surrounding hot reservoir during the lifetime of a halo. This tends to establish a near steady state in which gas cooling is balanced by reheating. Below a halo mass of , the colours of central galaxies follow a well-defined blue locus. Satellite galaxies that have been stripped of their hot gas reservoirs rapidly migrate to the red sequence. For higher halo masses, the AGN feedback becomes important, and central galaxies also evolve onto the red sequence. This process is responsible for the abrupt change in galaxy properties at a stellar mass of discussed by Kauffmann et al. (2003).
4 The Distant Universe
Galaxy formation models in the CDM cosmology have consistently had difficulty in simultaneously accounting for the present day galaxy luminosity function and for the number of apparently massive galaxies observed at redshifts – (Pozzetti et al. 2003; Drory et al. 2003, 2005, Kodama et al. 2004, Fontana et al. 2004). Thus, for example, the models of Kauffmann et al (1999b) produced a large number of high redshift galaxies but they also produced an excess of bright galaxies and a deficit of galaxies locally (Kauffmann et al 1999a). Conversely, the models of Cole et al. (2000) and Baugh et al. (2004) gave a better match for the local galaxy luminosity function but underpredicted the number of galaxies at –. At higher redshift still, , Baugh et al. (2005) have shown that the abundance of submillimeter and Lyman-break galaxies can be explained by the standard semi-analytic model of Benson et al. (2003) only if the bursts of star formation triggered by mergers are assumed to have a “top-heavy” stellar initial mass function (IMF). In this paper we explore how the inclusion of AGN feedback alters the predictions of the model for the evolution of the stellar mass function in galaxies. We defer a detailed study of the properties of the submillimeter and Lyman-break population to a later paper.
As in previous papers in this series, we have set the parameters of the model to match a selection of global properties of the local galaxy population. We now proceed to compare this model with the high redshift Universe without any further adjustments to the parameters. The most direct way to test whether the model predicts the correct distribution of stellar mass in galaxies at high redshift is to compare with observations of the rest-frame K-band luminosity function. The K-band light is relatively insensitive to the instantaneous star formation rate and thus provides a reasonable tracer of the underlying stellar mass (Kauffmann & Charlot 1998). Alternatively, the model predictions can be compared with the result of attempts to estimate the stellar mass directly by combining K-band data with photometry in bluer bands. This diagnostic uses fuller information about the spectral energy distribution, but it has the disadvantage that the inferred stellar masses are model dependent and require assumptions for the stellar IMF and star formation history. However, this technique can be applied to galaxies at high redshift for which only photometric data and photometric redshifts are available.
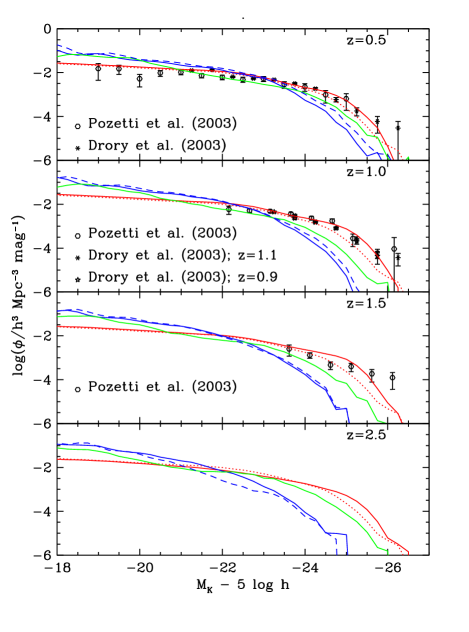
The comparison between our model predictions and the measured K-band luminosity function at high redshift is shown in Fig. 5. The measurements from the K20 survey (Pozzetti et al. 2003) are at and whereas the measurements from the MUNICS survey (Drory et al. 2003) are at redshifts and . The model predicts a slight brightening of the characteristic luminosity, , with increasing redshift of very similar size to the brightening seen in the real data. Both model and data indicate that there is a population of galaxies at which are luminous in the rest-frame near infrared and therefore contain substantial stellar mass. This is the first time that a semi-analytic model in the CDM cosmology which gives a close match the local galaxy luminosity function has provided such good agreement with data of this kind. For example, we show the rest-frame K-band luminosity functions from the models of Cole et al. (2000) and Baugh et al. (2005) in Fig. 5. These models reproduce the K-band luminosity function reasonably well, but the luminosity function evolves too fast with redshift and underpredicts the abundance of galaxies bright in K at high redshifts444Other attempts to reproduce the evolution of the K-band luminosity function fail in a similar way—see the models plotted in Fig. 10 of Pozzetti et al. (2003) for example.. We discuss the physical reason for this agreement in Section 6.
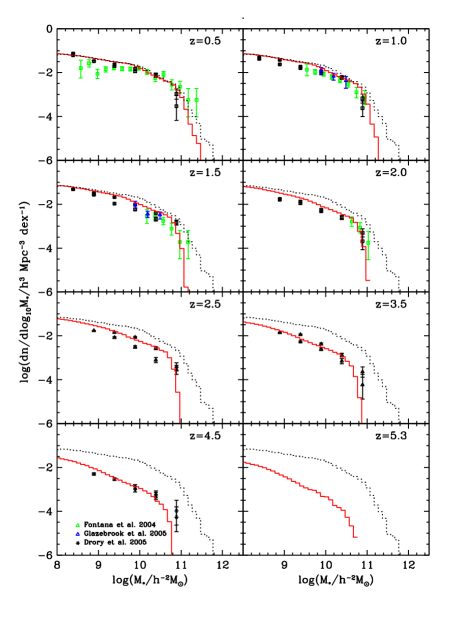
Testing the model at redshifts is complicated by the difficulty of measuring the rest-frame K-band luminosity directly. At these redshifts, the rest-frame K-band is shifted well outside the near-IR ground-based observing window. In addition, spectroscopic redshifts become progressively harder to determine. To try and overcome these difficulties Drory et al. (2003, 2005) have applied photometric techniques to determine both the redshift of the best fitting template of the spectral energy distribution of a galaxy as well as its total stellar mass. Since the inference of the stellar mass requires an assumption about the IMF, to compare the data with our model, we have transformed the data to the Kennicutt (1983) IMF assumed in our model (eg., we adopt a correction of dex to convert results given for the Salpeter IMF to the IMF assumed here, Bell et al. 2003). Drory et al. (2005) analysed two deep fields: the FORS deep field, and the GOODS-S field. Their stellar mass functions for the two fields, transformed to our IMF, are plotted separately in Fig. 6. The stellar masses plotted exclude the mass recycled to the interstellar medium. The two surveyed fields are small and field-to-field variations are clearly noticeable. A similar approach has been employed by Fontana et al. (2004) and Glazebrook et al. (2004) to determine stellar masses in the K20 and GDDS surveys respectively for which spectroscopic redshifts are available. In the region of overlap the spectroscopic studies give results results consistent with the photometric estimate, as shown in the figure.
Using the photometric redshift technique, the evolution of the stellar mass function can be traced back to . Our model predictions are shown by the solid line in Fig. 6, with the model mass function at plotted as a dotted line for comparison. The match of the model to the data is encouragingly good: both the overall normalisation and the position of the break are well reproduced in the model even at the highest redshifts probed. There is a hint that, at these redshifts, the model may be underpredicting the number of galaxies in the brightest bin. These galaxies are, of course, quite rare and furthermore, the comparison in Fig. 6 ignores the quite substantial errors in the photometric redshift and mass-to-light ratio estimate. At the highest redshift, the error in can be as large as 1 dex. This has the effect of smoothing the sharp break seen in the model, and may account for some of the apparent discrepancy (accurate modelling of the photometric mass estimator is required to test this). Our model thus predicts that massive galaxies were already in place at redshift with a stellar mass function which is very similar to that observed. We discuss the reasons for this behaviour in Section 6.
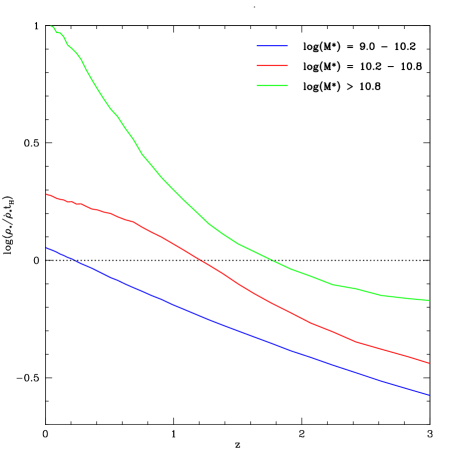
Since the model predicts that substantial stellar mass is already in place in bright galaxies at high redshift, it is instructive to compare the current star formation rate in these galaxies with the past average star formation rate as a function of galaxy mass. We make this comparison by plotting the ratio (where is the volume density of stars in galaxies in a given mass range and is the Hubble time at redshift ) as a function of redshift for a range of galaxy masses. This is shown in Fig. 7, where blue, red and green lines correspond to the stellar mass ranges –, – and respectively. The black dashed line at divides the graph into two regions. Below the line, the global average rate at which stars formed in the previous Hubble time is smaller than the current rate of star formation at redshift z. In a globally averaged sense, these galaxies are still forming. In contrast, galaxies that lie significantly above this line have a current star formation rate that will only add a small contribution to the stars already in existence. As the plot illustrates, the most massive galaxies cross this boundary at , while the lowest mass galaxies are only just crossing the boundary at the present-day. This behaviour is often referred to as “downsizing” in the star formation history of the Universe.
5 The cosmic star formation rate density
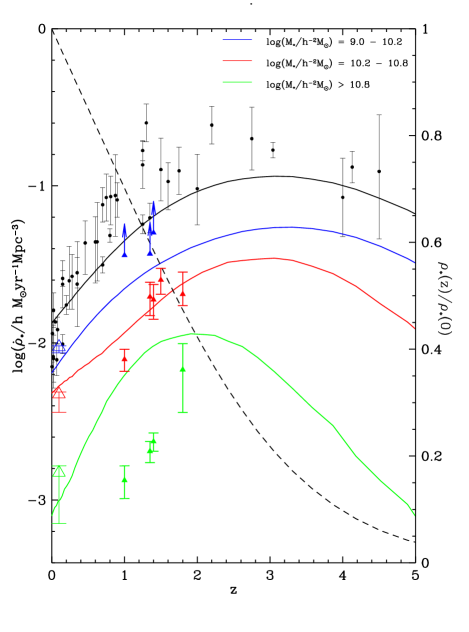
The evolution of the volume averaged star formation rate density out to is shown in Fig. 8. The model prediction, shown by a solid black line, is compared with a compilation of observational determinations by Hopkins (2004) (converted to the Kennicutt (1983) IMF adopted here). The model provides a good match to the data over most of the redshift range, except perhaps at the very lowest redshifts, , where the model overpredicts the star formation rate by a about 20%, and at where the model lies below the median of the data by a similar factor. The overall effect is that the decline in the star formation rate may be slightly weaker than suggested by the observations; however, given the observational uncertainties (both random and systematic) the model provides an adequate match. The dashed line gives the cumulative mass locked up in stars by redshift , normalised to the present value. Twenty percent of the current stellar mass was in place by and half by .
The colour lines show the contribution to the global star formation rate from galaxies of different mass (at the time when they are observed). We have split the model data into the same mass bins used in the observational study of Juneau et al. (2005), the results of which are also shown in the figure: –, – and (blue, red and green lines respectively). Most of the star formation in the model takes place in galaxies whose instantaneous stellar mass lies in the range -, although at the present day, there is a comparable contribution from galaxies with mass in the range –. At all times, there is a smaller contribution from galaxies in the most massive bin plotted, .
The time dependence of the star formation rate in all three stellar mass bins has a similar shape: there is a broad peak at –3 with a strong decline below between and the present day. The decline is particularly rapid in the highest mass bin and slower in the lowest mass bin. Nevertheless, star formation activity in the most massive galaxies peaks at a similar high redshift as in smaller galaxies. At first sight, this appears puzzling in the context of the hierarchical nature of structure growth characteristic of the CDM cosmology. This apparently paradoxical behaviour is, in part, the motivation for the terms “downsizing” and “anti-hierarchical” sometimes used to describe the observed history of star formation (and quasar) activity.
There are two effects in the model that underlie the behaviour seen in Figs. 7 and 8. Firstly, at a fixed halo mass, halos that collapse at higher redshift have a lower ratio of cooling time to free-fall time. This makes AGN feedback relatively less effective at higher redshift. Since AGN feedback increases in importance with increasing halo mass, halos that collapse at high redshift are more likely to form stars efficiently than those that collapse at low redshift. Secondly, this trend is enhanced because black holes are smaller at earlier times. As a result, the few rare massive halos that form at high redshift are able to make stars more efficiently (even if they are in the hydrostatic cooling regime) than their low redshift counterparts which have much larger black holes and thus more powerful AGN.
Our model prediction for the split of star formation rate density by galaxy stellar mass can be tested against the data from the GDDS survey of Juneau et al. (2005). This survey targeted faint galaxies in the K-band at , selecting according to stellar mass and star formation rate, inferred from OII emission and the rest-frame far-UV continuum. These data, together with lower redshift determinations from Brinchmann et al. (2004) are shown as colour points in Fig. 8. The model agrees reasonably well with the data in the range , although the contribution from the lowest mass bin is rather low at this redshift. We intend to refine the model by introducing a more detailed treatment of star formation and feedback in low mass halos and expect that this may reduce the remaining discrepancies seen in Fig. 8.
6 Discussion and conclusions
We have presented a new model of galaxy formation in the CDM cosmology and implemented it in the Millennium simulation of Springel et al. (2005a). Our galaxy formation model builds upon the hierarchical model of Cole et al. (2000) by including a more complete treatment of gas ejected from galaxies by stellar feedback and a new physical process: feedback from AGN embedded in quasi-hydrostatic cooling flows.
The model parameters have been adjusted to produce a good match to the observed properties of local galaxies. Fig. 3 compares the model with the local B and K band luminosity functions showing the level of agreement that can be achieved. The colour distribution of the model galaxies is shown in Fig. 4. It is clearly bimodal, with a transition in the typical colours of galaxies around a stellar mass of as observed in the local Universe.
In this paper, however, we focus on the evolution of the stellar mass function and star formation history predicted by the model. A particularly interesting feature of our new model is the counterintuitive nature of the star formation history that it predicts. Although the number density of halos of mass is increasing towards low redshift (Mo & White 2002), star formation in them becomes increasingly less efficient and, as a result, their contribution to the global star formation rate declines with redshift. Such apparently “anti-hierarchical” behaviour is present even in the early semi-analytic models of White & Frenk (1991). However, in these models the growth of halo mass was compensated for only by the increase in the cooling time of the gas. With modern determinations of , this effect is insufficient to stop the formation of overly bright galaxies by cooling flows at the centres of massive halos. The inclusion of AGN feedback solves this problem and, of course, also explains why cooling gas is not observed in the amounts inferred from cooling time arguments in the centres of galaxy clusters (Tamura et al. 2001, Peterson et al. 2002).
Two additional factors contribute to the relative decline in galaxy formation activity in massive halos at low redshift. At a fixed halo mass, the ratio of the cooling time of the gas to the free-fall time is shorter at high redshift than at low redshift. Our model is based on the assumption that AGN feedback is effective only during the quasi-hydrostatic cooling phase which today occurs in halos of mass . At high redshifts, the cooling times in these halos were short enough to allow the gas to cool on the free-fall timescale thus rendering any AGN feedback ineffective. In addition, since black hole masses are lower at higher redshift and, in our model, the AGN feedback is limited by the black hole’s Eddington limit, the feedback is less effective even in those halos that are already in the quasi-hydrostatic cooling phase. These are the main reasons why our model predicts a larger number density of massive galaxies at high redshift compared to earlier semi-analytic models and also the reason why the most massive galaxies today completed their star formation early and are now old and red.
In spite of the fact that our model agrees reasonably well with observational determinations of the stellar mass function out to the highest redshift, , at which this function has been estimated, the model predicts that only of the mass locked up in stars today was in place at . Similarly, the median redshift for star formation is . These numbers are not very different from those predicted by many previous semi-analytic models (e.g. Cole et al. 1994, 2000) which did not include AGN feedback. This is partly because massive galaxies contain only a relatively small fraction of the cosmic stellar population.
Although the two have been developed independently, the motivation for our model of AGN feedback and the basic physical principles behind it are similar to those discussed by Croton et al. (2006). However, there are a number of important differences between these two models, most notably in the implementation of the AGN physics, the cooling model used and the construction of the halo merger trees from the Millennium simulation. While Croton et al. (and De Lucia et al. 2005) presented extensive properties of their model at and discussed only a few aspects of their evolution, in this paper we have focused on properties at high redshift, particularly on the stellar mass function and star formation rate as a function of redshift, which were not considered by Croton et al.
More generally, the model presented in this paper and that of Croton et al. should be regarded as two plausible implementations of the current understanding of the physics of galaxy formation on the same underlying dark matter distribution. Since the differences in the construction of the merger trees are relatively minor (Helly et al., in preparation), the differences between the two models reflect different choices for the way in which the various physical processes are treated and parametrised. Both models give a similar match to the luminosity function and colour distribution of galaxies in the local Universe but they have, in fact, been constructed with this aim in mind. More interesting are the similarities and differences between the two models for other properties of local galaxies and, more importantly, properties of galaxies at high redshift. These similarities and differences will be explored in future work and will provide a good guide to the level of theoretical uncertainty in studies of this kind.
In summary, we have presented, and implemented in the Millennium simulation, a new model of galaxy formation in which AGN feedback is responsible for the absence of cooling flows in rich clusters, for the cutoff at the bright end of the galaxy luminosity function and for the number density and properties of the most massive galaxies at all redshifts. Galaxy catalogues constructed from it are available via the web at http://www.icc.dur.ac.uk/.
Acknowledgements
RGB thanks PPARC for the support of senior fellowship. CMB and AJB acknowledge the receipt of a Royal Society URF. This work was supported by PPARC rolling grant PP/C501568/1. We thank Andrea Cattaneo, James Binney and Darren Croton, and especially Simon White, for valuable comments and discussions that have helped shape this work.
References
- [1] Baldry I. K., Glazebrook K., Brinkmann J., Ivezić Ž., Lupton R. H., Nichol R. C., Szalay A. S., 2004, ApJ, 600, 681
- [2] Baugh C. M., Cole S., Frenk C. S., Lacey C. G., 1998, ApJ, 498, 504
- [3] Baugh C. M., Lacey C.G., Frenk C.S., Granato G.L, Silva L., Bressan, A., Benson A.J., Cole, S., 2005, MNRAS, 356, 1191
- [4] Bell E. F., McIntosh D. H., Katz N., Weinberg M. D., 2003, ApJS, 149, 289
- [5] Benson A. J., Frenk C. S., Lacey C. G., Baugh C. M., Cole S., 2002, MNRAS, 333, 177
- [6] Benson A. J., Bower R. G., Frenk C. S., Lacey C. G., Baugh C. M., Cole S., 2003, ApJ, 599, 38
- [7] Binney J., 1977, ApJ, 215, 483
- [8] Binney J., 2004, MNRAS, 347, 1093
- [9] Birnboim Y., Dekel A., 2003, MNRAS, 345, 349
- [10] Bower, R. G., Lucey, J. R., Ellis, R. S., 1992, MNRAS, 254, 601
- [11] Brinchmann J., Charlot S., White S. D. M., Tremonti C., Kauffmann G., Heckman T., Brinkmann J., 2004, MNRAS, 351, 1151
- [12] Brüggen M. & Kaiser C. R., 2002, Nature, 418, 301
- [13] Bundy, K., Ellis, R. S., Conselice C., 2005, ApJ, 625, 621
- [14] Cattaneo A., Blaizot J., Devriendt J., Guiderdoni B., 2005, MNRAS, 364, 407
- [15] Churazov E., Sunyaev R., Forman W., Böhringer H., 2002, MNRAS, 332, 729
- [16] Cole S., Aragon-Salamanca A., Frenk C. S., Navarro J. F., Zepf S. E., 1993, MNRAS, 271, 781
- [17] Cole S., Lacey C. G., Baugh C. M., Frenk C. S., 2000, MNRAS, 319, 168
- [18] Cole S. et al., 2001, MNRAS, 326, 255
- [19] Cowie L. L., Songaila A., Hu E., Cohen J. G., 1996, AJ, 112, 839
- [20] Croton D. J., Springel V., White S. D. M., De Lucia G., Frenk C. S., Gao L.,. Jenkins A., Kauffmann G., Navarro J. F., Yoshida Y., 2006, MNRAS, 367, 864
- [21] Cuoco A., Iocco F., Magnano G., Miele G., Pisanti O., Serpico P.D., 2004, Int. J. Mod. Phys. A19, 4431
- [22] Dalla Vecchia C., Bower R. G., Theuns T., Balogh M. L., Mazzotta P., Frenk C. S., 2004, MNRAS, 355, 995
- [23] Dalla Vecchia C., 2005, PhD thesis (star-www.dur.ac.uk/ caius/)
- [24] De Lucia, G., Springel, V., White, S. D. M., Croton, D. & Kauffmann, G., 2005, MNRAS, 366, 499
- [25] Di Matteo T., Springel V., Hernquist L., 2005, Nature, 433, 604
- [26] Drory N., Bender R., Feulner G., Hopp U., Maraston C., Snigula J., Hill G.J., 2003, ApJ, 595, 698
- [27] Drory N., Salvato M., Gabach A., Bender R., Hopp U., Feulner G., Pannella M., 2005, ApJ, 619, L131
- [28] Efstathiou, G., Lake, G., Negroponte, J. 1982 MNRAS, 199, 1069
- [29] Fontana A. et al. 2004, A&A, 424, 23
- [30] Glazebrook K. et al. 2004, Nature, 430, 181
- [31] Gnedin N.Y., 2000, ApJ, 542, 535
- [32] Granato G. L., De Zotti G., Silva L., Bressan A., Danese L., 2004, ApJ, 600, 580
- [33] Haering N., Rix H.-W., 2004, ApJ, 604, L89
- [34] Haehnelt M., Kauffmann, G., 2000, MNRAS, 318, 35
- [35] Harker G., Cole S., Helly J., Frenk C. S., Jenkins A., 2006, MNRAS, 367, 1039
- [36] Helly J. C., Cole S., Frenk C. S., Baugh C. M., Benson A. J., Lacey C., 2003, MNRAS, 338, 903
- [37] Hopkins A. M., 2004, ApJ, 615, 209
- [38] Huang J. S., Glazebrook K., Cowie L. L., Tinney C., 2003, ApJ, 584, 203
- [39] Jenkins A., Frenk C. S., White S. D. M., Colberg J. M., Cole S., Evrard A. E., Couchman H. M. P., Yoshida N., 2001, MNRAS, 321, 372
- [40] Juneau S. et al., 2005, ApJ, 619, 135
- [41] ay S. et al., 2000, MNRAS, 316, 374
- [42] Kauffmann G., White S. D. M., Guiderdoni B., 1993, MNRAS, 264, 201
- [43] Kauffmann G., Charlot S., 1998, MNRAS, 297, 23
- [44] Kauffmann G., Colberg J. M., Diaferio A., White S. D. M., 1999a, MNRAS, 303, 188
- [45] Kauffmann G., Colberg J. M., Diaferio A., White S. D. M., 1999b, MNRAS, 307, 529
- [46] Kauffmann G., Haehnelt M., 2000, MNRAS, 311, 576
- [47] Kauffmann G., Heckman T. M., White S. D. M., Charlot S., Tremonti C., Peng E. W., Seibert M., Brinkmann J., Nichol R. C., SubbaRao M., York D., 2003, MNRAS, 341, 54
- [48] Kennicutt, R.C., 1983, ApJ, 272, 54
- [49] Keres D., Katz N., Weinberg D.H., Dave R., 2005, MNRAS, 363, 2
- [50] Kodama T., Yamada T., Akiyama M., et al., 2004, MNRAS, 354, 1103
- [51] Malbon R. K., Baugh C. M., Lacey C. G., Frenk C. S., MN submitted
- [52] Menci N., Fontana A., Giallongo E., Salimbeni S., 2005, ApJ, 632, 49
- [53] Mo, S., Mao, H. & White, S.D.M. 1998, MNRAS, 295, 319
- [54] Mo H. J., White S. D. M., 2002, MNRAS, 336, 112
- [55] Monaco P., Fontanot F., 2005, MNRAS, 359, 283
- [56] Nagashima, M., Lacey, C.G., Baugh, C.M., Frenk, C.S., Cole, S., 2005, MNRAS 358, 1247
- [57] Nagashima, M., Lacey, C.G., Okamoto, T., Baugh, C.M., Frenk, C.S., Cole, S., 2005, MNRAS, 363, L31
- [58] Navarro J. F., White S. D. M., 1993, MNRAS, 265, 271
- [59] Norberg P. et al., 2002, MNRAS, 336, 907
- [60] Peterson J. R., Kahn S. M., Paerelas F. B. S., Kusatra J. S., Tamura T., Bleeker J. A. M., Ferrigno C., Jernigan J. G., 2003, ,ApJ, 590, 207
- [61] Pozzetti L. et al., 2003, A&A, 402, 837
- [62] Quilis, V., Bower, R. G., & Balogh, M. L. 2001, MNRAS, 328, 1091
- [63] Rees M. J. & Ostriker J. P., 1977, MNRAS, 179, 541
- [64] Sanchez A., Baugh C.M., Percival W.J., Peacock J.A., Padilla N.D., Cole S., Frenk C.S., Norberg P., 2006, MNRAS, 366, 189
- [65] Spergel et al., 2003, ApJ, 148, 175
- [66] Spergel et al., 2006, astro-ph/0603449
- [67] Silk J., 1997, ApJ, 211, 238
- [68] Silk J. & Rees, M. J., 1998, A&A 331, 1
- [69] Somerville R. S., Primack J. R., 1999, MNRAS, 310, 1087
- [70] Somerville R. S., Primack J. R., Faber S. M., 2001, MNRAS, 320, 504
- [71] Springel V., White S. D. M., Jenkins A., et al., 2005a, Nature, 435, 629
- [72] Springel V., Di Matteo T., Hernquist L., 2005b, MNRAS, 361, 776
- [73] Sijacki D., Springel V., 2006, MNRAS, 366, 397
- [74] Tamura T. et al., 2001, A&A, 365, 87
- [75] White S. D. M., Frenk C. S., 1991, ApJ, 379, 52
- [76] White S. D. M., Rees M. J., 1978, MNRAS, 183, 341