The Physical Properties and Detectability of Reionization-Epoch Galaxies
Abstract
We present predictions drawn from cosmological hydrodynamic simulations for the physical, photometric and emission line properties of galaxies present during the latter stages of reionization from . We find significant numbers of galaxies that have stellar masses exceeding during this epoch, with metallicities exceeding one-thirtieth solar. Far from primeval “first-star” objects, these objects exhibit a significant Balmer break, are likely to have reionized their infall regions prior to , are dominated by atomic rather than molecular cooling, and are expected to be forming few if any metal-free stars. By , the space density of objects is roughly equivalent to that of luminous red galaxies today. Galaxies exhibit a slowly evolving comoving autocorrelation length from , continuing a trend seen at lower redshifts in which the rapidly dropping bias counteracts rapidly increasing matter clustering. These sources can be marginally detected using current instruments, but modest increases in sensitivity or survey area would yield significantly increased samples. We compare to current observations of the rest-UV and Ly line luminosity functions, and find good agreement. We also compare with the object observed by Egami et al., and find that such systems are ubiquitous in our simulations. The intrinsic Ly luminosity function evolves slowly from , implying that it should also be possible to detect these objects with upcoming narrow band surveys such as DAzLE, if as we argue the detectability of Ly does not drop significantly to higher redshifts. We make predictions for near-IR surveys with JWST, and show that while a high density of sources will be found, Population III objects may remain elusive. We present and compare simulations with several recipes for superwind feedback, and show that while our broad conclusions are insensitive to this choice, a feedback model based on momentum-driven winds is mildly favored in comparisons with available data.
keywords:
galaxies: formation, galaxies: evolution, galaxies: high-redshift, cosmology: theory, methods: numerical1 Introduction
The epoch of reionization is an important event in the history of our universe, during which the light of the first stars and galaxies ate away at the neutral hydrogen fog and transformed the intergalactic medium (IGM) into the highly ionized cosmic web that we see today (Loeb & Barkana, 2001). Detecting this epoch has long been a goal of observational cosmology. Recent observations of a Gunn-Peterson trough in quasar spectra suggest that the end of reionization epoch has now been seen (Fan et al., 2002). Conversely, third-year data from the Wilkinson Microwave Anisotropy Probe (WMAP; Page et al., 2006) suggests that the universe was predominantly ionized out to . When exactly reionization begins, how it proceeds, and what the sources of the ionizing photons are remain open questions.
In light of this, a key goal of next generation ground and space-based telescopes is to detect the objects responsible for reionizing the universe at . At present these are believed to be star-forming galaxies since there are insufficient quasars at to do the job (Fan et al., 2001), although the latest SDSS samples show a faint-end slope that is tantalizingly close to the required steepness (Fan et al., 2004). Few reionization-epoch objects have been observed up till now (Rhoads & Malhotra, 2004; Egami et al., 2005; Stern et al., 2005; Hu et al., 2005; Chary, Stern & Eisenhardt, 2005), and hence their detailed physical properties remain poorly constrained. In order to optimize detection strategies with current and future facilities, it is important to understand the nature of these early galaxies.
Simulations of galaxy formation can provide insights into the expected properties of these systems within the context of a now well-established framework for hierarchical structure formation. While the properties of dark matter halo assembly are relatively well understood owing to precisely determined cosmological parameters (Spergel et al., 2003, 2006), the properties of the gas clouds that condense to form observable stars remain subject to a large range of theoretical uncertainties. Previous studies have utilized analytic or semi-analytic approaches to predict the properties of early galaxies, based on simplified models for the relevant baryonic physics (e.g. Barkana & Loeb, 2001, and references therein). An alternative approach is to employ full cosmological hydrodynamic simulations that account for all the relevant cooling and star formation processes associated with galaxy formation, as presently understood, constrained by rapidly-improving observations of high-redshift systems. Such simulations carry information about the full three-dimensional structure of accretion and feedback processes that are vital to regulating galaxy formation, and track the growth of baryonic galaxies within a full hierarchical structure formation scenario. These simulations have been fairly successful at modeling post-reionization high-redshift galaxies (e.g. Night et al., 2005; Finlator et al., 2005), so they provide a natural framework to extend studies back into the reionization epoch. Such an approach is complementary to models of first star formation (Abel, Bryan, & Norman, 2000; Bromm & Larson, 2004) at , which aim to predict the properties of primeval galaxies by understanding early stellar assembly from primordial gas.
A significant difficulty with using models or simulations tuned to match lower redshifts is that the physics of galaxy formation may be quite different during the epoch of reionization. Compared to today, the universe during the reionization epoch had higher densities, shorter cooling times, lower metallicities, and a flatter power spectrum on mildly nonlinear scales, all of which could influence the formation and early evolution of galaxies. Furthermore, the process of reionization itself may have large effects on the galaxy population (Barkana & Loeb, 2001), perhaps suppressing star formation through photoionization heating (Barkana & Loeb, 1999) or stripping (Sigward, Ferrara, & Scannapieco, 2005), or perhaps enhancing it through shock-induced star formation or through early black holes emitting X-rays that stimulate molecular hydrogen production (Haiman, 2005). It is therefore possible that our recipes and models for galaxy formation tuned to observations at the present epoch may have little relevance during the reionization epoch. Indeed, this is almost certainly the case for primeval galaxies, i.e. the very first galaxies forming nearly metal-free stars.
On the other hand, if we want to understand the properties of galaxies that will be observable in the near future with next-generation instruments such as JWST and 20-30m class telescopes, it is questionable whether these first galaxies forming their very first stars are the relevant objects to investigate. In this paper we argue that galaxies that will be detected in the foreseeable future have already formed many generations of stars, as they are among the largest and/or most vigorously star forming galaxies at these epochs. They have circular velocities well above that expected to be strongly affected by photoionization, metallicities well above the threshold for a “normal” stellar initial mass function, and halo virial temperatures well above the threshold where atomic lines become the dominant coolant. Furthermore, these systems are highly biased, which means that they are expected to be relatively unaffected by the global reionization process occuring in the universe at large, because they likely reionized their local volume at an earlier epoch. Hence we argue that observable galaxies at are probably more similar to lower-redshift systems than they are to early primeval systems, and that simulation methods developed to model post-reionization galaxy formation may provide a reasonably realistic description for these systems that are responsible for completing the process of reionization.
In this paper we study the detailed properties of the galaxy population at using cosmological hydrodynamic simulations. We include physical processes such as kinetic feedback with accompanying metal injection and metal-line cooling, in addition to the usual radiative and star formation processes required for galaxy formation, while ignoring the highly complicating effects of radiative transfer. Our primary goal here is to use such models to make predictions for reionization-epoch galaxies that can be tested against present and upcoming observations. We find that many galaxies with stellar masses exceeding are already in place at , and by there are plenty with . These galaxies have all been enriched at significant levels, to at least 3% solar, and more typically 10% solar. They are highly biased and highly clustered, and simple estimates show that they will reionize their infall regions by even if the rest of the universe remains mostly neutral. They would be detectable in large numbers with near-infrared surveys only modestly deeper than accessible today, and depending on line transfer effects could also be detectable in Ly emission, perhaps even more abundantly than with broad-band surveys. We compare with observed systems, and demonstrate that our models nicely reproduce available observations. In short, the aim of this paper is to set the stage for detailed comparisons of objects with predictions from hierarchical models of structure formation including gas physics, and show that initial comparisons can already provide valuable insights into the nature of galaxies in the reionization epoch.
Our paper is organized as follows: In §2 we present our simulation methodology, details of our various runs, and algorithms for determining galaxy properties. In §3 we present physical properties of systems, including their masses, star formation rates, metallicities, and halo properties. In §4 we discuss galaxy clustering and its evolution, along with implications for local reionization. In §5 we present predictions for broad-band and Ly emission properties of high-redshift galaxies, including comparisons to available observations and prospects for detection with future instruments. We summarize our results in §6.
2 Simulations
| NameaaAdditionally, a suffix “nw”, “cw”, “mzw” is added to denote no, constant, or momentum winds, respectively. | bbBox length of cubic volume, in comoving . | ccEquivalent Plummer gravitational softening length, in comoving . | ddAll masses quoted in units of . | ddAll masses quoted in units of . | d,ed,efootnotemark: |
|---|---|---|---|---|---|
| W8n256 | |||||
| W16n256 | |||||
| W32n256 |
We employ the parallel cosmological galaxy formation code Gadget-2 (Springel, 2005) in this study. This code uses an entropy-conservative formulation of smoothed particle hydrodynamics (SPH) along with a tree-particle-mesh algorithm for handling gravity. It includes the effects of radiative cooling assuming ionization equilibrium with primordial chemistry, which we have extended to include metal-line cooling based on the collisional ionization equilibrium tables of Sutherland & Dopita (1993). The metal cooling function is interpolated to each gas particle’s metallicity as tracked self-consistently by Gadget-2, and added to the primordial cooling rate. Gas particles that are eligible for star formation are continually enriched based on an instantaneous recycling approximation with a yield parameter of 0.02. The thermal energy of each gas particle is evolved on its cooling timescale (if it is shorter than the Courant or dynamical timescale) assuming isochoric conditions. For full details see Oppenheimer & Davé (2006). Stars are formed using a recipe that reproduces the Kennicutt (1998) relation, employing a subresolution multi-phase model that tracks condensation and evaporation in the interstellar medium following McKee & Ostriker (1977); see Springel & Hernquist (2003a) for details. Stars inherit the metallicity of the parent gas particle when spawned, and from then on cannot be further enriched.
Gadget-2 has an observationally-motivated prescription for driving superwinds out of star forming galaxies, which is tuned to reproduce the global stellar mass density at the present epoch (Springel & Hernquist, 2003b). In Oppenheimer & Davé (2006) we describe modifications to this scheme designed to better match observations of IGM enrichment. The free parameters are the wind velocity of material ejected and the mass loading factor, which is the ratio of the rate of matter expelled to the star formation rate. Here, we will concentrate on three superwind schemes. The first is one where superwinds are turned off (though thermal feedback from supernova is included). This “no winds” (nw) model is known to overproduce the amount of stars significantly at low redshifts (Springel & Hernquist, 2003b), so its purpose here is to gauge the effects of the other (more observationally consistent) superwind models. The second is a “constant wind” (cw) model where all the particles entering into winds are expelled at out of star forming regions and a constant mass loading factor of 2 is assumed, which is the scheme used in the runs of Springel & Hernquist (2003b). Finally, we introduce a new “momentum wind” (mzw) model where the wind velocity is proportional to the local circular velocity (, where is computed from the local gravitational potential), and the mass loading factor is inversely proportional to the velocity dispersion (), as expected in momentum-driven wind scenarios (Murray, Quatert, & Thompson, 2005) and consistent with observations by Martin (2005). The mometum wind model also gives a velocity boost in low-metallicity systems, based on the arguments that more UV photons are produced per unit stellar mass at lower metallicities (specifically, we employ eqn. 1 of Schaerer, 2003), and that it is these UV photons that are driving the wind (Murray, Quatert, & Thompson, 2005). Note that these supernova-driven winds must be included “by hand” mainly because we lack the numerical resolution to self-consistently follow the physical processes required to drive bulk flows out of star forming regions.
These superwind models are primarily intended to illustrate the sensitivity of our results to our somewhat ad hoc feedback prescriptions, though admittedly one could envision a wider range of feedback models. We note that in Oppenheimer & Davé (2006) we find the momentum wind model to be in better agreement with a range of observations including intergalactic \textC iv absorption from , and our comparisons in this paper also mildly favor the momentum wind model. We further note that observed typical outflow velocities for Lyman break galaxies of hundreds of km/s (Pettini et al., 2001; Shapley et al., 2003) and their inferred mass loading factors of (Erb et al., 2006) are both consistent with our momentum wind model parameterization. For these reasons we generally focus on the momentum wind model when the conclusions from the different wind models are broadly similar.
Gadget-2 implements heating due to a photoionizing background, which we take from the latest CUBA model (Haardt & Madau, 2001) that assumes a 10% escape fraction of ionizing radiation from galaxies in addition to the contribution from quasars. For this model, reionization occurs at . Spatial uniformity is assumed, which is obviously incorrect in detail during reionization, but may nevertheless be a passable local approximation if the galaxies of interest reionize their surroundings earlier and if their masses are significantly above that which would be suppressed by photoionization. For galaxies resolved by our simulations, we will argue that both those statements are typically true.
We run nine simulations: Three different volumes as listed in Table 2, each with our three different superwind schemes. These three volumes can be used to judge numerical resolution effects at overlapping mass scales. We note that Gadget-2 has been extensively tested for resolution convergence with regards to its star formation and feedback algorithm (Springel & Hernquist, 2003a; Night et al., 2005; Finlator et al., 2005), so we do not conduct a wide suite of resolution tests. Nevertheless we are reassured by the good numerical convergence seen among our runs here, as we will point out in upcoming sections. The choice of box size has also been carefully considered, because overly small volumes can lead to galaxy formation occuring too late owing to missing power on large scales (Barkana & Loeb, 2004), while too large volumes would be unable to resolve the early objects of interest. Our box sizes are therefore chosen in a range spanning between these pitfalls.
All runs use cosmological parameters consistent with recent joint analyses of first-year WMAP, SDSS, Lyman alpha forest, and Type Ia supernovae data (Tegmark et al., 2004; Seljak et al., 2004): We assume , , , , and . More recent third-year WMAP data indicates a lower amplitude of the matter power spectrum (; Spergel et al., 2006), which would result in fewer galaxies, but also a lower and higher which would result in more galaxies at these epochs. However, there is still some debate on , as Seljak et al. (2006) determines a significantly higher value () by incorporating Ly- forest constraints. We expect that our results would therefore be qualitatively similar with the correct cosmology, and indeed there are significantly larger uncertainties associated with modeling details such as our superwind scheme.
Each of our runs has dark matter and gas particles, evolved from the linear regime down to . The smallest volume is a cube of on a side, with an equivalent Plummer gravitational softening length of (comoving; i.e. better than 100 pc physical at ), and our largest volume has a box length. The initial conditions are chosen to be random subvolumes of the universe, generated using an Eisenstein & Hu (1999) power spectrum when the universe is still well within the linear regime (typically ). Since the nonlinear scale at is less than our smallest box length, each volume should contain a representative galaxy population, though of course the rarest objects will be absent. Given the canonical value of 60 particles for robust identification of dark matter halos (Weinberg et al., 1999), our smallest volume is resolving halos with mass , with an associated virial temperature K. As we will show in §3.5, halos containing resolved galaxies (defined below) are substantially larger, typically above . This means that primordial atomic gas should be the dominant coolant in all our resolved systems. Note that our simulations do not include molecular hydrogen cooling.
We identify galaxies using Spline Kernel Interpolative DENMAX, and dark matter halos using the spherical overdensity algorithm (see Keres et al., 2005, for full descriptions). We only consider galaxies with stellar masses exceeding 64 star particles, which in Finlator et al. (2005) we determined represents a converged sample both in terms of stellar mass and star formation history. The minimum resolved stellar mass of galaxies in each volume is listed in Table 2. In order to fully utilize the dynamic range in our three simulation volumes, we present stellar mass functions derived by splicing together the results in our various volumes, in the following manner: For masses where multiple volumes satisfy the 64 star particle criterion, we take the maximum value among our simulated mass functions. In practice, at any mass this is usually the mass function of the largest volume (or close to it), and hence we effectively present mass functions from the largest volume that resolves a given galaxy mass.
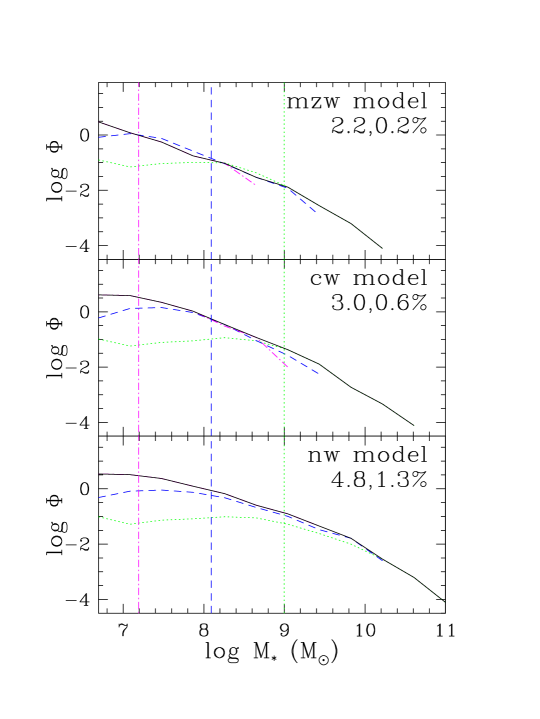
The resulting stellar mass functions are shown in Figure 1, for the momentum wind (top panel), constant wind (middle) and no wind (bottom) models. The dotted, dashed, and dot-dashed curves represent the mass functions from the 32, 16, and volumes. Overlaid is the aggregate mass function, shown as the solid line, which as expected tracks the mass function at high masses and the mass function at small masses. The vertical lines represent the 64 star particle mass limit for the three volumes, which is where the turndown begins, at least for the feedback models; for the no wind model the turndown begins at slightly larger masses. The caption in the upper right shows the mass fraction of baryons in cold gas and stars at in these three models, showing that the momentum wind model produces significantly less cold gas and stars than the constant wind model by this epoch, which in turn produces significantly less than the no-wind case. The key point from Figure 1 is that mass functions of the different resolution simulations agree quite well in the overlapping mass range, resulting in a nearly seamless mass function extending from to beyond . Hence we do not expect that numerical resolution limitations will affect our results, so long as we concentrate on galaxies exceeding our 64 star particle mass criterion.
To obtain photometric properties of our simulated galaxies, we use Bruzual & Charlot (2003) population synthesis models to convert the simulated star formation history of each galaxy into broad band colours in an assortment of filters, including , , and the Spitzer IRAC , , and MIPS bands (we use AB magnitudes throughout). We describe this further in §5.2. We account for dust reddening using a prescription based on the galaxy’s metallicity and a locally-calibrated metallicity-extinction relation. We account for IGM absorption bluewards of rest-frame Ly using the Madau (1995) prescription; at these redshifts this results in virtually complete absorption, so we do not consider results from bands at wavelengths shorter than redshifted Ly. See Finlator et al. (2005) for a more complete description of these procedures. We also predict Ly emission line properties based on the instantaneous star formation rates in each galaxy as output by Gadget-2; we describe this in more detail in §5.3.
We concentrate on studying galaxies between for several reasons. First, our simulations have limited dynamic range, which means that pushing to earlier epochs results in a statistically insignificant sample of resolved galaxies that have formed by that epoch (particularly in our larger volumes). Second, our assumed ionizing background turns on at , which means that prior to that time the suppression of gas infall due to local photoionization, which may be relevant, is not taken into account. Finally, there is the practical consideration that surveys of reionization galaxies are likely to concentrate on galaxies in this epoch because they are both nearer and intrinsically brighter than those at higher redshifts.
3 Physical properties
3.1 Global Star Formation Rate Density
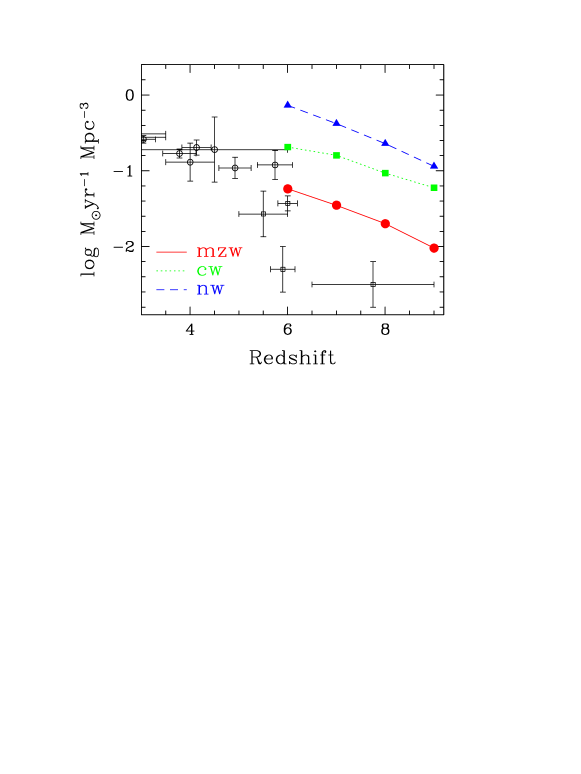
We begin by showing some basic physical properties of reionization-epoch galaxies in our simulations. The global star formation rate density evolution, sometimes called the Madau plot (Madau et al., 1996), has become a bellwether test for models of cosmological galaxy evolution. Figure 2 shows the global star formation rate density for the three wind models. These values were computed from the resolved galaxy population in the three volumes (8,16,) for each wind model. As found by Springel & Hernquist (2003b), superwind feedback has a large effect on suppressing star formation in the universe, even at these early epochs. The constant wind case shows increasing suppression with time relative to the no wind scenario, while the momentum wind model provides a relatively redshift-independent global suppression of . Note that our simulations include metal-line cooling, unlike those of Springel & Hernquist (2003b), but at these early epochs primordial cooling is so efficient that the additional cooling provided by metal lines does not significantly impact the star formation efficiency (Hernquist & Springel, 2003; Keres et al., 2005).
Figure 2 also shows data points from a compilation by Hopkins (2004) (only the data are shown). We have supplemented this with more recent measurements at as noted in the caption. Comparing the simulations to the data, it is evident that superwind feedback is required in order to bring the simulations into broad agreement with observations and solve the overcooling problem (Springel & Hernquist, 2003b). Based solely on these data it is not clear which of our superwind models produces best agreement; indeed a simple extrapolation of our two models seems to roughly bracket the observed range at . The exceptions are the point from Bunker et al. (2004), and the point from Bouwens et al. (2004), which both lie significantly below the predictions. However, given that these points are based only on a handful of bright objects detected at those redshifts, it is unclear what to make of this discrepancy. In general, observational selection effects could significantly impact this comparison, as the galaxies identified in our simulations may not be equivalent to those used to determine the data points. We leave more detailed comparisons for future work. The main point here is that superwind feedback is a necessary ingredient for suppressing early galaxy formation to obtain broad agreement with observed cosmic star formation rate density evolution.
3.2 Mass functions
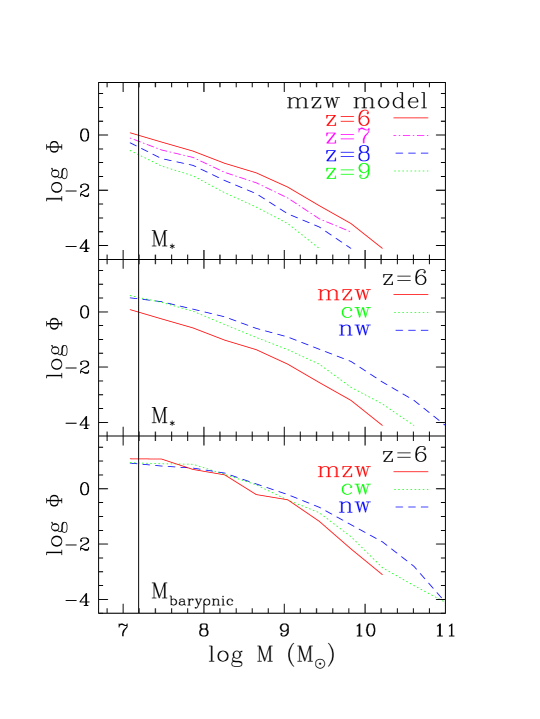
Hierarchical structure formation models generally predict a rapid early buildup of stellar mass in galaxies. Stellar mass functions at are shown in the top panel of Figure 3, for the momentum wind model. As expected, this function grows with time, such that there are about twenty times more galaxies with at as compared to . The shape is initially close to a power law, and obtains a more pronounced bend with time; the faint-end slope of a Schecter function fit goes from at to at . A significant number of galaxies with stellar masses exceeding , and a few exceeding , are already in place by . By , galaxies exceeding have a space density of about per cubic . This is comparable to the space density of the SDSS Luminous Red Galaxy sample (Zehavi et al., 2005), suggesting that these objects at are the progenitors of large ellipticals at low redshift.
The middle and bottom panels show a comparison of stellar mass functions and total galaxy baryonic mass functions for the various wind models. The superwind feedback prescription has a significant effect on the stellar mass function, producing nearly a factor of three reduction in the mass function for the momentum wind model as compared with the constant wind model. The suppression of star formation in feedback models relative to the no wind case is actually larger at larger masses, counterintuitive to the notion that feedback preferentially affects small galaxies (Dekel & Silk, 1986); this reflects the hierarchichal assembly of large galaxies from smaller ones. There is much less of a difference among models for the total baryonic mass function, because the constant wind model has a relatively low mass loading factor that does not expel much of the gas, while the momentum wind model has lower wind velocities that allow fairly quick re-accretion. The differences seen here can be regarded as an estimate on the modeling uncertainty from our feedback algorithms.
3.3 Stellar Birth Rates
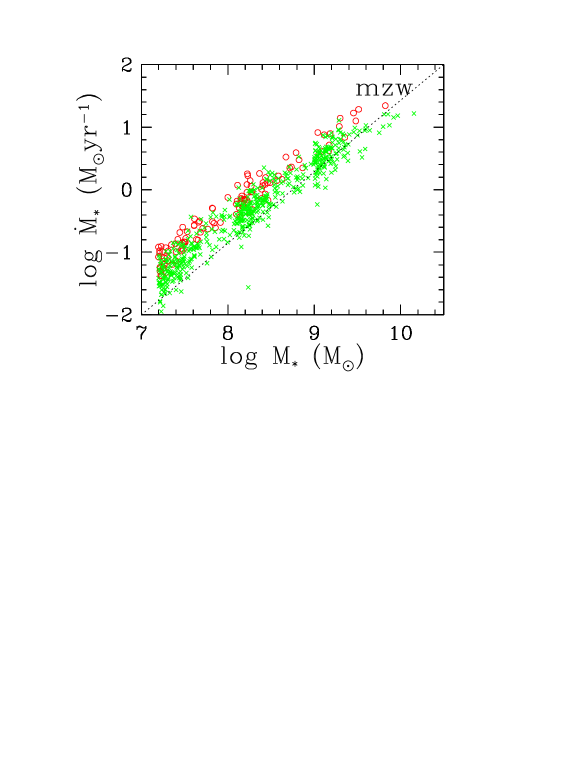
Figure 4 shows the star formation rates as a function of stellar mass at and in the momentum wind model. The three clumps of points correspond to galaxies from our three volumes, which smoothly connect with each other. Star formation rates are essentially proportional to the stellar mass at both redshifts, with the correlation being marginally tighter at , implying a fairly constant stellar birth rate across all masses. This tight relationship between stellar mass and star formation rate is also seen at lower redshifts (Finlator et al., 2005), and arises because star formation in high-redshift galaxies is dominated by gas infall on dynamical timescales (Keres et al., 2005) rather than more stochastic merger-driven bursts as in some semi-analytic models (e.g. Kolatt et al., 1999). Given that these simulations cannot resolve the detailed internal dynamics of mergers that lead to dramatic short-lived starbursts, it is possible that the scatter in this relationship is underestimated. Nevertheless the basic trend that the most rapid star formers are generally the largest galaxies remains a fundamental prediction of hydrodynamic simulations of galaxy formation.
Galaxies at a given stellar mass are actually forming stars approximately twice as fast at than at . Note that the total star formation rate in resolved galaxies increases by a factor of three from to since there are many more resolved galaxies at . These statements are also generally true for the constant and no wind models (not shown). The largest galaxies at both redshifts are forming stars in excess of yr, which is vigorous even by today’s standards. This indicates that the epoch of galaxy growth is already well underway by .
The tight positive correlation between stellar mass and star formation rate is a basic prediction of hydrodynamic simulations at high redshifts that has yet to be verified. Observations by Papovich et al. (2005) suggest that at redshift , such a relation is broadly in place, although the scatter is much larger than observed in simulations. Such a trend is certainly not observed today, as massive galaxies presently are forming stars very slowly if at all. It remains to be seen if simulations can quantitatively reproduce this so-called galaxy downsizing, though the qualitative trend is a natural outcome in hierarchical galaxy formation models (see Davé et al., 2005, for more discussion).
The importance of mergers in driving galaxy properties at high redshifts remains hotly debated. In addition to the issue of stochasticity in star formation due to mergers as discussed above, there is also the issue of feedback due to merger-related processes, including the impact of central black hole growth and associated feedback (Di Matteo, Springel, & Hernquist, 2005). AGN feedback has the potential to drive out large quantities of gas from galactic potentials (Springel, Di Matteo, & Hernquist, 2005b), an effect we are are not modeling here. It is plausible that at these high redshifts, where the quasar population is small (Fan et al., 2004), the impact of such processes will be minimal. However, this bears future testing, and is noteworthy as another caveat in modeling the evolution of reionization-epoch galaxies.
3.4 Metallicities
Metal pollution has a large effect on the reionization epoch, both in terms of the cooling curve that strongly affects the Jeans mass in star forming regions (Bromm & Larson, 2004), as well as enabling the formation of dust that can affect the detectability of systems, particularly in the Ly emission line. In the top panel of Figure 5 we show the mass-averaged gas-phase metallicity of galaxies in the momentum wind model at and . The mass-metallicity relation shows little redshift evolution during this epoch; as galaxies form more stars, they commensurately increase their metallicity so as to preserve a linear relation. For comparison, the SDSS median mass-metallicity relation is shown as the solid line (Tremonti et al., 2004); interestingly, the slope is similar, but the amplitude is almost 1 dex lower than observed at . This means that although little evolution is detected from , the metallicity at a given stellar mass must increase by by redshift zero. Given the protracted period of time from , this does not seem unreasonable, but still bears future examination. More recently, Erb et al. (2006) has measured the mass-metallicity relationship at , and found it to lie only 0.3 dex below the local relation; this is consistent with the relatively slow evolution predicted in these simulations.
The bottom panel of Figure 5 shows the gas metallicities in the two wind models at . The feedback mechanism has a significant effect on the metallicity, with the mometum wind model having typically half a dex lower metallicity than the constant wind case. This is directly a reflection of the lower amount of stellar mass in galaxies of a similar total baryonic mass, as shown in Figure 3. While we broadly favor the momentum wind model, we note that the factor of 3 variation in the mass-metallicity relation amplitude is probably indicative of current feedback modeling uncertainties. We have not shown the stellar metallicities, but they are similar to the gas metallicities, being lower by at most a factor of two.
The main point of Figure 5 is that in all cases, the metallicities of resolved galaxies exceed about one-thirtieth solar. While this would be considered metal-poor by today’s standards, it still far exceeds the metallicity threshold of that is purported to enact the transition to a normal Population II stellar population from a “metal-free” Population III one (see Bromm & Larson, 2004, and references therein). Hence it is expected that these high redshift galaxies should already have little if any contribution from Population III stars, assuming that the metal mixing timescale in the ISM is shorter than a few dynamical times. Furthermore, these galaxies may also contain a significant amount of dust if the timescale for dust formation is as short, as has been inferred from high-redshift quasar observations (Maolino et al., 2004).
While the mean metallicity in galaxies is large compared to the canonical value required to suppress Population III star formation, it is still possible that some stars continue to form with very low metallicities at late times. For instance, Jimenez & Haiman (2006) interpreted recent data from galaxies as implying significant () ongoing Population III star formation. If verified, this would suggest that galaxies should be forming even greater fractions of low-metallicity stars.
In Figure 6 we calculate the percentage of stellar mass formed in our simulations having as a function of time. We choose our smallest volume to maximize the likelihood of early, metal-free stars; the values from larger volumes were found to be lower. The percentages are nonzero but very low, typically less than 0.5% at all epochs, with the only exception being the no wind case where unfettered infall leads to an initial burst of near-metal free star formation (still only ). The stochastic nature of our star formation algorithm, and the fact that we are not forming individual stars but rather star “clumps” that are , means that the values shown should be regarded as crude estimates. However, it is still clear that our simulations produce very little Population III star formation at , likely dimishing further to lower redshifts, and are therefore inconsistent with the Jimenez & Haiman (2006) hypothesis. Future observations will be required to determine if this represents a failing of our models.
3.5 Halo Baryon Fractions
During the reionization epoch, galaxies are likely embedded in a inhomogenously percolating radiation field. Due to the computational complexity of radiative transfer, our simulations do not track this, and instead assume a uniform photoionizing background turned on at . Clearly this approximation is incorrect in detail; however, we can assess whether the resulting galaxy population is likely to be significantly affected by the external ionizing radiation by examining some basic properties of baryons in halos.
Figure 7 (top panel) shows the mass fraction of total baryons (upper band of points) and stars (lower band) in halos that host galaxies above our 64-particle stellar mass resolution limit, for our momentum wind runs. There are three clumps of points corresponding to halos in our three volumes; the agreement between the runs at overlapping masses indicates good resolution convergence. Halos generally contain slightly less than the global baryon mass fraction of , indicated as the horizontal dotted line. There is a weak trend for smaller halos to contain a smaller baryon fraction, as the momentum wind model increases the amount of material ejected in these smaller systems. However, even the smallest halos that host a resolved galaxy still show a modest 30% reduction in the baryon fraction relative to the global mean. The stellar fraction shows a more clear trend with halo mass, indicating that our momentum wind model has more of an effect at suppressing star formation than it does at ejecting baryons from halos, as we saw in Figure 3.
The middle and bottom panels show the same plot for the constant and no wind models, respectively. Unlike the momentum wind case, these model shows no trends with halo mass in their baryon mass fractions, and a reduced trend in their stellar mass fractions. So, for instance, in the lowest mass halos, there are more than three times as many stars in the constant wind model than in the momentum wind case. Again, this can be taken as some measure of modeling uncertainty.
In all cases, halos containing resolved galaxies have masses and circular velocities km/s. The circular velocity scale is shown on the top axis, calculated as for a Navarro, Frenk & White (1997) profile; the peak circular velocity would be higher by 20–30% assuming they follow an NFW-like rotation curve. This means that most of these galaxies are unlikely to be suppressed significantly by photoionization (Thoul & Weinberg, 1996), regardless of whether the photoionization field is accurately modeled or not. This is also evident in the baryon fractions; had gas infall been suppressed due to photoionization heating, the baryon fraction would be significantly reduced in smaller systems. We have examined smaller volume ( box size) simulations and we do in fact see significant suppression of the baryon fraction in halos with , which is smaller than any halo with a resolved galaxy in these runs. It should be pointed out that these galaxies and halos grew from smaller systems that may have been more strongly affected by a local radiation field (if it was present) in the past, but for particularly the more massive galaxies it appears they will have spent most of their growth phase in a regime that is broadly unaffected by whether or not a local photoionizing radiation field exists.
4 Clustering and Inhomogenous Reionization
Galaxy clustering is an important ingredient in the reionization process. Early galaxies form within highly biased peaks in the matter distribution, that are highly clustered. This may enhance the inhomogeneity of the reionization process, and may even result in a characteristic bubble size for cosmological HII regions in the early universe (Wyithe & Loeb, 2004; Furlanetto, McQuinn, & Hernquist, 2006). In this section we discuss clustering of our high-redshift galaxies, and the implications for local reionization.
4.1 Evolution of Clustering

Figure 8 (top panel) shows the two-point correlation function from the momentum wind model computed for dark matter (, dashed) and galaxies with stellar mass (, solid). Thin and thick lines indicate and 6, respectively. The redshift evolution of for mass-selected galaxy samples is determined by a competition between the formation of new galaxies in less biased areas and the gravitational growth of matter clustering. As noted at lower redshifts by Weinberg et al. (e.g. 2004), this can have the result that is nearly constant with redshift even though the comoving correlation length of the underlying dark matter increases significantly. This effect can also be seen in the bottom panel of Figure 8, which gives the redshift evolution of the bias . As expected, the bias of the mass-selected sample drops dramatically between and , with the largest evolution occurring at the smallest scales.
We have fitted power laws of the form to the correlation functions for the resolved galaxies and dark matter in each of our simulations. Figure 9 gives the redshift evolution of for the 8, 16, and volumes of the momentum wind runs, with approximate mass ranges as indicated in the caption. The dark matter correlation length is also plotted, multiplied by 10 to increase visibility. We have not attempted to measure the correlation function of the resolved galaxies in the box at because this simulation contains too few resolved galaxies at these redshifts. As anticipated by peak-bias formalism analyses, early galaxies are highly clustered, with a strongly scale-dependent and mass-dependent bias. Galaxy correlation lengths evolve only weakly with redshift, despite the fact that dark matter correlation length doubles from . This suggests that the cumulative effects of photoionization from collections of galaxies may significantly accelerate the reionization process in local regions. In the next section we estimate the strength of this effect.
4.2 Overlapping Galaxy Strömgren Spheres
Before reionization completes, the moment at which the ionized region around a galaxy overlaps with a neighboring galaxy’s ionized region depends on the rate at which the galaxy leaks ionizing photons into its surrounding IGM as well as the distance to the next galaxy. In this section we estimate the size of the ionized regions and compare this to typical distances between galaxies, estimated using a neighbor search as well as from the correlation function, in order to determine whether galaxies’ Strömgren spheres overlap by . Our calculation is similar in spirit to that of Barkana (2002) and Furlanetto, Hernquist, & Zaldariagga (2004), with the main difference being that we will use the gas distribution taken directly from our simulations rather than one based on peak-bias formalism.
In order to estimate how much of the surrounding IGM each galaxy ionizes, we determine how many ionizing photons the galaxies had emitted up to by combining the simulated star formation history of each galaxy with a fit to the number of ionizing photons emitted in the stellar models of Schaerer (2003, equation 1). These models assume a Salpeter initial mass function (IMF) between 1–100 and account for the effects of metallicities down to near metal-free populations. Typically, with this prescription we find that 1 of stars formed by ionizes of gas. This is more than twice the ionized mass that would be expected for solar metallicities (), in accord with Schaerer (2003), which in turn in somewhat more than that expected for a standard Salpeter IMF (Madau et al., 1999). From the number of ionizing photons we determine the mass of gas that would have been reionized assuming a hydrogen mass fraction X=0.75, escape fractions 1 and 0.1, and no recombination (we estimate recombination radii later). Finally, we determine the radius of the sphere around each galaxy in the simulation that encloses this mass of gas, including the galaxy itself. This ionized sphere radius represents a crude estimate of the extent to which a galaxy can ionize its surrounding IGM.
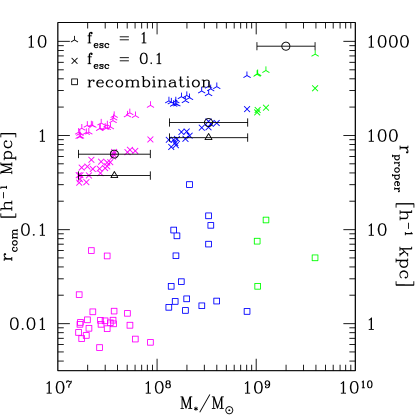
Figure 10 shows, as a function of stellar mass, the size of the ionized sphere around each resolved galaxy in the three momentum wind runs. Triangles and squares correspond to , , respectively; as we discuss below, the latter is probably more relevant, while the former is included to show the sensitivity to this uncertain parameter. These points closely follow a slope . Since the ionizing flux is closely tied to the stellar mass, which in turn is reasonably closely tied to the halo mass (cf. Figure 7) this indicates that the universe is fairly homogeneous at these radii. In words, this plot indicates that galaxies with stellar mass around are capable of ionizing spheres around Mpc (comoving) in size, assuming an escape fraction ; regions ionized by lower-mass galaxies scale in size with the galaxy’s stellar mass roughly as .
Do the ionized regions overlap by ? A brute-force approach to this question is to determine distance to the nearest neighbor for each galaxy in each simulation, take the median, and divide by 2. This distance, which we call the overlap radius , is indicated by the large open circles in Figure 10; the error bars indicate the mass ranges that the samples cover. A slightly more elegant approach is to find the radius of the sphere that is expected to enclose one neighbor using the known mean number density and galaxy autocorrelation function: . Using this approach, we obtain overlap radii given by the open triangles, which are somewhat smaller than that obtained using our brute-force approach. No estimate is made for the largest mass bin because there are too few galaxies at in the run to reliably estimate a correlation function.
Comparing the size of the ionized regions to either overlap radius for each sample indicates that galaxies with stellar masses have already achieved overlap with a similar galaxy by . By contrast, the galaxies in the most massive sample are too rare to have achieved overlap with a similar galaxy at despite the large ionized regions that they can create. By , drops to Mpc for these galaxies so that they do overlap. Nevertheless, since these massive galaxies fall in highly biased regions, it is reasonable to expect that by they will already have achieved overlap with nearby lower-mass galaxies (as argued by e.g. Furlanetto, Hernquist, & Zaldariagga, 2004; Wyithe & Loeb, 2005). This means that their infall region, i.e. the region of space where gas is falling onto that galaxy as opposed to any other, has likely been ionized by then.
Of course, the actual physical situation is considerably more complicated than the simple model we have presented here. First of all, ionizing photons must escape from the galaxy as well as the surrounding dense IGM in which the ionized hydrogen would be able to recombine quickly. An estimate of size of this region is shown as the open squares in Figure 10. This is computed as the radius of the sphere which encloses the mass of gas (including the galaxy) which, had it been ionized very early on, would have been able to recombine within a Hubble time. The recombination time becomes very small close to the galaxy, so in order for the IGM to become ionized, some fraction of the ionizing flux from each galaxy must be permitted to escape beyond this radius. A canonical value for this escape fraction is (cf. Haardt & Madau, 2001), motivating our above choice for this parameter. Our analysis shows that once an ionizing photon does manage to escape into the IGM, the recombination time becomes comparable to a Hubble time and most of the ionized gas can be expected to remain ionized. Recombinations will also reduce the size of the Strömgren sphere somewhat, but for these bubble sizes the effect should not be large (Furlanetto & Oh, 2005).
Further complications that we do not consider in this model are the non-sphericity of the matter distribution that results in a more complex morphology for ionized regions, the fact that the universe is denser at earlier times and therefore the recombination region may actually be somewhat larger, and effects of light-travel time and photon redshifting. A full cosmological radiative transfer hydrodynamics code is required to model all these effects, which is beyond the scope of this paper. We note that a number of radiative transfer calculations for the early universe have already been done (e.g. Gnedin, 2000; Razoumov et al., 2002; Ciardi, Ferrara & White, 2003; Sokasian et al., 2004; Iliev et al., 2005), so we hope to include full modeling of the topology of reionization in the future. But for the purposes of this work, our quasi-analytic modeling is likely to be qualitatively accurate.
In summary, our simulations combined with simplistic modeling suggest that, by , galaxies more massive than are likely to have achieved ionized bubble overlap with other galaxies even if the reionization process has not yet completed in less biased regions. These galaxies should have therefore ionized their infall regions prior to . The overlapping Strömgren spheres should contain within them a photoionizing background strength that is comparable to that estimated by Haardt & Madau (2001). Hence our assumption of a uniform photoionizing background, while not valid for the bulk of the volume, may be reasonably accurate for the regions around the galaxies that we are interested in.
5 Photometric and Emission Line Properties of Galaxies
High-redshift galaxies have mainly been discovered and observed using two techniques: Broad-band colour selection and Ly emission line searches. Broad band selection, usually utilizing the Lyman continuum edge or even the Ly edge at high redshifts, offers the advantage of requiring only photometric surveys. However, galaxies are faint in these broad bands, particularly reionization-epoch objects which require infrared observations that face high sky backgrounds from the ground. Also, the precise redshift cannot be determined, hampering three-dimensional clustering and environmental studies. Ly selection has the advantage that sources may be very bright in young, dust-poor systems as expected in the early universe, they can be found in narrow-band filters that offer low sky background, and a fairly precise redshift is immediately obtained. However, Ly is a difficult line to interpret, as it is easily scattered and extincted, so that even a smattering of dust can result in highly attenuated flux. A full understanding of reionization epoch galaxies will likely require pursuing both approaches. In this section we present the broad band and Ly emission properties of galaxies from our simulations.
5.1 Photometric Properties
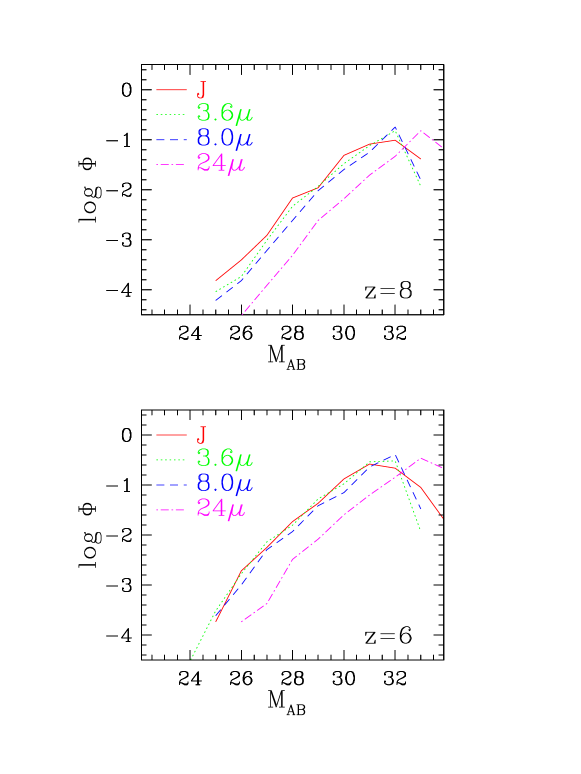
We examine a series of bands redwards of redshifted Ly at , since bluewards bands are expected to be heavily attenuated by intervening neutral hydrogen. Figures 11 and 12 show various luminosity functions (LFs) for the two wind models for bands, corresponding roughly to rest-frame 1500Å to -band at . These LFs have been obtained by stitching together the individual LFs from our three volumes for galaxies above our resolution limit, in a manner similar to that described for mass functions in §2. There is generally good agreement in the overlap regions resulting in a smooth LF from 24th to 32nd magnitudes, although the overlap regions are typically less than a magnitude. The turnover at faint magnitudes arises from our 64 star particle mass resolution limit in our smallest volume.
Figure 11 shows the and predicted LFs in four infrared broad bands. Galaxies are generally blue, with the rest- LF lower by about two magnitudes at both redshifts. Hence while galaxies possess an old stellar population, their light is dominated by young stars. Galaxies at are somewhat bluer than at , as at the rest far-UV LF (observed ) is larger than the rest blue LF (observed ), which is larger than the rest optical (observed ) one; by the LFs for all these bands are similar. Galaxies as bright as 25th magnitude in near-IR bands exist at , but they are quite rare and presumably highly clustered, requiring large-area surveys to find. The steep LFs suggest that modest increases in depth will yield substantially larger samples.
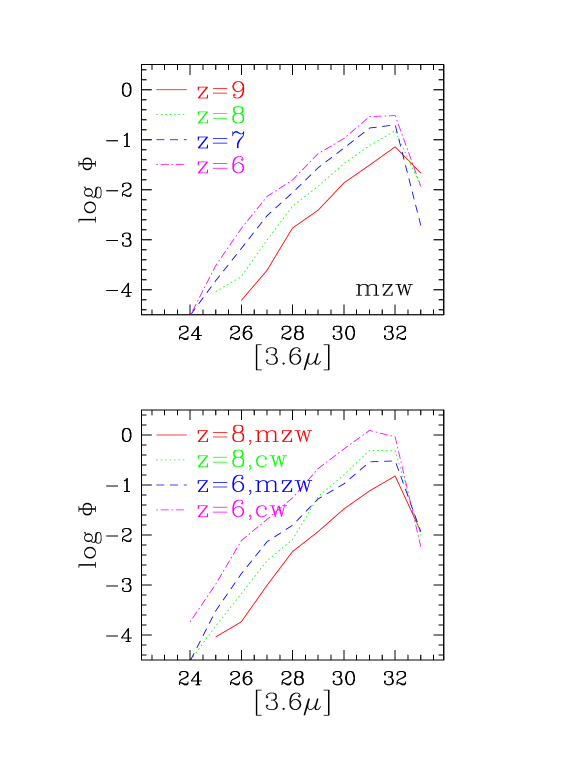
Figure 12 (top panel) shows the evolution of the Spitzer band LF from in the momentum wind model. The LF shows a steady increase, by about three-quarters of a magnitude per unit redshift, slowing a bit from . At the LF looks like a power law, but by it obtains a slight bend, akin to the stellar mass functions in Figure 3. Similar evolution is seen in other bands.
The bottom panel shows a comparison of the and LFs between the momentum wind and the constant wind models. The constant wind model, by virtue of its greater amount of star formation, has higher luminosity functions. The shape is also slightly affected, with the constant wind model showing a steeper faint-end slope. This is a reflection of the stellar fraction varying more with mass in the momentum wind model than in the constant wind case, as shown in Figure 7; the high mass loading factor in small galaxies is suppressing the faint-end slope in the momentum wind model. This may prove advantageous if the trend continues to lower redshifts, since simulated luminosity functions from constant wind simulations at appear to have too steep a faint end compared to observations (Night et al., 2005; Finlator et al., 2005).
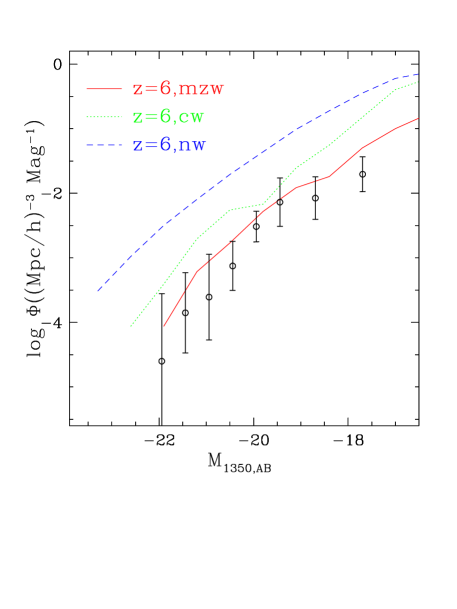
Observations of galaxies are already rapidly accumulating. Bouwens et al. (2006) found over 500 systems in Hubble NICMOS and ACS parallel fields that satisfy -dropout Lyman break selection criteria. Of course, some are probably interlopers, but they estimate a rather small level of contamination (). Figure 13 shows a comparison of our luminosity functions computed at rest-frame 1350Å to their observations. Overall, the agreement in both shape and amplitude is quite impressive, particularly for the momentum wind model (solid line). Note that no parameters have been tuned specifically to obtain this agreement. The no wind model (dashed line) overpredicts the number of galaxies at a all luminosities by well over an order of magnitude, showing that feedback must suppress galaxy formation at all masses in order to match observations. Bouwens et al. (2004) detected a handful of systems down to , and found that the evolution from is about a factor of five in number; we predict (cf. Figure 12) a factor of increase from , so the observed evolution is not inconsistent with our models, though this bears further examination down to .
While this comparison favors the momentum wind model at face value, it is worth recognizing that the number of high-redshift galaxies is sensitive to the CDM power spectrum on small scales, which is still not precisely constrained. For instance, early galaxy formation can be significantly suppressed in warm dark matter (Yoshida et al., 2003a) or running spectral index (Yoshida et al., 2003b) models. Since these CDM variants remain viable at present (though increasingly disfavored; Seljak et al., 2004), we do not claim to constrain our feedback models based on galaxy abundances. Furthermore, the new WMAP3 data favors a slightly lower matter power spectrum at these redshift at the relevant scales, which would lower our predicted LFs. Hence we leave a more quantitative study of this for future work. Here we simply note that our models broadly agree with existing observations of LFs, and with improvements in cosmological parameter precision such data could play a key role in constraining models of early galaxy formation.
5.2 Sample Galaxy Spectra

Thanks to unprecedented sensitivities of Spitzer and other near-infrared instruments, it has now become possible to study the stellar populations of galaxies at at some level of detail through multi-band photometry spanning into the rest-optical. This provides even more stringent tests on our simulated galaxy population. Here we examine the rest-UV and optical spectra for a few of our simulated galaxies. These spectra are obtained from Bruzual & Charlot (2003) population synthesis models using the Padova 1994 models and a Chabrier IMF, where each star particle in a galaxy is treated as a single stellar population whose age is computed from the star particle’s time of creation. The single-burst stellar population spectra of a given galaxy are then summed to obtain that galaxy’s spectrum. We interpolate the population synthesis models to the stellar metallicity of each galaxy. Note that we are not employing a top-heavy IMF, since the metallicities of these galaxies fall within the range where there are no compelling arguments for deviations from locally-derived IMFs.
Figure 14 shows a selected sample of spectra from the simulation at . As can be seen, most of these systems possess a significant old stellar population as evidenced by a significant 4000Å break, and have a continuum that is typically slightly blue through the rest-UV, consistent with the LFs shown in Figure 12. There is some variation in the continuum shape due to the details of individual star formation histories, but overall there is no trend with mass, because the birthrates of galaxies are similar at all masses (cf. Figure 4). Indeed, these galaxies look not terribly dissimilar to present-day star forming galaxies, with the exception of their low luminosity (and of course no emission lines since these are not present in the Bruzual & Charlot models).
Recently, Egami et al. (2005) observed a putative object found though a cluster lens search (Kneib et al., 2004) in Spitzer and Hubble near-IR bands. They showed that this system was best modeled as having of stars with a substantial old stellar population. Their data, corrected downwards by a factor of 25 for lensing magnification, are shown as the data points in Figure 14. A galaxy randomly drawn from our momentum wind simulation having a stellar mass of just so happens to be an excellent match to these data. This galaxy has a star formation rate of /yr, a median stellar age of 130 Myr, and one-tenth solar metallicity, which are all typical values for a galaxy of this size in our simulations. They are also consistent with values inferred from a more detailed analysis of this object by Schaerer & Pello (2005). This shows that galaxies like the Egami et al. object are not only expected, but are fairly common and typical systems at this epoch.
Another object, a lensed Ly emitter found by Hu et al. (2002), was followed up with Spitzer by Chary, Stern & Eisenhardt (2005), who found that its spectrum is similar in shape but intrinsically somewhat brighter than the Egami et al. object. Not surprisingly, it is possible to find simulated galaxies with that match most of the broad-band data for this object as well. However, this object does have a peculiarly high IRAC flux. By fitting a model to the remaining data and assuming the excess flux is due to unresolved H line emission, Chary et al. estimate a star formation rate of yr. This star formation rate would be far above that expected for galaxies of this mass (cf. Figure 4), so if confirmed this would present a challenge to our models. However, this object was also analyzed by Schaerer & Pello (2005) prior to the Spitzer data becoming available, and their estimated star formation rate is yr, much more in line with our simulations. Another object, the claimed detection of a system with a photometric redshift of by Mobasher et al. (2005), would be difficult for our models, or indeed any CDM-based model, to reproduce, as the expected space density of such systems is less than one per cubic gigaparsec. However, other groups favor a substantially lower redshift (and lower mass) for this object, so it remains to be seen if this galaxy will indeed force revisions to our cosmology.
5.3 Ly Emission
Ly emission galaxies are now being detected out to using narrow-band surveys (Hu et al., 2002; Malhotra & Rhoads, 2004; Stern et al., 2005). Higher redshifts move into the infrared, where current space-based observatories do not have sufficient collecting areas to detect these faint sources, necessitating ground-based observations through a bright night sky. Fortunately, there are some relatively clean, albeit narrow, windows between water and OH lines where the sky background is low (see e.g. Barton et al., 2004). A number of narrow-band surveys are underway to take advantage of these windows to search for Ly emitters at (Barton et al., 2004; Horton et al., 2004; Willis et al., 2005; Stark & Ellis, 2005). In this section, we make predictions for the Ly emitter population from our simulations for comparison with such observations.
As discussed in Barton et al. (2004), there are large uncertainties regarding the detectability of Ly emission from star formation. Scattering due to the surrounding IGM including the damping wing may make Ly emission more diffuse and difficult to detect. As we showed in §3.4, significant metals are expected to be present, so dust extinction may be considerable, unless the ISM remains surprisingly unmixed. On the other hand, if the initial mass function is extremely top-heavy, then perhaps Ly emission can be boosted.
To make predictions for Ly luminosity functions from our simulations, we convert the instantaneous star formation rate of each galaxy into a Ly luminosity using a fit to the models listed in Table 4 of Schaerer (2003). In particular, we use a solar metallicity Ly emission value of erg s-1 yr, and then correct for individual galaxy metallicities using equation 1 of Schaerer (2003). Of course, not all Ly photons emitted by young stars will actually reach us; there is an escape fraction that is highly uncertain. Note that by “escape fraction” here we mean the fraction of Ly photons that reach our telescopes, not the fraction that escapes from the star forming region or galaxy itself that is canonically around 10%. The escape fraction depends on the amount of scattering and absorption in the ISM and IGM along the line of sight, which is difficult to predict directly.
Here we take the approach of constraining this escape fraction empirically by comparing our predicted Ly luminosity function with data from Santos (2004). They used Keck/LRIS to obtain spectra of objects in high-magnification regions of foreground clusters, and found 11 likely (7 confirmed) Ly emitters with . Lensing magnification offers the best current technique for detecting faint sources, and indeed these objects represent the faintest Ly emitters currently known. The downside is that lensing results in a considerably smaller volume being probed.
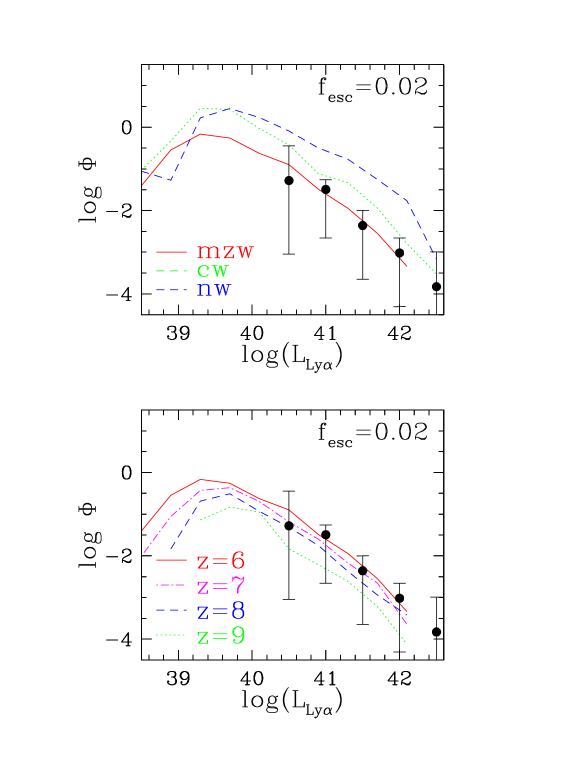
In Figure 15 we present simulated luminosity functions for Ly emitters from the three wind models (top panel) and the evolution from in the momentum wind model (bottom panel). We choose an escape fraction of 2% for Ly photons that would be detectable by us, which is selected to obtain agreement with the Santos (2004) observations (using all 11 likely sources) in the momentum wind case, shown as the data points. For the constant wind case, an escape fraction of 0.5% is an equivalently good fit, and for the no wind case the best-fit escape fraction is around 0.2%. Note that the escape fraction tunes only the amplitude of the luminosity function, while the slope remains an independent prediction of the models (assuming that the escape fraction is not luminosity-dependent). Therefore the excellent agreement from is encouraging. Though the Santos et al. data would be more appropriately compared to predictions, Hu et al. (2005) has demonstrated that there is no discernible evolution in the Ly luminosity function from , so the comparison to our simulated sample should be reasonably valid.
Malhotra & Rhoads (2004) and Hu et al. (2005) also argue that the lack of evolution from to would be surprising if the universe was predominantly neutral at , since the damping wings from IGM absorption would significantly reduce the flux and change the line profiles. Even if the bulk of the universe is neutral, it is possible that the bright Ly sources seen at may have ionized their local surroundings, facilitating the escape of Ly photons (Haiman, 2002; Santos, 2004). In either scenario, it appears Ly emission will continue to escape from galaxies and be detectable into the reionization epoch. Our crude estimates of the local photoionization volume in Figure 10 supports the idea that even out to , IGM damping wing encroachment may not significantly attenuate Ly emission, which agrees with conclusions reached by various semi-analytic studies (Furlanetto, Hernquist, & Zaldariagga, 2004; Wyithe & Loeb, 2005; Malhotra & Rhoads, 2005).
If we take our estimated escape fraction at and assume that it does not evolve with redshift, then there is relatively little evolution predicted from , as shown in the bottom panel of Figure 15. This scenario is broadly consistent with Hu et al.’s lack of observed evolution to lower redshifts. At a given number density, the evolution is around a factor of three in luminosity between , or equivalently a factor of five in number density at a given luminosity. This means that surveys designed to probe will still have plenty of candidate targets, they must “merely” go deeper than those at .
One instrument that is being currently developed to probe Ly emitters in the reionization epoch is the Dark Ages Ly Explorer, or DAzLE (Horton et al., 2004), set to begin operation in 2006. Using an survey in J-band night sky windows on the Very Large Telescope, DAzLE will survey 6.8’x6.8’ patches down to erg s-1cm-2 in the redshift range . We can make predictions for the atmospheric window, with a redshift range of over which the sky is relatively dark (see Barton et al., 2004, for a diagram of the J-band night sky spectrum). Here, their flux limit translates to erg/s, and the window’s volume for the DAzLE field is . Our predicted source density above this flux limit is approximately , so DAzLE should expect to see around 5 sources per field within this night sky window. The numbers are similar for the window, which is a bit wider but further away, and the window which has but half as many predicted sources than at . These numbers are not large, but with a few adjacent fields it may be sufficient to do preliminary clustering studies to possibly constrain the patchiness of reionization. If no objects are seen, this would suggest that the escape fraction is dropping substantially to higher redshifts, whereas an abundance of objects would signify a dramatic change in the IMF or dust content of systems. More accurate predictions for detailed comparisons will require the development of Ly radiative transfer codes including dust extinction (e.g. Tasitsiomi, 2006).
Another key design issue is the expected line widths of Ly emission. Since halos at this epoch have circular velocities typically less than (cf. Figure 7), the naive expectation is that emission line widths will not be significantly larger than this. It may be significantly smaller if the emission region (or last scattering surface) is not sampling the full potential well, as seen e.g. for Lyman break galaxies at (Pettini et al., 2001). Conversely, it could be larger if outflows stimulate Ly emission, or if radiative transfer effects smear out the emission region beyond the galaxy’s host halo, though these scenarios seem relatively improbable. Hence it is likely (but not guaranteed) that an instrument with such as DAzLE would not resolve out Ly emission lines, which makes internal kinematic studies difficult but is preferable for source detection.
In summary, the Ly emission properties of galaxies are an interesting way to constrain the topology and efficiency of reionization. Our simulations suggest that Ly emitters will be observable out to with current technology, assuming that galaxies sufficiently ionize their surroundings so that the escape fraction is similar to that at . Detection of these objects appears feasible in the near future, which should provide crucial insights into the reionization epoch.
5.4 Next Generation Instruments
A key science goal of JWST is to image the objects responsible for reionizing the universe. The NIRCam team has a galaxy formation program designed to image galaxies (Rieke et al., 2003). The survey will have 50ks exposures in six near-IR filters, and 100ks in their 4.4 filter. The expected depths achieved will be roughly 1 nJy, or 31.4 AB magnitudes, across these bands. They then plan to do follow-up emission line studies on selected high- objects.
Our simulated luminosity functions are coincidentally resolved down to about 1 nJy, so we can make general predictions for the types of objects that will be observed by such a survey. For starters, the predicted number density will be large: At , each 2.3’x2.3’ field will contain over 400 galaxies per unit redshift (cf. Figure 11), which should be straightforwardly identifiable as B1-band dropouts (see Rieke et al., 2003, for filter set). Note that while large, these numbers are still smaller than previous estimates: The semi-analytic model of Barkana & Loeb (2000) predicts many thousands of galaxies down to 1 nJy. The main difference is our suppression of star formation through superwinds, which appears to be necessary in order to match observed luminosity functions (cf. Figure 13). We also predict galaxies will be strongly clustered, but as each NIRCam field is over (comoving) on a side which is longer than the correlation length (cf. Figure 9), the field-to-field variations should not be too large. The physical properties of the observed galaxies are likely to be what we have described so far: Mildly enriched systems living in halos of masses , with the smallest stellar masses observed being a few. It is not expected that even the faintest of these objects will push into the regime of predominantly metal-free star formation with little or no dust, though such objects may enter into the survey if their stars are exceptionally bright. In short, these are not the primeval galaxies you’re looking for.
Turning to Ly emitters, the expected faintness of these systems requires larger collecting areas, and fortunately work is already underway on the 22m Giant Magellan Telescope (http://www.gmto.org), among others. Such a telescope with an near-IR tunable narrow-band capability would probe an order of magnitude fainter than DAzLE (Barton et al., 2004) resulting in more sources, equivalent in space density to th magnitude objects. Such spectral resolution may enable kinematic studies as well. Such capabilities promise to move Ly emitter searches from a handful of discovery objects into the realm of large statistical samples for detailed studies.
6 Summary
We have presented results for the physical and observable properties of reionization epoch galaxies from cosmological hydrodynamic simulations. Our simulations naturally produce an early epoch of star formation that yields significant numbers of reionization-epoch galaxies, in broad agreement with available observations. We find that:
-
•
Systems with in stars are common by , and by systems with have a similar space density to luminous red galaxies today. The mass functions have a steep faint end initially, but become somewhat shallower in time, particularly in our favored wind feedback model.
-
•
Star formation rates are well correlated with stellar masses, such that the stellar birthrates show almost no trend with mass at these epochs, modulo the impact of stochasticity in star formation caused by merger-related processes. At , the stellar mass doubling time for galaxies is around 0.2 Gyr, while at it is Gyr. Star formation rates at range from hundredths to tens of solar masses per year.
-
•
The large stellar masses imply significant metal enrichment in these systems. While they are generally subsolar and can be comparable to the lowest metallicity dwarfs today such as I Zw 18, their metallicities are still well above the putative threshold for ushering in a more normal IMF as compared to a top-heavy IMF proposed for Population III stars. We predict few if any near metal-free stars forming in these systems.
-
•
The halos containing these galaxies have masses well above , meaning that their virial temperatures exceed the primordial cooling limit of , and hence atomic lines are the dominant coolant. Their baryon content is somewhat below the global average due to feedback, and different feedback recipes can produce factors of three differences in the stellar content, depending on mass. Their circular velocities are , implying that these galaxies are unlikely to be significantly affected by photoionization.
-
•
Galaxies at this epoch are highly biased and highly clustered, with a strongly mass-dependent clustering strength and scale-dependent bias. The rapid growth of matter clustering is offset by a rapidly dropping bias, producing a relatively constant comoving correlation length. Galaxies are sufficiently clustered that they are likely to lie in regions that have been locally reionized at a much earlier epoch than the time of final cosmological \textH ii region overlap.
-
•
The broad-band properties of these galaxies show that they are generally fairly blue systems, getting bluer to higher redshifts. Hence the optimal detection band will be the one that is just redwards of Ly. There is evolution of about magnitudes per unit redshift in near-IR bands. Predicted number densities vary by depending on the wind model, but the evolution is generally similar.
-
•
Predictions of Ly emitters are less robust because of large uncertainties in Ly transfer out of these systems. Assuming a Ly emission detectability similar to that observed at , then surveys with expected sensitivities of future 20-30m class telescopes will find an equivalent number density of objects as near-infrared surveys down to st magnitude AB. Hence Ly narrow-band surveys can be a powerful tool for obtaining large samples of reionization epoch objects.
-
•
Our simulations show good agreement with observations of objects. Individual galaxy broad band spectra have been observed (e.g. Egami et al., 2005) that are well-matched by simulated galaxies, showing the requisite continuum slope and 4000Å break. Our luminosity function agrees well with observations by Bouwens et al. (2006), particularly for our momentum wind model (modulo uncertainties regarding the exact amplitude of the matter power spectrum). The Ly luminosity function at is in good agreement with observations by Santos (2004), for a reasonable Ly escape fraction of 2%. We look forward to comparisons with future data to provide more stringent constraints for our models.
The outlook for detecting large numbers of reionization epoch objects is promising. Current Hubble data can achieve depths of 28.5 in near-IR bands (Bouwens et al., 2006), albeit in small fields. In addition to Webb, several future space-based telescopes have been proposed that will do large-area near-IR surveys, including some versions of JDEM (Joint Dark Energy Mission), as well as the proposed Galaxy Evolution Probe (R. Thompson, PI). Though these missions remain firmly in the distant and uncertain future, the scientific richness of deep wide near-IR surveys ensures that they are likely to be accomplished at some point. On the Ly emitter side, a number of operational instruments should begin detecting a handful of systems in the immediate future, but surveys in near-IR night sky windows on future 20-30m class telescopes should bring these studies to maturity. The timescales for such facilities are of the same order as the space-based infrared ones, so it will be an interesting race to see which technique matures first. The future looks bright for lifting the veil of reionization and probing the final frontier of observational cosmology.
Acknowledgements
A catalog of resolved galaxies from the simulations presented here, with photometry, spectra, and all physical properties, is available upon request. The simulations used here were run on the Xeon Linux Supercluster at the National Center for Supercomputing Applications. This work was supported in part by Hubble theory grant HST-AR-10647.01-A. Partial support for this work, part of the Spitzer Space Telescope Theoretical Research Program, was provided by NASA through a contract issued by the Jet Propulsion Laboratory, California Institute of Technology under a contract with NASA. We thank V. Springel and L. Hernquist for providing us with Gadget-2. We thank E. Barton, C. Papovich, D. Eisenstein, N. Katz, D. Keres, M. Rieke, J.-D. Smith, and D. Weinberg for helpful discussions.
References
- Abel, Bryan, & Norman (2000) Abel, T., Bryan, G. L., & Norman, M. L. 2000, ApJ, 540, 39
- Barkana (2002) Barkana, R. 2002, NewA, 7, 85
- Barkana & Loeb (2004) Barkana, R. & Loeb, A. 2004, ApJ, 609, 474
- Barkana & Loeb (2001) Barkana, R. & Loeb, A. 2001, PhR, 349, 125
- Barkana & Loeb (2000) Barkana, R. & Loeb, A. 2000, ApJ, 539, 20
- Barkana & Loeb (1999) Barkana, R. & Loeb, A. 1999, ApJ, 523, 54
- Barton et al. (2004) Barton, E. J., Davé, R., Smith, J.-D. T., Papovich, C., Hernquist, L., & Springel, V. 2004, ApJ, 604, L1
- Bouwens et al. (2004) Bouwens, R. J., Thompson, R. I., Illingworth, G. D., Franx, M., van Dokkum, P. G., Fan, X., Dickinson, M. E., Eisenstein, D. J., Rieke, M. J. 2004, ApJ, 616, L79
- Bouwens et al. (2006) Bouwens, R. J., Illingworth, G. D., Blakeslee, J. P., & Franx, M. 2006, ApJ, in press, astro-ph/0509641
- Bromm & Larson (2004) Bromm, V. & Larson, R. B. 2004, ARA&A, 42, 79
- Bruzual & Charlot (2003) Bruzual, G. & Charlot, S. 2003, MNRAS, 344, 1000
- Bunker et al. (2004) Bunker, A. J., Stanway, E. R., Ellis, R. S., McMahon, R. G. 2004, MNRAS, 355, 374
- Cen (2003) Cen, R. 2003, ApJl, 591, L5
- Chary, Stern & Eisenhardt (2005) Chary, R.-R., Stern, D., & Eisenhardt, P. 2005, ApJl, in press, astro-ph/0510827
- Ciardi, Ferrara & White (2003) Ciardi, B., Ferrara, A., & White, S. D. M. 2003, MNRAS, 344, L7
- Davé et al. (2005) Davé, R., Finlator, K., Hernquist, L, Katz, N., Keres, D., Papovich, C., & Weinberg, D. H. 2005, in proc. ”The Fabulous Destiny of Galaxies”, ed. V. Le Brun
- Dekel & Silk (1986) Dekel, A. & Silk, J. 1986, ApJ, 303, 39
- Di Matteo, Springel, & Hernquist (2005) Di Matteo, T., Springel, V., & Hernquist, L. 2005, Nature, 433, 604
- Egami et al. (2005) Egami, E. et al. 2005, ApJ, 618, L5
- Eisenstein & Hu (1999) Eisenstein, D. J. & Hu, W. 1999, ApJ, 511, 5
- Erb et al. (2006) Erb, D. K., Shapley, A. E., Pettini, M., Steidel, C. C., Reddy, N. A., & Adelberger, K. L. 2006, ApJ, in press, astro-ph/0602473
- Fan et al. (2001) Fan, X., et al. 2001, AJ, 122, 2833
- Fan et al. (2002) Fan, X., Narayanan, V. K., Strauss, M. A., White, R. L., Becker, R. H., Pentericci, L., Rix, H.-W. 2002, AJ, 123, 1247
- Fan et al. (2004) Fan, X., et al. 2004, AJ, 128, 515
- Finlator et al. (2005) Finlator, K., Davé, R., Papovich, C., & Hernquist, L. 2005, ApJ, submitted, astro-ph/0507719
- Fontana et al. (2003) Fontana, A., Poli, F., Menci, N., Nonino, M., Giallongo, E., Cristiani, S., D’Odorico, S. 2003, ApJ, 587, 544
- Furlanetto, Hernquist, & Zaldariagga (2004) Furlanetto, S. R., Hernquist, L., & Zaldarriaga, M. 2004, MNRAS, 354, 695
- Furlanetto & Oh (2005) Furlanetto, S. R. & Oh, S. P. 2005, MNRAS, 363, 1031
- Furlanetto, McQuinn, & Hernquist (2006) Furlanetto, S. R., McWuinn, M., & Hernquist, L. 2006, MNRAS, 365, 115
- Gnedin (2000) Gnedin, N. Y. 2000, ApJ, 535, 530
- Haardt & Madau (2001) Haardt, F. & Madau, P. 2001, in proc. XXXVIth Rencontres de Moriond, eds. D.M. Neumann & J.T.T. Van.
- Haiman (2002) Haiman, Z. 2002, ApJ, 576, L1
- Haiman (2005) Haiman, Z. 2005, PThPS, 158, 86
- Hernquist & Springel (2003) Hernquist, L. & Springel, V. 2003, MNRAS, 341, 1253
- Hopkins (2004) Hopkins, A. M. 2004, ApJ, 615, 209
- Horton et al. (2004) Horton, A., et al. 2004, in proc. SPIE v.5492, astro-ph/0409080
- Hu et al. (2002) Hu, E. M., Cowie, L. L., McMahon, R. G., Capak, P., Iwamuro, F., Kneib, J.-P., Maihara, T., Motohara, K., 2002, ApJ, 568, L75
- Hu et al. (2005) Hu, E. M., Cowie, L. L., Capak, P., & Kakazu, Y. 2005, in IAU 199 Conf. Proc.: ”Probing Galaxies through Quasar Absorption Lines,” eds. Williams, Shu, Menard
- Iliev et al. (2005) Iliev, I. T., Mellema, G., Pen, U.-L., Merz, H., Shapiro, P. R., Alvarez, M. A. 2005, MNRAS, submitted, astro-ph/0512187
- Jimenez & Haiman (2006) Jimenez, R. & Haiman, Z. 2006, Nature, in press, astro-ph/0602450
- Kennicutt (1998) Kennicutt, R. C. 1998, ApJ, 498, 541
- Keres et al. (2005) Keres, D., Katz, N., Weinberg, D. H., & Davé, R. 2005, MNRAS, in press
- Kneib et al. (2004) Kneib, J.-P., Ellis, R. S., Santos, M. R., & Richard, J. 2004, ApJl, 568, L75
- Kolatt et al. (1999) Kolatt, T. S., Bullock, J. S., Somerville, R. S., Sigad, Y., Jonsson, P., Kravtsov, A. V., Klypin, A. A., Primack, J. R., Faber, S. M., Dekel, A. 1999, ApJ, 513, L109
- Loeb & Barkana (2001) Loeb, A. & Barkana, R. 2001, ARA&A, 39, 19
- Madau (1995) Madau, P. ApJ, 441, 18
- Madau et al. (1996) Madau, P., Ferguson, H. C., Dickinson, M. E., Giavalisco, M., Steidel, C. C., Fruchter, A. 1996, MNRAS, 283, 1388
- Madau et al. (1999) Madau, P., Haardt, F., & Rees, M. J. 1999, ApJ, 514, 648
- Malhotra & Rhoads (2004) Malhotra, S. & Rhoads, J. 2004, ApJ, 617, L5
- Malhotra & Rhoads (2005) Malhotra, S. & Rhoads, J. 2005, ApJL, submitted, astro-ph/0511196
- Maolino et al. (2004) Maiolino, R., Schneider, R., Oliva, E., Bianchi, S., Ferrara, A., Mannucci, F., Pedani, M., & Roca Sogorb, M. 2004, Nature, 431, 533
- Martin (2005) Martin, C. L. 2005, ApJ, 621, 227
- McKee & Ostriker (1977) McKee, C. F. & Ostriker, J. P. 1977, ApJ, 218, 148
- Murray, Quatert, & Thompson (2005) Murray, N., Quatert, E., & Thompson, T. A. 2005, ApJ, 618, 569
- Mobasher et al. (2005) Mobasher, B. et al. 2005, ApJ, in press, astro-ph/0509768
- Navarro, Frenk & White (1997) Navarro, J. F., Frenk, C. S. & White, S. D. M. 1997, ApJ, 490, 493
- Night et al. (2005) Night, C., Nagamine, K., Springel, V., & Hernquist, L. 2005, MNRAS, accepted, astro-ph/0503631
- Oppenheimer & Davé (2006) Oppenheimer, B. D. & Davé, R. 2005, in preparation
- Page et al. (2006) L. Page et al., ApJ, submitted, astro-ph/0603450
- Papovich et al. (2005) Papovich, M. et al. 2005, ApJ, submitted
- Pettini et al. (2001) Pettini, M., Shapley, A. E., Steidel, C. C., Cuby, J.-G., Dickinson, M., Moorwood, A. F. M., Adelberger, K. L., Giavalisco, M. 2001, ApJ, 554, 981
- Razoumov et al. (2002) Razoumov, A. O., Norman, M. L., Abel, T., Scott, D. 2002, ApJ, 572, 695
- Rieke et al. (2003) Rieke, M. et al. 2003, SPIE, 4850, 478
- Rhoads & Malhotra (2004) Rhoads, J. & Malhotra, S. 2004, ApJ, 617, L5
- Santos (2004) Santos, M. R. 2004, MNRAS, 349, 1137
- Santos et al. (2004) Santos, M. R., Ellis, R. S., Kneib, J.-P., Richard, J., Kuijken, K. 2004, ApJ, 606, 683
- Schaerer (2003) Schaerer, D. 2003, A&A, 397, 527
- Schaerer & Pello (2005) Schaerer, D. & Pello, R. 2005, MNRAS, 362, 1054
- Seljak et al. (2004) Seljak, U. et al. 2004, PhRvD, 71, 3515
- Seljak et al. (2006) Seljak, U., Slosar, A., McDonald, P. 2006, astro-ph/0604335
- Shapley et al. (2003) Shapley, A. E., Steidel, C. C., Pettini, M., & Adelberger, K. L. 2003, ApJ, 588, 65
- Sigward, Ferrara, & Scannapieco (2005) Sigward, F., Ferrara, A., & Scannapieco, E. 2005, MNRAS, 358, 755
- Sokasian et al. (2004) Sokasian, A., Yoshida, N., Abel, T., Hernquist, L., & Springel, V. 2004, MNRAS, 350, 47
- Spergel et al. (2003) D. N. Spergel et al., ApJS, 148, 175
- Spergel et al. (2006) D. N. Spergel et al., ApJ, submitted, astro-ph/0603449
- Springel & Hernquist (2003a) Springel, V. & Hernquist, L. 2003a, MNRAS, 339, 289
- Springel & Hernquist (2003b) Springel, V. & Hernquist, L. 2003b, MNRAS, 339, 312
- Springel (2005) Springel, V. 2005, MNRAS, 364, 1105
- Springel, Di Matteo, & Hernquist (2005b) Springel, V., Di Matteo, T., & Hernquist, L. 2005, ApJ, 620, L79
- Stark & Ellis (2005) Stark, D. P. & Ellis, R. S. 2005, in proc. ”First Light & Reionization”, eds. E. Barton & A. Cooray, New Astronomy Reviews, astro-ph/0508123
- Stern et al. (2005) Stern, D. et al. 2005, ApJ, 619, 12
- Sutherland & Dopita (1993) Sutherland, R. S. & Dopita, M. A. 1993, ApJS, 88, 253
- Tasitsiomi (2006) Tasitsiomi, A. 2006, ApJ, in press, astro-ph/0510347
- Tegmark et al. (2004) Tegmark, M. et al. 2005, PhRvD, 69, 3501
- Thoul & Weinberg (1996) Thoul, A. A. & Weinberg, D. H. 1996, ApJ, 465, 608
- Tremonti et al. (2004) Tremonti, C. A., Heckman, T. M., Kauffmann, G., et al. 2004, ApJ, 613, 898
- Weinberg et al. (1999) Weinberg, D. H., Davé, R., Gardner, J. P., Hernquist, L., & Katz, N. 1999, in ”Photometric Redshifts and High Redshift Galaxies”, eds. R. Weymann, L. Storrie-Lombardi, M. Sawicki & R. Brunner, (San Francisco: ASP Conf. Series v.191), p.341
- Weinberg et al. (2004) Weinberg, D. H., Davé, R., Katz, N., & Hernquist, L. 2004, ApJ, 601, 1
- Willis et al. (2005) Willis, J. P., Courbin, F., Kneib, J.-P., Minniti, D. 2005, in proc. ”First Light & Reionization”, eds. E. Barton & A. Cooray, New Astronomy Reviews, astro-ph/0509600
- Wyithe & Loeb (2004) Wyithe, J. S. B. & Loeb, A. 2004, Nature, 432, 194
- Wyithe & Loeb (2005) Wyithe, J. S. B. & Loeb, A. 2005, ApJ, 625, 1
- Yoshida et al. (2003a) Yoshida, N., Sokasian, A., Hernquist, L, & Springel, V. 2003a, ApJ, 591, L1
- Yoshida et al. (2003b) Yoshida, N., Sokasian, A., Hernquist, L, & Springel, V. 2003b, ApJ, 598, 73
- Zehavi et al. (2005) Zehavi, I., et al. 2005, ApJ, 621, 22