The Role of the Dust in Primeval Galaxies:
A Simple Physical Model for Lyman Break Galaxies and
Ly Emitters.
Abstract
We explore the onset of star formation in the early Universe, exploiting the observations of high-redshift Lyman-break galaxies (LBGs) and Ly emitters (LAEs), in the framework of the galaxy formation scenario elaborated by Granato et al. (2004) already successfully tested against the wealth of data on later evolutionary stages. Complementing the model with a simple, physically plausible, recipe for the evolution of dust attenuation in metal poor galaxies we reproduce the luminosity functions (LFs) of LBGs and of LAEs at different redshifts. This recipe yields a much faster increase with galactic age of attenuation in more massive galaxies, endowed with higher star formation rates. These objects have therefore shorter lifetimes in the LAE and LBG phases, and are more easily detected in the dusty submillimeter bright (SMB) phase. The short UV bright lifetimes of massive objects strongly mitigate the effect of the fast increase of the massive halo density with decreasing redshift, thus accounting for the weaker evolution of the LBG LF, compared to that of the halo mass function, and the even weaker evolution between and of the LAE LF. The much lower fraction of LBGs hosting detectable nuclear activity, compared to SMB galaxies, comes out naturally from the evolutionary sequence yielded by the model, which features the coevolution of galaxies and active nuclei. In this framework LAEs are on the average expected to be younger, with lower stellar masses, more compact, and associated to less massive halos than LBGs. Finally, we show that the intergalactic medium can be completely reionized at redshift by massive stars shining in protogalactic spheroids with halo masses from a few to a few , showing up as faint LBGs with magnitude in the range , without resorting to any special stellar initial mass function.
Subject headings:
galaxies: evolution – galaxies: formation – galaxies: high-redshift – galaxies: luminosity function – intergalactic medium1. Introduction
The impressive recent advances in the observational studies of high redshift galaxies and quasars have brought us up to the outskirts of ‘dark ages’, when the amount of neutral intergalactic hydrogen starts becoming significant and tentative indications of the presence of metal-free population III stars begin to show up. This may give us some confidence that we are approaching the onset of the galaxy formation history and provides key information on physical processes driving the early galaxy evolution and on their influence on the intergalactic medium (IGM).
Different techniques and selection criteria have been exploited to find high- galaxies. A most efficient method is the Lyman break dropout technique (Steidel & Hamilton 1993), first applied to select galaxies (Steidel et al. 1996; Lowenthal et al. 1997) and subsequently extended to redshifts of up to (Steidel et al. 1999, 2003; Dickinson et al. 2004; Giavalisco et al. 2004; Ouchi et al. 2004; Bunker et al. 2004; Vanzella et al. 2005, 2006; Bouwens et al. 2005; Thompson et al. 2006; Bouwens & Illingworth 2006a,b).
Very deep narrow band imaging at selected redshift windows (Cowie & Hu 1998) has also been successfully used to search for Ly emission up to (Ouchi et al. 2003; Kashikawa et al. 2006b; Shimasaku et al. 2006; Iye et al. 2006).
While these techniques are sensitive to unobscured or moderately obscured objects, very dusty distant galaxies with extremely high star formation rates (SFRs) have been detected by SCUBA m surveys (see e.g. Chapman et al. 2005; Aretxaga et al. 2007). Substantial numbers of passively evolving high- galaxies have also been found (Fontana et al. 2006; Grazian et al. 2007).
The different selections emphasize different aspects of the early galaxy evolution that need to be integrated in a unified view. In this paper we present a simple physical model featuring an evolutionary link between Ly selected (LAE), Lyman break (LBG), submillimeter bright (SMB), and passively evolving galaxies, establishing quantitative relations between luminosities and basic physical quantities such as stellar and halo masses, star formation rates, galactic ages, metal abundances and dust attenuation111We follow the convention, increasingly adopted in the recent literature, of using the term ‘attenuation’ rather than ‘extinction’ to indicate the difference in magnitudes between the observed and intrinsic starlight, which is the final result of the interplay between the dust properties and the complex relative geometry of stars and dust. The term ‘extinction’ is reserved to the idealized situation in which a single source is attenuated by a thin screen of dust.. The model extends to earlier evolutionary phases the approach by Granato et al. (2004), according to which the evolution of massive galaxies is tightly linked to the growth of the supermassive BHs at their centers. The model has successfully accounted for an extremely large amount of observational data on galaxies and quasars (Granato et al. 2004, 2006; Cirasuolo et al. 2005; Silva et al. 2005; Lapi et al. 2006; see Appendix A for details).
An extension of the model to the earliest evolutionary phases, when metals were first produced, requires a specific treatment of dust attenuation, which plays an important role in the derivation of high- galaxy properties, since even small amounts of dust strongly affect the rest-frame UV emission. For example, a correction for dust attenuation corresponding to would increase the estimate of the SFR at by a factor of about . The presence of significant attenuation in high- LBGs has indeed been reported by many authors (e.g., Steidel et al. 1999; Shapley et al. 2001, 2006; Huang et al. 2005; Ando et al. 2006; Yan et al. 2006; Burgarella et al. 2006; Eyles et al. 2007; Stark et al. 2007b), not surprisingly since the dust formation in early galaxies is expected to occur on very short timescales (Morgan & Edmunds 2003).
The outline of the paper is the following. In § 2 we present an overview of the model and show that, with a simple recipe for the evolution of dust attenuation during the earliest phases of the galaxy lifetime, accounting for the luminosity vs. correlation found by Shapley et al. (2001), it nicely reproduces the observational estimates of the LBG luminosity functions (LFs) at different redshifts. In § 3 we investigate the absorption effects on the Lyman continuum emission, the evolution of the Ly LF, and the contributions of young galaxies to the cosmic re-ionization. Finally, in § 4 we discuss our results and summarize our conclusions.
Throughout the paper we adopt a flat cosmology with matter density , Hubble constant km s-1 Mpc-1, and normalization of the mass variance . Unless otherwise specified, magnitudes are in the AB system.
2. Overview of the model
The rest-frame UV emission is proportional to the SFR . This is in turn determined by a number of physical processes (such as cloud-cloud collisions, cooling, fragmentation, energy inputs from quasars, supernovae [SNae] and stellar winds, etc. etc.) which occur on different linear and time scales. Even with the more sophisticated numerical techniques, one has to resort to many simplifying assumptions to derive the star formation history, since these processes are extremely complex and occur on scales well below the currently achievable resolution of -bodyhydro simulations (Iliev et al. 2006).
In this paper we exploit the physical recipe elaborated by Granato et al. (2004), which relates the average SFR to the distribution of gas and dark matter (DM) in proto-galaxies, taking into account the effects of the energy fed back to the intra-galactic gas by SN explosions and by accretion onto the nuclear, supermassive black hole (BH). The model envisages that during or soon after the formation of the host DM halo, the baryons falling into the newly created potential well are shock-heated to the virial temperature. The hot gas is (moderately) clumpy and cools fast especially in the denser central regions, where rapid mergers of a fraction less than of the total mass yield strong bursts of star formation that can reach up to thousands solar masses per yr in massive halos at high redshift. Such a huge star formation activity also promotes the storage of the cooled gas into a reservoir around the central supermassive BH, eventually leading to accretion onto it. The ensuing SN explosions and the nuclear activity feed energy back to the gaseous baryons, and regulate the SFR and the BH growth. These mutual energy feedbacks actually reverse the formation sequence of the stellar component of galaxies compared to that of DM halos: the star formation and the buildup of central BHs are completed more rapidly in the more massive haloes, thus accounting for the phenomenon now commonly referred to as downsizing. The basic equations of the model and their analytical solutions are reported in Appendix A. The model predicts the time evolution of the SFR, of the metal abundance (taking into account the chemical enrichment of the primordial infalling gas and the gas outflow due to energy injection by SNae and active nuclei), of the stellar mass (see Fig. 1), and of the mass stored in the central supermassive BH.

When the star formation and the chemical evolution history of a galactic halo of mass have been computed, the spectral energy distribution (SED) as function of time from extreme UV to radio frequencies is estimated through the GRASIL code (Silva et al. 1998). Coupling these results with the halo formation rate, we can obtain the LFs of galaxies as a function of cosmic time. At , the halo formation rate can be reasonably well approximated by the positive part of the derivative of the halo mass function with respect to cosmic time (e.g., Haehnelt & Rees 1993; Sasaki 1994). The halo mass function derived from numerical simulations (Jenkins et al. 2001) is well fit by the Sheth & Tormen (1999, 2002) formula, that improves over the original Press & Schechter (1974) expression, which is well known to under-predict by a large factor the massive halo abundance at high redshift. Adopting the Sheth & Tormen (1999) mass function , denoting the cosmic time, the formation rate of DM halos is given by
| (1) |
where and are constants obtained by comparison with -body simulations, is the mass variance of the primordial perturbation field, computed from the Bardeen et al. (1986) power spectrum with correction for baryons (Sugiyama 1995) and normalized to on a scale of Mpc, and is the critical threshold for collapse, extrapolated from the linear perturbation theory.
Briefly, the model requires parameters (all of which are constrained within rather small ranges by independent data or physical arguments) to describe the physical processes ruling the star formation, the BH growth and their feedback. With the parameter values reported in Table 1 of Lapi et al. (2006), the model fits the available data on the LFs of protospheroidal galaxies at different redshifts and in different spectral bands, and the local relationship between central BH mass and spheroidal luminosity (hundreds of data points). Among others, the model reproduces the 850 m extragalactic counts (Coppin et al. 2006; Scott et al. 2006) with their redshift distributions (Chapman et al. 2005; Aretxaga et al. 2007), and correctly predicted (Silva et al. 2004, 2005) the fraction of high- galaxies in deep m surveys (Pérez-González et al. 2005; Caputi et al. 2006; see Magliocchetti et al. 2007), quantities that all proved to be very challenging for competing models.
The evolving LFs of optical and X-ray selected quasars at are also well fitted by adding parameters, namely the visibility times in the optical, yr, and in X-rays, yr, and a dispersion of dex around the mean relationship between the halo and the central BH mass derived from the model (see Lapi et al. 2006).
A summary of the model results and of their comparisons with observational data is presented in Table 2 of Lapi et al. (2006). To sum up, the model traces very well the formation and coevolution of quasars and of their spheroidal hosts.

2.1. The UV luminosity function of LBGs
The absolute magnitude at Å, including attenuation, can be written as
| (2) |
where erg s-1 Hz-1 is the monochromatic luminosity for (Kennicutt 1998, with the calibration converted to the Romano et al. (2002) initial mass function [IMF] adopted here, see Appendix A).
The dust attenuation is expected to be proportional both to some power of star-forming gas mass (or equivalently of the SFR, see eq. [A5]) that reflects the dust column density, and to some power of the metallicity, that reflects the fraction of metals locked into dust grains (see also Jonsson et al. 2006). As shown by Fig. 2, a simple, average relation between UV attenuation, SFR and
| (3) |
consistent with expectations from the model, provides a very good fit of the luminosity-reddening relation found by Shapley et al. (2001). Variations of the normalization coefficient by , of the exponent of the SFR by , and of the exponent of the metallicity by are still compatible with the data.
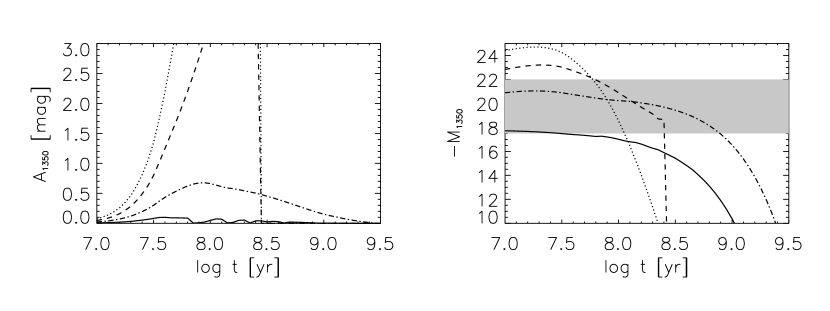
Using eq. (3) and the quantities and provided by our model (see Appendix A for handy approximations), we compute the evolution with galactic age of the attenuation for LBGs with different halo masses, see Fig. 3 (left panel). The attenuation is predicted to be small for LBGs hosted by low-mass halos (), while it quickly increases with time for higher masses, so that more massive galaxies are UV-bright for shorter times. The more massive LBGs spend approximately of their burst time in an interstellar medium optically thick to their UV emission. The right panel of Fig. 3 shows the predicted evolution of UV luminosity with galactic age, including the attenuation given by eq. (3), at for several halo masses.
The UV LF of LBGs can be estimated coupling the UV luminosity and halo mass derived from the our model (cf. Fig. 3) with the halo formation rate. The rest-frame UV LF at a cosmic time is then
| (4) |
where is the time spent at magnitudes brighter than .
As illustrated in Fig. 4, good agreement with the observational data is obtained. Neglecting attenuation would increase the prediction at the bright end by more than an order of magnitude. In fact dust attenuation is drastically shortening the time [eq. (4)] for large halos (cf. Fig. 3). In this context it is worth noticing that the unattenuated LF can be depressed also by assuming short star formation timescales (around Myr at ), as advocated by Stark et al. (2007a). On the other hand, such short timescales would imply stellar masses and stellar ages much lower than observed; Eyles et al. (2005, 2007) find stellar masses around and ages of hundreds Myrs. These findings are quite naturally reproduced in our framework.
The approximate proportionality of the initial (galaxy age ) SFR with the halo initial gas mass which, in turn, is proportional to the halo mass [eq. (A6)] implies that the highest luminosity tail of the LF is associated to the most massive galaxies. These are however very rare at high- and, furthermore, their UV-bright phase is very short because of the quick increase of their attenuation (Fig. 3); they are thus easily missed by the available surveys, covering very small areas. On the other hand, low mass galaxies are too faint to be detectable. Hence, according to the present model, the available data only sample the halo mass range , with SFRs of , and stellar masses ranging from to . The strong dependence of on halo mass has clearly a key role in shaping the UV LF.
The information on the LBG space densities at is scanty. Fig. 4 shows that we expect a drastic decrease from (dashed line) to (dotted line). Bouwens & Illingworth (2006b) estimate that there are sources brighter than at on an area of ; we predict sources. Bouwens et al. (2005) obtained an upper limit of galaxies at on an area of , to a magnitude limit of 28.5 in ; our model yields .

3. The effect of dust on the Lyman-continuum of LBGs and on LAEs
3.1. Escape fraction of ionizing photons
The relative importance of dust attenuation and HI absorption in determining the escape fraction of ionizing photons and the Ly luminosity depends on the complex geometry of the distribution of gas, dust and stars. We assume that most of the ionizing and of the Ly photons originate in the very central regions of the galaxy and see the same amount of dust as the photons at the reference wavelength of Å; we extrapolate the Å attenuation to shorter wavelengths adopting the attenuation law proposed by Calzetti et al. (2000). This yields , , and, extrapolating from Å to Å (cf. Draine 2003), .
The observed luminosity at Å is given by
| (5) |
where is the intrinsic luminosity at Å, and are the fractions of Å photons surviving and dust absorption within the galaxy respectively, and is fraction surviving absorption in the IGM along the line of sight. The product is the fraction of Å photons emerging at the galaxy boundary.
Following Inoue et al. (2006) we define the ratio between the Lyman continuum and UV luminosity at the galaxy boundary as
| (6) |
The factor , which in principle should appear in this equation, is very close to unity and is therefore usually omitted.
Rest-frame ultraviolet spectroscopic observations in the Lyman continuum region for samples of and LBGs at have been obtained by Steidel et al. (2001) and by Shapley et al. (2006). While Steidel et al. (2001) found , Shapley et al. (2006) found an average value about times lower, , yet with a substantial variance and with objects showing significant emission below the Lyman limit, corresponding to and . Note that these authors determine based on a sample of quasar spectra at the same average redshift of the LBGs, and/or performing numerical simulations of the line-of-sight absorption. A large scatter of the observed ratio is expected, since the UV and the ionizing radiation are emerging from central regions of galaxies with quite complex gas and dust distributions. In fact, regions of strong star formation in local galaxies exhibit line of sights with quite variable dust attenuation and Ly emission. In the following we adopt as a reference value, but we explore the range .
Considering that (recall that ) and setting , the escape fraction writes
| (7) |
The ratio between the intrinsic luminosities at Å and at Å for continuous star formation depends only on the IMF and on the metal content. For the Romano et al. (2002) IMF adopted here (see Appendix A for details), we find (see also Leitherer et al. 1999; Steidel et al. 2001; Inoue et al. 2005). In Fig. 5 (top panel) we plot as a function of galactic age, computed according to the above equation and assuming ; it is apparent that for massive halos () the escape fraction is negligible over most of the burst duration.
On the other hand, the low mass (i.e. low intrinsic luminosity) LBGs have large escape fractions and can thus release substantial amounts of ionizing photons (Fig. 6, left panel). The emission rate of ionizing Å photons at the galaxy boundary reads
| (8) |
The contribution of these galaxies to the cosmic reionization is estimated in Appendix B. The filling factor of HII regions is computed as a function of redshift (see Fig. 6, right panel) for our reference attenuation [eq. (3)] and . It turns out that LBGs are able to completely reionize the universe since . The corresponding optical depth to electron scattering is , within the range of the estimate from WMAP three year data (, Page et al. 2007). Note that lowering to and would move the completion of reionization to and , respectively.
Most of the ionizing photons are produced by galaxies with halos masses in the range at . The contribution of massive galaxies is depressed by their low number density at the relevant redshifts and by their internal dust absorption. On the other hand, the contribution of the numerous low mass galaxies is damped by the decrease, driven by stellar feedback, of their SFRs. LBGs in the above mass range have very low attenuation and contribute to the faint part of the UV LF () and to the bright end of the observed Ly LF at (see below).


3.2. Ly emitters
The Ly line typically arises from ionizing photons absorbed by nearby hydrogen gas. If the fraction of absorbed ionizing photons within the galaxy is () and of them are converted into Ly photons (Osterbrock 1989; see also Santos 2004), one gets the unattenuated Ly luminosity:
| (9) |
The interstellar dust attenuates by a factor ; furthermore, only a fraction of Ly photons survives the passage through the IGM. Therefore the luminosity we see is
| (10) |
for the adopted IMF; for a Salpeter IMF the normalization should be reduced by a factor of about .
Since the fraction of ionizing photons surviving HI absorption is , eq. (7) yields
| (11) |
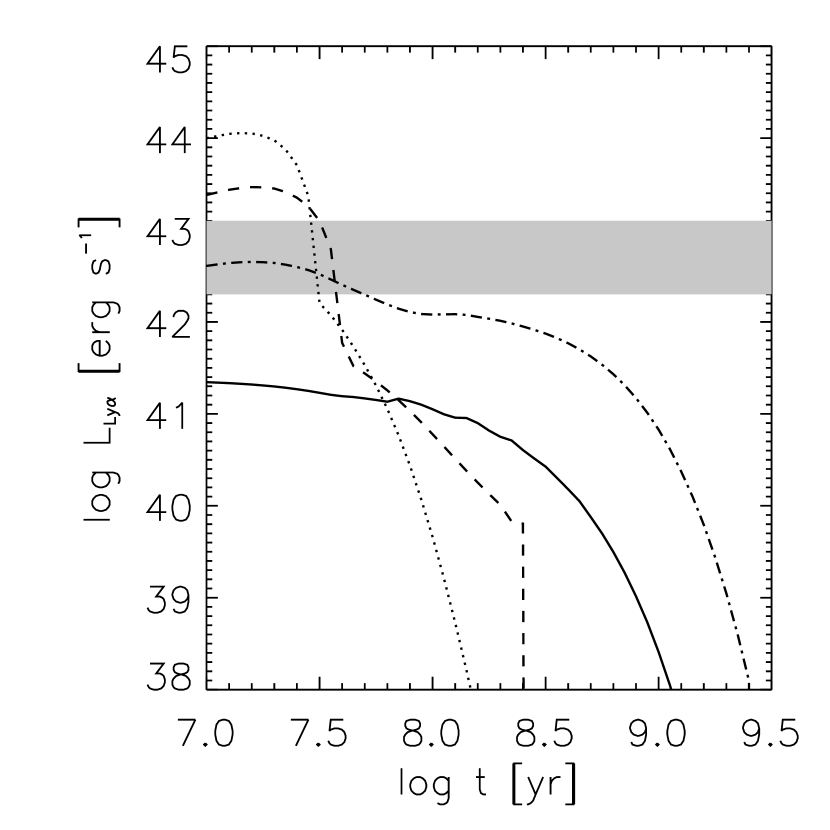
The fraction depends on the attenuation at Å and on the attenuation law used to extrapolate it to Å. The middle and bottom panels of Fig. 5 show the absorbed fraction () and its product by as a function of the galactic age for the attenuation eq. (3) and the Calzetti et al. (2000) attenuation law; note that for the dust surviving fraction we have assumed . It is apparent that LBGs in large halos, , are LAEs only for a short time (less than yr). The figure also illustrates the difficulty of inferring the SFR from the Ly luminosity: even for relatively low mass halos () the effect of HI absorption and dust attenuation may be very large. This implies that the Ly emission from LBGs and in general the statistics of LAEs at high redshifts are important absorption/attenuation probes.
Exploiting the relationship between the Ly luminosity, the SFR and the absorption [eq. (10)], the LFs of LAEs at high redshifts are estimated in the same way as the LBG LFs, and are given by an equation strictly analogous to eq. (4). Our results are presented in Fig. 7 (left panel).
It is clear from the above that the LF estimates rely on some quantities that are not very well constrained observationally. Still, it may be worth noticing that the data on the LF at and are consistent with a transmission factor , for , while the LF at seems to require . This may suggest that the ionization state of the IGM is changing between and (see also Kashikawa et al. 2006b). We need, however, to keep in mind that the determination of is quite complex and implies assumptions on the relative velocity of the emitting galaxies and the IGM, on the presence of galactic winds, of neutral hydrogen, etc. (see Haiman 2002, Santos 2004 and Dijkstra, Lidz & Wyithe 2007 for comprehensive discussions). On the other hand, a fit of the observed LF with and ignoring dust attenuation yields a conservative lower limit of at (see Dijkstra, Wyithe & Haiman 2007).
Figure 7 also shows our predictions for the LAE LF at , when the Ly line lies in the band (see Barton et al. 2006), assuming . However, if indeed the reionization is due to LBGs, we expect that the IGM ionization level can be significantly lower at this redshift, and the dimming of the Ly luminosity substantially stronger.
A clear-cut prediction of our model is that the Ly luminosity of the most massive galaxies decreases abruptly after few yr, implying that, with rare exceptions, bright LBGs should exhibit relatively low Ly luminosity (see Fig. 7, right panel). A deficiency of objects with large Ly equivalent width among bright LBGs has recently been reported by Ando et al. (2006).
According to the model, most of the LAEs with Ly luminosities sampled by the available surveys ( erg s erg s-1 at ) are hosted by galactic halos within a rather narrow mass range and shining only for a short time yr. Fig. 1 shows that the corresponding stellar masses range from a few to a few , in nice agreement with the findings by Filkenstein et al. (2007) and Pirzkal et al. (2007). Indeed, Gawiser et al. (2006) noted that 80 of the objects in a sample of LAEs at have the right colors to be selected as LBGs. They also inferred an average SFR around yr-1 and an average mass in stars , assuming a Salpeter IMF. Applying the correction by a factor of about to account for the different IMFs, our model yields SFRs and stellar masses consistent with these estimates. Gawiser et al. (2006) also claim that the dust attenuation is on the average minimal () in their stacked sample. According to our model (cf. Figs. 1, 3, and 7), the attenuation is almost negligible for low stellar mass objects, since both the SFR and the metal abundance are small. Only for objects with and age larger than yr the attenuation becomes non negligible, . The dust in these objects may play an important role in determining the EW of the Ly (Filkenstein et al. 2007). However the effect is very sensitive to the spatial distribution of dust, stars and HI.
Lai et al. (2007) found larger masses, from a few to a few , for LAEs at . The corresponding ages vary from several Myr to several hundreds Myr, depending on chemical composition. It has to be noticed that these authors analyzed the 3 objects with the largest fluxes at and m. As a consequence we expect that the selection is biased in favor of the objects with the highest stellar mass. In our framework this selection corresponds to objects with halo masses of , ages of about Myr (cf. Fig. 1), metallicities around [cf. eq. (A9)] and (cf. Fig. 2); the predicted mass in stars amounts to .
In conclusion, the dust prescription we derive from observations of LBGs is consistent also with the observations of LAEs at high redshift.

4. Discussion and conclusions
We have extended to the earliest evolutionary phases of high redshift galaxies the physical model worked out by Granato et al. (2004) which proved to be capable of accounting for the wealth of data on the heavily obscured active star formation phase probed by (sub)mm surveys and on the subsequent passive evolution of spheroidal galaxies. Lapi et al. (2006) have shown that this model, which features a coevolution of galaxies and active nuclei, can also provide good fits of the cosmic epoch dependent optical and X-ray LFs of active galactic nuclei.
We have directly borrowed from the Granato et al. (2004) model three basic ingredients: (i) the formation rate of galactic halos; (ii) the star formation history as a function of halo mass and redshift, and the IMF of stars; (iii) the chemical evolution. These ingredients allow us to obtain the unattenuated spectral energy distribution as a function of galactic age. For the galaxies of interest here, which just begin to form their metals, we need a specific recipe for the attenuation. Based on simple physical arguments, we have adopted a power-law relation between UV attenuation, SFR and metallicity [eq. (3)], tuned to fit the UV luminosity vs. correlation found by Shapley et al. (2001); this UV attenuation turns out to be increasing with galactic age and with increasing galaxy mass. With this additional ingredient the model accounts also for the observed LFs of LBGs at different redshifts. The larger attenuation for more massive objects implies that the UV LF evolves between and much less than the halo mass function. This is due to the fact that the higher dust attenuation mitigates the fast increase with decreasing redshift of the number density of massive halos. As a consequence, the UV LF is only weakly sensitive to the values of cosmological parameters, and in particular of . However, if LF estimates will be extended to , the effect of could be visible down to small enough masses for which the effect of attenuation is small.
The derived UV LFs imply that LBG can account for a complete reionization at . Most ionizing photons are produced by galaxies with halo masses in the range at , that dominate the faint portion of the UV LF.
We expect that LBGs with detectable Ly emission are on average much younger, less massive and less dusty, in agreement with the analysis of LBGs observed in the GOODS-S survey by Pentericci et al. (2007). Note, however, that a second Ly bright phase may be expected at much later times, when the interstellar medium is being swept away by super-winds driven by the quasar feedback, allowing Ly photons to escape from the galaxy (see also Thommes & Meisenheimer 2005).

Only a small fraction () of LBGs at are detected by deep X-ray surveys (Laird et al. 2006; Lehmer et al. 2005). X-ray luminosities estimated using stacking techniques are generally below , consistent with the luminosities due to the starburst activity (Type-II SN remnants, hot gas, and high mass X-ray binaries). The small fraction of LBGs with generally shows properties of active nuclei. A single faint active nucleus was found by Douglas et al. (2007) in a large sample of LBGs. Our model implies that intense star formation activity is accompanied by an exponential growth of a supermassive BH at the galaxy center. The corresponding nuclear X-ray emission (cf. Granato et al. 2006) can be written as:
| (12) |
where is the mass-to-radiation conversion efficiency, is the bolometric correction for the keV band and is the accretion rate onto the supermassive BH. In the LBG phase the nuclear BHs are still very far from their final masses (proportional to the halo masses) and only those associated to halos at the upper limit of the range represented in the available samples (, see Fig. 3) can reach Eddington limited accretion rates large enough ( yr-1) to yield erg s-1 (see Fig. 1 of Lapi et al. 2006); the SFRs of these objects exceed (Fig. 1). Interestingly, the model predicts that in more massive primeval galaxies during the late SMB phase, the SFRs may reach thousands yr-1 and correspondingly the nuclear accretion rates may attain tens yr-1. In fact, Granato et al. (2006) have shown that the model successfully reproduces the X-ray observations of SMB galaxies by Alexander et al. (2005a,b) and Borys et al. (2005).
We find that the model reproduces the Ly LFs at , and (Ouchi et al. 2003; Shimasaku et al. 2006; Kashikawa et al. 2006b). The effect of increasing opacity with increasing mass is even stronger for LAEs and is responsible for the weaker evolution of the LAE LF, compared to the LBG’s, between and , clearly discernible in Fig. 7. Evidences of only weak evolution of the LAE LF between and have been noted by Taniguchi et al. (2005; see also Murayama et al. 2007).
According to this model, the galaxies currently selected in Ly ( erg s-1) are very young (cf. Fig. 7), with typical ages up to yr. The Ly luminosity range sampled by surveys carried out so far corresponds to a narrow distribution of halo masses around , and stellar masses ranging from to (see Fig. 1). For given halo mass, Ly-selected galaxies have lower stellar masses than LBGs and their stars are preferentially formed in the densest central regions; they are therefore expected to be more compact than LBGs, as is indeed observed (Dow-Hygelund et al. 2007). Galaxies with higher halo masses have higher Ly luminosities but are rare because of the low number density of massive halos at high redshifts and of their short lifetime in the LAE phase; they are thus easily missed by the available surveys, covering very small areas. These rare objects would however have very interesting properties: high Ly luminosity with very young ages, low metallicities and correspondingly high Ly equivalent widths, low masses in stars within large halo masses. On the other hand, the lower luminosity portion of the LAE LF is dominated by relatively older objects, more chemically evolved and with lower Ly equivalent widths. Therefore the extension to lower luminosities of the LAE LF will depend rather critically on the minimum detectable equivalent width. Both Ly-selected galaxies and LBGs are associated to relatively small DM halos and so that they are not expected to show strong clustering, consistent with the results by Murayama et al. (2007).
Fig. 8 shows the cumulative distribution of SFRs for LBGs, LAEs, and SMBs at different redshifts. Although we must be aware that there is a significant overlap among these populations, some trends clearly emerge. At high most of the star formation is associated to the LBG phase, but a substantial fraction of the galaxies with the highest star formation rates are predicted to be dust-obscured (and therefore SMB). This is because, in the present framework, the more massive galaxies have higher SFRs, yielding higher metallicities and higher dust attenuations. At redshift , however, the space density of SMBs is very low. Only later on, an increasing fraction of the cosmic SFR occurs in very dusty galaxies. Since SFRs are strongly correlated with halo masses, SMB galaxies are expected to show stronger clustering, consistent with the results by Blain et al. (2004). Observations of the LBG angular correlation function at (Kashikawa et al. 2006a; Lee et al. 2006; Hildebrandt et al. 2007) find evidences of substantial clustering, yet not as strong as indicated by data on SMB galaxies. In particular, the clustering was found to depend on luminosity, suggesting a close correlation between halo mass and SFR, in keeping with our expectations.
To sum up, our model establishes a coherent scenario encompassing the variety of galaxy populations selected by different techniques: Ly emitters, Lyman break galaxies, submillimeter bright, and passively evolving galaxies. In this scenario, these populations correspond to subsequent steps in the evolutionary sequence of high- galaxies.
References
- (1)
- (2) Alexander, D.M., et al. 2005a, ApJ, 632, 736
- (3)
- (4) Alexander, D.M., et al. 2005b, Nature, 434, 738
- (5)
- (6) Ando, M., et al. 2006, ApJ, 645, L9
- (7)
- (8) Aretxaga, I., et al. 2007, MNRAS, submitted [preprint astro-ph/0702503]
- (9)
- (10) Bardeen J., Bond J., Kaiser N. & Szalay A., 1986, ApJ, 304, 15
- (11)
- (12) Barton, E.J., Bullock, J.S., Cooray, A., & Kaplinghat, M. 2006, NewAR, 50, 1
- (13)
- (14) Blain, A.W., Chapman, S.C., Smail, I., & Ivison, R. 2004, ApJ, 611, 725
- (15)
- (16) Borys, C., Smail, I., Chapman, S.C., Blain, A.W., Alexander, D.M., & Ivison, R.J. 2005, ApJ, 635, 853
- (17)
- (18) Bouwens, R.J., & Illingworth, G.D. 2006a, NewAR, 50, 152
- (19)
- (20) Bouwens, R.J., & Illingworth, G.D. 2006b, Nature, 443, 189
- (21)
- (22) Bouwens, R.J., Illingworth, G.D., Thompson, R.I., & Franx, M. 2005, ApJ, 624, L5
- (23)
- (24) Bunker, A.J., Stanway, E.R., Ellis, R.S., & McMahon, R.G. 2004, MNRAS, 355, 374
- (25)
- (26) Burgarella, D., et al. 2006, A&A, 450, 69
- (27)
- (28) Calzetti, D., Armus, L., Bohlin, R.C., Kinney, A.L., Koornneef, J., & Storchi-Bergmann, T. 2000, ApJ, 533, 682
- (29)
- (30) Caputi, K. I., et al. 2006, ApJ, 637, 727
- (31)
- (32) Chabrier, G. 2005, in The Initial Mass Function 50 years later, eds. E. Corbelli and F. Palla, Astrophysics and Space Science Library Vol. 327 (Dordrecht: Springer), p. 41
- (33)
- (34) Chapman, S.C., Blain, A.W., Smail, I., & Ivison, R.J. 2005, ApJ, 622, 772
- (35)
- (36) Cirasuolo, M., Shankar, F., Granato, G.L., De Zotti, G., & Danese, L. 2005, ApJ, 629, 816
- (37)
- (38) Coppin, K., et al. 2006, MNRAS, 372, 1621
- (39)
- (40) Cowie, L.L., & Hu, E.M. 1998, AJ, 115, 1319
- (41)
- (42) Dijkstra, M., Lidz, A., & Wyithe, S., 2007, MNRAS, submitted [preprint astro-ph/0701667]
- (43)
- (44) Dijkstra, M., Wyithe, S., & Haiman, Z. 2007, MNRAS, submitted [preprint astro-ph/0611195]
- (45)
- (46) Dickinson, M., et al. 2004, ApJ, 600, L99
- (47)
- (48) Douglas, L.S., Bremer, M.N., Stanway, E.R., & Lehnert, M.D. 2007, MNRAS, in press
- (49)
- (50) Dow-Hygelund, C.C. et al. 2007, ApJ, accepted [preprint astro-ph/0612454]
- (51)
- (52) Draine, B.T. 2003, ARA&A, 41, 241
- (53)
- (54) Eyles, L.P., et al. 2007, MNRAS, 374, 910
- (55)
- (56) Eyles, L.P., Bunker, A.J., Stanway, E.R., Lacy, M., Ellis, R.S., & Doherty, M. 2005, MNRAS, 364, 443
- (57)
- (58) Finkelstein, S.L., Rhoads, J.E., Malhotra, S., Pirzkal, N., & Wang, J. 2007, ApJ, submitted [preprint astro-ph/0612511]
- (59)
- (60) Fontana, A., et al. 2006, A&A, 459, 745
- (61)
- (62) Gawiser, E., et al. 2006, ApJ, 642, L13
- (63)
- (64) Giavalisco, M., et al. 2004, ApJ, 600, L103
- (65)
- (66) Gnedin, N.Y., & Ostriker, J.P. 1997, ApJ, 486, 581
- (67)
- (68) Granato, G.L., Silva, L., Lapi, A., Shankar, F., De Zotti, G., & Danese, L. 2006, MNRAS, 368, L72
- (69)
- (70) Granato, G.L., De Zotti, G., Silva, L., Bressan, A., & Danese, L. 2004, ApJ, 600, 580
- (71)
- (72) Grazian, A., et al. 2007, A&A, 465, 393
- (73)
- (74) Haehnelt, & M.G., Rees, M.J. 1993, MNRAS, 263, 168
- (75)
- (76) Haiman, Z. 2002, ApJ, 576, L1
- (77)
- (78) Hildebrandt, H., et al. 2007, A&A, 462, 865
- (79)
- (80) Huang, J.-S., Rigopoulou, D., Willner, S.P., & Papovich, C. 2005, ApJ, 634, 137
- (81)
- (82) Iliev, I.T., Mellema, G., Pen, U.-L., Merz, H., Shapiro, P.R., & Alvarez, M.A. 2006, MNRAS, 369, 1625
- (83)
- (84) Inoue, A.K., Iwata, I., & Deharveng, J.-M., 2006, MNRAS, 371, L1
- (85)
- (86) Inoue, A.K., Iwata, I., Deharveng, J.-M., Buat, V., & Burgarella, D. 2005, A&A, 435, 471O
- (87)
- (88) Iwata, I., et al. 2007, MNRAS, in press [preprint astro-ph/0701841]
- (89)
- (90) Iye, M., et al. 2006, Nature, 443, 186
- (91)
- (92) Jenkins, A., et al. 2001, MNRAS, 321, 372
- (93)
- (94) Jonsson, P., Cox, T.J., Primack, J.R., & Somerville, R.S. 2006, ApJ, 637, 255
- (95)
- (96) Kashikawa, N., et al. 2006a, ApJ, 637, 631
- (97)
- (98) Kashikawa, N., et al. 2006b, ApJ, 648, 7
- (99)
- (100) Kennicutt, R.C. Jr. 1998, ARA&A, 36, 189
- (101)
- (102) Lai, K., et al. 2007, ApJ, 655, 704
- (103)
- (104) Laird, E.S., Nandra, K., Hobbs, A., & Steidel, C.C. 2006, MNRAS, 373, 217
- (105)
- (106) Lapi, A., Shankar, F., Mao, J., Granato, G.L., Silva, L., De Zotti, G., & Danese, L. 2006, ApJ, 650, 42
- (107)
- (108) Lee, K.-S., et al. 2006, ApJ, 642, 63
- (109)
- (110) Lehmer, B.D., et al. 2005, AJ, 129, 1
- (111)
- (112) Leitherer, C., et al. 1999, ApJS, 123, 3
- (113)
- (114) Lowenthal, J.D., et al. 1997, ApJ, 481, 673
- (115)
- (116) Madau, P., Haardt, F., & Rees, M.J. 1999, ApJ, 514, 648
- (117)
- (118) Magliocchetti, M., Silva, L., Lapi, A., de Zotti, G., Granato, G.L., Fadda, D., & Danese, L. 2007, MNRAS, 375, 1121
- (119)
- (120) Mo, H.J., & Mao, S. 2004, MNRAS, 353, 829
- (121)
- (122) Morgan, H.L., & Edmunds, M.G. 2003, MNRAS, 343, 427
- (123)
- (124) Murayama, T., et al. 2007, ApJS, in press [preprint astro-ph/0702458]
- (125)
- (126) Osterbrock, D.E. 1989, Astrophysics of Gaseous Nebulae and Active Galactic Nuclei (Univ. Science Books: Mill Valley, CA)
- (127)
- (128) Ouchi, M., et al. 2004, ApJ, 611, 685
- (129)
- (130) Ouchi, M., et al. 2003, ApJ, 582, 60
- (131)
- (132) Page, L., et al. 2007, ApJ, submitted [preprint astro-ph/0603450]
- (133)
- (134) Pentericci, L., et al. 2007, A&A, in press [preprint astro-ph/0703013]
- (135)
- (136) Pérez-González, P.G., et al. 2005, ApJ, 630, 82
- (137)
- (138) Pirzkal, N., Malhotra, S., Rhoads, J.E., & Xu, C. 2007, ApJ, submitted [preprint astro-ph/061251]
- (139)
- (140) Press, W.H., & Schechter, P., 1974, ApJ, 187, 425
- (141)
- (142) Romano, D., Silva, L., Matteucci, F., & Danese, L. 2002, MNRAS, 334, 444
- (143)
- (144) Santos, M.R. 2004, MNRAS, 349, 1137
- (145)
- (146) Sasaki, S. 1994, PASJ, 46, 427
- (147)
- (148) Scott, S.E., Dunlop, J.S., & Serjeant, S. 2006, MNRAS, 370, 1057
- (149)
- (150) Shankar, F., Lapi, A., Salucci, P., De Zotti, G., & Danese, L. 2006, ApJ, 643, 14
- (151)
- (152) Shapiro, P.R., & Giroux, M.L. 1987, ApJ, 321, L107
- (153)
- (154) Shapley, A.E., Steidel, C.C., Pettini, M., Adelberger, K.L., & Erb, D.K. 2006, ApJ, 651, 688
- (155)
- (156) Shapley, A.E., Steidel, C.C., Adelberger, K.L., Dickinson, M., Giavalisco, M., & Pettini, M. 2001, ApJ, 562, 95
- (157)
- (158) Sheth, R.K., & Tormen, G., 1999, MNRAS, 308, 119
- (159)
- (160) Sheth, R.K., & Tormen, G., 2002, MNRAS, 329, 61
- (161)
- (162) Shimasaku, K., et al. 2006, PASJ, 58, 313
- (163)
- (164) Silva, L., De Zotti, G., Granato, G.L., Maiolino, R., & Danese, L. 2004, A&A, submitted [preprint astro-ph/0403166]
- (165)
- (166) Silva, L., De Zotti, G., Granato, G.L., Maiolino, R., & Danese, L. 2005, MNRAS, 357, 1295
- (167)
- (168) Silva, L., Granato, G.L., Bressan, A., & Danese, L. 1998, ApJ, 509, 103
- (169)
- (170) Stark D.P., Loeb, A., & Ellis, R.S. 2007a, ApJ, submitted [preprint astro-ph/0701822]
- (171)
- (172) Stark D.P., Bunker, A.J., Ellis, R.S., Eyles, L.P., & Lacy, M. 2007b, ApJ, in press [preprint astro-ph/0604250]
- (173)
- (174) Steidel, C.C., Adelberger, K.L., Shapley, A.E., Pettini, M., Dickinson, M., & Giavalisco, M. 2003, ApJ, 592, 728
- (175)
- (176) Steidel, C.C., Pettini, M., & Adelberger, K.L. 2001, ApJ, 546, 665
- (177)
- (178) Steidel, C.C., Adelberger, K.L., Giavalisco, M., Dickinson, M., & Pettini, M., 1999, ApJ, 519, 1
- (179)
- (180) Steidel, C.C., Giavalisco, M., Dickinson, M., & Adelberger, K.L. 1996, AJ, 112, 352
- (181)
- (182) Steidel, C.C., & Hamilton, D. 1993, AJ, 105, 2017
- (183)
- (184) Sugiyama, N., 1995, ApJS, 100, 281
- (185)
- (186) Sutherland, R.S., & Dopita, M.A. 1993, ApJS, 88, 253
- (187)
- (188) Taniguchi, Y., et al. 2005, PASJ, 57, 165
- (189)
- (190) Thommes, E., & Meisenheimer, K. 2005, A&A, 430, 877
- (191)
- (192) Thompson, R.I., Eisenstein, D., Fan, X., Dickinson, M., Illingworth, G., & Kennicutt, R.C. 2006, ApJ, 647, 787
- (193)
- (194) Vanzella, E., et al. 2005, A&A, 434, 53
- (195)
- (196) Vanzella, E., et al. 2006, A&A, 454, 423
- (197)
- (198) Yan, H. et al. 2006, ApJ, 651, 24
- (199)
- (200) Yoshida, M., Shimasaku, K., Kashikawa, N., Ouchi, M., & Okamura, S., 2006, ApJ, 653, 988
- (201)
- (202) Zhao, D.H., Mo, H.J., Jing, Y.P., & Börner, G. 2003, MNRAS, 339, 12
- (203)
Appendix A A simple recipe for the star formation rate in protogalaxies
The history of star formation, of fueling of the mass reservoir around the active nucleus, and of accretion into the central BH can be easily computed by numerically solving the set of differential equations written down by Granato et al. (2004; see also the Appendix A of Lapi et al. 2006). In this Appendix we summarize the results concerning the SFR, which are the relevant ones for this paper, and, whenever possible, we give simple analytical approximations for them.
At the virialization time a DM halo of mass hosting a galaxy contains a mass of hot gas at the virial temperature, being the mean cosmic baryon to DM mass-density ratio. The gas cools and flows toward the central regions of the halo at a rate
| (A1) |
where , and the ‘condensation’ timescale is the maximum between the dynamical time and the cooling time at the halo virial radius . The cooling time includes the appropriate cooling function (Sutherland & Dopita 1993) and allows for a clumping factor in the baryonic component. The second term on the right hand side describes the influence of the quasar kinetic energy output on the hot gas distributed throughout the DM halo. Note that in the above equation the effect of the angular momentum is neglected, since it is lost by dynamical friction through mergers of mass clouds on a time scale , where (e.g., Mo & Mao 2004); major mergers, which are very frequent at high redshift, imply a few.
The mass of cold gas is increased by cooling of the hot gas (), and decreased by star formation () and by the energy feedback from SNae () and quasar activity (). Its evolution thus obeys the equation:
| (A2) |
where is the fraction of gas restituted to the cold component by the evolved stars, amounting to under the assumption of instantaneous recycling. Strictly speaking, this value of is an upper limit, since only a fraction of evolved stars have a significant mass loss in the evolutionary phases considered here; the results, however, are only very weakly sensitive to the chosen value, in the allowed range. The cold mass ending up in the reservoir around the central super-massive BH is lost at a very low rate (see Granato et al. 2004) and has been neglected in the above equation.
The energy feedback from SNae is parameterized as
| (A3) |
where the efficiency of gas removal
| (A4) |
depends on the number of SNae per unit solar mass of condensed stars , on the energy per SN available to remove the cold gas , and on the specific binding energy of the gas within the DM halo, . Following Zhao et al. (2003) and Mo & Mao (2004), the latter quantity has been estimated for as ; here is the halo circular velocity at the virial radius and is a weak function of the halo concentration . We adopt the strength of SN feedback used by Lapi et al. (2006) in order to reproduce LFs of galaxies and quasars at high redshifts, and also to reproduce the fundamental correlations between local elliptical galaxies and dormant BHs.
The cold gas turns into stars at a rate
| (A5) |
where now and refer to the mass shell , and is the star formation timescale averaged over the mass distribution. Eqs. (A1) and (A2) can be easily solved setting and neglecting the effects of the energy injected in the gas by the accretion onto the central BH. With this approximation the infalling mass declines exponentially as , while the SFR evolves according to
| (A6) |
with . The quantity is the ratio between the timescale for the large-scale infall estimated at the virial radius, and the star formation timescale in the central region. An isothermal density profile yields .
Although eq. (A6) has been obtained neglecting the quasar feedback, it turns out to be, at the redshifts relevant here (), a good approximation of the results of the full numerical integration of the system of differential equations given by Lapi et al. (2006), provided that: (i) we take into account that the star formation is strongly suppressed by the quasar feedback after a time
| (A7) |
where for and for ; (ii) we adopt the following expression for the condensation timescale
| (A8) |
In the latter expression, the scaling with the redshift mirrors the dependence of the cooling and/or dynamical time on redshift. Moreover, the weak dependence on renders the impact of the energy feedback from the quasar on the infalling gas; its effect is mimicked by allowing longer condensation timescales for the gas in more massive halos, exposed to stronger quasar feedback from more massive BHs.
Note that the SFR evolves differently for different halo masses, see Fig. 1. For large masses , it increases almost linearly with galaxy age in the initial stages , and then it is suddendly stopped by the energy feedback from the quasar at . On the contrary, for low-mass halos it is first almost constant and then slowly declining; indeed, in such low mass galaxies the quasar feedback is very mild because the mutual effects of star formation and gas flow toward the reservoir around the central BH result in a strong decline of the BH mass with decreasing halo mass [e.g., Shankar et al. 2006, their eq. (16)]; thus the SFR can proceed for much longer times (note from eq. (A7) that Gyr at for ). Note that Fig. 1 refers to redshift ; at the SFR retains the same time dependence as at , but is on average lower by a factor of for a given halo mass.
The total mass cycled through stars during the time can be estimated by integrating the SFR [eq. (A6)]. The present-day total mass of surviving stars can then be derived by assuming a specific IMF; is around after Gyr from the burst for a Salpeter IMF, and is around for the IMF adopted here. The latter is a double power-law with slope from to and from down to (Romano et al. 2002; for a review on the IMF see Chabrier 2005).
An interesting outcome of our model is that the fraction of the original baryons associated to the galactic halo that is trapped in present-day stars stays almost constant at for , and decreases very rapidly below this threshold. As discussed by Shankar et al. (2006), this is in keeping with results obtained through X-ray and weak lensing estimates of halos around galaxies.
When computing the metal content of the cold gas, one has to take into account the enrichment of the primordial infalling gas due to earlier generations of stars, and the gas outflows due to the energy injection by SNae and quasars. In the first stages, the chemical enrichment of the cold gas component is very rapid; e.g., and the solar abundance in the gaseous component is attained after and yr, almost independently of the halo mass and redshift. Only less than and of the total stellar mass has been built up at these times and therefore the expected final mass fraction of metal-poor stars is tiny. This rapid enrichment is due to the short lifetime of massive stars (that are efficient metal producers) relative to the timescale of the infall of the diffuse medium with primordial composition, which dilutes the cold star-forming gas. A simple approximation of the subsequent evolution reads
| (A9) |
where yr is a characteristic time after which keeps almost constant.
Appendix B Reionization
In this Appendix we briefly describe the computation of the reionization redshift predicted by our model. The average global production rate of ionizing photons per unit volume at the cosmic time is
| (B1) |
where is given by eq. (8) and its distribution function can be derived in strict analogy to eq. (4). The transition from a neutral to a reionized IGM can be described in terms of the evolution of the volume filling factor of HII regions, , which is ruled by the equation (Shapiro & Giroux 1987; Madau, Haardt & Rees 1999)
| (B2) |
here is the comoving number density, and the recombination time is given by (Madau, Haardt & Rees 1999)
| (B3) |
in terms of the clumping factor of the IGM, . The IGM clumping factor has been investigated through hydrodynamical simulations (e.g., Gnedin & Ostriker 1997). Iliev et al. (2006) proposed an analytic description of the simulation results: . In the relevant redshift interval one finds . Here we adopt as a reference value. Reionization is completed at the redshift when (right panel of Fig. 6). Finally, the optical depth to electron scattering is given by
| (B4) |
where is the electron density, cm-3 is the present day baryon density, and cm2 is the Thomson cross section.