Lyman Alpha Emitters in the Hierarchically Clustering Galaxy Formation
Abstract
We present a new theoretical model for the luminosity functions (LFs) of Ly emitting galaxies in the framework of hierarchical galaxy formation. We extend a semi-analytic model of galaxy formation that reproduces a number of observations for local and high- galaxies, without changing the original model parameters but introducing a physically-motivated modelling to describe the escape fraction of Ly photons from host galaxies (). Though a previous study using a hierarchical clustering model simply assumed a constant and universal value of , we incorporate two new effects on : extinction by interstellar dust and galaxy-scale outflow induced as a star formation feedback. It is found that the new model nicely reproduces all the observed Ly LFs of the Ly emitters (LAEs) at different redshifts in 3–6. Especially, the rather surprisingly small evolution of the observed LAE Ly LFs compared with the dark halo mass function is naturally reproduced. Our model predicts that galaxies with strong outflows and are dominant in the observed LFs. This is also consistent with available observations, while the simple universal model requires not to overproduce the brightest LAEs. On the other hand, we found that our model significantly overpredicts LAEs at 6, and absorption of Ly photons by neutral hydrogen in intergalactic medium (IGM) is a reasonable interpretation for the discrepancy. This indicates that the IGM neutral fraction rapidly evolves from at to a value of order unity at –7, which is broadly consistent with other observational constraints on the reionization history.
Subject headings:
galaxies: evolution — galaxies: formation — galaxies: high-redshift — methods: numerical1. INTRODUCTION
In the cold dark matter (CDM) models of structure formation, structures are formed and grow hierarchically via gravitational instability; subgalactic clumps are formed in CDM halos, and they subsequently merge and collapse to grow into more massive galaxies. The ionizing radiation emitted from massive stars in primeval galaxies should lead to prominent Ly emission via the recombination of hydrogen in their interstellar medium (ISM). Therefore, as predicted by Partridge & Peebles (1967), detecting these Ly emissions via narrow- or intermediate-band imaging is one of the most powerful technique for seeking high- young star forming galaxies. In the last decade, many Ly emitters (LAEs), which seem to be powered by star formation activities, have been found through this technique (e.g., Cowie & Hu 1998; Hu et al. 1998; Rhoads et al. 2000; Taniguchi et al. 2005; Shimasaku et al. 2006; Iye et al. 2006; Murayama et al. 2007). The Ly luminosity functions (LFs) of the LAEs are one of the most fundamental observational quantities and they are becoming more firmly confirmed because of the increase of the survey fields and available samples 111In this paper, the term “LAE LF” refers to the Ly line luminosity function of LAEs, though some other types of LAE LFs can be defined, e.g., UV continuum LF of LAEs.. Through comparison between the observed LFs and theoretical models of the LAEs, we should be able to obtain important information for LAEs, and more generally, for galaxy formation.
Nevertheless, theoretical understanding of LAEs is still developing, and there are several different approaches for the theoretical modelling: analytical calculations based on the halo mass function and on simple assumptions linking Ly emission to halo mass (Haiman & Spaans 1999; Thommes & Meisenheimer 2005; Dijkstra et al. 2007b; Mao et al. 2006; Stark et al. 2007a), cosmological hydrodynamic simulations (Barton et al. 2004; Davé et al. 2006; Nagamine et al. 2006; Tasitsiomi 2006), and hierarchical clustering models of galaxy formation (so-called semi-analytic models; Le Delliou et al. 2005, 2006). A key ingredient of the theoretical modelling is the escape fraction of the Ly photons from their host galaxy, . In order to predict it precisely, a detailed calculation of radiative transfer of the Ly photons in realistic matter distribution in a galaxy is required (e.g., Hansen & Oh 2006). However, such procedure costs huge computational time because of the resonant scatterings of Ly photons in a galaxy (Neufeld 1990; Charlot & Fall 1993) and a direct comparison to the observed LFs is difficult. Therefore, previous studies for LAE LFs introduced simple phenomenological prescriptions. Le Delliou et al. (2005, 2006) and Dijkstra et al. (2007b) assumed a constant and universal escape fraction regardless of the physical properties of galaxies. Mao et al. (2006) adopted screen-type interstellar dust attenuation, but a detailed merger history of dark haloes in hierarchical clustering was not taken into account.
Fortunately, there are some hints for the physical properties of LAEs from observations. Ly emitting galaxies in the nearby universe generally have low metallicity or small dust amount (Charlot & Fall 1993) and show evidence for outflow or galactic wind (Lequeux et al. 1995; Kunth et al. 1998, 2003; Mas-Hesse et al. 2003; Keel 2005). These properties are also found in high- Lyman-break galaxies (LBGs) showing strong Ly emission (Pettini et al. 2002; Shapley et al. 2003; Bower et al. 2004; Wilman et al. 2005; Frye et al. 2007; Pentericci et al. 2007; Swinbank et al. 2007; Tapken et al. 2007). It is theoretically quite reasonable to expect that the amount of metal or dust and existence of galaxy-scale outflow strongly affect the emergent luminosity of Ly emission. Because of the resonant scattering by H I, Ly photons have a much longer path to diffuse out from a galaxy than UV continuum photons, and hence they are even more vulnerable to the absorption by dust. On the other hand, outflows would result in a velocity difference between H I gas and Ly photons, and hence the escape of a Ly photon would become easier. Therefore, these observations and theoretical considerations indicate that the universal and constant in all galaxies is oversimplified, and a more realistic modeling of is worth investigated.
Another hint for the value of comes from direct observational estimates. Gawiser et al. (2006) reported observational estimates of for LAEs at as (the best fit) and an lower limit of . However, the semi-analytic prediction by Le Delliou et al. (2005, 2006) requires a much smaller value of to fit the observed LAE LFs. Therefore a new model of LAE LFs that can reproduce the observations with is highly desirable.
Here, we present a new model of LAE Ly LFs, based on a semi-analytic model of hierarchical galaxy formation [a slightly updated version of Nagashima & Yoshii (2004) used in Nagashima et al. (2005)]. This Mitaka model is one of the latest semi-analytic models in which the merger history of dark matter haloes is taken into account and baryon physics such as star formation and feedback is phenomenologically treated (e.g., Kauffmann et al. 1993; Cole et al. 1994; Nagashima et al. 1999; Somerville & Primack 1999; Nagashima & Yoshii 2004; Baugh et al. 2005; Nagashima et al. 2005). This model can reproduce most of the observations for photometric, kinematic, structural, and chemical properties of local galaxies. Moreover, the LFs and angular two-point correlation functions of LBGs at and predicted by this model coupled with N-body simulations are found to be in good agreement with the observation (Kashikawa et al. 2006a). We extend this model to treat LAEs, but without changing any original parameters determined by the fit to observations. Rather, we try to explain the LAE LFs by minimal extension with a least number of new and physically-motivated parameters. Specifically, we incorporate two new effects in the calculation of : Ly photon extinction by dust and galactic wind driven by the supernova feedback. The new model will be carefully compared with all currently available data of high redshift LAE LFs.
The observed number of LAEs would be significantly reduced if the intergalactic medium (IGM) is neutral, because the red wing of the Gunn-Peterson trough should attenuate the Ly emission (e.g., Miralda-Escudé 1998; Haiman & Spaans 1999). Therefore, the apparent evolution of LAE LF is recognized as an invaluable probe of the cosmic reionization, and this approach has already been applied to the observed data (Rhoads & Malhotra 2001; Haiman 2002; Malhotra & Rhoads 2004; Stern et al. 2005; Kashikawa et al. 2006; Iye et al. 2006) to constrain the reionization history, which is complementary to the spectra of quasars (Fan et al. 2006) or gamma-ray burst (GRB) afterglows (Totani et al. 2006). However, a weak point of the LAE-LF method is a degeneracy between the intrinsic evolution of the LAE LFs and the apparent evolution by the IGM effect. Therefore, the intrinsic LF evolution must be known reliably to derive a robust constraint on the reionization. However, an ad hoc assumption of no intrinsic evolution was invoked in most of previous studies. We will discuss some implications for reionization based on our results of LAE LF evolution.
The rest of this paper is organized as follows. In § 2, we describe our extension of the Mitaka model to incorporate LAEs, and we compare the model results with the observed LAE LFs at various redshifts in in § 3. We discuss implications for reionization in § 4, and then summarize this work in § 5. The background cosmology adopted in this paper is the standard CDM model: and .
2. MODEL DESCRIPTION
The detailed description of the Mitaka semi-analytic model for hierarchical galaxy formation is given in Nagashima & Yoshii (2004) (see also Nagashima et al. 2005). Here we focus on the extension of the original Mitaka model to include LAEs.
2.1. Star Formation Rate in Starburst Galaxies
In the original Mitaka model, all of the cold gas in a galaxy turns into stars and hot gas instantaneously when the galaxy is classified as a “starburst” as a result of a major merger, and hence the SFR cannot be defined. This means that we cannot calculate the Ly photon production rate appropriately that is essential to determine the Ly luminosity. However, starburst galaxies could have a significant contribution to LAE LFs, because they have the highest SFR. Therefore we modify the Mitaka model to calculate SFR in starburst populations; we adopt an exponential SFR evolution with a time scale of :
| (1) |
where is the initial mass of available cold gas for star formation. We make a reasonable assumption that is proportional to the dynamical time of the newly formed spheroid, as . We adopt , which is consistent with SPH simulations (e.g., Kobayashi 2005) and with a recent observation of submillimeter galaxies at (Tacconi et al. 2006).
It is expected that not all of the cold gas will be locked up into stars, but some fraction of gas will be heated by supernova feedback, and then ejected from a galaxy as a hot galactic wind. This effect has already been taken into account in the Mitaka model, to reproduce various scaling laws of local galaxies. We define the efficiency of star formation as , where is the finally produced stellar mass after the starburst episode. The parameter is determined by the Mitaka model, and it depends on the dark halo circular velocity , since the feedback should be more efficient for less massive (smaller ) galaxies from which gas can be more easily removed.222 The quantity scales as and for and , respectively, where 130 km/s (Nagashima & Yoshii 2004).
Since the galactic wind will blow up the ISM gas and stop the star formation, it is reasonable to identify the time of onset of the galactic wind, , as that when the stellar mass produced by the above SFR evolution becomes , i.e.,
| (2) |
and hence . This indicates that the galactic wind phase will onset later for massive galaxies, and this trend is similar to the traditional picture of the galactic wind in starbursts (Arimoto & Yoshii 1987). After the onset of the galactic wind, star formation is stopped and the interstellar gas will escape from a galaxy with a time scale of , where is the effective radius of the galaxy calculated in the Mitaka model.
2.2. Observed Line Luminosity of Ly
Let be the Ly line luminosity emitted from a galaxy, which is given by
| (3) |
where and are the escape fraction of H I ionizing photons and Ly photons from their host galaxy, respectively. We adopt , i.e., all ionizing photons emitted from massive stars are absorbed in their host galaxy. Although this assumption may be rather extreme, it is a reasonable treatment for our purpose because the observationally inferred value of is much less than the unity (Inoue et al. 2006). The modelling of is the key issue of this work, and will be treated in detail in the next subsection.
The maximally possible luminosity is the luminosity that is achieved if all H I ionizing photons emitted from massive stars are absorbed by H I in the ISM (i.e. ) and then reprocessed into Ly photons in the ionization equilibrium. We define as the expected number of Ly photons produced by one ionizing photon (or equivalently, by one recombination); in the case A recombination it is given by and in the case B, it becomes (Osterbrock 1989, §4.2 and 11.8). Here, K is assumed in the both cases. We apply the case B following the previous studies (e.g., Charlot & Fall 1993; Valls-Gabaud 1993; Haiman & Spaans 1999; Le Delliou et al. 2005, 2006; Mao et al. 2006; Tasitsiomi 2006; Dijkstra et al. 2007b; Stark et al. 2007a), but the luminosity would not be changed significantly even if we apply the case A. Note that the case A may be appropriate for the situation of .
Then, for a quiescent galaxy in which star formation time scale is much longer than the massive star lifetime, is given by
| (4) |
where eV and is the ionizing photon emission rate normalized by a unit SFR. On the other hand, star formation time scale could be comparable with the massive star lifetime in starburst galaxies, and we must take into account the evolution of ionizing photon production rate in stellar evolution. Then we calculate as
| (5) |
where is the ionizing photon production rate from an unit stellar mass whose age is . Note that the physical dimensions of and are different. These quantities are calculated from the result of Schaerer (2003) with a correction for the initial mass function used in the Mitaka model. Both and increase by a factor of 3 with decreasing stellar metallicity from the solar abundance to the zero metallicity. The stellar metallicity is calculated from that of the cold gas, , in the Mitaka model. The evolution of is characterized by the two phases: almost constant phase at for and the subsequent exponential decay with a typical timescale of several million years.
Finally, when the IGM neutrality is high, Ly luminosity could be reduced by IGM absorption, and we include this effect as:
| (6) |
where is the IGM transmission to Ly photons, and it is set to be unity except for , since has been established at by observations (Fan et al. 2006).
2.3. Ly Escape Fraction Modelling
We first examine the following models for :
-
•
the simply proportional model: ,
-
•
the dust (screen) model: ,
-
•
the dust (slab) model: ,
where , and is column density of cold gas that is computed from the cold gas mass and the effective radius via . The simply proportional model assumes an universal and constant value of for all galaxies, as assumed in Le Delliou et al. (2005, 2006). The parameter determines the strength of the absorption of Ly by dust. The absorption of UV continuum by dust has already been included in the Mitaka model, but we treat this parameter independently for the Ly absorption by dust, since the effective optical depth for the Ly photons could be much larger than that for continuum photons because of much longer path caused by multiple resonant scattering of Ly photons by neutral hydrogen.
Furthermore, we examine another model that incorporates the effect of galaxy-scale outflow in addition to that of the interstellar dust extinction, which we call the outflowdust model. In this model, starburst galaxies are classified into three phases of pre-outflow, outflow, and post-outflow phases. These phases are defined by the elapsed time from the onset of star formation, as , , and , respectively (see § 2.1 for the definition of and ). All the quiescently star-forming galaxies are classified into the pre-outflow phase. We model in the outflowdust model as follows:
-
•
the pre-outflow phase: ,
-
•
the outflow phase: ,
-
•
the post-outflow phase: .
In the pre-outflow phase, we adopt the same modeling as the above dust models. We only apply the screen dust prescription because the difference between the screen and slab dust models is small, as we will find in § 3. In the outflow phase, according to the theoretical expectation that outflow could drastically decrease the effective opacity for Ly photons, we adopt as inferred for observed LAEs (Gawiser et al. 2006). Note that we do not treat as a free parameter, keeping the number of free parameters same as the dust models. In the post-outflow phase, while the H I ionizing photons are produced at moderate rates, neutral gas to absorb these photons in host galaxies is absent (i.e., ), and hence no Ly photons are produced ().
Therefore, the new free parameters in all the above models are and , while all other parameters are from the original Mitaka model without changing their values.
2.4. Luminosity Function of LAEs
Now we can calculate the Ly LF of LAEs by calculating as explained above from the Mitaka model of galaxy formation. We determine the free parameters of models by fitting the model Ly LF with to the data at reported by Shimasaku et al. (2006), which is corrected for both detection completeness and contamination, being the most reliable LAE LF to date. Specifically, we perform a test in the whole observational range of the Ly luminosity (). Because the LF error bars are the smallest at the faint end, the free parameters of are determined mainly by matching to the faint-end of the Ly LF of Shimasaku et al. We fix these values of the free parameters at and then apply the model to the data at other redshifts with keeping the parameter values, because they should reflect the physical properties of Ly photons that are not expected to evolve with redshift.
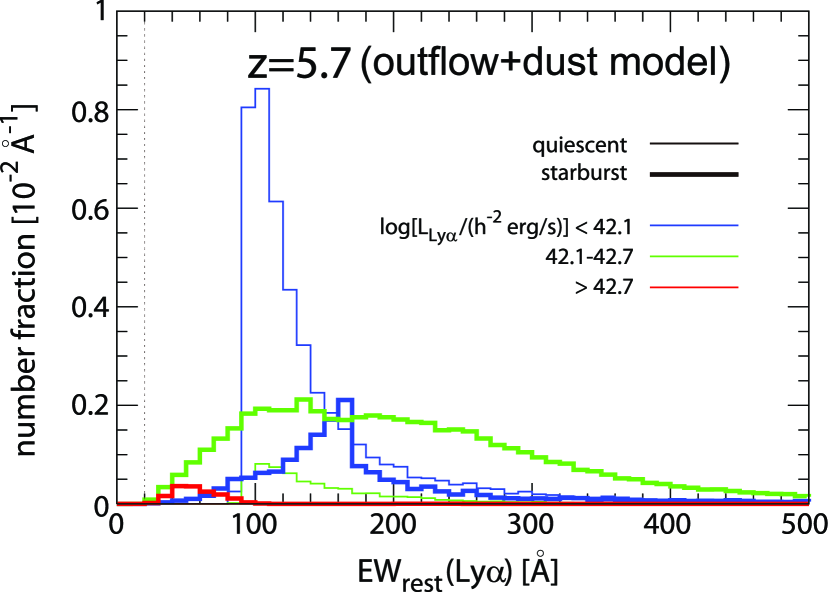
It should be noted here that we do not set any criterion on the equivalent width (EW) of Ly lines for model galaxies to be selected as LAEs. Though the observations of LAEs usually set threshold values for EW in the selection, the effect of different EW thresholds on the predicted Ly LF is small. We show the model calculation of Ly EW distribution of LAEs at in Figure 1, which is intrinsic EW and the IGM absorption effect on the continuum is not taken into account. Here, we calculated the EW by and the continuum luminosity of model galaxies. Almost all LAEs have larger EWs than a typical threshold in observation, i.e., Å, and hence our results do not change even if we set a threshold Ly EW used in observations. This result is consistent with that of Le Delliou et al. (2006).
3. RESULTS
3.1. Luminosity Functions at 6
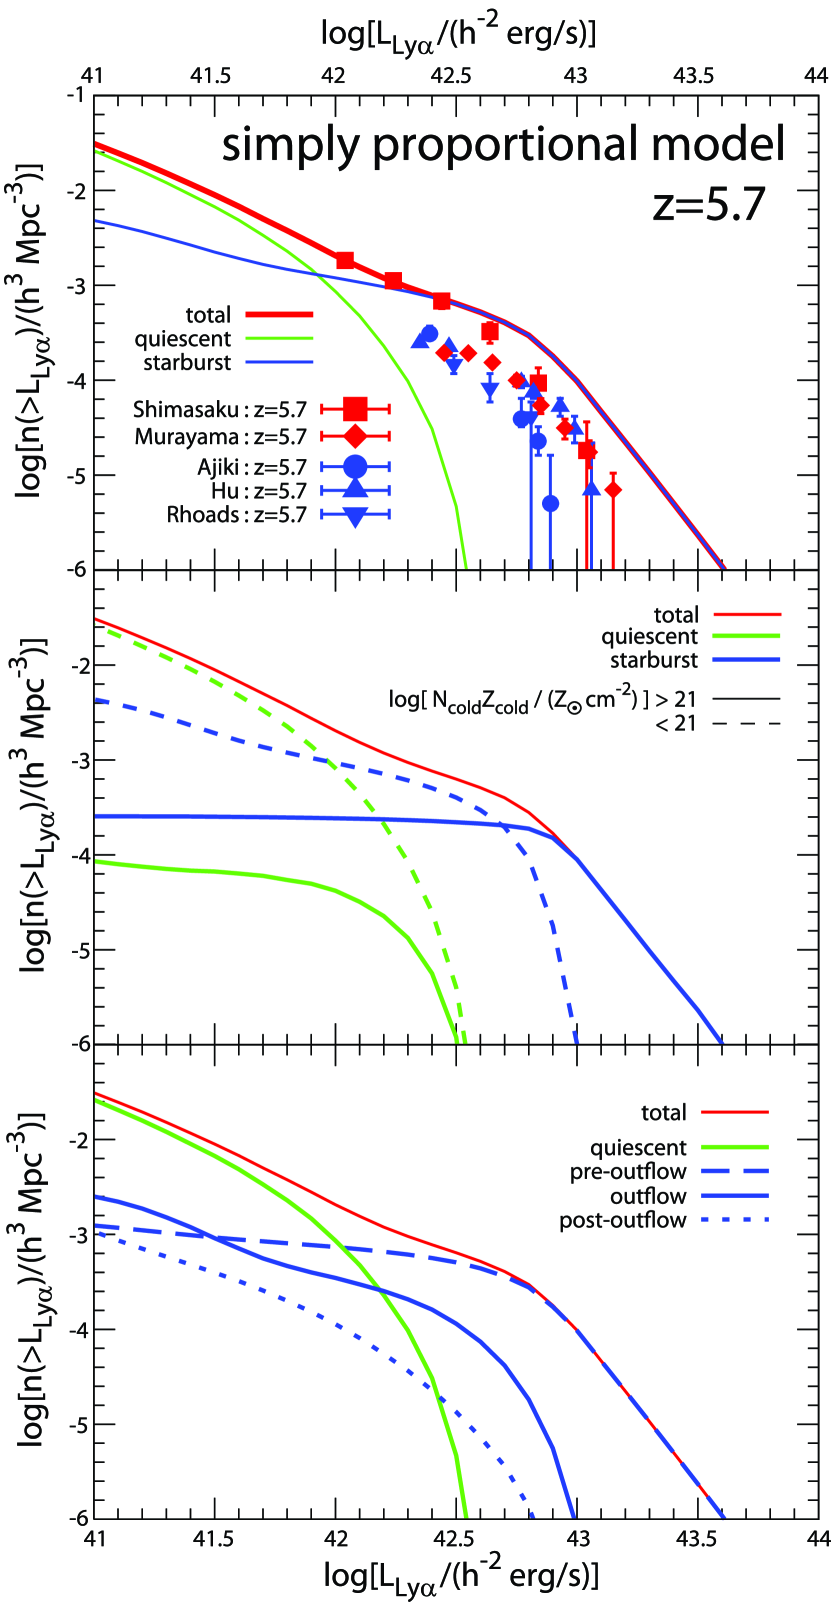
We first compare the simplest model (the simply proportional model) to the cumulative Ly LF data at in Figure 2. The best-fit is , and this model overproduces the bright-end of the LAE LF. We see from the top panel of Figure 2 that the dominant component at the bright-end of the Ly LF is the starburst galaxies, while the quiescently star forming galaxies dominate at the faint end. If we try to adjust the model to the bright end, we must assume a much lower value of than the observationally inferred value by Gawiser et al. (2006). This could be one of the possible reasons that Le Delliou et al. (2005, 2006) obtained with the same treatment for , though their model is completely independent of our own and a clear comparison is not easy.
The middle and bottom panels show that the starburst galaxies in the pre-outflow phase having high metal column densities () dominate in the largest luminosity range. This is reasonable since the most efficient Ly photon production is expected during young stage of the starburst, and the galaxies in such phase are expected to be gas and metal rich. This result indicates that the effect of interstellar dust extinction in models would reduce the number of LAEs at the bright end, in a direction to a better agreement with observations.
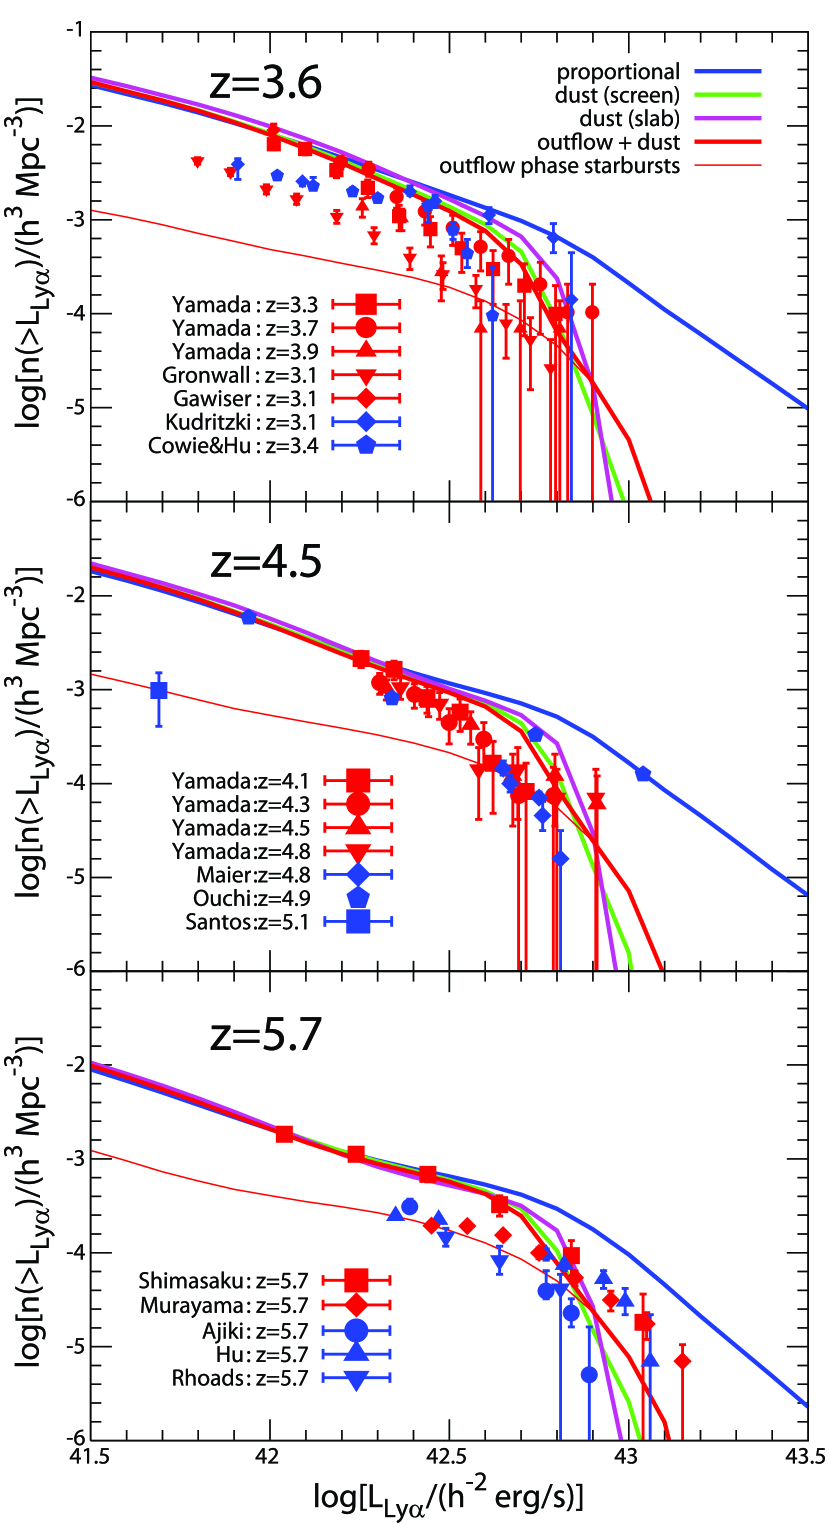
We then show the dust models and the outflowdust model in Figure 3. The fitted values of the model parameters are tabulated in Table 1. As expected, the number of the luminous LAEs drastically decreases in the dust models. However, it can be seen that this effect is too strong, and the sharp drop of LAE number at the bright end does not match well to the observed Ly LFs. In contrast, the outflowdust model well reproduces the observed Ly LFs in the whole range of Ly luminosity shown in Figure 3. It should be noted again that the number of free model parameters is the same for the dust and outflowdust models. LAEs at the bright-end are dominated by galaxies in the outflow phase, which is consistent with the observational indications of outflows. Furthermore, has been assumed for the outflowing LAEs, which is consistent with a recent observational estimate for LAEs at by Gawiser et al. (2006).
3.2. Luminosity Functions at and IGM transmission
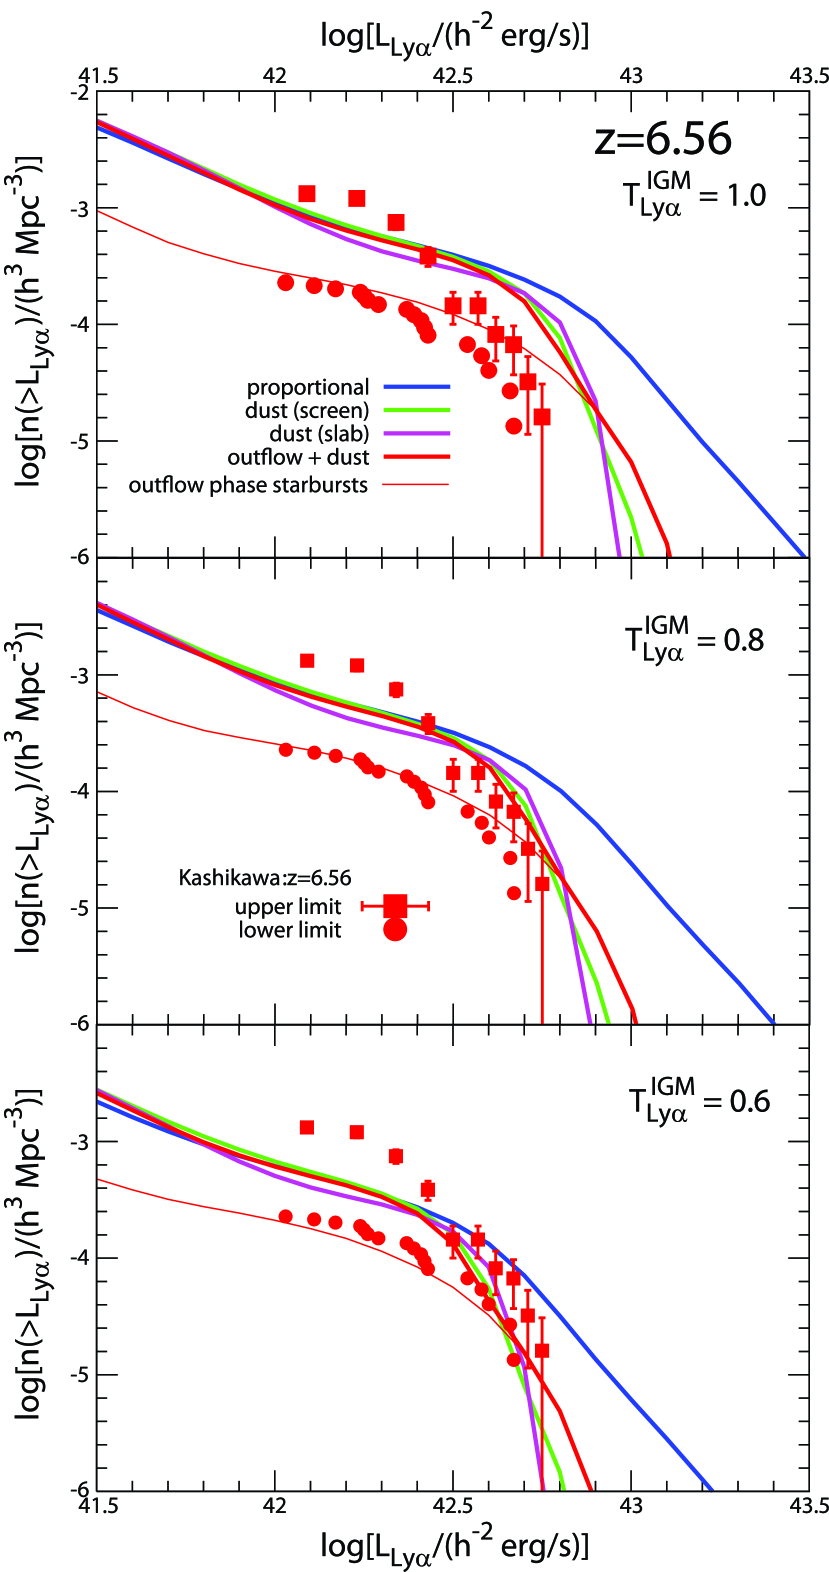
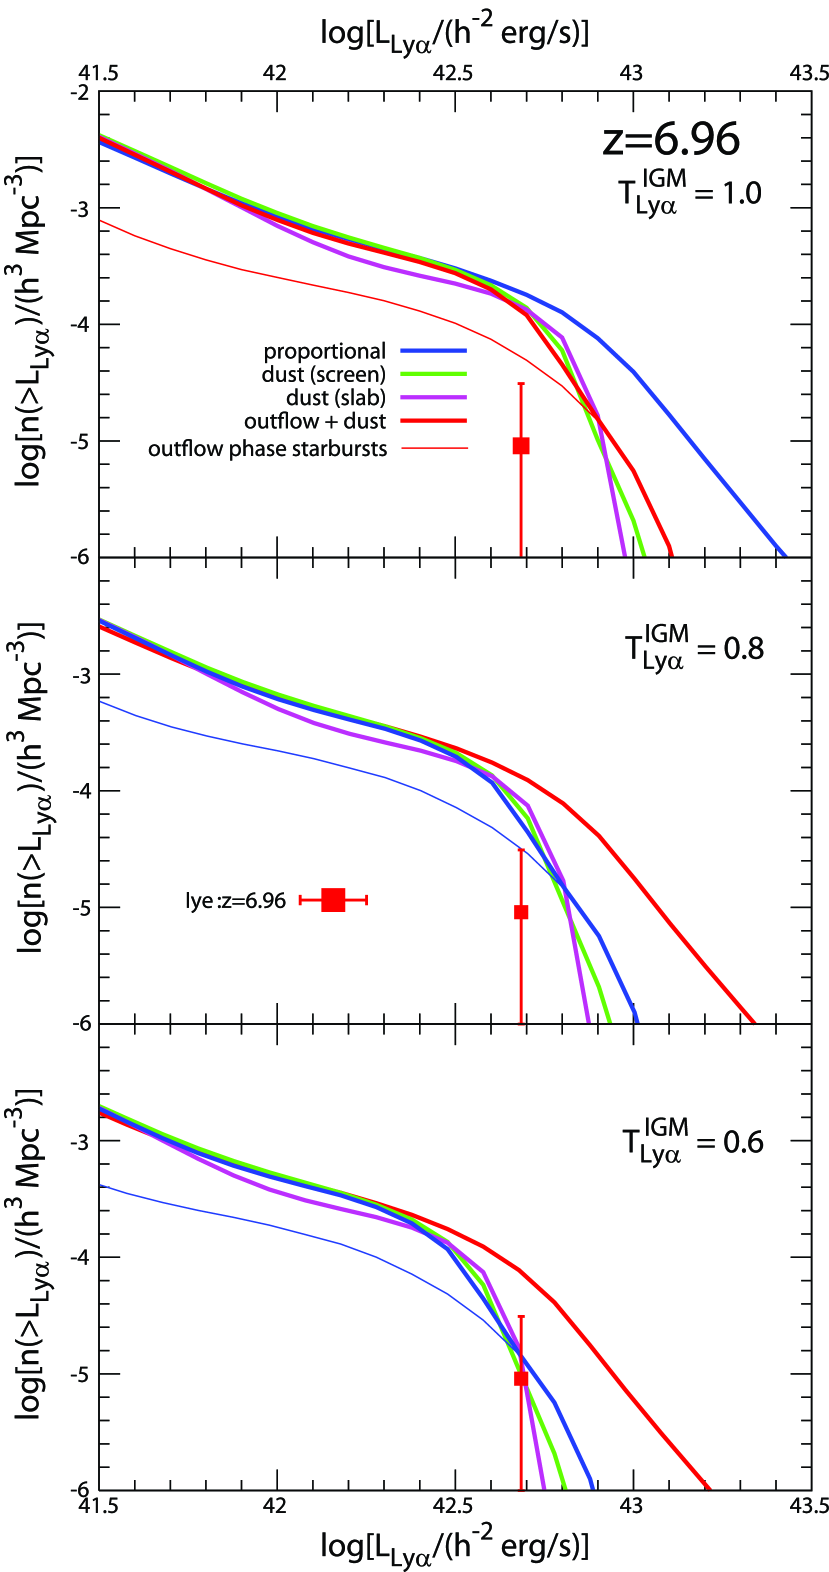
Turning now to the Ly LFs at redshift beyond 6 when the reionization is believed not to have ended yet. In contrast to the agreement at the lower redshifts, all models assuming with the same parameters determined at overpredict the number of the LAEs at compared with the observational data reported by Kashikawa et al. (2006b), as presented in the top panel of Figure 4. This discrepancy can be resolved if we adopt a simple prescription of luminosity-independent IGM transmission that is less than the unity ( 0.6–0.8); the predicted Ly LFs with 0.8 and 0.6 are shown in the middle and bottom panels, respectively, in Figure 4. We also show the predicted Ly LFs at an even higher redshift of in Figure 5. Though the statistics is obviously insufficient, the most distant galaxy found so far (Iye et al. 2006) indicates 0.7. We will discuss the implications for the reionization history from these results in § 4.
3.3. Interpretations for Intrinsic Ly LF Evolutionary Features
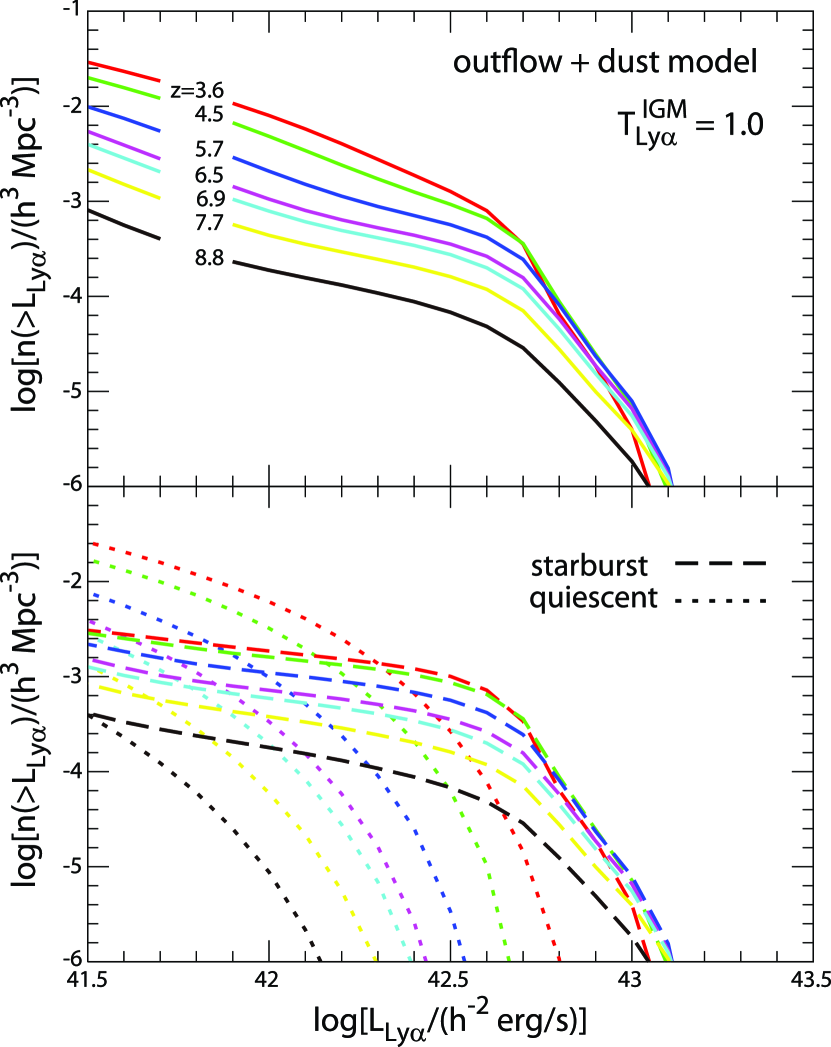
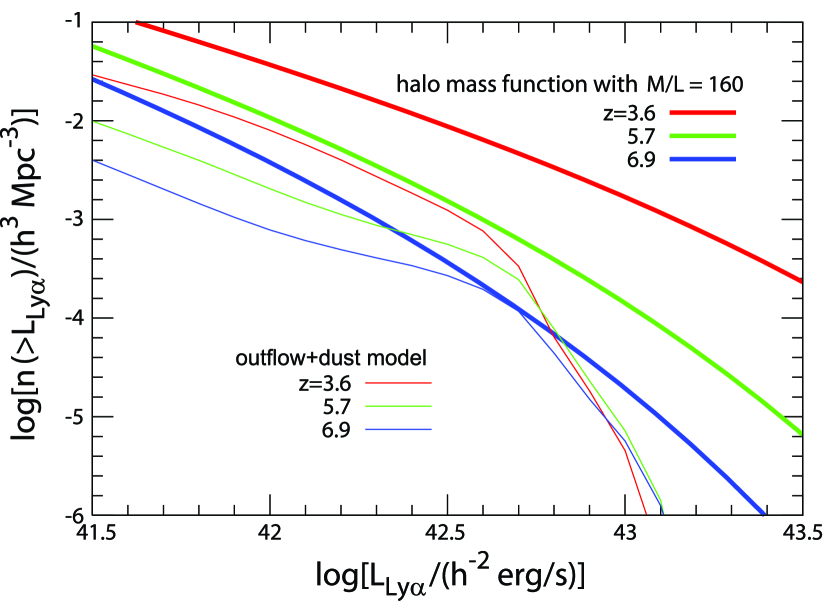
We show the intrinsic (i.e., ) evolution of the cumulative Ly LF in the outflowdust model from redshift to in Figure 6. It is also interesting to compare this evolution with that of the dark halo mass function, since a number of previous studies predicted LAE LF evolution based on the halo mass function. This is shown in Fig. 7, using the halo mass function given by Yahagi et al. (2004, hereafter YNY) that is used in the Mitaka model. Here, we adopt , where is the bolometric solar luminosity.
A clear trend of the LAE LF evolution is that the characteristic luminosity where the LFs have a break, (similar to in the Schechter function), shows very little evolution in a wide range of redshift. This seems the primary reason that the LF is not very sensitive to the redshift at . On the other hand, the degree of the evolution at is similar to that of the dark halo mass function. Therefore, a mechanism that keeps the brightest Ly luminosity almost constant against redshift would explain these trends.
Such a mechanism is likely to be a combination of the dust extinction and outflow effect. The comparison of the dust and dust+outflow models with the simply proportional model (Figs. 2 and 3) indicates that galaxies more massive than a critical mass scale cannot become bright LAEs because of heavy extinction by a large amount of gas and metals, and/or because of the large gravitational potential that prevents an efficient outflow. Therefore, even if the number of galaxies more massive than the critical mass scale should increase significantly with time by hierarchical structure formation, the mass of the brightest LAEs does not significantly evolve. This interpretation can be tested by estimating the mass of LAEs in future observations.
4. Implications for Cosmic Reionization
The requirement of to reproduce the observed Ly LFs at suggests that the IGM opacity for the Ly emission rapidly increases beyond . From the value of estimated in our analyses, we can estimate the IGM neutral fraction . Unfortunately, this procedure is highly complicated because there are many physical processes that must be considered in calculation of the attenuation factor of Ly line luminosity (Santos 2004; Dijkstra et al. 2007a). Here, we apply the dynamic model with a reasonable velocity shift of Ly line by 360 km/s redward of the systemic velocity (the dashed curve of Figure 25 in Santos 2004).
The reason for the choice of this particular model is that it predicts no attenuation when . Note that some other models of Santos (2004) predict a significant attenuation even in the case of , due to the neutral gas associated with the host haloes of LAEs. Choosing this model then means that we ascribe the sudden strong evolution of the Ly LF at only to the absorption by pure IGM. We consider that this is a reasonable assumption, since observations indicate that the escape fraction of Ly photons is about unity at least for LAEs at (Gawiser et al. 2006). If LAEs at are a similar population to the low- LAEs, we do not expect significant absorption by neutral gas physically associated to LAEs. It should also be noted that the brightest LAEs in our model LFs are in the outflow phase, and we may not expect a large amount of neutral gas around them.
For the range of at estimated from the outflowdust model, we find . At , our constraint of translates into . On the other hand, it should also be kept in mind that if LAEs are surrounded by a significant amount of nearby neutral gas that is not present for LAEs at , the estimate of as an average of IGM in the universe could become lower than those derived here.
Although the translation from into is model dependent, it should be noted that our model overpredicts the observed LAE LFs rather suddenly beyond , while it reproduces well the observed LAE LFs at without invoking the absorption in IGM. We suggest that this is an evidence for significant absorption by neutral IGM at , and it requires of order unity. This is broadly consistent with the recent constraints by other methods (Fan et al. 2006). Here we emphasize that there has been no strong “positive” evidence for a considerable amount of IGM neutral hydrogen ( of order unity) at ; quasar Gunn-Peterson tests give only a weak lower limit of (Fan et al. 2006) and the GRB 050904 gives only an upper limit of (Totani et al. 2006).
For the future studies of reionization through LAE LFs, we plot the LF evolution of the outflowdust model from to in Figure 6 with . The redshifts of and correspond to the next windows that are relatively free of bright OH lines at wavelengths of 1.06 µm and 1.19 µm, respectively. There are already several pioneering works, such as Willis & Courbin (2005), Cuby et al. (2007) and Stark et al. (2007b). Moreover, other wide-field imagers with narrow-band filters to search the redshifted Ly emission at these wavelengths will be available on 4 m or 8-10 m class telescopes in the near future (see, e.g. Cuby et al. 2007, for more detail). Our predicted LAE LF evolution would be useful for the planning of the future LAE surveys, and it can also be used as a guide to derive from the observed LAE LFs333The numerical data of the LF evolution is available on request to the authors..
5. Conclusions
We constructed a new theoretical model for Lyman alpha emitters at high- based on a hierarchical clustering model of galaxy formation (the Mitaka model), taking into account physical effects of dust absorption and galaxy-scale outflow in calculation of Ly photon escape fraction () from host galaxies. We introduced just two new parameters based on some physical considerations to include these two effects, while we kept unchanged the original model parameters of the Mitaka model that have been tuned to reproduce a number of observations of local galaxies.
The observed Ly LFs of LAEs at several redshifts in are reproduced well by our model assuming completely ionized IGM (the IGM transmission ). Especially, it has been known that the LAE LFs show very little evolution in –6 compared with the dark halo mass function, and our model can naturally explain this by the above effects newly included in this work. The escape fraction of Ly photons from LAEs in our model is , which is consistent with a recent observational estimate. Moreover, our model predicts that the bright-end of the Ly LF is dominated by the starburst galaxies in the phase of galaxy-scale outflow driven by the supernova feedback. This is also consistent with the observational results for local and high- galaxies with strong Ly emission. On the other hand, the simple model with a constant and universal requires in order not to overproduce the brightest LAEs. This is consistent with a previous theoretical study that invoked the same assumption, but the required value is considerably lower than the observed values.
In contrast to the success at , our model overpredicts the LAE LF beyond , and we interpret this as a result of Ly attenuation by neutral hydrogen in IGM. We found that a simple prescription of luminosity-independent is sufficient to explain the observed LAE LFs; the LF at is reproduced with , and that at indicates . Though it is not straightforward to derive the IGM neutral fraction from these results, the discrepancy in the case of appears rather suddenly beyond compared with the results in . Therefore we suggest that this gives an evidence for a rapid evolution of from at to a value of order unity at . This positive evidence for a significant abundance of neutral hydrogen in IGM is complementary to the constraints obtained by other methods based on quasar and GRB spectra.
Our theoretical model for the LAE LF evolution would be helpful for planning a LAE survey and for interpretation of the observed Ly LF at even higher redshifts in the future studies. Further investigation of various properties (e.g., spectral energy distribution, mass, or spatial clustering) of LAEs in our model and comparison with observations will be done in our future studies.
References
- Ajiki et al. (2003) Ajiki, M. et al. 2003, AJ, 126, 2091
- Arimoto & Yoshii (1987) Arimoto, N., & Yoshii, Y. 1987, A&A, 173, 23
- Barton et al. (2004) Barton, E. J., Davé, R., Smith, J.-D. T., Papovich, C., Hernquist, L., & Springel, V. 2004, ApJ, 604, L1
- Baugh et al. (2005) Baugh, C. M. et al. 2005, MNRAS, 356, 1191
- Bower et al. (2004) Bower, R. G. et al. 2004, MNRAS, 351, 63
- Charlot & Fall (1993) Charlot, S., & Fall, S. M. 1993, ApJ, 415, 580
- Cole et al. (1994) Cole, S., Aragón-Salamanca, A., Frenk, C. S., Navarro, J. F., & Zepf, S. E. 1994, MNRAS, 271, 781
- Cowie & Hu (1998) Cowie, L. L., & Hu, E. M. 1998, AJ, 115, 1319
- Cuby et al. (2007) Cuby, J.-G., Hibon, P., Lidman, C., Le Fèvre, O., Gilmozzi, R., Moorwood, A., & van der Werf, P. 2007, A&A, 461, 911
- Davé et al. (2006) Davé, R., Finlator, K., & Oppenheimer, B. D. 2006, MNRAS, 370, 273
- Dijkstra et al. (2007a) Dijkstra, M., Lidz, A., & Wyithe, J. S. B. 2007, MNRAS, 377, 1175
- Dijkstra et al. (2007b) Dijkstra, M., Wyithe, S. B., & Haiman, Z. 2007, MNRAS, 379, 253
- Fan et al. (2006) Fan, X., Carilli, C. L., & Keating, B. 2006, ARA&A, 44, 415
- Fernandez & Komatsu (2007) Fernandez, E. R., & Komatsu, E. 2007, preprint (arXiv:0706.1801)
- Frye et al. (2007) Frye, B. L. et al. 2007, preprint (arXiv:0704.3597)
- Gawiser et al. (2006) Gawiser, E. et al. 2006, ApJ, 642, L13
- Gronwall et al. (2007) Gronwall, C. et al. 2007, preprint (arXiv:0705.3917)
- Haiman & Spaans (1999) Haiman, Z., & Spaans, M. 1999, ApJ, 518, 138
- Haiman (2002) Haiman, Z. 2002, ApJ, 576, L1
- Hansen & Oh (2006) Hansen, M., & Oh, S. P. 2006, MNRAS, 367, 979
- Hu et al. (2004) Hu, E. M., Cowie, L. L., Capak, P., McMahon, R. G., Hayashino, T., & Komiyama, Y. 2004, AJ, 127, 563
- Hu et al. (1998) Hu, E. M., Cowie L. L., & McMahon, R. G. 1998, ApJ, 502, L99
- Inoue et al. (2006) Inoue, A. K., Iwata, I., & Deharveng, J.-M. 2006, MNRAS, 371, L1
- Iye et al. (2006) Iye, M. et al. 2006, Nature, 443, 186
- Kashikawa et al. (2006a) Kashikawa, N. et al. 2006a, ApJ, 637, 631
- Kashikawa et al. (2006b) Kashikawa, N. et al. 2006b, ApJ, 648, 7
- Kauffmann et al. (1993) Kauffmann, G., White, S. D. M., & Guiderdoni, B. 1993, MNRAS, 264, 201
- Keel (2005) Keel, W. C. 2005, AJ, 129, 1863
- Kobayashi (2005) Kobayashi, C. 2005, MNRAS, 361, 1216
- Kudritzki et al. (2000) Kudritzki, R.-P. et al. 2000, ApJ, 536, 19
- Kunth et al. (1998) Kunth, D., Mas-Hesse, J. M., Terlevich, E., Terlevich, R., Lequeux, J., & Fall, S. M. 1998, A&A, 334, 11
- Kunth et al. (2003) Kunth, D., Leitherer, C., Mas-Hesse, J. M., Östlin, G., & Petrosian, A. 2003, ApJ, 597, 263
- Le Delliou et al. (2005) Le Delliou, M. et al. 2005, MNRAS, 357, L11
- Le Delliou et al. (2006) Le Delliou, M., Lacey, C. G., Baugh, C. M., & Morris, S. L. 2006, MNRAS, 365, 712
- Lequeux et al. (1995) Lequeux, J., Kunth, D., Mas-Hesse, J. M., & Sargent, W. L. W. 1995, A&A, 301, 18
- Maier et al. (2003) Maier, C. et al. 2003, A&A, 402, 79
- Malhotra & Rhoads (2004) Malhotra, S., & Rhoads, J. E. 2004, ApJ, 617, L5
- Mao et al. (2006) Mao, J., Lapi, A., Granato, G. L., de Zotti, G., & Danese, L. 2006, preprint (arXiv:astro-ph/0611799)
- Mas-Hesse et al. (2003) Mas-Hesse, J. M., Kunth, D., Tenorio-Tagle, G., Leitherer, C., Terlevich, R. J., & Terlevich, E. 2003, ApJ, 598, 858
- Miralda-Escudé (1998) Miralda-Escudé, J. 1998, ApJ, 501, 15
- Murayama et al. (2007) Murayama, T. et al. 2007, preprint (arXiv:astro-ph/0702458)
- Nagamine et al. (2006) Nagamine, K., Cen, R., Furlanetto, S. R., Hernquist, L., Night, C., Ostriker, J. P., & Ouchi, M. 2006, NewA Rev., 50, 29
- Nagashima & Yoshii (2004) Nagashima, M., & Yoshii, Y. 2004, ApJ, 610, 23
- Nagashima et al. (2005) Nagashima, M., Yahagi, H., Enoki, M., Yoshii, Y., & Gouda, N. 2005, ApJ, 634, 26
- Nagashima et al. (1999) Nagashima, M., Gouda, N., & Sugiura, N. 1999, MNRAS, 305, 449
- Neufeld (1990) Neufeld, D. A. 1990, ApJ, 350, 216
- Osterbrock (1989) Osterbrock, D. E. 1989, Astrophysics of Gaseous Nebulae and Active Galactic Nuclei (Mill Valley: University Science Books)
- Ouchi et al. (2003) Ouchi, M. et al. 2003, ApJ, 582, 60
- Partridge & Peebles (1967) Partridge, R. B., & Peebles, P. J. E. 1967, ApJ, 147, 868
- Pentericci et al. (2007) Pentericci, L. et al. 2007, preprint (arXiv:astro-ph/0703013)
- Pettini et al. (2002) Pettini, M. et al. 2002, Ap&SS, 281, 461
- Rhoads et al. (2003) Rhoads, J. E. et al. 2003, AJ, 125, 1006
- Rhoads & Malhotra (2001) Rhoads, J. E., & Malhotra, S. 2001, ApJ, 563, L5
- Rhoads et al. (2000) Rhoads, J. E., Malhotra, S., Dey, A., Stern, D., Spinrad, H., & Jannuzi, B. T. 2000, ApJ, 545, L85
- Santos (2004) Santos, M. R. 2004, MNRAS, 349, 1137
- Santos et al. (2004) Santos, M. R., Ellis, R. S., Kneib, J.-P., Richard, J., & Kuijken, K. 2004, ApJ, 606, 683
- Schaerer (2003) Schaerer, D. 2003, A&A, 397, 527
- Shapley et al. (2003) Shapley, A. E., Steidel, C. C., Pettini, M., & Adelberger, K. L. 2003, ApJ, 588, 65
- Shimasaku et al. (2006) Shimasaku, K. et al. 2006, PASJ, 58, 313
- Somerville & Primack (1999) Somerville, R. S., & Primack, J. R. 1999, MNRAS, 310, 1087
- Songaila (2004) Songaila, A. 2004, AJ, 127, 2598
- Stark et al. (2007a) Stark, D. P., Loeb, A., & Ellis, R. S. 2007a, preprint (arXiv:astro-ph/0701882)
- Stark et al. (2007b) Stark, D. P., Ellis, R. S., Richard, J., Kneib, J.-P., Smith, G. P., & Santos, M. R. 2007, ApJ, 663, 10
- Stern et al. (2005) Stern, D. et al. 2005, ApJ, 619, 12
- Swinbank et al. (2007) Swinbank, A. M. et al. 2007, MNRAS, 376, 479
- Tacconi et al. (2006) Tacconi, L. J. et al. 2006, ApJ, 640, 228
- Taniguchi et al. (2005) Taniguchi, Y. et al. 2005, PASJ, 57, 165
- Tapken et al. (2007) Tapken, C., Appenzeller, I., Noll, S., Richling, S., Heidt, J., Meinköhn, E., & Mehlert, D. 2007, A&A, 467, 63
- Tasitsiomi (2006) Tasitsiomi, A. 2006, ApJ, 645, 792
- Thommes & Meisenheimer (2005) Thommes, E., & Meisenheimer, K. 2005, A&A, 430, 877
- Totani et al. (2006) Totani, T. et al. 2006, PASJ, 58, 485
- Valls-Gabaud (1993) Valls-Gabaud, D. 1993, ApJ, 419, 7
- Yahagi et al. (2004) Yahagi, H., Nagashima, M., & Yoshii, Y. 2004, ApJ, 605, 709
- Yamada et al. (2005) Yamada, S. F. et al. 2005, PASJ, 57, 881
- Willis & Courbin (2005) Willis, J. P., & Courbin, F. 2005, MNRAS, 357, 1348
- Wilman et al. (2005) Wilman, R. J., Gerssen, J., Bower, R. G., Morris, S. L., Bacon, R., de Zeeuw, P. T., & Davies, R. L. 2005, Nature, 436, 227
| model | |||
|---|---|---|---|
| simply proportional……. | |||
| dust (screen)……………… | |||
| dust (slab)………………… | |||
| outflowdust……………. |
Note. — The errors are statistical 1 as a result of the fit to the Ly LF of the LAEs at reported by Shimasaku et al. (2006). The screen dust extinction is adopted in the pre-outflow phase of the outflowdust model.