The Direct Detection of Lyman-Continuum Emission from Star-forming Galaxies at 11affiliation: Based, in part, on data obtained at the W.M. Keck Observatory, which is operated as a scientific partnership among the California Institute of Technology, the University of California, and NASA, and was made possible by the generous financial support of the W.M. Keck Foundation.
Abstract
We present the results of rest-frame ultraviolet spectroscopic observations of a sample of 14 star-forming galaxies in the SSA22a field. These spectra are characterized by unprecedented depth in the Lyman-continuum region. For the first time, we have detected escaping ionizing radiation from individual galaxies at high redshift, with two of the 14 objects showing significant emission below the Lyman limit. We also measured the ratio of emergent flux density at 1500 Å to that in the Lyman-continuum region, for the individual detections (C49 and D3) and the sample average. If a correction for the average IGM opacity is applied to the spectra of the objects C49 and D3, we find and . These numbers imply Lyman-continuum escape fractions at least as large as that presented in Steidel et al. (2001), measured from a composite spectrum of 29 Lyman Break Galaxies (LBGs). The average emergent flux-density ratio in our sample is , implying an escape fraction times lower than inferred from the Steidel et al. composite spectrum. If this new estimate is representative of LBGs, their contribution to the metagalactic ionizing radiation field is , comparable to the contribution of optically-selected quasars at the same redshift. The sum of the contributions from galaxies and quasars is consistent with recent estimates of the level of the ionizing background at , inferred from the H I Ly forest optical depth. There is significant variance among the emergent far-UV spectra in our sample, yet the factors controlling the detection or non-detection of Lyman-continuum emission from galaxies are not well-determined. Specifically, the two objects with detections are not differentiated in a consistent manner from the remainder of the sample in terms of their spectroscopic or photometric properties at wavelengths longer than the Lyman limit. There are also differences in the average emergent far-UV spectra of current and previous samples used to estimate the escape fraction from star-forming galaxies. Because we do not yet understand the source of this variance, significantly larger samples will be required to obtain robust constraints on the galaxy contribution to the ionizing background at and beyond.
Subject headings:
galaxies: high-redshift — intergalactic medium — cosmology: observations — diffuse radiation1. Introduction
The metagalactic ionizing background determines the evolution of the physical state of the intergalactic medium (IGM). The ionization rates of H I and He II are controlled by both the amplitude of the radiation field and its spectral shape between 1 and 4 Rydbergs. These properties of the ionizing background reflect the total and relative contributions of quasars and star-forming galaxies. It is possible to estimate the nature of the background from the quasar proximity effect (Bajtlik et al., 1988; Scott et al., 2000), and also from the evolution of optical depths of H I and He II in the Ly forests of both those species, which are probed by the spectra of bright quasars (Shull et al., 2004; Bolton et al., 2005, 2006; McDonald & Miralda-Escudé, 2001; Fan et al., 2005). Such studies indicate that, while the comoving ionizing emissivity decreases between and , the decrease in the comoving space density of quasars is much steeper, and that, by , quasars cannot dominate the ionizing background (Fan et al., 2001, 2005; McDonald & Miralda-Escudé, 2001). Even at , the mean H I optical depth, and the mean and variation in the ratio of He II and H I column densities, , may indicate a substantial contribution from star-forming galaxies (Bolton et al., 2005, 2006; Shull et al., 2004). Since Lyman-continuum radiation from galaxies appears to constitute an increasingly important ingredient of the ionizing background at redshifts beyond , and may dominate the radiation field at the epoch of H I reionization (Fan et al., 2001; Spergel et al., 2003), estimating the galaxy contribution directly represents a fundamental goal for observational cosmology.
One inherent complexity in such an estimate stems from the unknown value of , the escape fraction of ionizing photons from the interstellar medium of a star-forming galaxy. Knowledge of this escape fraction is required to convert the star-formation rate density of a population of galaxies into a comoving ionizing emissivity, a crucial component of models of reionization (Furlanetto et al., 2004; Loeb & Barkana, 2001). Theoretical models of the propagation of ionizing radiation through the ISM of disk galaxies similar to the Milky Way predict an escape fraction of (Dove & Shull, 1994; Dove et al., 2000), though this fraction may increase for high-redshift galaxies with active star-formation rates, in which supernova explosions increase the ISM porosity (Clarke & Oey, 2002) and large-scale outflows may clear out chimneys through which ionizing radiation can easily escape (Fujita et al., 2003). The model predictions for depend on the detailed structure and dynamics of the ISM, driven by the effects of supernova explosions and stellar winds. Currently, we have only fairly crude data on the properties of the ISM in distant galaxies (Pettini et al., 2001; Shapley et al., 2003), with minimal spatially-resolved information.
Another approach is to measure directly the emergent Lyman-continuum radiation from galaxies. Hopkins Ultraviolet Telescope and Far-Ultraviolet Spectroscopic Explorer () observations of a small sample of nearby starburst galaxies mostly yielded upper limits for of less than 0.10 (Leitherer et al., 1995; Hurwitz et al., 1997; Deharveng et al., 2001). Only recently, Bergvall et al. (2005) reported the first FUSE detection of Lyman-continuum emission from a local dwarf starburst galaxy, Haro 11, which implies , and will provide a useful low-redshift baseline for comparing with the observations at high redshift.
There has been some degree of controversy over the value of in galaxies at . Escaping Lyman-continuum flux was apparently detected by Steidel et al. (2001) in a composite spectrum of 29 Lyman Break Galaxies (LBGs) drawn from the high-redshift tail of the LBG selection function. If the ratio of Lyman-continuum to Å flux density observed in this composite spectrum is typical for the entire LBG sample, it implies , after correction for the average IGM opacity and the estimate that only % of 1500 Å photons escape from typical LBGs (Adelberger & Steidel, 2000). However, the spectrum may not be representative of typical LBGs, as it reflects the mean emergent spectrum for LBGs with bluer than average rest-frame UV colors and, therefore, objects less affected by dust extinction. Other attempts to measure escaping ionizing radiation from LBGs have yielded only upper limits. Giallongo et al. (2002) targeted two objects drawn from the bright end of the LBG luminosity function, obtaining an upper limit on the escape fraction that is 4 times lower than the detection in Steidel et al. (2001). This limit may not be as stringent if the two individual sightlines pass through higher than average H I optical depth in the Lyman-continuum region – i.e. application of the average IGM correction factor for may not necessarily be correct in individual cases. Fernández-Soto et al. (2003) fit the broad-band spectral energy distributions (SEDs) of 27 galaxies at , including the effects of intrinsic Lyman-limit absorption, and intervening Lyman series and Lyman limit absorption, and found on average . It should be noted that there are significant uncertainties associated with this method, because of the use of the broad HST/WFPC2 filter to probe the Lyman limit at . For galaxies towards the low redshift end of the sample, galaxy flux from above the Lyman limit falls in this filter, while for galaxies towards the high redshift end of the sample, the level of flux within the filter will be modulated primarily by the effects of IGM absorption, providing only crude information on the flux level just below the Lyman limit. Using a narrow-band filter more finely tuned to probe just below the Lyman limit for two galaxies at , Inoue et al. (2005) also found only upper limits to the escape fraction, but imaging with greater depth will be required to test if the limits are in contradiction to the Steidel et al. (2001) detection.
Because of the increasing IGM optical depth at higher redshift, it is not possible to measure escaping ionizing radiation directly from galaxies much beyond . Understanding how relates to other galaxy properties that can be measured at is required for assessing the contribution of galaxies to the ionizing background at the epoch of reionization. Therefore it is crucial to resolve the controversy over the escape fraction from galaxies at . In an effort to address this question, we have undertaken a program of deep spectroscopy of a sample of 14 LBGs, drawn from the heart of the LBG redshift selection function (). The mean and range of UV colors in this sample are representative of the total sample of LBGs, in contrast to the bluer than average sample of Steidel et al. (2001). Spectra were obtained with the upgraded LRIS spectrograph on the Keck I telescope, which provides unparalleled sensitivity in the Å wavelength range (Steidel et al., 2004). The depth in the Lyman-continuum region for individual spectra in our sample is comparable to that in the composite spectrum of Steidel et al. (2001). In order to correlate the physical properties of the ISM in these galaxies with the degree of Lyman-continuum escape, we have also obtained sensitive observations redwards of Ly for our sample, covering strong low- and high-ionization interstellar absorption features at twice the resolution of typical LBG discovery spectra.
For the first time, we present the detection of escaping ionizing radiation for individual galaxies at . Considering our two detections and 12 non-detections, we find significant variation in the escape fraction from galaxy to galaxy, and an average escape fraction which is significantly lower than the one presented in Steidel et al. (2001). Samples an order of magnitude larger are required to understand the cause of variation among the emergent far-UV spectra of LBGs in terms of stellar populations, morphology, orientation, and ISM physical conditions, and to generalize to the global contribution of galaxies to the ionizing background. In § 2, we present our observations and reductions, while § 3 contains the main empirical results. In § 4, we discuss the emergent far-UV spectra of galaxies in our sample, and conclude in § 5 with the implications for the contribution of galaxies to the ionizing background. A cosmology with , , and is assumed throughout.
2. Observations and Reductions
2.1. Deep Spectroscopic Observations
We targeted galaxies in the SSA22a field at RA=22:17:34.2, DEC=+00:15:01 (J2000) for deep spectroscopic observations. This field contains 146 photometric LBG candidates, 57 of which were spectroscopically confirmed at the time the deep observations were planned (Steidel et al., 2003). Our primary targets for deep observations were 14 bright galaxies with , twelve of which had redshifts previously determined from their original discovery spectra. With the fairly high S/N observations described below, we also measured redshifts for the remaining two galaxies. The redshift distribution is characterized by an average of , and ranges from to . Nine of the galaxies in our sample have redshifts that place them within the significant overdensity contained in the SSA22a field at (Steidel et al., 1998). However, the SSA22a field was simply chosen in order to maximize the number of bright targets with known spectroscopic redshifts that could all be placed on the same multi-object slit mask, without regard for the presence of the redshift spike.
The data were obtained during five separate observing runs in the interval 2000 October - 2002 August, using the Low Resolution Imaging Spectrometer (LRIS; Oke et al., 1995) on Keck I in its newly-commissioned double-beamed mode (Steidel et al., 2004). Conditions were photometric, with seeing ranging from 0809 for the majority of the observations, and never worse than 10. As there is not currently an atmospheric dispersion corrector for LRIS, all but a few of the exposures were taken at elevations within 30∘ of zenith to minimize the effects of differential refraction in the blue. The total range in airmass spanned from 1.06 to 1.27. Two different slit mask configurations were used in the course of data collection, containing slits with 12 width. The slit lengths varied from ” to ”, with a median of ”. The masks had different sky position angles but significant overlap in targeted objects, with 9 objects in common between the setups. On the 2000 October observing run, the slit mask had a sky position angle of . The “d560” dichroic beam splitter was used to direct light bluer than Å towards the LRIS blue channel, while longer wavelength light was sent to the red channel. The blue light was dispersed by a 400 lines mm-1 grism blazed at 3400 Å, leading to a dispersion of 1.70 Å/pixel on the engineering-grade Tektronix 2K 2K UV/AR-coated CCD, while the red light was dispersed by a 600 lines mm-1 grating blazed at 7500 Å, yielding a dispersion of 1.28 Å/pixel on the red side Tektronix 2K 2K CCD. Most slitlets had complete wavelength coverage spanning from the atmospheric cutoff at 3200 Å to redder than 7500 Å. On all subsequent observing runs (2001 June, 2001 July, 2002 June, and 2002 August) a slit mask with a sky position angle of was used. The “d500” dichroic beam splitter was used to split the incoming light beam at Å. The blue light was dispersed by the same 400 lines mm-1 grism blazed at 3400 Å, while the red light was dispersed by a 600 lines mm-1 grating blazed at 5000 Å. For the final two observing runs (June 2002 and August 2002), the new science-grade Marconi 4K 4K CCD mosaic was used for the blue-side observations. The new blue camera has smaller pixels, yielding a dispersion of Å/pixel when used together with the 400-line grism. For this second setup, most slitlets had complete wavelength coverage spanning from the atmospheric cutoff to redder than 7000 Å.
Our typical observing strategy consisted of acquiring a series of 1800 second exposures simultaneously on the red and blue sides. The telescope was dithered slightly ( arc second) between exposures in order to sample different parts of the detectors. We obtained 6 hours of total integration time for both red and blue side observations in 2000 October, hours in 2001 June, hours in 2001 July, hours in 2002 June, and hours in 2002 August. Not all of the data acquired were included in the final stacked spectra. For red side spectra, data from 2001 June, 2001 July, 2002 June, and 2002 August were included; for blue side spectra, data from 2000 October, 2001 June, 2001 July, and 2002 August were included. At wavelengths below 4000 Å, only 2002 August blue side data were included in the final spectra, as the sensitivity of the science-grade blue detector in this wavelength range is a factor of better on average than that of the engineering-grade detector.111Red side data from 2000 October were not included because of only partial overlap in wavelength coverage with subsequent observations, and because of problems with background subtraction caused by internal reflections. Blue side data from 2002 June were not included because the necessary twilight flat field exposures were not obtained. The resulting total integration is hours below 4000 Å, hours between 4000 and 5000 Å, and hours above 5000 Å. For a minority of the sample, only a subset of the this integration time was available. Table 1 lists the magnitudes, and colors, Ly emission and interstellar absorption redshifts, and total LRIS integration times in the wavelength ranges Å, Å (blue side), and Å (red side), for the 14 objects targeted with deep spectroscopy.
Spectroscopic flat fields for the red side data were obtained at the end of an observing sequence using an internal halogen lamp. While flat fields were not used to correct blue side data taken with the engineering-grade detector, twilight flat fields were obtained during the August 2002 observing run using the science-grade blue detector. The science-grade detector is characterized by a wavelength-dependent flatfield pattern that becomes especially pronounced below 4000 Å. Fluctuations resulting from imperfect correction of the flatfield pattern constitute one of the largest sources of systematic uncertainty in our measurements of flux in the Lyman-continuum region, as we attempt to quantify in section 3.1. An observation of internal arc lamps (Hg, Ne, Ar, Kr, Xe for the October 2000 run, and Hg, Ne, Ar, Zn, Cd for all subsequent runs) was also obtained at the end of each observing sequence for the purpose of wavelength calibration. In order to flux-calibrate the deep mask spectra, a spectrophotometric standard star was observed at the end of each night through a long slit of width 10, and with the same dichroic, grism, and grating combination as the deep mask.
2.2. Data Reduction
The data were reduced using IRAF tasks, with scripts designed for cutting up the multi-object slit mask images into individual slitlets, flatfielding, rejecting cosmic rays, subtracting the background, averaging individual exposures into final summed two-dimensional spectra, extracting to one dimension, wavelength and flux-calibrating, and shifting into the vacuum frame. These procedures are described in detail in Steidel et al. (2003). There was one substantive difference in the data reduction procedures applied to the deep spectroscopic observations, relative to those used for typical LBG discovery spectra. Rather than basic redshift identification, the goals of the deep observations include sensitive absolute measurements of flux in the Lyman-continuum region and accurate measurements of the depths of interstellar absorption lines at longer wavelengths. To achieve these goals, we took considerable care with the process of background subtraction, which affects both of these types of measurements. Specifically, during the background-subtraction procedure, we made sure to exclude from the fit to the background all pixels within 0 of the object continuum location at each dispersion point. This technique eliminated most of the oversubtraction that is observed in LBG spectra with bright continua. Also, while most slits were significantly longer than 15”, we did not use more than this length to estimate the sky background level in the Lyman-continuum region. A limit of 15” provided ample slit real-estate for estimating the background level, while preventing artifacts at large slit-distances from biasing the fit near our targets.
The above procedures were applied to data from individual observing runs. After the data from each run were fully processed to one-dimensional, wavelength-calibrated, flux-calibrated, vacuum-frame spectra, we combined the spectra from different observing runs for individual objects. For a given object, the spectra obtained on different observing runs ranged in S/N by as much as a factor of , with the 2002 August spectra providing the highest S/N. Therefore, in constructing the final summed spectrum for each object at wavelengths longer than 4000 Å, we weighted the spectrum from each observing run by the square of its S/N. As described earlier, below 4000 Å, only data acquired in 2002 August with the science-grade detector were included in the final spectra. The final S/N per resolution element in the continuum redwards of Ly ranges from for our sample, with a median value of . With 12 slits, the resolution was determined by the seeing and resulting object sizes, which we measured along the slit spatial dimension to be smaller than the slit-width in almost all cases. In the final combined spectra, we estimate typical resolution elements of Å and Å on the red and blue sides, respectively.
For 9 of the 14 galaxies, both Ly emission and average interstellar absorption redshifts were measured, whereas only interstellar absorption redshifts were measured for the 5 galaxies with no detectable Ly emission. Three galaxies were characterized by double-peaked Ly emission. The average offset between Ly emission and interstellar absorption redshifts for this sample is consistent with what is observed in a much larger sample of LBGs (Shapley et al., 2003). While the current sample of spectra represent a significant improvement over typical LBG discovery spectra, in terms of signal-to-noise, they are still not deep enough for the robust measurement of the wavelengths of weak stellar photospheric features, and therefore direct systemic redshifts. Instead, galaxy systemic redshifts were estimated with the formulae presented in Adelberger et al. (2003), based on stronger interstellar features, and used to shift the spectra into the rest frame.
3. Results
3.1. Direct Detection of Lyman-Continuum Emission
Figures 1 and 2 show rest-frame ultraviolet spectra for the sample over the rest-frame wavelength range Å. Blue and red side spectra have been joined at the dichroic wavelength, which ranges in rest-frame wavelength from 1175 Å for the highest redshift object in the sample to 1345 Å for the lowest redshift object. In each spectrum, the most prominent spectral features have been marked. The strongest feature is H I Ly, which appears in a variety of forms in our sample. The Ly profiles range from strong, complete absorption (Å) to a mixture of emission and absorption (Å), to strong emission (Å). The large range of Ly profiles and equivalent widths in LBGs has been examined previously (Shapley et al., 2003), and may provide important clues about the properties of the ISM in these galaxies. In an effort to showcase interstellar metal absorption lines and the extremely faint Lyman-continuum region, while placing all of the objects on similar vertical scales, we truncated the full vertical scale of Ly for the six objects with the largest Ly emission equivalent widths (D3-ap1, D17, MD23, C24, C11, C32). In addition to Ly, we mark low-ionization interstellar absorption lines from Si II , O I + Si II , C II , and Si II , and high-ionization features from Si IV and C IV . The Si IV and C IV features also contain contributions from stellar wind absorption and emission. Finally, the H I Lyman limit at 912 Å is indicated. We note that two spectra are included for the object, D3 (D3-ap1 and D3-ap2). This object is characterized by two distinct components separated by 200 km s-1 in velocity, and 19 on the sky ( proper kpc at ).


The measurement of escaping ionizing radiation constituted one of the principal objectives in obtaining such deep spectra of LBGs. In order to measure the average flux density directly below the Lyman limit, , we adopted the strategy presented in Steidel et al. (2001). The rest-frame wavelength range used for evaluating was Å, chosen to match theoretical estimates of the mean free path, , for Lyman-continuum photons at (Madau et al., 1999). In general, the evaluation of over a wavelength baseline significantly longer than the mean free path of Å in the rest frame would be more indicative of the effects of opacity from intervening intergalactic systems than from the intrinsic ISM of the galaxies.
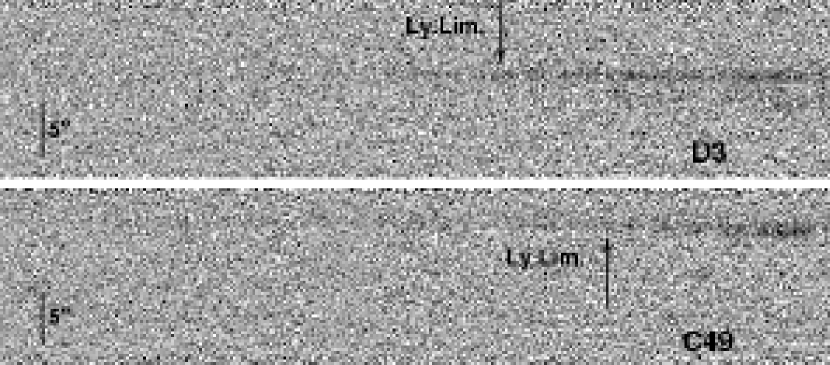
Closer inspection of Figures 1 and 2 reveals significant Lyman-continuum flux in two spectra, those of D3-ap1 (), and C49 (). For D3-ap1, we find , while for C49, we measure . The 1- errors listed here correspond to statistical, pixel-to-pixel, fluctuations. In both of these objects, the detection of flux below the Lyman limit is significant enough to stand out in two-dimensional, unextracted spectra, which are shown in Figure 3. A zoomed-in one-dimensional view of the Lyman-continuum regions is provided in Figure 4. In both the two-dimensional and zoomed-in one dimensional spectra, it is apparent that leaking flux exists at a roughly constant level well past 880 Å, down to Å in D3-ap1, and Å in C49. As mentioned above, the object D3 consists of two distinct continuum components. While the component D3-ap1 exhibits significant flux at wavelengths shorter than 912 Å, D3-ap2 has no corresponding flux, indicating the complex nature of this source, and the limits on the physical size of the region where Lyman-continuum emission is escaping. In the 13 remaining spectra (12 additional objects, plus D3-ap2), there are no significant detections of emission below the Lyman limit. Among individual spectra in our sample, the average 1 uncertainty in is , which corresponds to , and a 3 upper limit of . These numbers, again, only represent pixel-to-pixel fluctuations.
As shown in Figure 5, upon closer inspection we find that the average flux density at Å for the objects without significant detections is distributed around a value that is slightly, but significantly, negative. This artifact most likely reflects difficulty in achieving good near-UV flatfields, free from systematic spatial fluctuations. Such systematic undulations are visible in the two-dimensional spectra of some of the objects without significant Lyman-continuum detections. In order to correct for this systematic effect, we make the assumption that the objects without significant detections should have Lyman-continuum flux densities distributed around zero, and add a constant value of to all spectra in the sample. Accordingly, the Lyman-continuum flux densities listed above for C49 and D3-ap1 also include this systematic correction. The offset applied represents a lower-limit, merely the amount required to make the non-detections distributed around zero flux, rather than an unphysical, negative value. We cannot rule out the possibility that the individual non-detections are distributed around a small, slightly positive value, and therefore require a larger correction, but for the remainder of the discussion we will adopt the conservative lower-limit to interpret the data. To place the described correction in context, we note that it represents on average 2% of the continuum level at 1500 Å for objects in our sample.
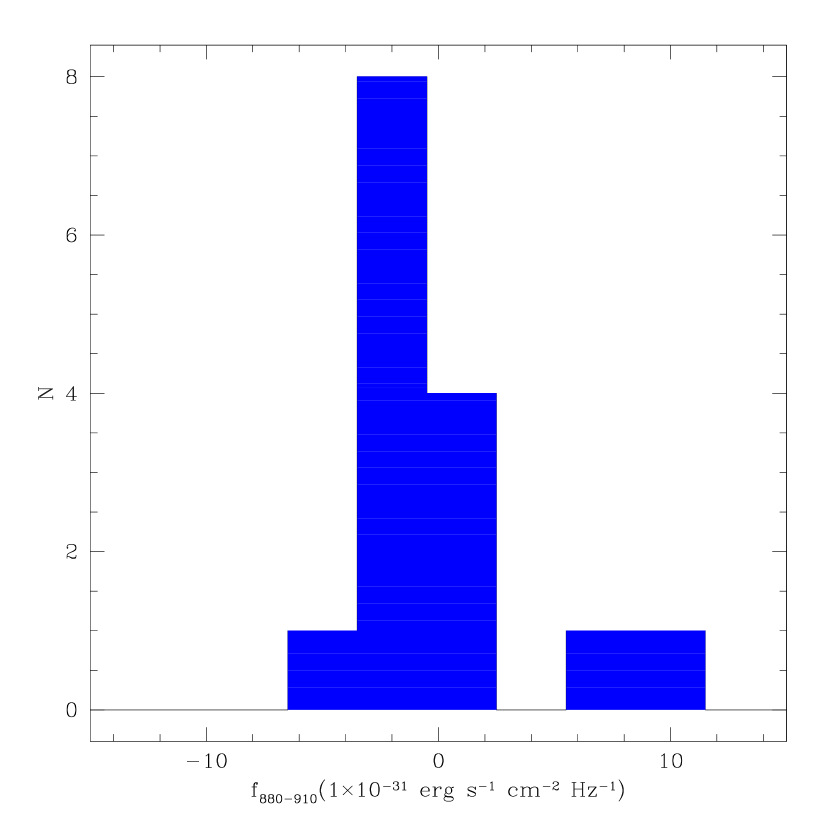
The width of the distribution of Lyman-continuum flux densities shown in Figure 5 indicates the total level of uncertainty in the individual values, including both pixel-to-pixel uncertainties and systematic sources of error arising from sky subtraction and flat-fielding. This width is . Given the typical value of the pixel-to-pixel uncertainty, , we find that the contribution to the error from systematic sources is . This value pertains to values measured from individual spectra and must be divided by the square-root of the number of spectra for the associated composite spectra. Throughout the remainder of the current work, we separately indicate statistical pixel-to-pixel, and systematic flat-fielding- and sky-subtraction-related errors.

As well as considering the Lyman-continuum flux from individual objects in our deep sample, we also measured the properties of a composite spectrum constructed from the whole sample, shown in Figure 6. This spectrum represents a simple average of all of the individual spectra following their systematic correction as described above. Given the manner in which the spectra were corrected, the mean represents the contributions from C49 and D3-ap1 alone, averaged over the whole sample. In the average composite spectrum, we find . While it does not reflect the total uncertainty in the Lyman-continuum flux-density level, the pixel to pixel noise represents a 1 depth of , almost a factor of 3 deeper than the corresponding 1 depth of the composite LBG spectrum used to measure Lyman-continuum emission in Steidel et al. (2001).
3.2. Properties of Galaxies with Lyman-Continuum Detections
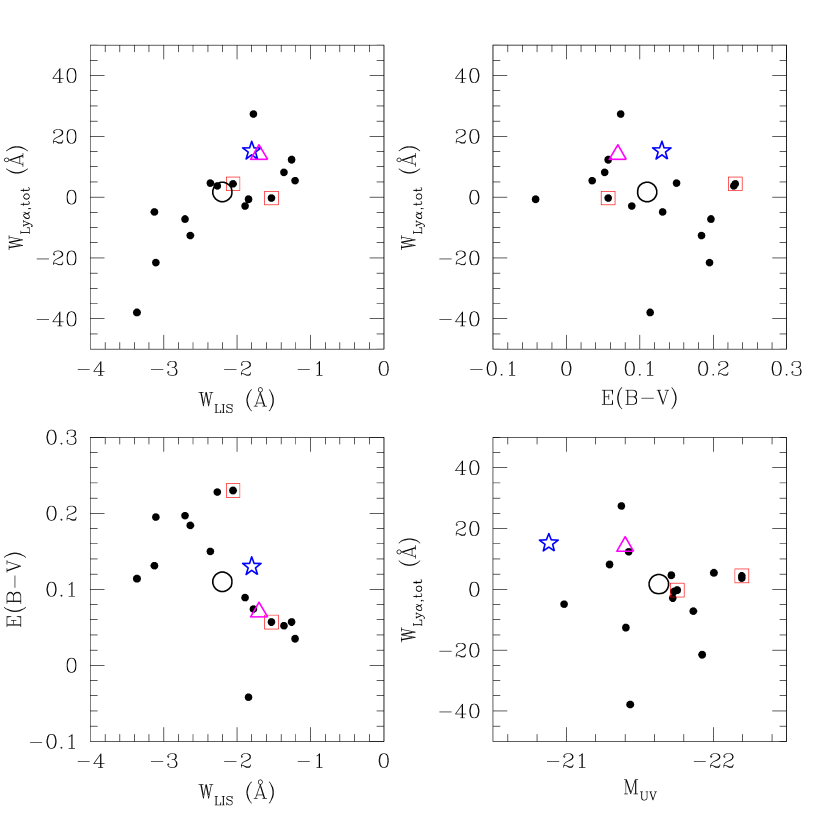
We now consider the observed properties of D3 and C49 in order to discern if they stand out from objects without significant Lyman-continuum flux detections. There are a number of additional observations of D3, including ground-based and HST/NICMOS near-IR imaging, ground-based near-IR spectroscopy, and deep narrow-band imaging tuned to the wavelength of Ly at the redshift of the SSA22a galaxy overdensity. There were no spectroscopic observations of C49 prior to the deep ones presented here, and there are accordingly fewer multi-wavelength data points for this object. Figure 7 includes plots of several different rest-frame UV properties for objects in the deep sample, including Ly equivalent width; average low-ionization interstellar absorption equivalent width (based on the strengths of Si II , O I + Si II , C II , and Si II ); ; and rest-frame UV absolute magnitude, uncorrected for dust extinction. D3 and C49 are highlighted in each figure, as well as the average values for the three different LBG samples listed in Table 2.
3.2.1 Rest-frame UV Properties
D3 has the brightest rest-frame UV luminosity in the current sample, with . The flux in the -band represents the sum of the flux from both components of D3 (i.e. D3-ap1 and D3-ap2), which were treated as a single object in the original photometric catalog. As estimated from the ratio of continuum levels in the spectra of D3-ap1 and D3-ap2, D3-ap1 is approximately two times as bright as D3-ap2, and this ratio is roughly constant over the wavelength range Å, where the flux-calibration is accurate. The ratio between the D3-ap1 and D3-ap2 spectra should closely resemble the true component ratio, since the slit position angle of east of north is within of the observed angle between the two components in the optical imaging data. C49 is brighter than the median of the deep sample in rest-frame UV luminosity, while not as extreme as D3. In a broader comparison of rest-frame UV luminosity, D3 is among the brightest 2% of the 811 objects in the total LBG spectroscopic sample presented in Shapley et al. (2003); C49 would have been among the brightest 8%.
We have interpreted the rest-frame UV colors of galaxies in the current deep sample assuming that the unreddened continuum is well-represented by a 300 Myr continuous star-formation model, where 300 Myr represents the median age in the LBG sample analyzed by Shapley et al. (2001). Differences in color (corrected for IGM absorption and Ly emission/absorption intrinsic to the galaxies) are interpreted as different amounts of dust extinction, parameterized by a Calzetti et al. (2000) attenuation curve. Accordingly, the observed colors can be converted into values, with the largest associated uncertainties resulting from the uncertainties in assumed underlying stellar population template, and the observational errors on color (typically at the % level). We note that estimates of UV-continuum slope and inferred directly from the shapes of the deep spectra redwards of Ly are not very robust, because the changes in relative flux level corresponding to different degrees of UV extinction are not significant over the range covered by the spectra.
As shown in Figure 7, D3 has , which implies the highest level of extinction in the deep sample, more than 2 magnitudes of attenuation at rest-frame UV wavelengths. D3 is significantly redder than the average in the deep sample, the total LBG sample from Shapley et al. (2003), and the sample of LBGs used by Steidel et al. (2001) to construct a composite spectrum that showed significant Lyman-continuum emission (see Table 2). In fact, the level of dust extinction in D3 may be even higher; simultaneously fitting the and colors of D3 (Shapley et al., 2001) yields an age Myr, and (i.e. the assumption of 300 Myr for the age will lead to an underestimate of the extinction if the true age is younger). On the other hand, Reddy et al. (2006) find that LBGs with the youngest inferred ages do not appear to follow the Meurer et al. (1999) relation between UV-reddening and dust obscuration, in the sense that they have redder UV colors for a given amount dust extinction. The young apparent age of D3 might therefore cause us to overestimate the true level of dust obscuration. As we return to in section 4, the heavy dust extinction inferred from the UV colors of this object is somewhat difficult to reconcile with the significant Lyman-continuum emission. In fact, Steidel et al. (2001) propose that it is galaxies with less reddened continua that are more likely to show escaping Lyman-continuum emission. We have also checked whether the composite nature of D3 could have led to a bias in the measured color, but find that the morphology between the and bands remains roughly constant (which is consistent with the roughly constant ratio between the continua of D3-ap1 and D3-ap2 spectra spanning from 4000 Å to 6300 Å). Therefore, the -band detection isophote applied to the band should yield an accurate representation of the color. In contrast to D3, the other object with significant Lyman-continuum emission, C49, has an inferred . This low value of places C49 among the third of the deep sample with the least extinction. It appears significantly less reddened than the average of the deep sample and the total LBG sample of Shapley et al. (2003), and even slightly bluer than the average of the blue sample presented in Steidel et al. (2001) (see Figure 7). Thus, no consistent picture emerges from D3 and C49 about the dust extinction properties of galaxies with significant escaping Lyman-continuum emission.
Now we compare the rest-frame UV spectroscopic features of D3 and C49 with those of the samples listed in Table 2. Ly is observed in emission for both components of D3, with a rest-frame equivalent width of Å in both apertures. C49 also shows weak Ly emission, but superposed on an absorption trough of roughly equal strength, such that the total equivalent width is Å. The Ly emission in C49 is actually double-peaked, though this fact is not readily apparent in Figure 4, which has been smoothed by a 3-pixel boxcar. As shown in Figure 7, D3 and C49 exhibit close to the average Ly equivalent width in the deep sample, which is itself characterized by weaker Ly emission on average than the larger LBG sample of Shapley et al. (2003) and the sample used to detect Lyman-continuum emission in Steidel et al. (2001).
Another relevant property is the strength of the low-ionization interstellar metal absorption lines. The strongest low-ionization interstellar absorption lines in the spectrum of D3 (aperture 1) are consistent with zero intensity at line center; in this aspect, the D3 spectrum may imply a unity covering fraction of gas giving rise to low-ionization metal absorption, at least at some velocities. As shown in Figure 7, the low-ionization absorption equivalent widths in D3 are close to the mean of the deep sample, which is stronger than the average in both the Shapley et al. (2003) and Steidel et al. (2001) samples; D3 also has narrower low-ionization velocity widths than the deep sample average, as estimated from the Si II and C II absorption lines. Also shown in Figure 7, C49 has weaker than average low-ionization absorption lines that do not reach zero intensity at line center, even after deconvolution of the spectral point spread function. In the absence of unresolved saturated components for which we cannot correct, it appears that C49 is characterized by neutral gas with non-unity covering fraction – i.e. a patchy spatial distribution. The strength of the low-ionization interstellar absorption lines in the spectrum of C49 is very similar to those measured from the composite spectrum of Steidel et al. (2001), in which significant Lyman-continuum emission was detected. Weak low-ionization interstellar absorption does not however appear to be a sufficient condition for escaping Lyman-continuum emission. Three galaxies in the deep sample (C32, D17, and MD23) have weaker low-ionization absorption lines than C49, and C32 and D17 also appear to have lower covering fractions of neutral gas. However, none of these three galaxies exhibit any significant emission in the Lyman-continuum region.
One striking property of D3 is the apparent weakness of Lyman series absorption. The noise in the spectrum at these wavelengths prevents a precise determination of H I column density, yet a comparison with the average spectrum of the deep sample reveals significantly weaker than average absorption in D3 from Ly, Ly, Ly. In particular, the component of D3 with detected Lyman-continuum emission is quite distinct from the rest of the deep sample in terms of the weakness of Ly absorption. On the other hand, C49 agrees very well with the deep sample average for Ly and the higher-order Lyman series absorption features.
The spectra of D3 and C49 feature both Ly emission and interstellar absorption lines, and the higher redshift of Ly emission relative to that of the absorption lines indicates kinematic evidence for large-scale outflow motions. This kinematic signature appears to be an almost universal characteristic of LBG rest-frame UV spectra (Pettini et al., 2001; Shapley et al., 2003). The velocity offset between Ly emission and interstellar absorption lines is km s-1 in D3 (aperture 1) and somewhere between and km s-1 in C49, where the range for C49 indicates the different offsets calculated using each of the two peaks of Ly emission. The velocity offset in D3 is smaller than the deep sample average for objects with both emission and absorption, as well as the average offset measured by Shapley et al. (2003). C49, on the other hand, shows a larger than average offset between emission and absorption velocities. Additional rest-frame optical nebular emission line measurements of D3 (Pettini et al., 2001) indicate that the low-ionization interstellar absorption lines are blueshifted by km s-1 relative to the H II regions, while Ly is redshifted by only km s-1. Therefore, in D3, it is the redshift of Ly relative to H II regions which is smaller than the typical value found in LBGs, not the blueshift of the low-ionization interstellar absorption lines, and the associated outflow speed (Pettini et al., 2001; Steidel et al., 2004). It will be valuable to obtain H II region emission line measurements for C49 as well, in order to locate the systemic redshift for this system, and determine the outflow speed from the blueshift of interstellar absorption lines.
Although the higher-ionization interstellar absorption lines are noisy, we can roughly estimate that the Si IV absorption is comparable in D3 to that in the average spectrum of the deep sample. The Si IV profiles are too noisy to determine a useful estimate of the velocity widths. It is not possible to measure the strength or width of the C IV line in D3, as the feature is contaminated by a strong sky residual. In C49, both Si IV and C IV interstellar absorption are weaker than the average of the deep sample. Additionally, the Si IV lines are significantly narrower than the average Si IV velocity width in the deep sample.
3.2.2 Additional Properties of D3
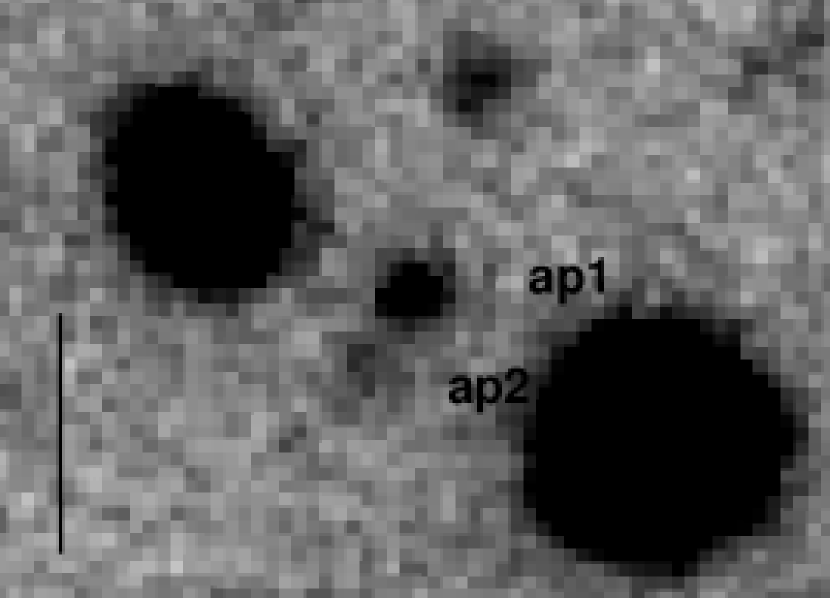
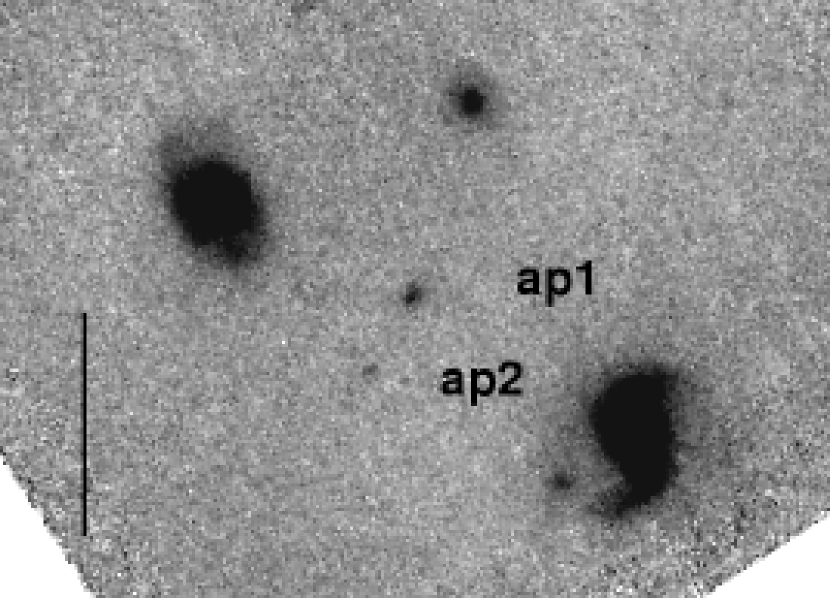
D3 is one of the brightest objects in the total spectroscopic LBG sample, and, as such, has served as an obvious target for multi-wavelength follow-up. The combination of Keck/NIRC -band photometry with existing optical observations indicates a young age for D3, of less than 10 Myr, and a stellar mass of , assuming a Chabrier IMF (Shapley et al., 2001). The intrinsic ratio of Lyman-continuum to non-ionizing UV luminosity is a decreasing function of age, so that the highest intrinsic ratio would be found in galaxies with ages as young as that inferred for D3 – though, of course, the true age for D3 cannot be less than 10 Myr, i.e., shorter than its dynamical timescale. Observations of C49 in the near-IR constitute a natural follow-up program and will allow similar age and stellar mass determinations. Keck/NIRSPEC Near-IR spectroscopy covering the [OIII] H, and [OII] emission lines enables an estimate of the chemical abundance indicator (Pagel et al., 1979). Based on the value of , Pettini et al. (2001) find O/H= (O/H)⊙ for D3, where these values refer to the revised solar oxygen abundance of (Asplund et al., 2004). The NIRSPEC spectrum is roughly centered on the D3 component showing significant Lyman-continuum emission, and the slit was not positioned at an angle to cover both components. Further near-IR information includes three orbits of HST/NICMOS F160W diffraction-limited imaging. As shown in Figure 8, the rest-frame optical image confirms with significantly sharper resolution what is suggested in the band image of D3. Specifically, the component with escaping Lyman-continuum emission has a peak surface brightness times higher than that of the other component. The brighter component is also more compact and radially-symmetric, with a diameter roughly half the extent of the longest linear dimension of the extended, irregular and diffuse emission of the second component. Longer wavelength observations of D3 thus indicate the complex morphology of a young system with a warm ionized gas phase that has already been enriched to a significant fraction of solar metallicity.
As the redshift of D3 places it within the well-studied overdensity of LBGs at (Steidel et al., 1998, 2000), narrow-band imaging can be used to reveal the spatial distribution of Ly emission in this object. The narrow-band observations of Matsuda et al. (2004) indicate that Ly emission is extended over 17 arcmin2 with a luminosity of , and roughly centered on the -band position of the component with detected Lyman-continuum emission. The large spatial extent of its Ly emission places D3 in the so-called Ly “blob” sample of Matsuda et al. (2004). The Ly luminosity reflects the number ionizing photons absorbed, and re-emitted as Ly photons by recombining gas. For more than one third of the “blob” sample, the number of intrinsic Lyman-continuum photons inferred from the UV continuum is exceeded by the number inferred from the Ly luminosity. Potential explanations for the excess of Ly emission include photoionization by a young, metal-poor stellar population with a flatter than Salpeter IMF at the high-mass end; by an AGN; by hidden ionizing UV sources; or by the diffuse intergalactic background radiation. Figure 10 of Matsuda et al. (2004), showing the star-formation rate inferred from Ly compared with that inferred from the non-ionizing UV-continuum, indicates that no such explanation is required for D3. The number of ionizing photons reprocessed into Ly emission represents only % of the number inferred from the non-ionizing UV continuum. Understanding the extended Ly emission in D3 is yet another goal in untangling the complex nature of this object. Since the redshift of C49 does not place it within the SSA22a galaxy overdensity, no information is presently available about the spatial distribution of its Ly emission.
In summary, no consistent picture emerges from D3 and C49 about the properties of galaxies with escaping Lyman-continuum emission. While C49 is one the bluest galaxies in the deep sample, D3 has the reddest observed UV continuum. While the low-ionization interstellar metal absorption lines from C49 indicate a non-unity covering fraction of cool gas, favorable for allowing the escape of Lyman-continuum photons, there are galaxies in the deep sample with weaker low-ionization interstellar absorption lines and also apparently lower covering fractions of cool gas, which at the same time do not exhibit significant escaping ionizing radiation. Furthermore, D3, which does exhibit escaping Lyman-continuum radiation, has low-ionization interstellar absorption lines that may be black at line center, indicating a unity covering fraction of cool gas. Two striking properties of D3 are its complex double morphology, consisting of a compact component exhibiting Lyman-continuum, and a fainter and more diffuse component with no corresponding detection; and its weak Lyman series absorption – significantly weaker than the typical level of absorption in the deep sample. At the same time, C49 has a simple single-component morphology, and Lyman series absorption that agrees quite well with that in the sample average spectrum. Clearly, a sample of two galaxies is too small to infer the typical properties of galaxies with escaping Lyman-continuum emission.
4. The Escape Fraction of Ionizing Radiation
The detection of escaping Lyman-continuum emission from individual star-forming galaxies at represents definite forward progress from previous statistical detections (Steidel et al., 2001) and individual non-detections (Giallongo et al., 2002; Inoue et al., 2005; Dawson et al., 2002). The range of detections and non-detections of ionizing flux in our sample can also be combined with measured 1500 Å fluxes to characterize the emergent far-UV spectral shapes of star-forming galaxies at . Ultimately, our goal is to quantify the global contribution of LBGs to the ionizing background at . The most realistic route for addressing this problem is to convert the well-characterized LBG 1500 Å luminosity function (Steidel et al., 1999; Adelberger & Steidel, 2000) into a Lyman-continuum luminosity function using the average emergent ratio of 1500 Å to Lyman-continuum flux densities, corrected for IGM absorption, and determined from a small but representative sample of LBGs.
From a theoretical perspective (Loeb & Barkana, 2001; Furlanetto et al., 2004; Cen & Ostriker, 1993), it is of interest to determine the absolute escape fraction of Lyman-continuum photons, . This quantity, defined as the ratio of Å photons produced that escape from the galaxy without being absorbed, relative to the total number produced, is difficult to estimate from even the most sensitive observations, because it relies on knowledge of the intrinsic number of Lyman-continuum photons produced. A related quantity is , first defined by Steidel et al. (2001) as the fraction of escaping Lyman-continuum photons normalized by the fraction of escaping 1500 Å photons. In practice, is a better defined observational quantity, since it can be combined with the well-determined UV continuum luminosity distribution to estimate the global contribution of LBGs to the ionizing background. It is also possible to determine from if the degree of dust extinction in the UV is known. The relative escape fraction, , can be expressed in terms of the observed 1500 Å to 900 Å flux-density ratio, , as:
| (1) |
where is the intrinsic ratio of non-ionizing to ionizing specific intensities, and represents the line-of-sight opacity of the IGM to Lyman-continuum photons, which can be estimated either empirically (Steidel et al., 2001) or through simulations (Madau, 1995; Bershady et al., 1999; Inoue et al., 2005). The real difficulty in estimating and stems from the fact that the intrinsic spectral shape for massive stars above and below the Lyman Break is not well-constrained by observations. must therefore be estimated from stellar population synthesis models, and varies in the models as a function of stellar population age, metallicity, star-formation history, and IMF (Bruzual & Charlot, 2003; Leitherer et al., 1999). Even when fixing the IMF and star-formation history, Inoue et al. (2005) find that varies from , mainly as a function of time since the onset of continuous star-formation (where the units of and are ). Both Steidel et al. (2001) and Inoue et al. (2005) adopt an intrinsic ratio of . For comparison with previous work, we adopt the same ratio here, but note the significant associated uncertainties.
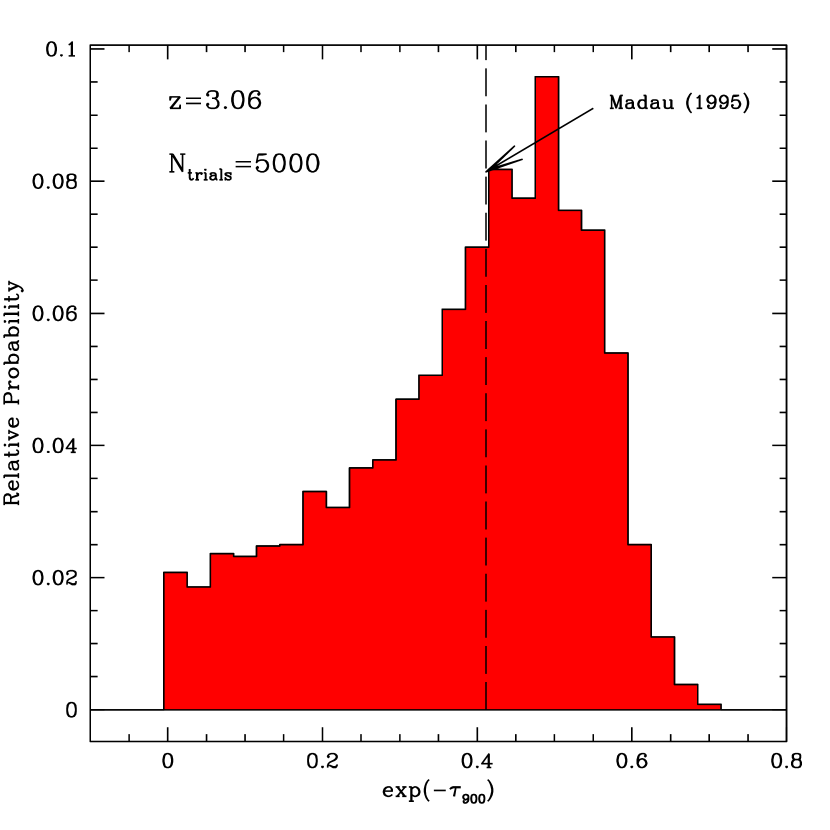
In this section, we present estimates of and for the two individual detections, as well as an estimate of the sample average and . Modeling and correcting for the effects of IGM Lyman-continuum opacity enables the conversion of a raw value to the emergent that would be observed in the immediate vicinity of a galaxy, which is one of the quantities required for estimating the global contribution of LBGs to the ionizing background at . In order to model IGM opacity, we use Monte Carlo simulations of intergalactic absorption to generate large samples of random sightlines to the redshifts of C49 and D3, and to the average redshift of the deep sample. Absorbers are drawn at random from the column-density and redshift distributions constituting the model of (Bershady et al., 1999), and then applied to the unabsorbed continuum of each simulated sightline. The resulting sample of model sightlines is analyzed to obtain the mean and standard deviation of the optical depth in the rest-frame region Å at each emission redshift. As an example, we show the simulated distribution of optical depth for the sample average redshift, , in Figure 9. In order to correct the composite LBG spectrum in Steidel et al. (2001), a more empirical approach to estimate the IGM opacity at was adopted. A sample of 15 bright QSO spectra at were combined to create a composite spectrum with no intrinsic Lyman-continuum opacity, yielding the average intervening absorption in the Lyman continuum over 15 random sightlines. The absorption estimated in this empirical fashion was a factor of , which agrees well with the estimate of a factor of from our simulated sightlines. Finally, in this section, we also attempt to quantify the sample variation in , taking into account sightline to sightline variations in IGM opacity.
4.1. The Emergent UV Spectrum: C49, D3, and the Sample Average
The observed UV-to-Lyman-continuum flux-density ratio in C49 is . Simulations of IGM neutral hydrogen opacity indicate that, on average, the flux level in the rest-frame range Å is attenuated by a factor of for sources at (the redshift of C49). If the line of sight to C49 is typical for its redshift, then the emergent far-UV flux-density ratio from the galaxy is , very similar to that inferred from the composite LBG spectrum Steidel et al. (2001). Furthermore, the rest-frame UV colors of C49 imply that differential dust extinction between the UV and Lyman-continuum is not significant. Assuming the same intrinsic ratio of as Steidel et al. (2001), we find % for C49. If C49 is, however, an unusually transparent sightline, the emergent UV-to-Lyman-continuum ratio is larger. Our Monte Carlo simulations of IGM opacity indicate that, at a 95.4% (i.e. 2) confidence level, the attenuation in the Å rest frame falls between a factor of 38 and 1.7. At the transparent edge of the 2 confidence interval, the IGM attenuation implies , and %. Given that continuum flux is detected in C49 down to Å, it is likely for the transparency to be higher than average in the Å range. It is important to note here that one cannot infer the transparency level in the range Å, based on , the continuum decrement at Å. indicates absorption from intervening Ly lines, and is dominated by low-column-density systems (i.e. ). On the other hand, the Lyman-continuum attenuation factor is modulated by the number of intervening systems with at redshifts such that the associated Lyman-limit absorption falls in the window of interest. Accordingly, our Monte Carlo IGM simulations indicate the absence of a correlation between and the attenuation factor at Å.
In D3, the UV-to-Lyman-continuum flux-density ratio is estimated using the Å flux from both components, compared with the Lyman-continuum detection from aperture 1, alone. This comparison yields . Correcting for the average Å attenuation of a factor of at (the redshift of D3), we find , which is roughly the same as the intrinsic ratio of assumed by Steidel et al. (2001) and Inoue et al. (2005), and therefore implies %! Again, it is worth noting that the inferred significant dust extinction in D3 is difficult to reconcile with such an extreme value of , as a reasonable extrapolation of the Calzetti et al. (2000) attenuation law would imply significantly more attenuation at 900 Å than at 1500 Å.
There are multiple ways to explain the extreme and apparently contradictory properties of D3. First, in addition to the possibility that interpreting the UV color with the Calzetti law causes us to overestimate the overall dust extinction in D3 (see section 3.2.1), the inferred for this object may only suffice as a global quantity, averaged over the entire surface area of the galaxy. If, in fact, the escaping Lyman-continuum emission is patchy, and preferentially escaping from regions with less dust extinction, it may not be appropriate to use the average to interpret the emergent ratio of UV to Lyman-continuum radiation. Future HST/ACS imaging in two filters may constrain the detailed dust extinction distribution in this source. Second, the average correction for IGM opacity along the line of sight may not apply to an individual sightline. For a given emission redshift, there is significant variation in the rest-frame Å opacity from sightline to sightline. In our Monte Carlo simulations of IGM opacity, we found that, at 95.4% (2) confidence, the attenuation in the Lyman continuum at ranged between 35 and 1.6. Using 1.6 as a lower limit on the IGM attenuation, we derive . Compared to an assumed ratio of 3, this yields %. As in the case of C49, adopting a lower than average IGM opacity in the Lyman continuum may indeed be suggested by the persistence of the D3 continuum down to rest wavelengths of Å, well below one Lyman-continuum mean free path. Third, we consider the possibility that the intrinsic UV continuum of D3 is not dominated by stars, but by the emission from an AGN, with a smaller intrinsic ratio of . This scenario is not supported by rest-frame UV spectroscopic observations. We detect no strong C IV or N V emission in the rest-frame UV spectrum, which would be characteristic. Furthermore, HST/NICMOS high-resolution imaging reveals no unresolved nuclear emission in the rest-frame optical. Future X-ray and mid-IR observations with Chandra and Spitzer, respectively, may constrain the contribution of an AGN to the emission in D3.
Finally, there is the possibility that the apparent detection of flux below the Lyman limit in D3 results from scattered light from the outer isophotes one or both of the bright galaxies within several arcseconds of the position of D3-ap1. These bright neighbors stand out in the and F160W images in Figure 8, with centroids 54 to the northeast of D3-ap1, and 59 to the southwest. Perhaps most relevant, the brighter southwest object has , while the northeast object has . D3 is unique among the objects in the deep sample, in terms of being flanked by such bright objects. While the mask position angle was chosen to be roughly parallactic for exposures at hour angles east of overhead, the direction of differential refraction for exposures obtained when the SSA22a field was setting is such that light from the brighter southwest object was bent in the direction of the D3 slit. However, even in the worst case scenario, the deflection at 3600 Å for the setting exposures with the maximum airmass is still only 064, a small fraction of the distance between the bright southwest object and the edge of the D3 slit. Nonetheless, the unusual configuration of D3 with its bright neighbors should be noted.
We also consider the mean observed UV-to-Lyman-continuum flux-density ratio for the entire sample of 14 objects with deep spectra, by constructing a composite spectrum for which each individual galaxy spectrum was scaled to a common mode at Å before averaging. This mean ratio is , where the two sources of error reflect the pixel to pixel noise in the composite spectrum and the systematic uncertainties in the individual values of due to flatfielding and sky-subtraction, respectively. The mean redshift of the sample is , very close to that of D3. Therefore, the same correction factor for IGM opacity (2.6) can be applied to this ratio to obtain the average emergent UV-to-Lyman-continuum ratio. With this correction, we obtain . Assuming an intrinsic UV-to-Lyman continuum ratio of , as in Steidel et al. (2001), we find % for the deep sample – a factor of lower than the value of reported in Steidel et al. (2001). We will return to this result in section 5. While significantly smaller than the uncertainty in opacity for an individual sightline, the average opacity for a sample of 14 sightlines has an associated error, because of the finite number of sightlines being averaged together. To estimate this uncertainty, we drew a large number of random samples of 14 sightlines from our simulations of single IGM sightline opacities. For each random sample, we computed the average IGM opacity, and then computed the mean and width of the distribution of IGM opacities averaged over 14 sightlines. With 95.4% () confidence, we found that the average IGM opacity for the sample of 14 sightlines requires a correction factor between and , implying that falls between and . The corresponding range in is 11%18%, assuming as before.
There are two important caveats associated with our attempts to model and correct for IGM opacity and infer the shape of the emergent far-UV spectrum, . First, the IGM simulations we performed to characterize the distribution of attenuation factors in the Lyman-continuum region are based on the assumption that each random sightline is a probing the average properties of the IGM, and do not include the effects of large-scale structure. In fact, nine of 14 of the galaxies in our sample have redshifts that place them within the significant overdensity in the SSA22a field discovered by Steidel et al. (1998), which is characterized by at . Most likely, the space density of optically-thick Lyman limit systems with is enhanced within the redshift range of the protocluster, tracking the galaxy density. Our simulations indicate that the attenuation in the Å range is more than twice as high for sightlines with intervening Lyman limit systems within one Lyman-continuum mean free path of the emission redshift, as opposed to sightlines without such absorbers. Therefore, we expect a corresponding enhancement in the average rest-frame Å attenuation for a composite spectrum dominated by protocluster galaxies. The magnitude of the enhancement in the average attenuation is not obvious, however, as demonstrated by the cases of our two individual Lyman-continuum detections. The sightline of C49 () passes through the overdensity, for example, yet it features very little if any Lyman-continuum absorption at . The redshift of D3 places it within the protocluster, yet its spectrum also appears fairly transparent in the Lyman-continuum region. A more careful treatment accounting for the relative spatial distributions of absorbers and galaxies is required to quantify the effect of the protocluster on the average IGM opacity in the Lyman-continuum region for our sample, yet we can state qualitatively that the average Lyman-continuum attenuation factor of 2.6 likely represents an underestimate.
The second, related, caveat stems from the assumption in the IGM simulations that each randomly-generated sightline is probing a volume that is statistically-independent from the volumes probed by all other random sightlines. Since our sample is contained within an area of comoving Mpc2 on the sky, % of the resulting set of galaxy sightline pairs are separated by less than 5.7 comoving Mpc, the auto-correlation length of LBGs (Adelberger et al., 2005). This auto-correlation length is relevant since it has been demonstrated that, at least at , intervening absorbers are associated with galaxies and therefore have similar clustering properties (Steidel, 1990; Adelberger et al., 2003). The IGM opacity along neighboring sightlines in our sample must then be correlated, so it is not strictly correct to treat the galaxy sightlines as statistically independent of each other during our simulations. The above caveats should be borne in mind throughout the remainder of the discussion.
4.2. Variation in The Emergent UV Spectrum
It is very striking that C49 and D3 appear to have such significant Lyman-continuum fluxes and low ratios of UV to Lyman-continuum flux densities, while the remainder of objects in the sample are characterized by non-detections. If there is significant variance in the emergent far-UV spectral shape in LBGs, understanding the origin of the variance will be a crucial component of characterizing the reionization of the universe. Therefore, the apparent variance in must be quantified more concretely, and related to the range of emergent far-UV spectral shapes, corrected for IGM absorption (i.e. ).
First, as the sample spans a range in , it is important to confirm the fraction of our sample for which the observed ratios of C49 and D3 are detectable at the level. Since C49, for example, has a Å flux density that is above the median in the sample, it is possible to detect larger ratios in this object than in an object such as MD14, which has one of the faintest Å flux densities in the sample. By comparing the Å fluxes of all the objects, with the pixel to pixel noise limits in the Å wavelength range, we find that the observed for D3 could have been detected in all of the objects. The UV-to-Lyman-continuum flux-density ratio in C49, , could have been detected in all but the two faintest objects, D7 and MD14. In fact, we find that the median detectable flux-density ratio for individual objects in the sample was . The most sensitive limit was for C32, in which we could have detected , while the least sensitive was for D7, in which we could only have detected a ratio of . 222The ability to detect larger ratios of for D7 is limited not only by the object’s fainter-than-average flux at 1500 Å, but also by its relatively low redshift (), which causes rest-frame Å to fall at a bluer-than-average observed wavelength range with higher pixel-to-pixel noise than the typical value in our sample. We therefore conclude that the finite depth of our observations did not prevent us from detecting objects similar to D3 and C49. If additional objects with similar had been in the sample, we would have detected Lyman-continuum flux from them.
Second, in order to determine the range of emergent UV-to-Lyman-continuum ratios in the sample, we must take into account the uncertainty in IGM opacity along the line of sight in the Lyman-continuum region. For the sake of simplicity, though, we first consider the case in which all objects in the sample are characterized by the same IGM correction factor, and therefore, that the relative values (or limits) in translate directly into the relative values on . In this case, we find significant differences among the emergent flux-density ratios. Six objects have emergent UV-to-Lyman-continuum ratios greater than twice the ratio in C49, while 11 objects have emergent flux-density ratios greater than twice that in D3.
Of course, variance in does not necessarily imply the same level of variance in . In qualitative terms, if C49 and D3 happen to have significantly more transparent lines of sight than the average at , while other objects in the sample with Å non-detections have sightlines with significantly more than average attenuation in the Lyman continuum, then the non-detections could easily have equivalent values. At , the dispersion in IGM opacity for individual sightlines is fairly large. Once the uncertainty in IGM opacity for individual sightlines is included, the constraints are considerably weakened on the relative emergent flux-density ratios of C49, D3, and individual Lyman-continuum non-detections in the sample. In spite of this fact, we can still place some constraints on the sample variance in , by comparing C49 and D3 with the average of the remaining 12 objects in the sample, for which the observed lower limit on the UV-to-Lyman-continuum ratio is . This lower limit was estimated from the average spectrum of the objects without significant Lyman-continuum detections, using the flux density at 1500 Å and the upper limit at 900 Å, and includes both statistical and systematic uncertainties. 333The lower limit may be smaller if the systematic flux offset applied to the spectra (see section 3.1) underestimates the true required value. However, we proceed with the assumption that the offset applied was the correct one. The uncertainty on the average IGM opacity for 12 random sightlines is significantly smaller than for a single line of sight. For this 12-spectrum average, the 95.4% confidence interval on the correction factor for IGM attenuation yields (the factor 13 [20] corresponds to the most [least] IGM attenuation), though these numbers do not include the effects of the SSA22a galaxy overdensity on the Lyman-continuum opacity. As discussed above, the 95.4% confidence limits for C49 are , while they are for D3. The lower limits on are unphysical, but here we are only interested in the upper limits. Unless neglecting the SSA22a galaxy overdensity causes us to underestimate significantly the average IGM opacity for the 12 non-detections, we have indeed demonstrated that the emergent UV-to-Lyman-continuum ratios in C49 and D3 are significantly different from the average of the remaining objects in the sample with only Lyman-continuum non-detections. The challenge now is to explain this variation.
5. Implications
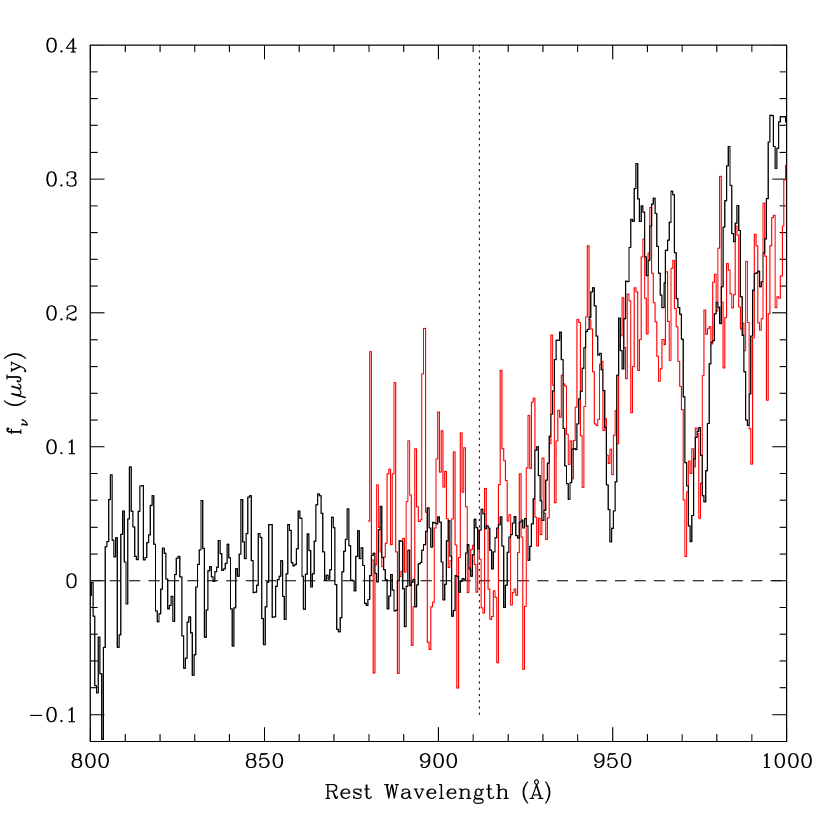
In the previous section, we found a sample average UV-to-Lyman-continuum flux-density ratio, corrected for IGM absorption, of , which translates to a relative Lyman-continuum escape fraction of %. The corresponding values in Steidel et al. (2001) are (slightly different from the value of presented in that paper, because of the different method used for correcting for IGM absorption), and %. Therefore, using the average IGM opacities for the average emission redshifts for each sample, we find that the estimate of for the current LBG sample is times lower than that of the sample in Steidel et al. (2001). If we consider the 95.4% confidence intervals on IGM opacity for a sample of 29 sightlines at and 14 sightlines at , we still find that for the present sample is at least times lower than that for the Steidel et al. (2001) sample. Figure 10 shows a zoomed-in view of the Lyman-continuum regions for the Steidel et al. (2001) composite (in red) and the new composite (in black), with the spectra scaled to the same value at Å. The Steidel et al. (2001) spectrum, while noisier, is still characterized by a mean flux-density value in the Å region that is more than three standard deviations (as measured by pixel-to-pixel fluctuations) higher than the mean flux density in our new LBG composite spectrum.
If we adopt the new estimates for and as representative of the LBG population, it is possible to scale the values from Steidel et al. (2001), to estimate the global contributions of LBGs to the ionizing background at . For this estimate, we use to convert the published LBG Å luminosity function (Adelberger & Steidel, 2000) to one at Å. This Å luminosity function is integrated down to to estimate the comoving emissivity from LBGs at the Lyman limit. Taking into account the mean free path of Lyman-continuum photons at , which is , we find . 444The Steidel et al. (2001) result was derived using an Einstein-de Sitter cosmology. However, , which is directly proportional to the product of comoving emissivity and Lyman-continuum mean free path, is roughly independent of cosmology. Therefore, we are justified in applying a simple scaling to the Steidel et al. value for . If the composite spectrum in Steidel et al. (2001) is adopted as characteristic of the entire LBG population, the inferred contribution to the ionizing background is correspondingly higher: . Because the galaxies included in the Steidel et al. composite spectrum are drawn only from the bluest quartile of LBGs, that spectrum may only be representative of % of LBGs. Under the assumption that the bluest quartile of LBGs are also the most likely to have escaping Lyman-continuum emission and that the remaining, redder, LBG population is characterized by a negligible escape fraction, the Steidel et al. composite spectrum translates into a value consistent with the one presented here. Combining a new measurement of the faint end of the QSO UV luminosity function with existing data on the bright end, and assuming 100% escape fraction of ionizing radiation at all QSO luminosities, Hunt et al. (2004) present estimates of the QSO contribution to the ionizing background at . This estimate is , very similar to the estimate for LBGs presented in this work. 555The Hunt et al. (2004) work also assumed an Einstein-de Sitter cosmology, and therefore makes for a fair comparison with the Steidel et al. (2001) results, and, by extension, the current estimate of from galaxies. Because the estimate of is roughly independent of cosmology, the values presented for QSOs and galaxies in Hunt et al. (2004) and the current work, respectively, can also be compared consistently with values based on an , cosmology (e.g., those in Bolton et al., 2005). If galaxies and QSOs contribute roughly equal amounts to the ionizing background at , this should be reflected in the spectrum of the metagalactic ionizing radiation field, which in turn determines the relative rates of ionization of intergalactic hydrogen and helium (Haardt & Madau, 1996; Cen & Ostriker, 2006; Bolton et al., 2006).
It is valuable to compare our results with recent estimates of the metagalactic hydrogen ionization rate derived using independent methods. Modeling the observed Ly forest opacity in QSO absorption spectra using a suite of high-resolution hydrodynamical simulations, Bolton et al. (2005) conclude that the global hydrogen ionization rate at is . With a spectral slope for of , as in Madau et al. (1999), this corresponds to . If the shape of the ionizing spectrum lies between and , the conversion between and ranges between and . Adopting the Steidel et al. (2001) composite spectrum as representative of the entire LBG population therefore translates into a LBG contribution to the ionizing background exceeding by more than a factor of the value of inferred from modeling the Ly forest absorption. In contrast, our new estimate for the contribution from LBGs to the ionizing background does not exceed the Ly forest-inferred result, and, furthermore, the new sum of the contributions from galaxies and QSOs (Hunt et al., 2004) is roughly consistent with the total H I ionizing radiation field presented in Bolton et al. (2005). It is worth noting that the quasar proximity effect study of Scott et al. (2000) indicates a value for the ionizing background at that is roughly twice as large as the one in Bolton et al., and is arguably a more direct method. The uncertainty in the quasar proximity effect result is large enough that the two methods still yield values for that are actually statistically consistent with each other, but it will be important to reconcile the systematic offset in the mean inferred from these different techniques.
Estimating the global contribution from LBGs to the ionizing background is based on the assumption that we have determined the average shape of LBG spectra between the UV and Lyman-continuum regions. This assumption should be viewed with a degree of skepticism for more than one reason. First, for the two samples of LBGs with flux measurements in the Lyman-continuum region, two different values of have been derived. This fact is not particularly surprising, given that the two samples are characterized by different average rest-frame UV spectroscopic properties, which may in turn be related to the emergent far-UV spectral shape. The Steidel et al. (2001) sample is characterized on average by stronger Ly emission, weaker low-ionization interstellar absorption lines, and less dust extinction. The weaker interstellar absorption and dust extinction may both be correlated with higher escape fraction of Lyman-continuum photons in the Steidel et al. (2001) sample. Furthermore, neither of the two Lyman-continuum samples is completely representative of the total LBG spectroscopic sample. Both the current and Steidel et al. samples have brighter than average UV luminosities – most striking in the current sample, in which all the galaxies are brighter than of the LBG UV luminosity function. While the current sample has an average inferred dust extinction very close to that of the total LBG sample, the average Ly emission and interstellar absorption line strengths are, respectively, weaker and stronger than in the total LBG sample. While the Steidel et al. sample has similar average Ly emission and interstellar absorption properties to the total LBG sample, it is significantly bluer in the UV continuum. Furthermore, most of the galaxies in the current sample reside in a significant overdensity, which represents an atypical large-scale environment and may affect the level of IGM opacity in the Lyman-continuum region. Therefore, we may have only succeeded so far in measuring for different types of LBGs drawn from the bright end of the luminosity function, some of which reside in a special environment, without much constraint on the average ratio for the total LBG sample.
The second reason for skepticism is that, even within our sample, we have demonstrated a significant variation in . C49 and D3, the two galaxies for which we detected flux in the Lyman-continuum region, must have significantly different ratios from at least the average of the remaining galaxies in our sample. The rest-frame UV properties of C49 and D3 do not immediately stand out, however, relative to those of the objects without Lyman-continuum detections. Furthermore, these two galaxies have properties strikingly different from each other! Since we do not yet have a coherent physical explanation – in terms of stellar population age or ISM geometry – for why these two galaxies alone exhibit significant flux in the Lyman-continuum region, we are unable to show that our small sample is representative even of bright LBGs. As the intrinsic ratio depends so sensitively on stellar population age, it is important to obtain near- and mid-IR data, which will allow us to constrain the stellar populations of these galaxies. On the other hand, the variation in among our sample may simply reflect the fact that the escape of Lyman-continuum emission is an anisotropic process, resulting in a complex spatial distribution of Lyman-continuum emission relative to that of the UV-continuum emission determining the positions of our spectroscopic slits.
What is required is a statistical sample of LBGs with deep Lyman-continuum measurements. This sample should be roughly an order of magnitude larger than the current one, span a larger range in luminosity, with multi-wavelength data from which constraints on stellar population ages can be obtained. Furthermore, to enable robust correction for IGM opacity along the line of sight, the future sample must contain objects probing at least several statistically independent cosmic volumes – as opposed to the objects in this work, all of which are contained within comoving Mpc2 on the sky and most within a previously-discovered galaxy overdensity (Steidel et al., 1998). This larger sample should also contain a more significant set of Lyman-continuum detections, whose properties can be characterized on a statistical basis, relative to those of objects without detections. A lack of intrinsic difference between the two populations would support the idea that variation in reflects anisotropic Lyman-continuum emission being sampled with different degrees of efficiency. Only with a survey satisfying the above requirements will we be truly justified in translating the LBG UV luminosity function into a constraint on the global contribution of LBGs to the ionizing background. However, what we have shown here, the first detection of ionizing radiation from individual LBGs at , represents significant progress in the right direction.
We would like to thank our collaborators in the LBG survey for their assistance in various stages of the project, and an anonymous referee, whose comments improved the paper. We wish to extend special thanks to those of Hawaiian ancestry on whose sacred mountain we are privileged to be guests. Without their generous hospitality, most of the observations presented herein would not have been possible. We also thank the staff at the W. M. Keck Observatory for their assistance with the LRIS observations. Finally, we gratefully acknowledge Michael Santos and Jerry Ostriker for extensive and enlightening discussions, and Robert Lupton for statistical insights. CCS and DKE have been supported by grants AST00-70773 and AST03-07263 from the U.S. National Science Foundation and by the David and Lucile Packard Foundation. AES acknowledges support from the Miller Foundation for Basic Research in Science.
References
- Adelberger & Steidel (2000) Adelberger, K. L. & Steidel, C. C. 2000, ApJ, 544, 218
- Adelberger et al. (2005) Adelberger, K. L., Steidel, C. C., Pettini, M., Shapley, A. E., Reddy, N. A., & Erb, D. K. 2005, ApJ, 619, 697
- Adelberger et al. (2003) Adelberger, K. L., Steidel, C. C., Shapley, A. E., & Pettini, M. 2003, ApJ, 584, 45
- Asplund et al. (2004) Asplund, M., Grevesse, N., Sauval, A. J., Allende Prieto, C., & Kiselman, D. 2004, A&A, 417, 751
- Bajtlik et al. (1988) Bajtlik, S., Duncan, R. C., & Ostriker, J. P. 1988, ApJ, 327, 570
- Bergvall et al. (2005) Bergvall, N., Zackrisson, E., Andersson, B.-G., Arnberg, D., Masegosa, J., & Ostlin, G. 2005, A&A, accepted (astro-ph/0601608)
- Bershady et al. (1999) Bershady, M. A., Charlton, J. C., & Geoffroy, J. M. 1999, ApJ, 518, 103
- Bolton et al. (2006) Bolton, J. S., Haehnelt, M. G., Viel, M., & Carswell, R. F. 2006, MNRAS, accepted (astro-ph/0508201)
- Bolton et al. (2005) Bolton, J. S., Haehnelt, M. G., Viel, M., & Springel, V. 2005, MNRAS, 357, 1178
- Bruzual & Charlot (2003) Bruzual, G. & Charlot, S. 2003, MNRAS, 344, 1000
- Calzetti et al. (2000) Calzetti, D., Armus, L., Bohlin, R. C., Kinney, A. L., Koornneef, J., & Storchi-Bergmann, T. 2000, ApJ, 533, 682
- Cen & Ostriker (1993) Cen, R. & Ostriker, J. P. 1993, ApJ, 417, 404
- Cen & Ostriker (2006) Cen, R. & Ostriker, J. P. 2006, ApJ, submitted (astro-ph/0601008)
- Clarke & Oey (2002) Clarke, C. & Oey, M. S. 2002, MNRAS, 337, 1299
- Dawson et al. (2002) Dawson, S., Spinrad, H., Stern, D., Dey, A., van Breugel, W., de Vries, W., & Reuland, M. 2002, ApJ, 570, 92
- Deharveng et al. (2001) Deharveng, J.-M., Buat, V., Le Brun, V., Milliard, B., Kunth, D., Shull, J. M., & Gry, C. 2001, A&A, 375, 805
- Dove & Shull (1994) Dove, J. B. & Shull, J. M. 1994, ApJ, 430, 222
- Dove et al. (2000) Dove, J. B., Shull, J. M., & Ferrara, A. 2000, ApJ, 531, 846
- Fan et al. (2001) Fan, X., Narayanan, V. K., Lupton, R. H., Strauss, M. A., Knapp, G. R., Becker, R. H., White, R. L., Pentericci, L., Leggett, S. K., Haiman, Z., Gunn, J. E., Ivezić, Ž., Schneider, D. P., Anderson, S. F., Brinkmann, J., Bahcall, N. A., Connolly, A. J., Csabai, I., Doi, M., Fukugita, M., Geballe, T., Grebel, E. K., Harbeck, D., Hennessy, G., Lamb, D. Q., Miknaitis, G., Munn, J. A., Nichol, R., Okamura, S., Pier, J. R., Prada, F., Richards, G. T., Szalay, A., & York, D. G. 2001, AJ, 122, 2833
- Fan et al. (2005) Fan, X., Strauss, M. A., Becker, R. H., White, R. L., Gunn, J. E., Knapp, G. R., Richards, G. T., Schneider, D. P., Brinkmann, J., & Fukugita, M. 2005, ApJ, submitted (astro-ph/0512082)
- Fernández-Soto et al. (2003) Fernández-Soto, A., Lanzetta, K. M., & Chen, H.-W. 2003, MNRAS, 342, 1215
- Fujita et al. (2003) Fujita, A., Martin, C. L., Mac Low, M.-M., & Abel, T. 2003, ApJ, 599, 50
- Furlanetto et al. (2004) Furlanetto, S. R., Sokasian, A., & Hernquist, L. 2004, MNRAS, 347, 187
- Giallongo et al. (2002) Giallongo, E., Cristiani, S., D’Odorico, S., & Fontana, A. 2002, ApJ, 568, L9
- Haardt & Madau (1996) Haardt, F. & Madau, P. 1996, ApJ, 461, 20
- Hunt et al. (2004) Hunt, M. P., Steidel, C. C., Adelberger, K. L., & Shapley, A. E. 2004, ApJ, 605, 625
- Hurwitz et al. (1997) Hurwitz, M., Jelinsky, P., & Dixon, W. V. D. 1997, ApJ, 481, L31+
- Inoue et al. (2005) Inoue, A. K., Iwata, I., Deharveng, J.-M., Buat, V., & Burgarella, D. 2005, A&A, 435, 471
- Leitherer et al. (1995) Leitherer, C., Robert, C., & Heckman, T. M. 1995, ApJS, 99, 173
- Leitherer et al. (1999) Leitherer, C., Schaerer, D., Goldader, J. D., Delgado, R. M. G., Robert, C., Kune, D. F., de Mello, D. F., Devost, D., & Heckman, T. M. 1999, ApJS, 123, 3
- Loeb & Barkana (2001) Loeb, A. & Barkana, R. 2001, ARA&A, 39, 19
- Madau (1995) Madau, P. 1995, ApJ, 441, 18
- Madau et al. (1999) Madau, P., Haardt, F., & Rees, M. J. 1999, ApJ, 514, 648
- Matsuda et al. (2004) Matsuda, Y., Yamada, T., Hayashino, T., Tamura, H., Yamauchi, R., Ajiki, M., Fujita, S. S., Murayama, T., Nagao, T., Ohta, K., Okamura, S., Ouchi, M., Shimasaku, K., Shioya, Y., & Taniguchi, Y. 2004, AJ, 128, 569
- McDonald & Miralda-Escudé (2001) McDonald, P. & Miralda-Escudé, J. 2001, ApJ, 549, L11
- Meurer et al. (1999) Meurer, G. R., Heckman, T. M., & Calzetti, D. 1999, ApJ, 521, 64
- Oke et al. (1995) Oke, J. B., Cohen, J. G., Carr, M., Cromer, J., Dingizian, A., Harris, F. H., Labrecque, S., Lucinio, R., Schaal, W., Epps, H., & Miller, J. 1995, PASP, 107, 375
- Pagel et al. (1979) Pagel, B. E. J., Edmunds, M. G., Blackwell, D. E., Chun, M. S., & Smith, G. 1979, MNRAS, 189, 95
- Pettini et al. (2001) Pettini, M., Shapley, A. E., Steidel, C. C., Cuby, J., Dickinson, M., Moorwood, A. F. M., Adelberger, K. L., & Giavalisco, M. 2001, ApJ, 554, 981
- Reddy et al. (2006) Reddy, N. A., Steidel, C. C., Fadda, D., Yan, L., Pettini, M., Shapley, A. E., Erb, D. K., & Adelberger, K. L. 2006, ApJ, accepted (astro-ph/0602596)
- Scott et al. (2000) Scott, J., Bechtold, J., Dobrzycki, A., & Kulkarni, V. P. 2000, ApJS, 130, 67
- Shapley et al. (2001) Shapley, A. E., Steidel, C. C., Adelberger, K. L., Dickinson, M., Giavalisco, M., & Pettini, M. 2001, ApJ, 562, 95
- Shapley et al. (2003) Shapley, A. E., Steidel, C. C., Pettini, M., & Adelberger, K. L. 2003, ApJ, 588, 65
- Shull et al. (2004) Shull, J. M., Tumlinson, J., Giroux, M. L., Kriss, G. A., & Reimers, D. 2004, ApJ, 600, 570
- Spergel et al. (2003) Spergel, D. N., Verde, L., Peiris, H. V., Komatsu, E., Nolta, M. R., Bennett, C. L., Halpern, M., Hinshaw, G., Jarosik, N., Kogut, A., Limon, M., Meyer, S. S., Page, L., Tucker, G. S., Weiland, J. L., Wollack, E., & Wright, E. L. 2003, ApJS, 148, 175
- Steidel (1990) Steidel, C. C. 1990, ApJS, 74, 37
- Steidel et al. (1998) Steidel, C. C., Adelberger, K. L., Dickinson, M., Giavalisco, M., Pettini, M., & Kellogg, M. 1998, ApJ, 492, 428
- Steidel et al. (1999) Steidel, C. C., Adelberger, K. L., Giavalisco, M., Dickinson, M., & Pettini, M. 1999, ApJ, 519, 1
- Steidel et al. (2000) Steidel, C. C., Adelberger, K. L., Shapley, A. E., Pettini, M., Dickinson, M., & Giavalisco, M. 2000, ApJ, 532, 170
- Steidel et al. (2003) —. 2003, ApJ, 592, 728
- Steidel et al. (2001) Steidel, C. C., Pettini, M., & Adelberger, K. L. 2001, ApJ, 546, 665
- Steidel et al. (2004) Steidel, C. C., Shapley, A. E., Pettini, M., Adelberger, K. L., Erb, D. K., Reddy, N. A., & Hunt, M. P. 2004, ApJ, 604, 534
| LRIS-B | LRIS-R | ||||||||
|---|---|---|---|---|---|---|---|---|---|
| Object | R.A. (J2000) | Dec. (J2000) | aaAB magnitude system; effective wavelengths are 4730, and 6830 Å for and , respectively (see also Steidel et al., 2003). | aaAB magnitude system; effective wavelengths are 4730, and 6830 Å for and , respectively (see also Steidel et al., 2003). | aaAB magnitude system; effective wavelengths are 4730, and 6830 Å for and , respectively (see also Steidel et al., 2003). | bbSpectroscopic redshift measured from the observed wavelength of Ly emission. Three objects, D17, C49, and C32, exhibit double-peaked Ly profiles. For these objects, we list the emission redshifts corresponding to both Ly peaks. | Exposure (s)dd LRIS-B exposure times are listed for Å (left) and Å Å (right). | Exposure (s) | |
| D17 | 22:17:18.88 | 00:18:16.89 | 24.27 | 0.45 | 3.0851,3.0945 | 3.0697 | 29200/69040 | 61000 | |
| C24 | 22:17:18.94 | 00:14:45.65 | 23.86 | 0.78 | 3.1026 | 3.0960 | 29200/79240 | 61000 | |
| C49 | 22:17:19.81 | 00:18:18.64 | 23.85 | 0.59 | 3.1601,3.1656 | 3.1492 | 29200/58040 | 61000 | |
| C35 | 22:17:20.23 | 00:16:52.33 | 24.18 | 0.95 | 3.0980 | 29200/79240 | 61000 | ||
| C47 | 22:17:20.23 | 00:17:32.45 | 23.84 | 0.60 | 3.0748 | 3.0651 | 29200/79240 | 61000 | |
| C41 | 22:17:24.45 | 00:17:14.75 | 23.80 | 0.18 | 3.0236 | 3.0166 | 29200/79240 | 61000 | |
| C32 | 22:17:25.62 | 00:16:13.10 | 23.68 | 0.67 | 3.2895,3.2991 | 3.2921 | 29200/79240 | 61000 | |
| C11 | 22:17:25.68 | 00:12:35.30 | 24.20 | 0.47 | 3.1014 | 3.0962 | 29200/79240 | 61000 | |
| MD23 | 22:17:28.01 | 00:14:29.73 | 24.14 | 0.46 | 3.0845 | 3.0753 | 29200/79240 | 61000 | |
| D7 | 22:17:28.79 | 00:12:47.07 | 23.50 | 0.62 | 2.7564 | 29200/47840 | 61000 | ||
| C16 | 22:17:31.96 | 00:13:16.11 | 23.64 | 0.98 | 3.0651 | 29200/79240 | 61000 | ||
| D3-ap1 | 22:17:32.42 | 00:11:32.97 | 23.37 | 0.97 | 3.0716 | 3.0649 | 29200/47840 | 29200 | |
| D3-ap2 | 22:17:32.42 | 00:11:32.97 | 23.37 | 0.97 | 3.0767 | 3.0677 | 29200/47840 | 29200 | |
| MD14 | 22:17:37.93 | 00:13:44.21 | 24.14 | 0.86 | 3.0969 | 29200/29200 | 29200 | ||
| C22 | 22:17:38.18 | 00:14:32.06 | 24.46 | 0.54 | 2.8765 | 29200/58040 | 61000 |
| This Work | Total LBG Sample | Steidel et al. (2001) Sample | |
|---|---|---|---|
| 14 | 811 | 29 | |
| aaAB absolute magnitude, derived from the apparent magnitude. At , the -band effective wavelength corresponds to Å. | |||
| bbThe larger of the Steidel et al. (2001) sample reflects the increased average IGM opacity at relative to and . In fact, this sample appears to have bluer intrinsic colors on average than the two other samples. | |||
| ccDust extinction, parametrized by , is derived from the observed color corrected for the effects of intergalactic absorption and intrinsic Ly emission/absorption. The corrected color is modeled, and inferred, using an unreddened Bruzual & Charlot (2003) 300 Myr continuous star-formation model template spectrum and a Calzetti et al. (2000) attenuation curve (see Steidel et al., 1999; Adelberger & Steidel, 2000; Shapley et al., 2001). | |||
| dd Rest-frame Ly and low-ionization interstellar absorption equivalent widths have been measured from the average composite spectrum for each sample. Positive numbers refer to emission and negative numbers to absorption. In the case of Ly, the reported equivalent width represents the total profile, including both emission and absorption components. For both the Total LBG and Steidel et al. (2001) samples, the total and emission profiles have very similar equivalent widths. In the case of the current sample, the total equivalent width is close to Å while the emission equivalent width is Å rest. The reported low-ionization interstellar absorption equivalent width for each sample represents the average of the four strongest features: Si II , O I + Si II , C II , and Si II . | 1.7 Å | 15.2 Å | 14.1 Å |
| dd Rest-frame Ly and low-ionization interstellar absorption equivalent widths have been measured from the average composite spectrum for each sample. Positive numbers refer to emission and negative numbers to absorption. In the case of Ly, the reported equivalent width represents the total profile, including both emission and absorption components. For both the Total LBG and Steidel et al. (2001) samples, the total and emission profiles have very similar equivalent widths. In the case of the current sample, the total equivalent width is close to Å while the emission equivalent width is Å rest. The reported low-ionization interstellar absorption equivalent width for each sample represents the average of the four strongest features: Si II , O I + Si II , C II , and Si II . | Å | Å | Å |