A nebular origin for the persistent radio emission of fast radio bursts
Abstract
Fast Radio Bursts (FRBs) are millisecond-duration, bright (Jy) extragalactic bursts, whose production mechanism is still unclear [1]. Recently, a persistent radio source (PRS) of non-thermal origin was discovered to be physically associated to two of the repeating FRB sources [2, 3]. These two sources have unusually large Rotation Measure (RM) values [2, 3], likely tracing a dense magneto-ionic medium, consistent with a synchrotron radiation originating from a nebula surrounding the FRB source [4, 5, 6, 7]. Recent theoretical arguments predict that, if the observed RM mostly arises from the PRS region, there should be a simple relation between the luminosity of the PRS and the RM [8, 6]. We report here the detection of a third, less luminous PRS associated with the nearby FRB 20201124A at a distance of 413 Mpc, significantly expanding the predicted relation into the low luminosity – low RM regime (1000 rad/m2). At lower values of the RM, the radio luminosity falls below the limit of detection threshold for nowadays radio telescopes. These findings support the idea that the PRS is generated by a nebula in the FRB environment, and that most FRBs do not show a PRS because of a weaker magneto-ionic medium. This is generally consistent with models foreseeing a young magnetar as the central engine of the FRB, where the surrounding ionized nebula powers the PRS.
IAPS – Institute for Space Astrophysics and Planetology, INAF, via del Fosso del Cavaliere, 100, Rome, 00133, Italy.
South-Western Institute for Astronomy Research, Yunnan University, University City, Chenggong District, Kunming, 650504, Yunnan, China.
Purple Mountain Observatory, Chinese Academy of Sciences, 10 Yuanhua Road, Qixia District, Nanjing, 210023, Jiangsu, China.
Dipartimento di Fisica e Astronomia ‘Augusto Righi’, Università degli Studi di Bologna, UNIBO, via Piero Gobetti 93/3, Bologna, 40129, Italy.
Osservatorio di Astrofisica e Scienza dello Spazio di Bologna, INAF, via Piero Gobetti 93/2, Bologna, 40129, Italy.
Nevada Center for Astrophysics, University of Nevada, NV 89154-4002, Las Vegas, Nevada USA.
Department of Physics and Astronomy, University of Nevada, NV 89154-4002, Las Vegas, Nevada USA.
Osservatorio Astronomico di Trieste, INAF, via G.B. Tiepolo 11, Trieste, 34143, Italy.
IFPU–Institute for Fundamental Physics of the Universe, via Beirut 2, Trieste, 34151, Italy.
Dipartimento di Fisica, Università di Trieste, via G.B. Tiepolo 11, Trieste, 34143, Italy.
McWilliams Center for Cosmology, Department of Physics, Carnegie Mellon University, 4000 Forbes Avenue, Pittsburgh, PA 15213, USA.
Instituto de Astrofísica de Andalucía, CSIC, Glorieta de la Astronomía s/n, Granada, 18008, Spain.
Dipartimeto di Fisica, Universit‘a della Calabria, Arcavacata di Rende, 87036, Italy.
Thüringer Landessternwarte Tautenburg, Sternwarte 5, Tautenburg, 35 07778, Germany.
IRA – Istituto di Radioastronomia, INAF, via Piero Gobetti, 101, Bologna, 40129, Italy.
FRB 20201124A is a repeating fast radio burst which underwent a reactivation during March 2021 [9, 10], allowing to locate it with an uncertainty of a few milli-arcseconds through Very Long Baseline Interferometry (VLBI) observations [11]. Its precise localization and close distance (redshift=0.098) make it an ideal target to study the physical conditions in its surroundings. Following the discovery of extended radio emission associated with star formation in the FRB 20201124A environment [12], we targeted the FRB region with deep Very Large Array (VLA) observations at sub-arcsec angular resolution, at 15 and 22 GHz. Disentangling a possible compact source from the previously detected, diffuse (3-4 kpc) emission is indeed crucial to assess the presence of a PRS associated with the FRB.
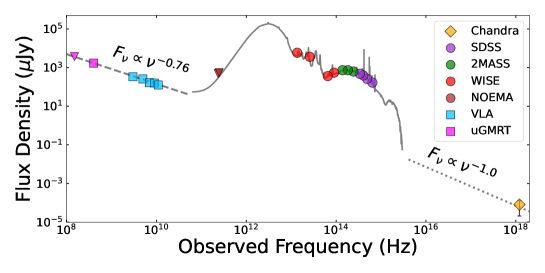
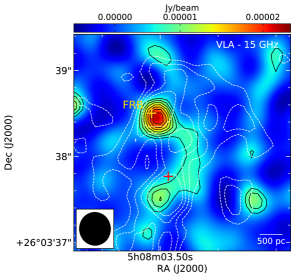
Observations at 15 GHz highlight a compact, unresolved emitting region, with a position consistent with the FRB location (see Methods). Its flux density at 15 GHz outshines the diffuse component from the host galaxy at the same frequency (see Fig. 1, top panel). This bright, compact PRS falls in the South-West region of the extended emission previously discovered at higher frequencies [12]. At 22 GHz, a compact component is still detected, although at a lower significance level of 4-, at a position consistent with the FRB location and the peak of the 15 GHz component (see Fig. 1 in Extended data). The estimated projected physical size at 15 GHz is pc, but a much smaller size cannot be excluded. As also noted in [13], the flux densities measured up to 22 GHz imply that this compact source could not be detected in previous VLBI observations because too faint for the image noise level reached in those works – 10 Jy/beam [14, 12], at the limit of capabilities for nowadays VLBI arrays.
In order to derive the spectral shape of the source, we have reanalyzed the 6 GHz VLA archival data from [13], that have a resolution similar to our observations. We could disentangle the compact PRS from the diffuse star-formation emission, and estimate its flux density, that is consistent with the one predicted by those authors on the basis of general image-quality considerations. Considering the flux densities collected from multi-frequency (6, 15, 22 GHz) VLA data, the PRS shows an inverted radio spectrum .
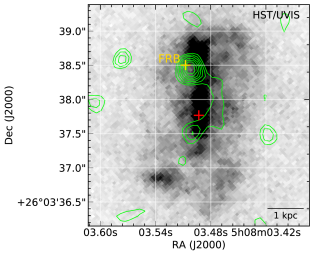
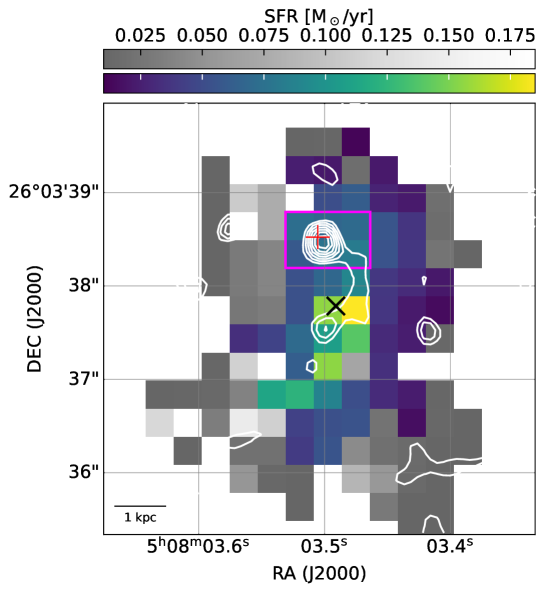
It is difficult to associate such radio emission to a star-forming region. First, the inverted spectrum is unlike the spectral shape observed in radio from star formation, usually steep or at most flat (see Methods). Furthermore, any star formation capable to account for the radio luminosity would leave imprints at other wavelengths, that are not detected. Our integral field unit observations with GTC/MEGARA (see Methods) confirms that the FRB falls at the Northern edge of the host galaxy’s bar, as seen in previous HST images [13]. The star formation rate (SFR) map, as estimated from the H emission line (see Fig. 2, left panel), reveals that highest SFR regions are towards the galaxy’s center, and match the UV emission as seen by HST (see Fig. 1, right panel). Conversely, close to the FRB position a SFR of is measured. Additionally, we performed mm-band observations with NOEMA centered on the FRB coordinates to independently estimate the SFR through dust grey-body emission. These resulted in two non-detections at 236.5 and 250 GHz, corresponding to upper limits of 130 Jy/beam and 160 Jy/beam, respectively. The angular resolution of NOEMA images allowed to probe a physical scale of about 1.30.7 kpc, comparable with the one probed by the VLA. We modelled the cold dust spectral energy distribution (SED) with a Modified Black Body (MBB) function in order to derive upper limits for the dust mass and SFR (see details in Methods), finding a dust mass of and a star formation rate of SFR/yr at the location of the 15 GHz PRS. Similarly, from our radio images we could estimate that, in order to account for the observed radio flux density, a /yr would be needed (see Methods). This number is not consistent with either the upper limit from obscured star formation derived from NOEMA observations (SFR/yr), or the H-derived measurement of SFR at the location of the compact source as estimated from GTC/MEGARA spectroscopy (/yr), suggesting a different origin.
Large values found for some FRBs imply a dense and magnetized environment in the vicinity of the sources [8, 6]. If relativistic electrons constitute a significant fraction of the medium, the magnetized environment near the FRB source could produce synchrotron radiation, powering a bright PRS [15, 16, 8]. There should be a simple relation between the luminosity of the PRS and the rotation measure, tracing the magneto-ionic medium in the FRB environment [8, 6]. We consider that the electron distribution in the PRS emission region has a thermal component and a non-thermal component, and the RM is mainly contributed by the thermal component. As discussed in the Methods section, the foreseen relation is:
| (1) |
where is the number fraction between the non-thermal electrons radiating synchrotron emission in the observed band and thermal electrons, the typical Lorentz factor of thermal electrons, and is the radius of the plasma screen that contributes to the PRS and the RM.
In Figure 3 we plot the relation between the specific luminosity (or upper limit) of the PRS against the RM of known FRBs. The red dotted, dashed, and solid lines correspond to the predicted relation for , respectively (see Methods). The observed specific PRS luminosities of FRB 20121102A, FRB 20190520B, and FRB 20201124A are close to the predicted value for . In particular, the detection of the PRS associated to FRB 20201124A allows for the first time to test the predicted relation at lower radio luminosity, at the limits of nowadays radio telescopes detection threshold, thus significantly broadening the probed parameters space. The upper limit of FRB 20180916B is also close to the predicted relation. As a caveat, we should notice that for the FRB with , the RM from the Galactic component or the host component would dominate. This places FRB 20201124A, with a , at the limits of the explorable range.
These findings pose in favour of a nebular origin for the three detected PRS associated with FRB so far. The possible nature of the FRB engine itself remains unclear, however, the discussed nebula model is generally consistent with the proposed scenarios involving a magnetar or a hyperaccreting X-ray binary as the central engine, which already foresee an ionized nebula around it [17, 7]. Thanks to the increasing census of FRB, and in particular repeater ones, deep radio observations of a larger sample of these objects could put further constraints on the nebula model, and on the physical conditions in the surroundings of FRBs in general.
Methods
0.1 VLA detection of the compact PRS
We detected a compact component both at 15 and 22 GHz. Figure 1 shows the overplot of the image at 6-GHz that we have derived reanalyzing archival data from [13] with contours from our 15 and 22 GHz images at similar resolution. The emission comes from regions consistent with the EVN position at all frequencies. Indeed, a Gaussian fit results in a compact component at 15 and 22 GHz, with an integrated flux density of Jy and Jy, respectively. The peak position of the fitted Gaussian component is RA 05:08:03.50270 s, Dec +26:03:38.444 arcsec at 15 GHz, while 05:08:03.4944 s, Dec +26:03:38.423 arcsec at 22 GHz. Considering a standard astrometric accuracy of % of the FWHM, and summing that in quadrature with the Gaussian fit error, we get a final uncertainty of arcsec arcsec at 15 GHz, and 008 009 at 22 GHz. The mentioned positional uncertainties imply that the detected compact component is consistent within 3- with the FRB location by [11]. The measured flux density at 22 GHz accounts for % of the value reported at the same frequency, but at lower resolution, in [12], indicating that the previously detected diffuse emission falls below the detection threshold per angular resolution element of the new image.
The image at 6 GHz, and the 15 and 22 GHz ones presented here (see fig. 1) have a consistent angular resolution and RMS level, and can then be used to estimate the spectral index of the compact PRS. At 6 GHz, [13] discuss how a possible PRS would be embedded in a diffuse emission region due to star formation. Those authors thus provide a conservative upper limit of 10 Jy. We re-imaged the 6 GHz data from [13] (program 22A-213, PI: Fong), and performed an additional analysis to refine the flux density and compactness estimate of the possible PRS. To account for the diffuse emission, we estimated the mean flux density in the regions contiguous with the FRB location, and outside a 1 beam area centered on the component peak at 6 GHz. In this way, we obtained an estimate of 8 Jy/beam for the emission plateau due to star formation, consistent with the one discussed by [13]. We then used this value as an input for the offset parameter of the IMFIT task, that allows to account for a zero-level offset when performing a Gaussian fit on the image. This procedure revealed a compact component at 6 GHz with an integrated flux density of 8.23.8 Jy, and centered at RA 05:08:03.5007 s, Dec +26:03:38.5440 arcsec. As previously discussed, considering an astrometric accuracy of % of the FWHM we estimate a final uncertainty of arcsec arcsec, making again the peak position consistent with the FRB location within 3-. We note that, despite the uncertainty on the component flux density is 45% of the value, it is still at a 4- detection level with respect to the image RMS (2 Jy/beam), and also consistent with the upper limit of 10 Jy discussed by [13].
Considering the estimated flux densities at 6, 15, and 22 GHz, we obtain the following spectral indices ( for the PRS: , , and an overall value , indicating an inverted spectrum.
0.2 SFR estimates from NOEMA observations
In order to derive upper limits for the dust mass and SFR in this objects based on the NOEMA fluxes, we modelled the SED of the dust emission with a modified black-body (MBB) function given by
| (2) |
where is the solid angle with , and is the surface area and luminosity distance of the galaxy, respectively. The dust optical depth is
| (3) |
with the emissivity index and the mass absorption coefficient [18]. The solid angle is estimated using the size of the NOEMA beam, that is similar for both observations, arcsec2. The effect of the CMB on the dust temperature is given by
| (4) |
with K. We also considered the contribution of the CMB emission given by [19], even if at this redshift is almost negligible.
Therefore, this model has three free parameters: , , and . Since we were able to determine only upper limits in the two NOEMA bands, we evaluated possible combination of and that can reproduce the limits at 236 GHz and 250 GHz, leaving as a free parameter. Fig. 3 presents 4 models built from a reasonable combinations of dust temperature and emissivity: K and , that are typical values found in local star-forming galaxies. We explored the one dimensional parameter space using a Markov chain Monte Carlo (MCMC) algorithm implemented in the EMCEE package [20], and we assumed a uniform prior for the dust mass, . We obtained with , from a MCMC with 25 chains, 1500 trials and a burn-in phase of for each model.
The SFR is estimated from the total infrared luminosity (TIR) as , assuming Chabrier IMF [21]. To compute the TIR luminosity we integrated the MBB from to m rest-frame, and therefore we obtained SFR/ = 0.13, 0.34, 0.69, and 2.24 for . Overall we obtained that and SFR.
In order to constrain the emission from the host galaxy (see also [13]), we re-computed the upper limits at 236 GHz and 250 GHz considering the region with significance in the 6 GHz VLA map, which corresponds to a physical region of kpc2. The upper limits are then mJy and mJy at 236 GHz and 250 GHz, respectively. Fig. 4 shows the best-fitting curves to the new upper limits for . We obtained , implying .
0.3 SFR estimates from GTC/MEGARA observations
Since the emission lines observed in the FRB region and the entire galaxy spectra are produced by UV radiation from stellar photospheres (see Supplementary information), we can thus estimate SFRs directly from the H intrinsic luminosity. First, we corrected H for intrinsic dust attenuation based on the Balmer decrement (i.e., the H/H ratio). We show in Figure 5 the map of colour excess E(B - V) of the galaxy obtained from the Balmer decrement. To perform a proper correction for dust extinction, in pixels with S/N(H) , the colour excess E(B - V) is derived adopting the [22] attenuation law and assuming the Case B recombination and a Balmer decrement H/H (typical of H II regions with electron temperatures Te = K and electron density ne between - cm-3 [23]. We assigned E(B - V) to pixels with negative E(B - V) values between about and (i.e. pixels showing H/H). Moreover, we also assigned an E(B-V) lower limit to pixels with S/N(H), using the upper limit in H we defined earlier in this section. The dust-corrected fluxes are converted to luminosity. Then, we derived the SFR using the dust-corrected H luminosity and adopted the [24] conversion factor converted to the [21] IMF. We have already shown and discussed the resulting SFR map of the galaxy in Figure 2. To summarize, we report that in the stacked spectrum of the FRB region, we measured an SFR of M/yr, while the entire galaxy has an SFR of M/yr.
0.4 Expected radio emission from a star forming region
Radio emission from SFR involves typically two components: a steep component () produced by synchrotron emission from electrons accelerated in SN explosion, with a lifetime of the order of 100 Myr [25], that dominates the emission at low frequencies (below 6 GHz); a thermal, flat component by bremmstrahlung, that is a direct measure of the current production of ionized photons by young and hot stars with lifetime Myr [26, 27, 28]. On the other hand, the inverted spectrum observed in the compact radio source is not consistent with either SF-driven radio components. Furthermore, the level of SFR required to account for the observed radio emission would violate the limits derived from mm and Hα measurements. The SFR needed to produce the radio thermal component is [29]:
| (5) |
The observed erg sHz-1 would then imply yr-1 to account for the radio emission. This number is not consistent with either the upper limit from obscured star formation derived from NOEMA and from the H measurement of SFR at the location of the compact source, suggesting another origin.
0.5 Nebular emission model
We consider that the electron distribution has a thermal component in the low-energy regime, i.e., for and for , where is the total number density of thermal electrons and is the thermal Lorentz factor, and a non-thermal component in the high-energy regime, i.e., for and for , where is the total number density of non-thermal electrons and is the minimum Lorentz factor of the non-thermal component. We assume that the RM is mainly contributed by the thermal component,
| (6) |
where is the mean parallel component of the magnetic field along the line of sight, is the thickness of the plasma screen. For the non-thermal component, the Lorentz factor of the electrons emitting synchrotron radiation in the observation frequency is required to be
| (7) |
Define as the fraction between the electrons radiating synchrotron emission in the observed band and thermal electrons, it is approximately given by
| (8) |
for . Assuming that the magnetic field is large-scale (leading to the parallel mean magnetic field of the order of the total magnetic field) the specific luminosity of synchrotron radiation could be written as [8, 6]
| (9) |
where is the radius of the plasma screen that contributes to the PRS and the RM.
In Table 2, we list 14 FRBs with the measured RM and the measured values (or upper limits) of the flux densities of the PRSs, and only FRB 20121102A, FRB 20190520B, and FRB 20201124A have the measured values of both. Some sources have precise localizations, so the redshifts in the top row of Table 2 are the directly measured values. For other FRBs, due to the lack of a precise localization, we estimate their redshifts and luminosity distances via the extragalactic DM as performed by [8]. Notice that for redshift inferred from the exceeded DM, the corresponding redshift error is attributed to the IGM density fluctuation [30, 8].
Based on the data in Table 2, we plot the relation between the specific luminosity of the PRS and the RM of FRBs in Figure 3. The red dotted, dashed, and solid lines correspond to the predicted relation for , respectively. It is interesting that the observed specific luminosities of FRB 20121102A, FRB 20190520B, and FRB 20201124A are close to the predicted value for . The upper limit of FRB 20180916B is close to the predicted relation. However, we should notice that for the FRB with , the RM from the Galactic component or the host component would dominate.
0.6 Considerations on the observed radio spectrum
As pointed out above, the PRS spectrum of FRB 20201124A satisfies , which is much harder than those of FRB 20121102A and FRB 20190520B. If the observed spectrum of the PRS is produced by the synchrotron radiation, a spectral index larger than would imply that the synchrotron absorption might be dominant at the observed bands . Such a high absorption frequency would lead to FRBs absorbed by the PRS, which is inconsistent with the observation of FRB 20201124A. On the other hand, we notice that the spectral index of the PRS is also consistent with within . In this case, to explain the spectral shape of the PRS, the typical frequency that corresponds to the minimum Lorentz factor of the accelerated non-thermal electrons is required to be
| (10) |
where is the magnetic field strength at the emission region. Therefore, we obtain the following constraints:
| (11) |
which is consistent with a magnetized shocked nebula.
0.7 Considerations on a possible background source
In the GTC/MEGARA spectrum, we found a detection of a possible [OII] emission line in correspondence of the FRB location, but at a redshift . We thus tested the scenario of a background source potentially responsible for the compact radio component, that we instead interpreted as a PRS linked to the FRB.
Deep radio surveys show that the radio sky at a flux level of Jy exhibit about arcsec-2 sources [31]. The vast majority have a steep spectrum, unlike the one displayed by the source we observe here. Taking into account that only a fraction of has a flat spectrum we derive that the probability of one of them falling within the beam size at the position of the FRB is . This already results in a very low chance that the radio emission is due to a serendipitous background source. However, in the following we discuss the different classes of sources that could produce the compact radio component studied in this work, and why we can confidently rule them out.
Possible extragalactic sources producing radio emission are blazars, radio galaxies, radio quiet AGN, or a star forming galaxy. At the mentioned redshift, the radio luminosity as estimated from our VLA measurement is Log()39 erg/s, thus indicating a radio-quiet regime. This already rules out a possible background blazar or radio galaxy, although it is still consistent with the one estimated for the faintest (radio quiet) Seyfert galaxies observed to date in the radio band ( erg/s [32]). A radio quiet AGN could show a radio component due to a low-power jet, a nuclear wind, or coronal emission [33]. In the first case, while the physical scale subtended at by the compact radio component ( kpc) would be enough to accommodate the presence of a jet, the expected radio spectrum of its extended regions would be steep (). The inverted radio spectrum we found would thus require a collimated jet with an orientation within a few degrees from the line of sight. This would in turn result in a dominant, Doppler-boosted jet emission visible up to the optical band. This feature has been commonly observed for powerful jets at different scales, from radio-loud AGN to X-ray binaries, but not yet in radio-quiet AGN where the flat/inverted radio spectrum is attributed to a coronal emission mechanism ([34, 35], see also discussion below). Moreover, the NOEMA non-detection in the mm-band put a strong constraint on that: a simple power-law extrapolation of the radio spectrum up to 250 GHz results in an expected flux density 300 Jy, well above the NOEMA upper limit (160 Jy). In the second case (nuclear wind), a steep radio spectrum is expected, thus not consistent with the inverted one seen in our VLA measurements. In the third case (AGN coronal emission), a ratio between radio and X-ray luminosity is expected [36], while previous Chandra X-ray measurements in a circular region with a 1” radius centered on the FRB location [12] constrain this ratio to . The X-ray luminosity is thus much lower than the one expected from a corona able to produce the radio emission measured with the VLA. Finally, a possible radio emission from a background star-forming galaxy is excluded by the expected relation between [OII] and radio emission in SFR [24], foreseeing a radio luminosity 10 times lower than the one measured here.
0.8 Acknowledgments
B.O. gratefully acknowledges support from the McWilliams Postdoctoral Fellowship at Carnegie Mellon University. Y.P.Y. is supported by the National Natural Science Foundation of China grant No. 12003028 and the National SKA Program of China (2022SKA0130100). The National Radio Astronomy Observatory is a facility of the National Science Foundation operated under cooperative agreement by Associated Universities, Inc. This work is partly based on observations carried out under project number W22BS with the IRAM NOEMA Interferometer. IRAM is supported by INSU/CNRS (France), MPG (Germany) and IGN (Spain). Partly based on observations made with the Gran Telescopio Canarias (GTC), installed at the Spanish Observatorio del Roque de los Muchachos of the Instituto de Astrofísica de Canarias, on the island of La Palma. This work is partly based on data obtained with MEGARA/MIRADAS instrument, funded by European Regional Development Funds (ERDF), through Programa Operativo Canarias FEDER 2014–2020. We wish to thank Armando Gil de Paz (Facultad Ciencias Físicas, Universidad Complutense de Madrid) for his valuable support to the MEGARA data analysis. This research made use of APLpy, an open-source plotting package for Python hosted at http://aplpy.github.com. This research made use of Astropy, a community-developed core Python package for Astronomy [37].
0.9 Authors contribution
G.B. led the VLA and NOEMA observational campaigns, conducted the VLA data calibration, analysis and interpretation, and led the paper writing. L.P., Y.P.Y., B.Z., S.S. worked on the interpretation of the results. E.P., L.N., S.Q, A.M.N.G., A.R. conducted the GTC/MEGARA observations, data analysis, and interpretation. C.F., R.T. worked on the NOEMA data calibration and analysis. B.O. realized the host galaxy broad-band SED fitting. A.G. led the GTC/MEGARA proposal. R.P. contributed to the NOEMA proposal preparation. All authors contributed to the discussion of the results presented and commented on the manuscript.
0.10 References
References
- [1] Zhang, B. The physics of fast radio bursts. Reviews of Modern Physics 95, 035005 (2023). 2212.03972.
- [2] Michilli, D. et al. An extreme magneto-ionic environment associated with the fast radio burst source FRB 121102. Nature 553, 182–185 (2018). 1801.03965.
- [3] Niu, C. H. et al. A repeating fast radio burst associated with a persistent radio source. Nature 606, 873–877 (2022). 2110.07418.
- [4] Metzger, B. D., Margalit, B. & Sironi, L. Fast radio bursts as synchrotron maser emission from decelerating relativistic blast waves. MNRAS 485, 4091–4106 (2019). 1902.01866.
- [5] Yang, G. et al. X-CIGALE: Fitting AGN/galaxy SEDs from X-ray to infrared. MNRAS 491, 740–757 (2020). 2001.08263.
- [6] Yang, Y.-P., Lu, W., Feng, Y., Zhang, B. & Li, D. Temporal Scattering, Depolarization, and Persistent Radio Emission from Magnetized Inhomogeneous Environments near Repeating Fast Radio Burst Sources. ApJ 928, L16 (2022). 2202.09602.
- [7] Sridhar, N. & Metzger, B. D. Radio Nebulae from Hyperaccreting X-Ray Binaries as Common-envelope Precursors and Persistent Counterparts of Fast Radio Bursts. ApJ 937, 5 (2022). 2206.10486.
- [8] Yang, Y.-P., Li, Q.-C. & Zhang, B. Are Persistent Emission Luminosity and Rotation Measure of Fast Radio Bursts Related? ApJ 895, 7 (2020). 2001.10761.
- [9] Chime/Frb Collabortion. Recent high activity from a repeating Fast Radio Burst discovered by CHIME/FRB. The Astronomer’s Telegram 14497, 1 (2021).
- [10] Lanman, A. E. et al. A sudden period of high activity from repeating fast radio burst 20201124a. The Astrophysical Journal 927, 59 (2022). URL https://dx.doi.org/10.3847/1538-4357/ac4bc7.
- [11] Nimmo, K. et al. Milliarcsecond Localization of the Repeating FRB 20201124A. ApJ 927, L3 (2022). 2111.01600.
- [12] Piro, L. et al. The fast radio burst FRB 20201124A in a star-forming region: Constraints to the progenitor and multiwavelength counterparts. A&A 656, L15 (2021). 2107.14339.
- [13] Dong, Y. et al. Mapping Obscured Star Formation in the Host Galaxy of FRB 20201124A. arXiv e-prints arXiv:2307.06995 (2023). 2307.06995.
- [14] Marcote, B. et al. VLBI localization of FRB 20201124A and absence of persistent emission on milliarcsecond scales. The Astronomer’s Telegram 14603, 1 (2021).
- [15] Murase, K., Kashiyama, K. & Mészáros, P. A burst in a wind bubble and the impact on baryonic ejecta: high-energy gamma-ray flashes and afterglows from fast radio bursts and pulsar-driven supernova remnants. MNRAS 461, 1498–1511 (2016). 1603.08875.
- [16] Metzger, B. D., Berger, E. & Margalit, B. Millisecond Magnetar Birth Connects FRB 121102 to Superluminous Supernovae and Long-duration Gamma-Ray Bursts. ApJ 841, 14 (2017). 1701.02370.
- [17] Margalit, B. et al. Unveiling the engines of fast radio bursts, superluminous supernovae, and gamma-ray bursts. MNRAS 481, 2407–2426 (2018). 1806.05690.
- [18] Beelen, A. et al. 350 m Dust Emission from High-Redshift Quasars. ApJ 642, 694–701 (2006). astro-ph/0603121.
- [19] da Cunha, E. et al. On the Effect of the Cosmic Microwave Background in High-redshift (Sub-)millimeter Observations. ApJ 766, 13 (2013). 1302.0844.
- [20] Foreman-Mackey, D., Hogg, D. W., Lang, D. & Goodman, J. emcee: The MCMC Hammer. PASP 125, 306 (2013). 1202.3665.
- [21] Chabrier, G. Galactic Stellar and Substellar Initial Mass Function. PASP 115, 763–795 (2003). astro-ph/0304382.
- [22] Calzetti, D. et al. The Dust Content and Opacity of Actively Star-forming Galaxies. ApJ 533, 682–695 (2000). astro-ph/9911459.
- [23] Osterbrock, D. E. & Ferland, G. J. Astrophysics of gaseous nebulae and active galactic nuclei (2006).
- [24] Kennicutt, J., Robert C. Star Formation in Galaxies Along the Hubble Sequence. ARA&A 36, 189–232 (1998). astro-ph/9807187.
- [25] Condon, J. J. Radio emission from normal galaxies. ARA&A 30, 575–611 (1992).
- [26] Klein, U. & Emerson, D. T. A survey of the distributions of 2.8 cm radio continuum in nearby galaxies. A&A 94, 29–44 (1981).
- [27] Gioia, I. M., Gregorini, L. & Klein, U. High frequency radio continuum observations of bright spiral galaxies. A&A 116, 164–174 (1982).
- [28] Tabatabaei, F. S. et al. The Radio Spectral Energy Distribution and Star-formation Rate Calibration in Galaxies. ApJ 836, 185 (2017). 1611.01705.
- [29] Murphy, E. J. et al. Calibrating Extinction-free Star Formation Rate Diagnostics with 33 GHz Free-free Emission in NGC 6946. ApJ 737, 67 (2011). 1105.4877.
- [30] McQuinn, M. Locating the “Missing” Baryons with Extragalactic Dispersion Measure Estimates. ApJ 780, L33 (2014). 1309.4451.
- [31] Richards, E. A. The Nature of Radio Emission from Distant Galaxies: The 1.4 GHZ Observations. ApJ 533, 611–630 (2000). astro-ph/9908313.
- [32] Chiaraluce, E. et al. From radio-quiet to radio-silent: low-luminosity Seyfert radio cores. MNRAS 485, 3185–3202 (2019). 1902.10670.
- [33] Panessa, F. et al. The origin of radio emission from radio-quiet active galactic nuclei. Nature Astronomy 3, 387–396 (2019). 1902.05917.
- [34] Behar, E., Vogel, S., Baldi, R. D., Smith, K. L. & Mushotzky, R. F. The mm-wave compact component of an AGN. MNRAS 478, 399–406 (2018). 1803.06877.
- [35] Chen, S., Laor, A., Behar, E., Baldi, R. D. & Gelfand, J. D. The radio emission in radio-quiet quasars: the VLBA perspective. MNRAS 525, 164–182 (2023). 2307.13599.
- [36] Laor, A. & Behar, E. On the origin of radio emission in radio-quiet quasars. MNRAS 390, 847–862 (2008). 0808.0637.
- [37] Astropy Collaboration et al. Astropy: A community Python package for astronomy. A&A 558, A33 (2013). 1307.6212.
- [38] Petroff, E. et al. FRBCAT: The Fast Radio Burst Catalogue. PASA 33, e045 (2016). 1601.03547.
- [39] Planck Collaboration et al. Planck 2018 results. VI. Cosmological parameters. A&A 641, A6 (2020). 1807.06209.
- [40] Spitler, L. G. et al. Fast Radio Burst Discovered in the Arecibo Pulsar ALFA Survey. ApJ 790, 101 (2014). 1404.2934.
- [41] Tendulkar, S. P. et al. The Host Galaxy and Redshift of the Repeating Fast Radio Burst FRB 121102. ApJ 834, L7 (2017). 1701.01100.
- [42] Marcote, B. et al. The Repeating Fast Radio Burst FRB 121102 as Seen on Milliarcsecond Angular Scales. ApJ 834, L8 (2017). 1701.01099.
- [43] Michilli, D. et al. An extreme magneto-ionic environment associated with the fast radio burst source FRB 121102. Nature 553, 182–185 (2018). 1801.03965.
- [44] CHIME/FRB Collaboration et al. CHIME/FRB Discovery of Eight New Repeating Fast Radio Burst Sources. ApJ 885, L24 (2019). 1908.03507.
- [45] Marcote, B., Nimmo, K., Hessels, J. W. T., Tendulkar, S. P. & etc. A repeating fast radio burst source localized to a nearby spiral galaxy. Nature 557, 190–194 (2020).
- [46] Bannister, K. W. et al. A single fast radio burst localized to a massive galaxy at cosmological distance. Science 365, 565–570 (2019). 1906.11476.
- [47] Prochaska, J. X. et al. The low density and magnetization of a massive galaxy halo exposed by a fast radio burst. Science 365, aay0073 (2019). 1909.11681.
- [48] Anna-Thomas, R. et al. Magnetic field reversal in the turbulent environment around a repeating fast radio burst. Science 380, 599–603 (2023). 2202.11112.
- [49] Xu, H. et al. A fast radio burst source at a complex magnetized site in a barred galaxy. Nature 609, 685–688 (2022). 2111.11764.
- [50] Bhandari, S. et al. A Nonrepeating Fast Radio Burst in a Dwarf Host Galaxy. ApJ 948, 67 (2023). 2211.16790.
- [51] Masui, K. et al. Dense magnetized plasma associated with a fast radio burst. Nature 528, 523–525 (2015). 1512.00529.
- [52] Petroff, E. et al. A polarized fast radio burst at low Galactic latitude. MNRAS 469, 4465–4482 (2017). 1705.02911.
- [53] Keane, E. F. et al. The host galaxy of a fast radio burst. Nature 530, 453–456 (2016). 1602.07477.
- [54] Ravi, V. et al. The magnetic field and turbulence of the cosmic web measured using a brilliant fast radio burst. Science 354, 1249–1252 (2016). 1611.05758.
- [55] Bhandari, S. et al. The SUrvey for Pulsars and Extragalactic Radio Bursts - II. New FRB discoveries and their follow-up. MNRAS 475, 1427–1446 (2018). 1711.08110.
- [56] Caleb, M. et al. The SUrvey for Pulsars and Extragalactic Radio Bursts - III. Polarization properties of FRBs 160102 and 151230. MNRAS 478, 2046–2055 (2018). 1804.09178.
- [57] Osłowski, S. et al. Commensal discovery of four fast radio bursts during Parkes Pulsar Timing Array observations. MNRAS 488, 868–875 (2019). 1906.09793.
- [58] Connor, L. et al. A bright, high rotation-measure FRB that skewers the M33 halo. MNRAS 499, 4716–4724 (2020). 2002.01399.
- [59] CASA Team et al. CASA, the Common Astronomy Software Applications for Radio Astronomy. PASP 134, 114501 (2022). 2210.02276.
- [60] Carrasco, E. et al. MEGARA, the R=6000-20000 IFU and MOS of GTC. In Evans, C. J., Simard, L. & Takami, H. (eds.) Ground-based and Airborne Instrumentation for Astronomy VII, vol. 10702 of Society of Photo-Optical Instrumentation Engineers (SPIE) Conference Series, 1070216 (2018).
- [61] Gil de Paz, A. et al. First scientific observations with MEGARA at GTC. In Evans, C. J., Simard, L. & Takami, H. (eds.) Ground-based and Airborne Instrumentation for Astronomy VII, vol. 10702 of Society of Photo-Optical Instrumentation Engineers (SPIE) Conference Series, 1070217 (2018).
- [62] Pascual, S., Cardiel, N., Picazo-Sanchez, P., Castillo-Morales, A. & de Paz, A. G. guaix-ucm/megaradrp: v0.12.0 (2022). URL https://doi.org/10.5281/zenodo.6043992.
- [63] Chamorro-Cazorla, M. et al. MEGADES: MEGARA galaxy disc evolution survey. Astronomy & Astrophysics 670, A117 (2023). URL https://doi.org/10.1051%2F0004-6361%2F202245111.
- [64] Oke, J. B. Faint Spectrophotometric Standard Stars. AJ 99, 1621 (1990).
- [65] Cardelli, J. A., Clayton, G. C. & Mathis, J. S. The Relationship between Infrared, Optical, and Ultraviolet Extinction. ApJ 345, 245 (1989).
- [66] Astropy Collaboration et al. The Astropy Project: Sustaining and Growing a Community-oriented Open-source Project and the Latest Major Release (v5.0) of the Core Package. ApJ 935, 167 (2022). 2206.14220.
- [67] Citro, A. et al. A methodology to select galaxies just after the quenching of star formation. MNRAS 469, 3108–3124 (2017). 1704.05462.
- [68] Baldwin, J. A., Phillips, M. M. & Terlevich, R. Classification parameters for the emission-line spectra of extragalactic objects. PASP 93, 5–19 (1981).
- [69] Kauffmann, G. et al. The host galaxies of active galactic nuclei. MNRAS 346, 1055–1077 (2003). astro-ph/0304239.
- [70] Quai, S., Pozzetti, L., Citro, A., Moresco, M. & Cimatti, A. Galaxies in the act of quenching star formation. MNRAS 478, 3335–3355 (2018). 1804.08631.
- [71] Quai, S. et al. Spatially resolved signature of quenching in star-forming galaxies. MNRAS 490, 2347–2366 (2019). 1910.01130.
- [72] Dhiwar, S. et al. Witnessing the star formation quenching in L∗ ellipticals. MNRAS 518, 4943–4960 (2023). 2211.08884.
- [73] Eisenstein, D. J. et al. SDSS-III: Massive Spectroscopic Surveys of the Distant Universe, the Milky Way, and Extra-Solar Planetary Systems. AJ 142, 72 (2011). 1101.1529.
- [74] Alloin, D., Collin-Souffrin, S., Joly, M. & Vigroux, L. Nitrogen and oxygen abundances in galaxies. A&A 78, 200–216 (1979).
- [75] Curti, M. et al. New fully empirical calibrations of strong-line metallicity indicators in star-forming galaxies. MNRAS 465, 1384–1400 (2017). 1610.06939.
- [76] Allende Prieto, C., Lambert, D. L. & Asplund, M. The Forbidden Abundance of Oxygen in the Sun. ApJ 556, L63–L66 (2001). astro-ph/0106360.
- [77] Bundy, K. et al. Overview of the SDSS-IV MaNGA Survey: Mapping nearby Galaxies at Apache Point Observatory. ApJ 798, 7 (2015). 1412.1482.
- [78] Fong, W.-f. et al. Chronicling the Host Galaxy Properties of the Remarkable Repeating FRB 20201124A. arXiv e-prints arXiv:2106.11993 (2021). 2106.11993.
- [79] Ravi, V. et al. The host galaxy and persistent radio counterpart of FRB 20201124A. arXiv e-prints arXiv:2106.09710 (2021). 2106.09710.
- [80] Johnson, B. D., Leja, J. L., Conroy, C. & Speagle, J. S. Prospector: Stellar population inference from spectra and SEDs (2019). 1905.025.
- [81] Draine, B. T. & Li, A. Infrared Emission from Interstellar Dust. IV. The Silicate-Graphite-PAH Model in the Post-Spitzer Era. ApJ 657, 810–837 (2007). astro-ph/0608003.
- [82] Leja, J., Johnson, B. D., Conroy, C. & van Dokkum, P. Hot Dust in Panchromatic SED Fitting: Identification of Active Galactic Nuclei and Improved Galaxy Properties. ApJ 854, 62 (2018). 1709.04469.
- [83] Nenkova, M., Sirocky, M. M., Ivezić, Ž. & Elitzur, M. AGN Dusty Tori. I. Handling of Clumpy Media. ApJ 685, 147–159 (2008). 0806.0511.
- [84] Aniano, G. et al. Modeling Dust and Starlight in Galaxies Observed by Spitzer and Herschel: NGC 628 and NGC 6946. ApJ 756, 138 (2012). 1207.4186.
Extended Data
| Telescope | Date | Frequency | Bandwidth | FWHM | P.A. | RMS | Flux density |
| dd/mm/yyyy | (GHz) | (GHz) | (arcsec) | (deg) | (Jy/beam) | (Jy) | |
| VLA† | 06/03/2022 | 6 | 4 | 0.380.36 | 51 | 2.0 | 8.23.8 |
| VLA | 07/10/2021 | 15 | 6 | 0.380.36 | +3.6 | 2.3 | 20.03.5 |
| VLA | 03-07/01/2022 | 22 | 8 | 0.370.32 | 53 | 3.0 | 30.09.7 |
| NOEMA | 12/03/2023 | 236.5 | 7.6 | 0.70.42 | +15 | 43 | |
| NOEMA | 12/03/2023 | 250 | 7.6 | 0.660.39 | +15 | 53 |
| FRB Name | References | ||||||||
|---|---|---|---|---|---|---|---|---|---|
| () | () | () | () | () | () | () | |||
| FRB 20121102A | 180 | 1,2,3,4 | |||||||
| FRB 20180916B | 5,6 | ||||||||
| FRB 20180924B | 7 | ||||||||
| FRB 20181112A | 8 | ||||||||
| FRB 20190520B | 9,10 | ||||||||
| FRB 20201124A | 11, this work | ||||||||
| FRB 20210117A | 12 | ||||||||
| FRB 20110523A | 13 | ||||||||
| FRB 20150215A | 14 | ||||||||
| FRB 20150418A | 15 | ||||||||
| FRB 20150807A | 16 | ||||||||
| FRB 20160102A | 17,18 | ||||||||
| FRB 20180309A | 19 | ||||||||
| FRB 20191108A | 20 |
Supplementary Methods
0.11 VLA observations
Observations with the VLA were performed in B-configuration at 15 GHz (Ku-band) and 22 GHz (K-band), under DDT project 21B-330 [PI: Bruni]. The 22 GHz observations were divided into two -hours blocks, and then concatenated in order to achieve a similar RMS to the 15 GHz ones. Data calibration was performed with the CASA111https://casa.nrao.edu/, [59] VLA pipeline, and images deconvolution through the TCLEAN task. The signal to noise ratio at 15 GHz allowed us to apply the robust weighting scheme to improve the angular resolution, obtaining a final value for the FWHM similar to the 22 GHz one. The RMS was 2–3 Jy/beam at both frequencies.
0.12 NOEMA observations
Observations with the NOrthern Extended Millimeter Array (NOEMA) were carried-out through project W22BS [PI:Bruni] during March 2023 using the B array configuration with 12 antennas. The phase center was set at RA, DEC = 05:08:03.470, 26:03:38.50. The Band 3 (1 mm) receiver was tuned at 244 GHz, so that the Lower Side Band (LSB) was centered at 236.5 GHz and the Upper Side Band (USB) at 250 GHz. Visibilities were calibrated using the CLID pipeline within the GILDAS software 222www.iram.fr/IRAMFR/GILDAS. The absolute flux scale accuracy is of the order 10%. Imaging and deconvolution were performed using MAPPING applying natural weighting. The final continuum maps reach a 1 RMS of 4.3 Jy/beam in LSB and 5.3 Jy/beam in USB. The clean beams are arcsec2 and arcsec2 (PA = 15 deg) in LSB and USB, respectively.
No clear detection was found in either LSB or USB data towards the FRB position, as derived from 15 GHz VLA data. We derived upper limits of 0.13 mJy and 0.15 mJy/beam in LSB and USB, respectively.
0.13 GTC/MEGARA observations
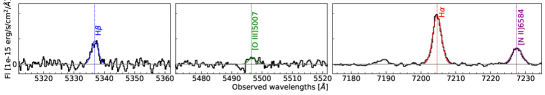
The GTC/MEGARA instrument ([60]; [61]) collected a series of 6 observations on October 26, 2022, using the Large Compact Bundle (LCB) Integral Field Unit (IFU) mode. It provides a field of view (FoV) of arcsec2 using 567 fibres in a hexagonal tessellation with a spaxel size of . In order to cover the main optical emission lines, useful to derive the SFR spatial distribution within the galaxy, the observations were carried out with two different low resolution (LR, resolving power ) volume-phase holographic (VPH) grating: VPH570-LR (LR-V), and VPH675-LR (LR-R), whose specifications can be found in Table 1. This produces a combined spectrum covering the spectral range from 4350 to 7288 Å (see Figure 3). This range, at the redshift of our target, includes spectral emission lines such as H, H, , , needed for deriving the spatial distribution of the galaxy parameters like SFR, intrinsic extinction and velocity map. The measured seeing during the observations were in the range –.
| Date | MEGARA VPH | Band | Exposure | R.L.D.* | R |
|---|---|---|---|---|---|
| 28 October 2022 | LR-V | 5165.6 – 6176.2 | 3 1800 | 0.27 | 6078 |
| 28 October 2022 | LR-R | 6158.3 – 7287.7 | 3 1200 | 0.31 | 6100 |
| *Reciprocal linear dispersion. | |||||
We used the MEGARA data reduction pipeline (DRP) v0.12.0 [62] to process the data. We followed the same procedure as described in detail in [63]. The final spectra where flux calibrated using the standard stars HR8634, available in the ESO spectro-photometric standards database ([64]). In Figure 1, we present the map of the net counts of the galaxy.
0.14 Host galaxy characterization with GTC/MEGARA
The continuum emission of the projected galaxy extends approximately 9 kpc along the major axis () and around 5 kpc along the minor axis (), without accounting for PSF effects. By assuming a straightforward circular galactic geometry, we calculated an inclination angle of approximately 56.3 degrees based on the ratio of .
Figure 2 shows a compilation of optical spectra of the galaxy. In particular, we show the spectra of H, [O III] 5007 and H corrected for Galactic extinction for the six pixels surrounding the FRB and PRS (referred to as the FRB region), from left to right. The FRB region is delineated by a magenta rectangle in Figure 1. These spectra show blue-shifted emission lines with respect to the reference redshift (z=0.0978), indicating rotational velocities between and km/s, as shown in Figure 7. The H line in the right panels of Figure 2 shows a clear and highly significant detection. Despite its intrinsic weakness compared to H by a factor of about 3, H performs quite well, even in a spectral region with a RMS roughly 2.7 times worse than that in the H spectral region. Indeed, the standard deviation of the continuum is about erg/s/cm2/ for H compared to erg/s/cm2/ for H. Conversely, the [O III] 5007 line shown in the middle panels of Figure 2 is either absent or very weak in all spectra. We will analyse this spectral feature in more detail later in this section. We have identified an unexpected absorption feature, consistently appearing at an observed wavelength of approximately Åin all six pixels within the FRB region. We anticipate that this feature is also present in the stacked spectrum of the entire galaxy which we will introduce later in this session.
We obtained measurements of the emission lines H, H, [O III] 5007, and [NII] 6584 at the spaxel level through the following procedure: as a first step we corrected each spectrum for Galactic extinction (E(B-V) = 0.652) using the [65] extinction law. Subsequently, we removed the underlying stellar continuum by subtracting a pseudo-continuum, defined as a straight line connecting adjacent bluer and redder regions to the emission component, devoid of other relevant spectral features. We used a Python-Astropy routine based on the Levenberg-Marquardt algorithm and least squares statistic [66] to fit up to two Gaussian components to each line, selecting as the best-fit solution the one that minimized the reduced chi-square statistic toward 1. We assessed the validity of our Gaussian fits by directly integrating the total line flux within a wavelength interval centered in the line centroid and spanning twice the standard deviation of the best-fitted Gaussian for each line. Finally, we used a bootstrapping technique to quantify uncertainties in the Gaussian parameters for each emission line (i.e., amplitude, line’s centroid, and standard deviation). We iteratively sampled and fitted the spectra times, introducing Gaussian noise with an amplitude equal to the RMS of the spectrum within the spectral regions corresponding to the pseudo-continuum of the respective line. This bootstrapping process yields a Gaussian distribution of parameter values, with the standard deviation providing a robust estimate of the uncertainty associated with the fitted parameter.
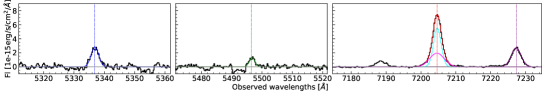
In conjunction with our pixel-level analysis of the galaxy, this study includes two additional spectra, shown in Figure 3. In the top panel we show the composite spectrum derived by stacking the R and V grism spectra of the six pixels defining the FRB region previously described in Figure 2. This composite spectrum has been carefully corrected to a reference redshift of z = 0.0978 to compensate for any H-related velocity effects. In addition, in the bottom panel of Figure 3 we present the global spectrum of the whole galaxy obtained by stacking the R and V spectra of all pixels within the rectangular region delimited by RA 5h 08m 3.4s - 3.6s and DEC 26° 03’ 35” - 40”. The fluxes and detection significance (expressed in signal-to-noise of the emission line) for both stacked spectra are listed in Table 2.
| Line | Param. | FRB reg. | Global |
|---|---|---|---|
| H (1st comp.) | flux | ||
| S/N | |||
| H (2nd comp.) | flux | ||
| S/N | |||
| H | flux | ||
| S/N | |||
| [N II] 6584 | flux | ||
| S/N | |||
| [O III] 5007 | flux | ||
| S/N |
The motivation behind the creation of these stacked spectra is to increase the RMS values within the spectral regions under investigation, thereby improving the statistical significance of weak spectral lines, including the H and [O III] 5007 lines. This enhancement allows us to investigate the comprehensive properties of the galaxy, which are discussed in the following sections of this appendix.
Emission line maps
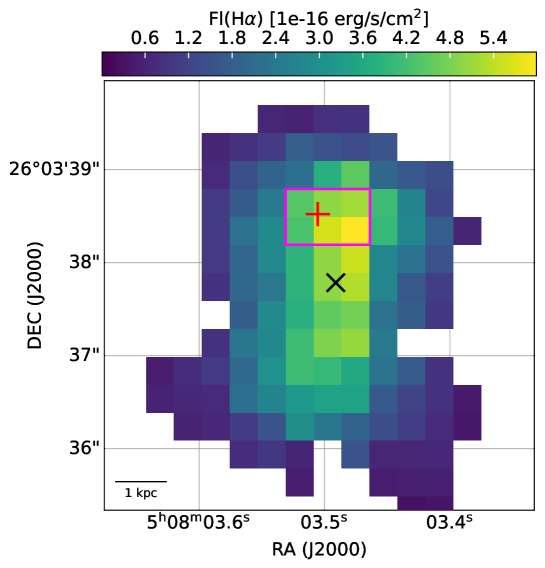
Figure 4 shows the galaxy’s H emission line map, which has been corrected for Galactic extinction. In our analysis, we need reliable measures of the H line, hence we exclude pixels with H signal-to-noise (S/N) . In this map, only pixels with a signal-to-noise ratio (S/N) of H are shown. This H map serves as the starting point for our analysis of the GTC/MEGARA optical spectra, enabling us to derive crucial physical properties of the gas phase in the galaxy, including gas kinematics and dynamics, ionization levels, star formation rate (SFR), and gas-phase metallicity.
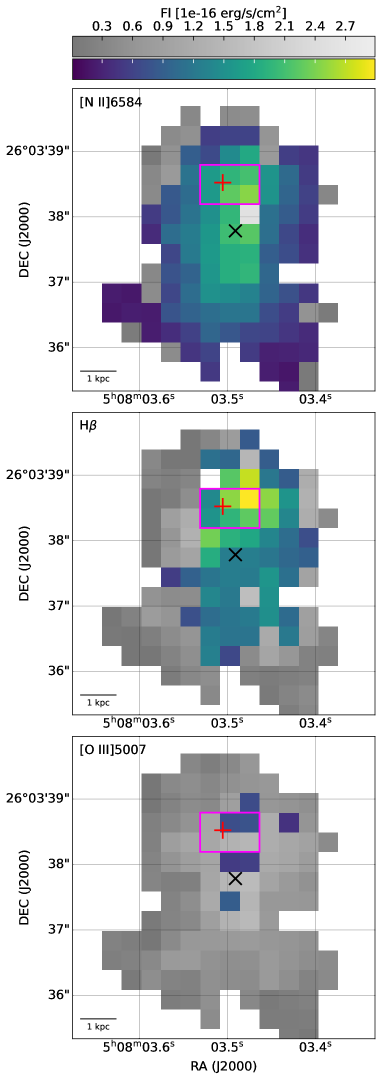
Figure 5 shows maps of three emission lines within the wavelength range covered by our GTC/MEGARA data, specifically, [N II] 6584, H, and [O III] 5007 lines, from top to bottom. Each panel in Figure 5 uses two color schemes: one represents pixels where the line is detected with a signal-to-noise ratio (S/N) of (colored scale pixels), and the other represents pixels with flux upper limits. We determined upper limits for the lines at a significance level for all pixels where the signal-to-noise ratio of the line fell below . Here, represents the standard deviation of the Gaussian best-fit of the stacked spectrum of the whole galaxy, as shown in the lower panel of Figure 3. The [N II] 6584 and H line maps exhibit similar flux distribution patterns as observed in the H map, albeit with fainter emissions towards the galaxy’s outer regions (although H is intrinsically fainter, approximately three times less intense than H). The [O III] 5007 line, instead, is undetected at a level across nearly the entire galaxy. This faint emission in the [O III] lines may be attributed to either high gas metallicity or a low ionization state resulting from diminished UV radiation [67]. We will explore this ionization-metallicity degeneracy in the next subsection.
Derived quantities from optical spectra
In the previous section, we established that the [O III] emission is lacking in the FRB region and generally weak and undetectable throughout the entire galaxy. This intriguingly suggests that the faintness of [O III] lines might be the sign of recent star formation quenching. Following a sharp decline in star formation, the high-energy UV radiation emitted by short-lived, massive O-type stars decreases significantly within a few million years. This would lead to a rapid decline in the luminosity of lines with high ionisation, such as the [O III] emission lines. However, emission lines associated with lower ionisation energies, such as the Balmer lines, would continue to be detectable as long as late O and early B-type stars with longer lifetimes, remain in the main sequence phase. However, [O III] 5007 emission can be depressed in a similar way also by high gas metallicity, leading to the so called ionization-metallicity degeneracy [67].
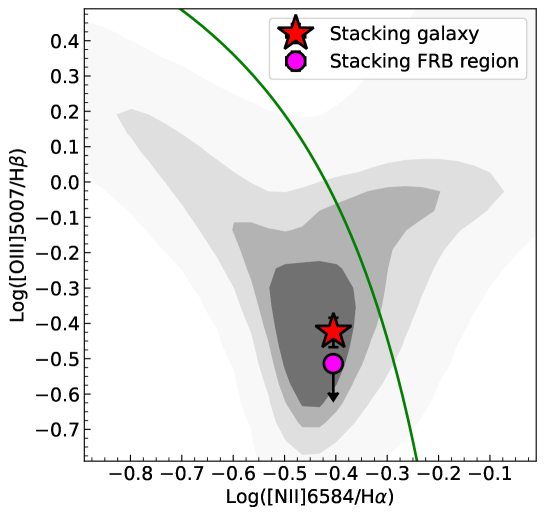
The ionization-metallicity degeneracy on the [O III] emission can be mitigated by using pairs of emission line ratios, each related to either metallicity or ionization. For example, the [N II] 6584/[O II] 3727 or [S II]/H ratios can serve as proxies for metallicity, whereas [O III] 5007/H or [Ne III] 3869/[O II] 3727 ratios can serve as proxies for ionization levels [67, 70, 71, 72]. Our GTC/MEGARA wavelength coverage is limited to the four aforementioned lines, thus limiting us to disentangling the two underlying physical properties responsible for the faintness of the [O III] 5007 line in the galaxy. Nevertheless, the four aforementioned emission lines allow us to explore the diagnostic diagram introduced by [68], hereafter referred to as BPT, which relates log([O III] 5007/H and log([N II] 6584/H to the ionization level and metallicity contempt in the galaxy.
The location of a galaxy (or galactic region) in the BPT plane is very sensitive to the source of UV radiation responsible for ionising its gas. These UV photon sources can be radiation from the hot stellar photospheres of recently formed massive stars, AGN activity, shock processes, or combinations of these. Figure 6 shows the BPT diagram of the galaxy for the two stacked spectra of the FRB region and the whole galaxy, as well as the distribution of the SDSS-DR8 [73] Main galaxies as a reference for low redshift galaxies. Note that the data point of the stacked spectrum representative of the FRB region is an upper limit for [O III] 5007/H since the [O III] line is not detected at least at the level in the stacked spectrum. We have adopted the criterion of [69] to distinguish between ionisation due to star formation (i.e. data points lying below the green curve in Figure 6), and other radiation sources (e.g., ionization due to active galactic nuclei). According to the [69], both the stacked FRB spectrum and the entire galaxy have radiation dominated by star formation.
The gas phase metallicity
We estimated the gas phase metallicity of the galaxy using the strong line metallicity indicator O3N2, as initially defined by [74] as log([O III] 5007/H/[N II] 6584/H). We adopted the metallicity calibration by [75] with a solar abundance value of 12+log(O/H) [76]. We measured slightly super solar values of 12+log(O/H) and in the stacked spectra of the entire galaxy and the FRB region, respectively. To mitigate the ionization-metallicity degeneracy in the [O III] line, we used predictions from the [67] photoionization models using the four emission lines defining the BPT diagram. We found that the stacked spectrum of the entire galaxy is compatible with emission from HII regions with ionization level U, typical of a star-forming galaxy, and solar metallicity. For the FRB region, we obtained a metallicity compatible with solar metallicity, and an upper limit in the ionization level U . the upper limit in the parameter U is due to the low significance level of the [O III] line of the stacked spectrum in the FRB region. It is worth noting that the upper limit on the parameter U arises from the lower significance level of the [O III] line in the stacked spectrum of the FRB region. Consequently, given the current depth and Signal-to-Noise Ratio (SNR) of our optical data, along with the absence of information from other emission lines capable of independently sensing changes in the ionization parameter and gas phase metallicity, we cannot conclusively confirm or exclude the possibility that the FRB region has recently experienced a decline in star formation.
Kinematics and dynamics of the gas-phase
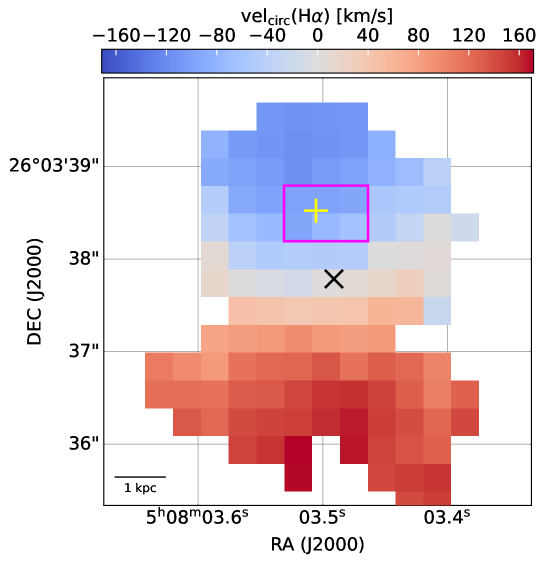
The left panel of Figure 7 shows the circular velocity map (velcirc) for the galaxy. We derived this map by de-projecting the H radial velocity (), corrected for the relative velocity at the reference redshift (z=0.0978), onto the galactic plane using the equation:
| (12) |
where represents the inclination angle of the galaxy, which we estimated based on the net-counts map (Figure 1). The resulting velocity map demonstrates that the galaxy exhibits well-ordered gas kinematics predominantly characterized by circular orbits. Rotation velocities range from 0 to km/s (at the galactic center and a radial distance of kpc, respectively) in the northern region, and from to approximately 150 km/s (at a radial distance of kpc) in the southern region.
In the right panel of Figure 7 we show the H velocity dispersion map () for the galaxy. To account for instrumental resolution effects, we subtracted in quadrature the sigma value (in units of Å) derived from the Gaussian fit of the strong sky line at 7276.405 Å from that of the measured H. With this approach we obtain a reliable correction as the reference sky line is nearby to the observed H line and clearly detected. The galaxy shows dynamics typical of a local star-forming galaxy [77] with velocity dispersion values reaching up to 80 km/s in the center and lower values of only km/s in the outskirts.
We report here a summary of our findings regarding the GTC/MEGARA data. We found a star-forming galaxy with an inclination angle of approximately 56 deg. The H velocity map reveals predominantly circular gas kinematics with velocities ranging from km/s (north) to 150 km/s (south). Emission line measurements, including H, H, [O III] 5007, and [NII] 6584, corrected for extinction, provide insights into the gas metallicity and star formation rates (SFR). Gas metallicity is slightly super-solar, and the BPT diagram indicates radiation dominated by star formation. The SFR map shows a peak near the galactic center as identified by the HST images, with SFR of to M/yr/kpc2. The FRB region exhibits lower SFR levels, and analysis of stacked spectra yields an estimated SFR of M/yr, significantly lower than SFR obtained from the radio emissions.
0.15 Host galaxy SED Analysis
We performed a re-analysis of the host galaxy SED to include the recently acquired NOEMA data. The NOEMA limits set a stringent upper bound to the flux in the mm range, and are over predicted by the model presented in Paper I. We note that these limits seem to be marginally consistent with the best-fit model presented by [78], while [79] does not present their SED out to these wavelengths for comparison.
In order to determine how the NOEMA data at far-infrared wavelengths (FIR) changes the results, we re-modeled the SED using prospector [80] with the methods utilized in Paper I. We similarly include data spanning the bands, and in this case we include all four WISE bands (, , , ) in order to properly constrain the mid-infrared (MIR) SED. In order to constrain the shape of the MIR SED, we likewise included the contribution of dust emission from polycyclic aromatic hydrocarbons (PAHs), which uses the model presented by [81]. We additionally test for the presence of an AGN contributing to the MIR. These effects were not included in Paper I.
The dust emission model has three free parameters: the fraction of dust mass in PAHs , lower limit to the strength of starlight in units of the Milky Way , and the fraction of dust irradiated by starlight stronger than , where the power-law distribution of starlight is a power-law with slope . We adopted broad uniform priors for these parameters: , (bounded by the wavelengths included in the fit), and , as outlined in [82]. The AGN model utilizes the templates from [83] and is parametrized by the fraction of bolometric stellar luminosity emitted by the AGN, and the optical depth of the torus . We utilize log uniform priors of and , as in [82].
The best-fit SED is shown in Figure 8. We derive the following best-fit parameters: a significant intrinsic extinction , a near solar metallicity , a stellar mass , an old mass-weighted stellar age Gyr, an e-folding time , a star formation rate SFR= yr-1. The dust parameters, in particular , are relatively unconstrained, besides strongly favoring and a larger value of ( confidence level). The preference towards a higher value of is due to the fact that a larger value of irradiance leads to a higher dust temperature, pushing the peak of the SED away from the NOEMA limits. We further find that an AGN is likely only contributing at the level of the total bolometric luminosity, and at most , in agreement with the previous value () derived by [78].
In comparison to Paper I, we find a smaller SFR and an older stellar population, closer to the values reported by [78], but still with a slightly smaller stellar mass. A similar analysis not including an AGN returns nearly identical parameters for , , , , , and SFR compared to Paper I (i.e., consistent within errors), while only changing the dust parameters, similarly favoring a high .
Following [84], we can convert the dust model parameters [81] to a temperature, for better comparison to our analytical constraints on the NOEMA data. We find a dust temperature of K. We note that the analytical constraints derived previously in §0.12 are based on the local limits to the PRS, while here we use the global limits of the entire galaxy.