11email: luigi.piro@inaf.it 22institutetext: Department of Astronomy, University of Maryland, College Park, MD 20742-4111, USA 33institutetext: Astrophysics Science Division, NASA Goddard Space Flight Center, 8800 Greenbelt Rd, Greenbelt, MD 20771, USA 44institutetext: Department of Physics, The George Washington University, 725 21st Street NW, Washington, DC 20052, USA 55institutetext: Astronomy, Physics, and Statistics Institute of Sciences (APSIS), The George Washington University, Washington, DC 20052, USA 66institutetext: INAF – Istituto di Radioastronomia, Via Gobetti 101, I-40129, Bologna, Italy 77institutetext: Istituto Nazionale di Ricerca Metrologica (INRiM) - Strada delle Cacce 91, I-10135 Torino, Italy 88institutetext: Department of Physics and Astronomy, University of Nevada, 89154, Las Vegas, NV, USA 99institutetext: INAF – Osservatorio Astronomico di Cagliari, via della Scienza 5, I-09047 Selargius (CA), Italy 1010institutetext: Kavli Institute for Astronomy and Astrophysics, Peking University, Beijing 100871, China 1111institutetext: National Astronomical Observatories, Chinese Academy of Sciences, Beijing 100012, China 1212institutetext: Department of Physics, Università di Cagliari, S.P. Monserrato-Sestu km 0,700, I-09042 Monserrato (CA), Italy
The Fast Radio Burst FRB 20201124A in a star forming region: constraints to the progenitor and multiwavelength counterparts
We present the results of a multiwavelength campaign of FRB 20201124A, the third closest repeating fast radio burst recently localized in a nearby ( ) galaxy. Deep VLA observations led to the detection of quiescent radio emission, also marginally visible in X-rays with Chandra. Imaging at 22 GHz allowed us to resolve the source on a scale of and locate it at the position of the FRB, within an error of . EVN and e-MERLIN observations sampled small angular scales, from 2 to 100 mas, providing tight upper limits on the presence of a compact source and evidence for diffuse radio emission. We argue that this emission is associated with enhanced star formation activity in the proximity of the FRB, corresponding to a star formation rate of . The surface star formation rate at the location of FRB 20201124A is two orders of magnitude larger than typically observed in other precisely localized FRBs. Such a high SFR is indicative of this FRB source being a new-born magnetar produced from a SN explosion of a massive star progenitor. Upper limits to the X-ray counterparts of 49 radio bursts observed in our simultaneous FAST, SRT and Chandra campaign are consistent with a magnetar scenario.
Key Words.:
Stars: magnetars – Radio continuum: galaxies – Galaxies: star formation – X-rays: galaxies – X-rays: bursts1 Introduction
Fast radio bursts (FRB) are bright radio flashes of ms duration (Lorimer et al., 2007; Petroff et al., 2019; Cordes & Chatterjee, 2019), located at cosmological distances. Hundreds of these events have now been discovered (The CHIME/FRB Collaboration et al., 2021), yet their progenitor systems remain unknown. A leading candidate source is a highly magnetized neutron star (NS), known as magnetar (Popov & Postnov, 2010; Katz, 2016; Metzger et al., 2017; Beloborodov, 2017; Kumar et al., 2017; Wadiasingh & Timokhin, 2019; Lyubarsky, 2021; Yang & Zhang, 2021), as supported by the recent detection of FRB-like radio bursts from a soft gamma-ray repeater in our galaxy (Scholz & Chime/Frb Collaboration, 2020; Bochenek et al., 2020; Li et al., 2021; Mereghetti et al., 2020). However, the heterogeneous environment of FRBs and their empirical distinction in two classes (repeaters and non-repeaters) leave the door open to multiple progenitor channels (Zhang, 2020).
Accurate and rapid localizations of FRBs are key to trigger multiwavelength follow-up observations, which provide vital information on the FRB host galaxy, its distance scale, the broad band spectrum of the burst and the presence on any quiescent emission associated to the flaring source. However, FRBs span a wide range of distances, and the majority are too far to place any meaningful constraints on persistent emission or associated X-ray bursts. Therefore, we organized a follow-up program to focus on the closest events ( ) localized to an accuracy of at least .
Starting from March 21, 2021 the repeating source FRB 20201124A was reported to be in an active state (Chime/Frb Collabortion, 2021; Kumar et al., 2021), with continued activity over the next few months. We initiated our multiwavelength campaign soon after the FRB localization and the unambiguous identification of its host galaxy (Day et al., 2021a; Law et al., 2021; Wharton et al., 2021b) that, at a redshift (Kilpatrick et al., 2021), meets our selection criteria.
In this paper we present (§2) the results of our multi-instrument observations of FRB 20201124A in radio with the Very Large Array (VLA), the European VLBI Network (EVN), the enhanced Multi Element Remotely Linked Interferometer Network (e-MERLIN), the Five-hundred-meter Aperture Spherical radio Array (FAST), the Sardinia Radio Telescope (SRT), the upgraded Giant Metrewave Radio Telescope (uGMRT), in X-ray with the Neil Gehrels’ Swift Observatory (Swift) and the Chandra X-ray Observatory (CXO), and in the optical with the Lowell Discovery Telescope (LDT). In §3 we present the detection of a quiescent source associated to FRB 20201124A in radio and X-rays and discuss its origin. In §4 we discuss our results in the context of the properties of the local and host galaxy environments and their implications for the progenitors of FRBs, with particular regard to the magnetar scenario. In §5 we present the results of the simultaneous observation of FAST, SRT and Chandra, aimed at detecting X-ray counterparts of radio bursts, and discuss implications on the central engine. We summarize our conclusions in §6.
2 Observations
2.1 Radio
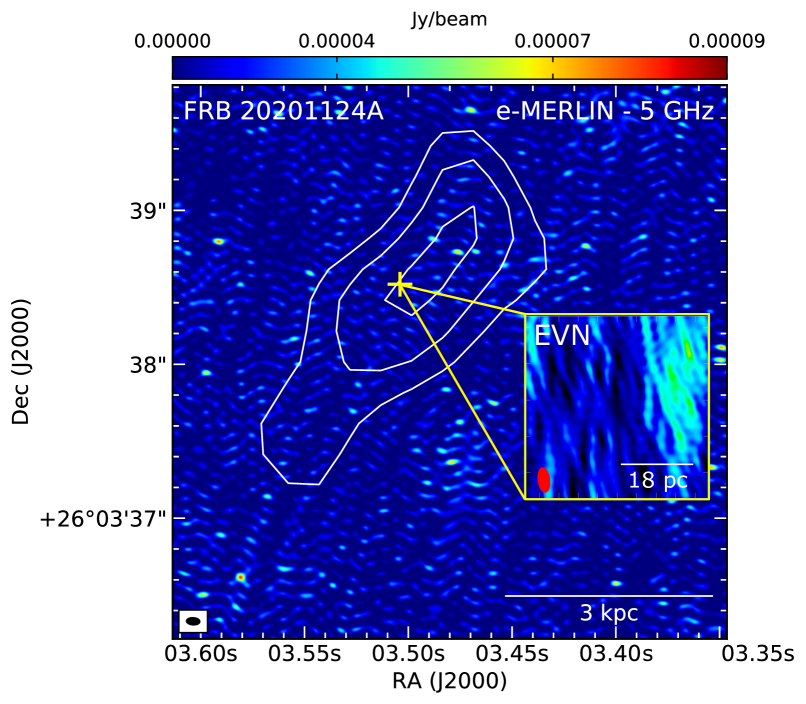
We searched for a persistent radio source associated to the FRB with the Jansky Very Large Array (JVLA). Observations were carried out under program (SG9112; PI: Piro) at multiple frequencies between April 9 and June 22 (see Appendix A). A radio source, consistent with the FRB position, was detected with a flux of at 3 GHz (Ricci et al. (2021), see also Wharton et al. (2021a); Ravi et al. (2021)). VLA monitoring of this source revealed that the radio emission is not variable, but persistent. However, the initial VLA D configuration did not have the sufficient resolution to resolve its angular extent. Therefore, we imaged the field using various beam sizes with the EVN ( 2 mas), e-MERLIN ( mas) and VLA ( 1″). Our EVN and e-MERLIN campaigns (Appendix C) did not detect any compact source over angular scales ranging from 2 mas to 60 mas. At the host redshift of 0.098, this corresponds to a projected linear size from 3 to 110 pc, and implies that the persistent radio emission is extended with an angular size ″, as also independently reported by Marcote et al. (2021); Ravi et al. (2021).
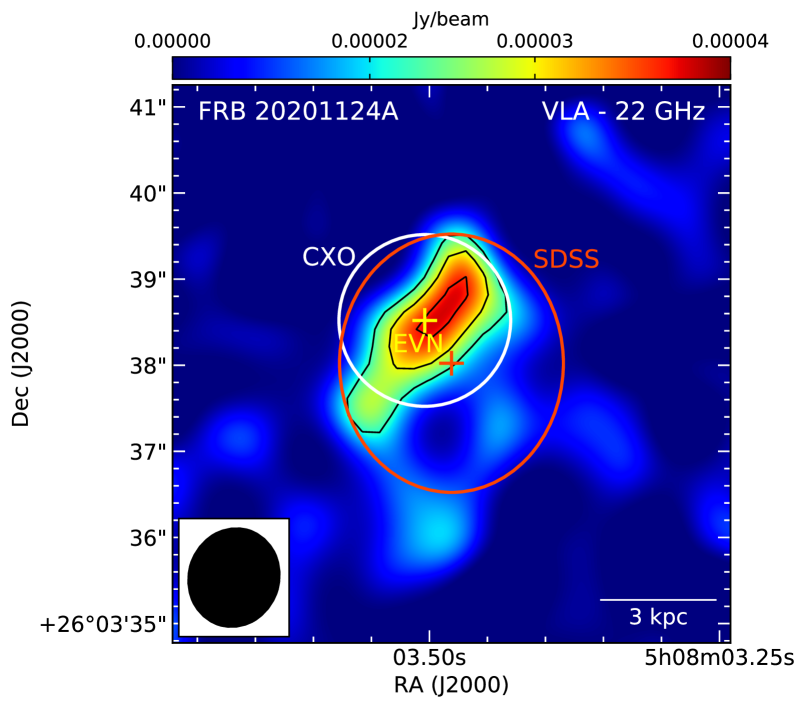
High-frequency (22 GHz) VLA observations, carried out in C configuration, partially resolve the source at the scale of 1″. As shown in Fig. 1, the centroid of the radio emission coincides with the precise FRB position derived by EVN observations (Marcote et al., 2021) within our location accuracy of . The radio source is elongated over at a position angle of 140∘. Its centroid displays marginal evidence of an offset of from the galaxy center, more evident when the peak of the radio emission (5 sigma level) is considered. At the redshift of =0.0978 (see Appendix E), the offset of the radio source from the galaxy center would correspond to 0.8 kpc and its extension to 3 kpc.
To extend the frequency coverage at low frequencies, we carried out uGMRT observations on July 21 and 24, 2021 (project code ddtC194; PI: Bruni), using the band-3 (260-500 MHz) and band-2 (125-250 MHz) receivers, respectively. We detected the source as an unresolved component with a flux density of 1.70.2 mJy at 380 MHz. The summary of our radio observations is in Tab.1.
2.2 Optical
Observations with the Ultra-Violet Optical Telescope (UVOT) on-board Swift were performed on April 6, 2021 (PI: Piro, Target ID: 14258) in -band with a total exposure 9.9 ks. We utilized the uvotimsum task within HEASoft v. 6.27.2 to coadd multiple exposures, and extracted the photometry with the uvotsource tool using a circular aperture of radius. In the stacked image, we derive an upper limit AB mag.
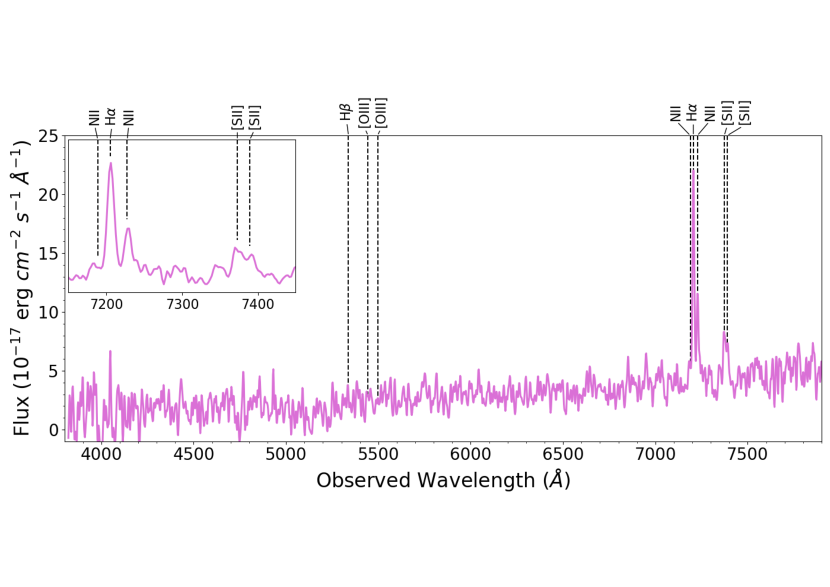
On April 21, 2021 we obtained optical spectroscopy of the putative host galaxy using the DeVeny spectrograph mounted on the 4.3m Lowell Discovery Telescope (LDT) for a total exposure of 4600 s. DeVeny was configured with the 300 g mm-1 grating and a 1.5″slit width, covering the FRB location. The spectrum covers wavelengths - at a dispersion of pix-1. The resulting spectrum, derived as described in Appendix E, is displayed in Figure 6. Emission lines (Tab.2), indicative of on-going star-formation, are detected at , , , and which we associate to H, the [NII] doublet, and the [SII] doublet at a redshift consistent with previous estimates (Ravi et al., 2021; Fong et al., 2021).
2.3 X-ray
Observations with the Swift X-ray Telescope (XRT) were carried out as part of the Swift Guest Investigator Program (PI: Piro). Data were collected in Photon Counting (PC) mode starting on April 6, 2021 for a total of 9.9 ks exposure (Appendix B). No source was detected at the location of the FRB down to a 3 upper limit cts s-1 (0.3-10 keV). We convert this value into an unabsorbed flux erg cm-2 s-1 (0.3-10 keV) assuming an absorbed power-law with photon index and a Galactic hydrogen column density cm-2 (Willingale et al., 2013).
Deeper imaging of the field was carried out with the Chandra X-ray Observatory (CXO) observations under Director’s Discretionary Time (DDT). The observations (ObsID: 25016; PI: Piro) occurred on April 20, 2021 for a total of 29.7 ks. Our analysis (Appendix B) was performed in the keV energy range. A blind search with wavdetect did not find any source at the FRB position, however a targeted search revealed a weak X-ray detection. We used a circular source region of 1″radius centered at the EVN position (Marcote et al., 2021) and, within this region, measured a total of 3 photons. We estimate a background level of 0.25 cts from nearby source-free regions and a source significance of 99.7% (3 Gaussian equivalent; Kraft et al., 1991).
The observed 0.5-7.0 keV count-rate 1.0 10-4 cts s-1 is converted into flux using the same absorbed power-law model described above. For a photon index , the unabsorbed flux in the 2-10 keV band is erg cm-2 s-1 corresponding to a luminosity of .
2.4 FRB searches
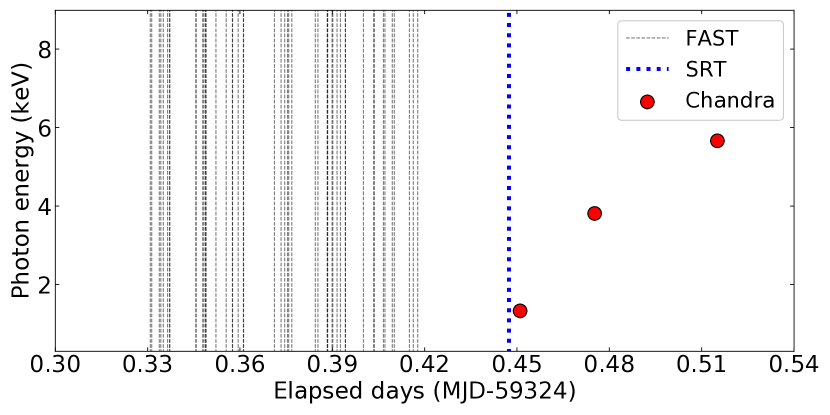
We have organized a simultaneous coverage of the Chandra observation with FAST and SRT aimed at searching for X-ray counterparts of bursts from FRB 20201124A(Appendix H). The radio facilities covered two separated periods for a total of 60% of the 8.3 hour Chandra observation. A total of 49 radio bursts (48 by FAST, 1 by SRT), with fluences in the range 0.017- 13 Jy ms and with an average duration of about 19 ms were observed. We do not find any significant coincidences with the 3 X-ray photons detected by Chandra. The closest FRB-X-ray photon time difference is 314 s. (Fig.2).
3 Origin of the radio emission
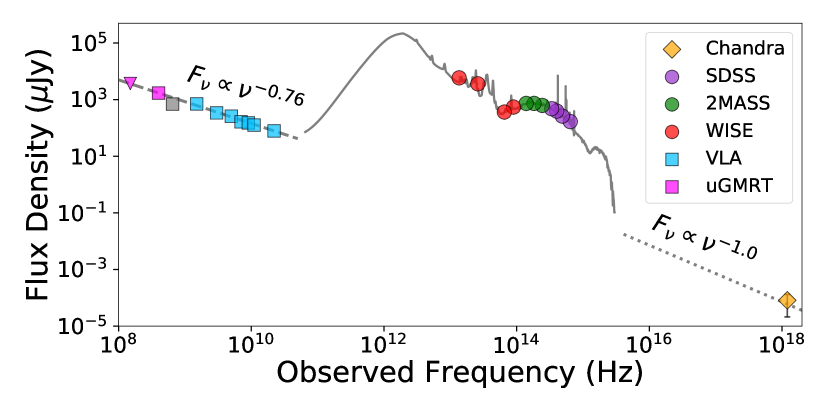
We argue that the extended radio source is associated to a star forming region in the host galaxy and exclude an AGN origin, as discussed in Appendix G (see also Ravi et al., 2021; Fong et al., 2021). Radio emission from star formation in normal and starburst galaxies is due to the combination of synchrotron emission from cosmic ray electrons produced in supernova remnants, that dominates below GHz, described by a power law with a slope , and a flat free-free emission and its associated low frequency absorption (see Appendix D). In our source, the spectrum from 0.15 GHz to 22 GHz is well described by a power law with , with no evidence of low frequency absorption or thermal emission (Fig.3). Such a spectrum is consistent with that observed in star-forming galaxies (Tabatabaei et al., 2017; Klein et al., 2018). The star formation rate associated to this source can be derived using the standard correlation relating SFR to radio luminosity, SFR= (Murphy et al., 2011). From the observed flux (Tab.1) and the corresponding luminosity L(1.4GHz)= we derive SFR.
The X-ray data are also in agreement with emission from a star forming region. X-ray emission is expected from the population of low mass (LMXB) and high-mass X-ray binaries (HMXB). By adopting standard correlations linking SFR to X-ray luminosity (Fragos et al., 2013; Ranalli et al., 2003) one expects a 2-10 keV luminosity in the range , consistent with the Chandra measurement (§2.3 and Appendix B).
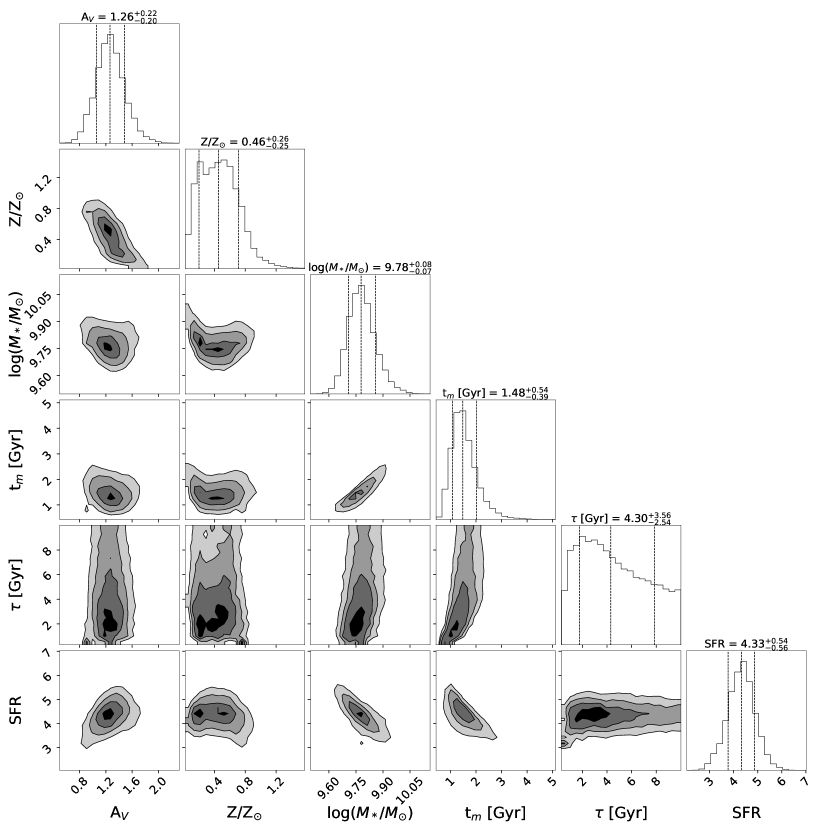
Consistent values of the SFR and the key properties of the host galaxy are derived from optical spectroscopy and the spectral energy distribution (SED) modeling (Appendices E and F). The best fit parameters describing the galaxy are: a high intrinsic extinction mag, symbolic of a dusty galaxy, a sub-solar metallicity , an -folding time Gyr, a moderate stellar mass , an old stellar population Gyr, and a star-formation rate SFR yr-1. The best fit model spectrum is shown in Fig.3. From optical spectroscopy we derive a redshift and an line luminosity, , corresponding to SFR yr-1. As discussed in Appendix E, the luminosity can underestimate the total SFR for observational reasons. Physical reasons can further reduce the SFR compared to the radio-derived SFR. Radio is also sensitive to heavily obscured star-formation and, in addition, it captures longer star-forming ages, up to 100 Myr (Condon, 1992), whereas optical traces recent star formation, up to 10 Myr. The mismatch between optical (low SF) and radio (high SF) may be interpreted as a contribution from heavily obscured SF or as a post starburst episode, that is 100 Myr ago the SFR was as high as 10 M⊙yr-1 but it rapidly declined and within 10 Myr was less than 2 M⊙yr-1. A decrease of the SFR at a recent age is also suggested by a non parametric modelization of the star forming history (Fong et al., 2021), indicating that the SFR was higher in the past galaxy’s history (although at a value not as large as the radio-derived SFR) before decreasing by a factor of two 30 Myr ago. We conclude that the properties of the radio, optical and X-ray emission are consistent with those expected by star formation.
4 The local star forming environment as a clue to the progenitor
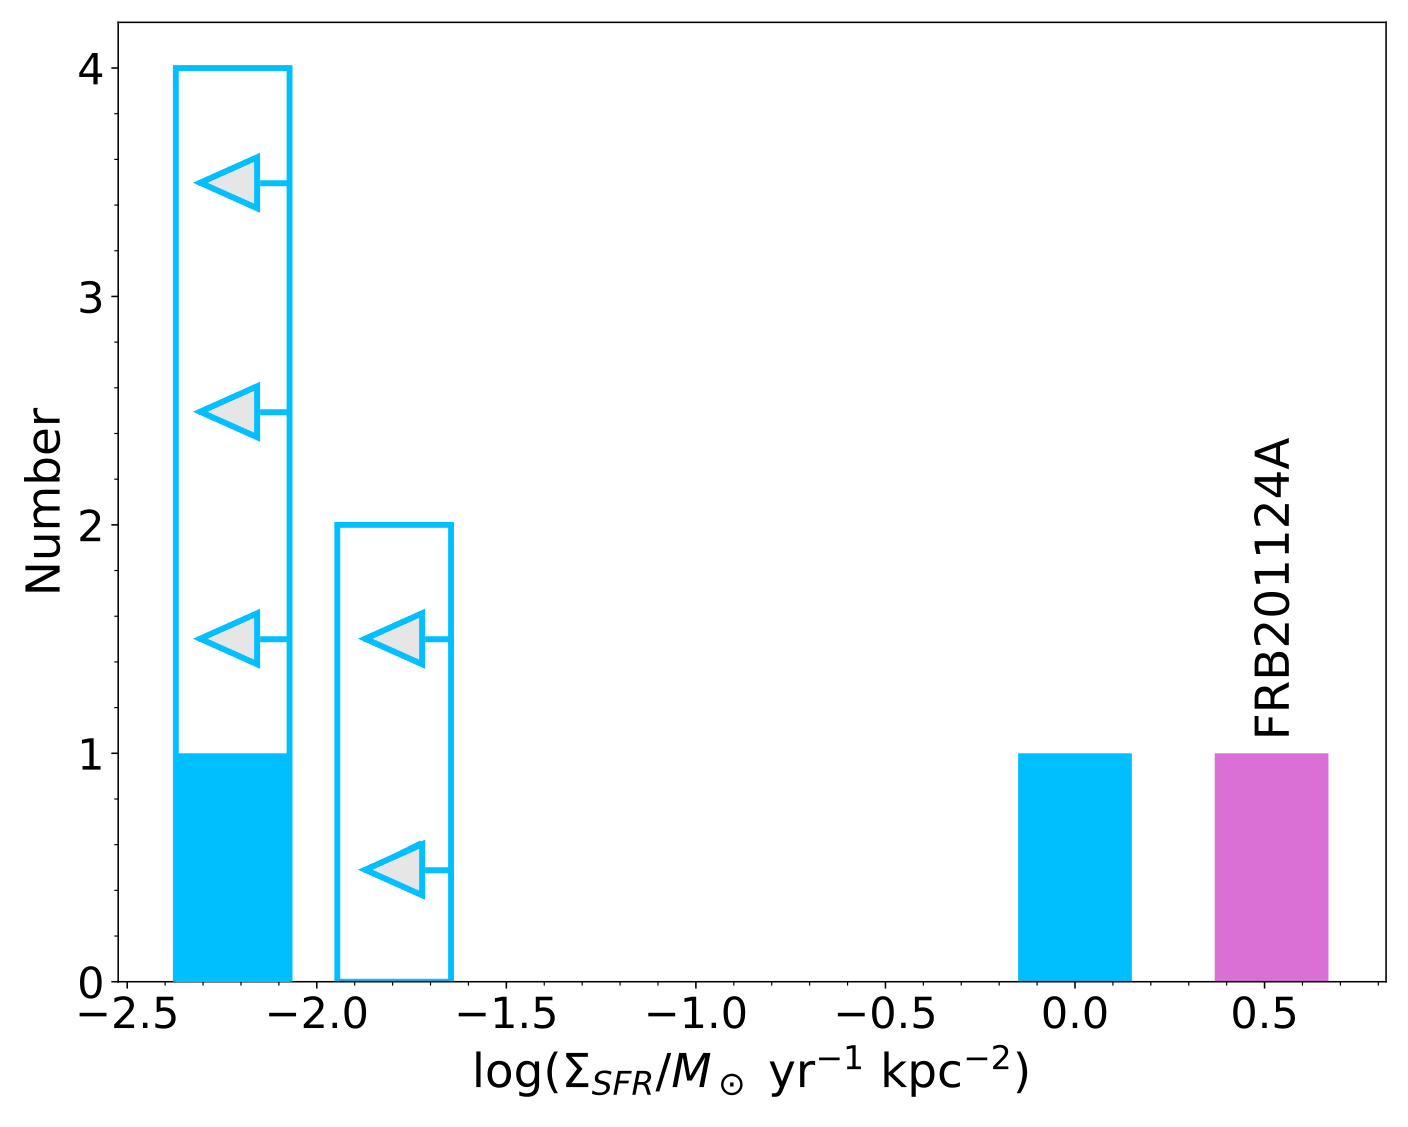
The properties of the local environment and of the host of FRB provide a major clue on their progenitors. Different progenitor channels are expected to yield distinct distributions of location, local environment and host galaxy properties (e.g. Margalit et al., 2019). In this regard, FRB 20201124A exhibits some remarkable features. We find that it is located, with an accuracy of 360 pc, at the center of the most prominent region of star formation in the host galaxy, which is observed in the radio with SFR. This structure, elongated by about 3 kpc and at a distance of kpc from the center of the host galaxy embeds the FRB and might be associated to a spiral arm. The average star formation surface density at the location of the FRB (Fig.4), , is two orders of magnitude larger than observed in all other FRB , with the exception FRB 20121102A that, with SFR and a size of 0.68 kpc (Bassa et al., 2017) has (see also Mannings et al., 2021) comparable to FRB 20201124A. Such large surface star formation rates are similar to those observed in Galactic star forming regions (Evans et al., 2009).
This region exhibits also an elevated local star formation rate in comparison to the mean global value of the host 111Estimated by dividing the total SFR of the galaxy derived from H with the area (at half light radius) of the galaxy, 19 kpc2 (), while in most FRB the local SFR is comparable to the average of the host (Mannings et al., 2021).
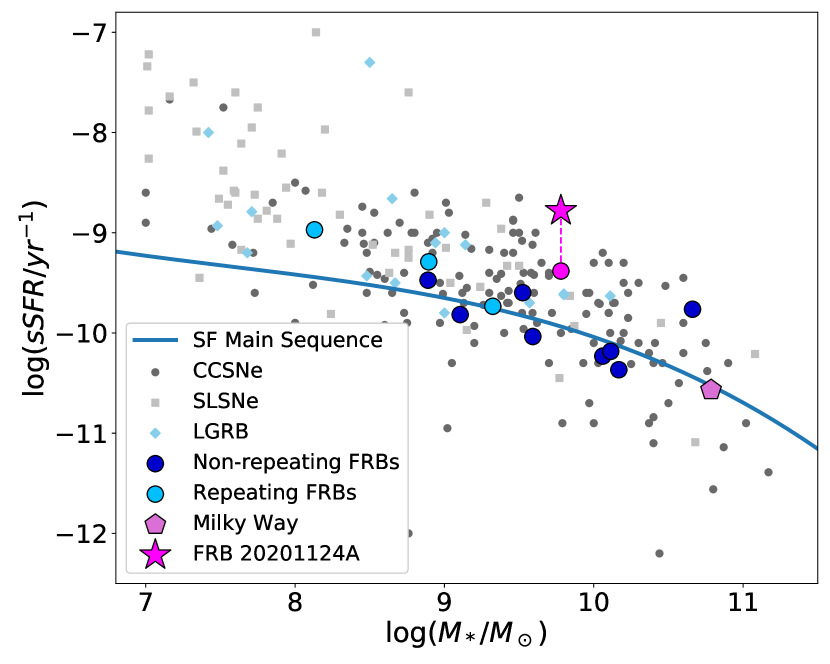
The properties of FRB 20201124A, particularly its location within a region of intense star formation, favour a prompt formation channel, with the magnetar formed from the SNe of a massive star. Systematic studies of host properties (Heintz et al., 2020; Bochenek et al., 2021), including the distribution of stellar masses and star formation rates, find a wide range of host properties. They concluded that, although this variety can underline a diversity of progenitor channels, the observed global properties are consistent with a predominant population of young magnetars from core-collapse SNe. In this context, the global SFR and stellar mass derived for the host of FRB 20201124A (Fig.5) are in agreement with a young magnetar formation from a core collapse SNe.
With regard to the local environment, this progenitor scenario would predict that FRBs should be preferentially located nearby to the brightest star forming regions of their host galaxies, as we observe in the case of FRB 20201124A. In contrast, HST observations of precisely localized FRBs show that while FRB positions are consistent with spiral arms, they are not located on the most active star forming regions (Bhandari et al., 2020; Mannings et al., 2021; Chittidi et al., 2020). On a closer scale it is also expected that the positions would be coincident or at small offset from star forming regions. This is due to the limited age (¡10 kyr) of the active phase of the magnetar and its kick velocity after birth (e.g. Tendulkar et al., 2021). However, two of the known repeaters, FRB 20180916B and FRB 20121102A are found at an offset of pc from the center of the closest star forming knots, a distance too large to be consistent with a young magnetar progenitor (Bassa et al., 2017; Tendulkar et al., 2021). We find that FRB 20201124A is consistent with being at the center of the SFR although, given the error in the position, one cannot exclude an offset of pc. In such a case, an age of 0.5 Myr would be expected for a typical kick velocity of , questioning a young magnetar origin. In conclusion, the properties of the environment of FRB 20201124A, from the host galaxy scale down to the local environment are consistent with those expected from a young magnetar progenitor from a SNe.
Considering the pieces of evidence discussed above, it is difficult to draw any definitive conclusion on FRB progenitors. Different channels for the formation of magnetar progenitors can explain the broad distribution of properties of the host and local environment. In this scenario FRB 20201124A represents the clear example of a young magnetar progenitor from a core collapse SN. The recent association of FRB 20200120E with a globular cluster indicates that at least another formation channel is present, with young magnetars produced from accretion induced collapse of white dwarfs or binary mergers of neutron stars (Kirsten et al., 2021). Nonetheless, the fact that the other well localized FRBs are close to star forming regions, suggests a predominant channel associated with star formation (e.g. Ioka & Zhang, 2020; Tendulkar et al., 2021) but with a broader range of SFR and offsets, in which FRB 20201124A would then represent the extreme in the distribution of local SFR.
5 Limits to X-ray counterparts of FRBs
Notwithstanding the significant progress obtained via the study of the environment, and the increasing number of precise locations that will be available in the future, high resolution imaging of the local environment of FRBs provides only circumstantial evidence on the central source of FRBs. A key step forward may come from the identification of the counterpart of FRBs at other wavelengths.
Although our simultaneous coverage of the Chandra observation with FAST and SRT observations does not find any significant association of bursts from FRB 20201124Awith X-ray photons (Appendix H), it sets upper limits on the X-ray counterparts that can be confronted with a magnetar origin. We place a 5 upper limit erg in the 2-10 keV range on the X-ray energy of a burst at the time of any radio burst and erg at any time during the Chandra observation. We derive a tighter upper limit erg assuming that X-ray bursts of similar fluence are emitted at the time of each radio burst. In Tab.3 we compare the limits with two other repeaters FRB 20121102A (Scholz et al., 2017) and FRB 20180916B (Scholz et al., 2020). The most constraining limit for X-ray bursts in coincidence with FRB is E erg for a single burst in FRB 20180916B and erg in FRB 20201124A, assuming that all FRB have an associated X-ray burst. This corresponds to an upper limit on the ratio of the flare energy in X-rays to radio , and to a radio-to-X-ray spectral index (F().
X-ray bursts of known magnetars have isotropic energies much smaller than erg. The energy of the X-ray burst associated with FRB-like events from the Galactic magnetar SGR 1935+2154 is erg (Li et al., 2021). Even for the most energetic giant flares detected from three known magnetars, the isotropic energies only reached a few times erg (Woods & Thompson, 2006). One may imagine more energetic X-ray flares for cosmological FRBs. If we assume that FRBs all have the X-ray-to-radio energy ratio as observed in FRB-like events from the Galactic magnetar SGR 1935+2154, i.e. (Bochenek et al., 2020), the upper limit derived from our observations is still consistent with such an assumption. We therefore draw the conclusion that the magnetar flaring origin of FRBs for this source cannot be disfavored and is consistent with the available data.
6 Conclusions
In this paper we have presented the results of a campaign involving nine facilities from radio to X-rays, and aimed at constraining the multiwavelength properties of the quiescent and flaring emission of FRB 20201124A, the third closest repeater recently localized.
We find that FRB 20201124A is located at the center of an extended radio source associated to the brightest region of star formation in the host galaxy, corresponding to SFR. This structure is elongated by about 3 kpc and at a distance of kpc from the center of the host galaxy. The star formation surface density at the location of the FRB (Fig.4), , is two orders of magnitude larger than typically observed in FRB (Mannings et al., 2021), but similar to that observed in Galactic star forming regions (Evans et al., 2009). This region exhibits also an elevated local star formation rate in comparison to the mean global value of the host (), while in most FRB the local SFR is comparable to the average of the host. All the properties of the environment of FRB 20201124A, from the host galaxy scale down to the local environment are consistent with a young magnetar progenitor from a core collapse SNe. In contrast, high resolution observations of the local environment of other precisely located FRBs does not support unambiguously this association (Mannings et al., 2021; Tendulkar et al., 2021), suggesting a diversity of progenitors.
A search for X-ray counterparts of FRB detected by FAST and SRT, carried out with Chandra, sets upper limits on the X-ray counterparts that can be confronted with a magnetar origin. The tightest upper limit erg is derived assuming that X-ray bursts of similar fluence are emitted at the time of each radio flare. This corresponds to an upper limit on the ratio of the flare energy in X-rays to radio , consistent with that observed in FRB-like events from the Galactic magnetar SGR 1935+2154 (Bochenek et al., 2020).
Future observations with higher spatial resolution in the optical and radio bands, with adequate sensitivity in radio to low surface brightness, should clarify the morphology of the kpc star forming region observed in radio, its association with host galaxy structures such as spiral arms, and further resolve its fine structure, so to test the young magnetar scenario with a finer measurement of the offset between the FRB and the SFR region.
Acknowledgements.
We acknowledge support from a grant PRIN-INAF SKA-CTA 2016. The National Radio Astronomy Observatory is a facility of the National Science Foundation operated under cooperative agreement by Associated Universities, Inc. We thank the staff of the GMRT that made these observations possible. GMRT is run by the National Centre for Radio Astrophysics of the Tata Institute of Fundamental Research. The European VLBI Network is a joint facility of independent European, African, Asian, and North American radio astronomy institutes. Scientific results from data presented in this publication are derived from the following EVN project code(s): RP032A. e-MERLIN is a National Facility operated by the University of Manchester at Jodrell Bank Observatory on behalf of STFC. We thank the Swift and Chandra staff for the support in carrying out the ToO observations. The Sardinia Radio Telescope (SRT) is funded by the Department of University and Research (MIUR), the Italian Space Agency (ASI), and the Autonomous Region of Sardinia (RAS) and is operated as National Facility by the National Institute for Astrophysics (INAF). We thank an anonymous referee for useful comments.References
- Aggarwal et al. (2020) Aggarwal, K., Agarwal, D., Kania, J. W., et al. 2020, Journal of Open Source Software, 5, 2750
- Barsdell et al. (2012) Barsdell, B. R., Bailes, M., Barnes, D. G., & Fluke, C. J. 2012, MNRAS, 422, 379
- Bassa et al. (2017) Bassa, C. G., Tendulkar, S. P., Adams, E. A. K., et al. 2017, ApJ, 843, L8
- Beloborodov (2017) Beloborodov, A. M. 2017, ApJ, 843, L26
- Bhandari et al. (2020) Bhandari, S., Sadler, E. M., Prochaska, J. X., et al. 2020, ApJ, 895, L37
- Biggs et al. (2010) Biggs, A. D., Younger, J. D., & Ivison, R. J. 2010, MNRAS, 408, 342
- Bochenek et al. (2020) Bochenek, C. D., Ravi, V., Belov, K. V., et al. 2020, Nature, 587, 59
- Bochenek et al. (2021) Bochenek, C. D., Ravi, V., & Dong, D. 2021, ApJ, 907, L31
- Bolli et al. (2015) Bolli, P., Orlati, A., Stringhetti, L., et al. 2015, Journal of Astronomical Instrumentation, 4, 1550008
- Cardelli et al. (1989) Cardelli, J. A., Clayton, G. C., & Mathis, J. S. 1989, ApJ, 345, 245
- Chabrier (2003) Chabrier, G. 2003, PASP, 115, 763
- Chime/Frb Collaboration (2021) Chime/Frb Collaboration. 2021, The Astronomer’s Telegram, 14497, 1
- Chime/Frb Collabortion (2021) Chime/Frb Collabortion. 2021, The Astronomer’s Telegram, 14497, 1
- Chittidi et al. (2020) Chittidi, J. S., Simha, S., Mannings, A., et al. 2020, arXiv e-prints, arXiv:2005.13158
- Condon (1992) Condon, J. J. 1992, ARA&A, 30, 575
- Conroy et al. (2009) Conroy, C., Gunn, J. E., & White, M. 2009, ApJ, 699, 486
- Cordes & Chatterjee (2019) Cordes, J. M. & Chatterjee, S. 2019, ARA&A, 57, 417
- Cutri et al. (2021) Cutri, R. M., Wright, E. L., Conrow, T., et al. 2021, VizieR Online Data Catalog, II/328
- Day et al. (2021a) Day, C. K., Bhandari, S., Deller, A. T., Shannon, R. M., & Moss, V. A. 2021a, The Astronomer’s Telegram, 14515, 1
- Day et al. (2021b) Day, C. K., Bhandari, S., Deller, A. T., Shannon, R. M., & Moss, V. A. 2021b, The Astronomer’s Telegram, 14515, 1
- Dye et al. (2008) Dye, S., Eales, S. A., Aretxaga, I., et al. 2008, MNRAS, 386, 1107
- Evans et al. (2009) Evans, Neal J., I., Dunham, M. M., Jørgensen, J. K., et al. 2009, ApJS, 181, 321
- Ferland et al. (2013) Ferland, G. J., Porter, R. L., van Hoof, P. A. M., et al. 2013, Rev. Mexicana Astron. Astrofis., 49, 137
- Fong et al. (2021) Fong, W.-f., Dong, Y., Leja, J., et al. 2021, ApJ, 919, L23
- Fragos et al. (2013) Fragos, T., Lehmer, B. D., Naoz, S., Zezas, A., & Basu-Zych, A. 2013, ApJ, 776, L31
- Gajjar et al. (2018) Gajjar, V., Siemion, A. P. V., Price, D. C., et al. 2018, ApJ, 863, 2
- Grimm et al. (2003) Grimm, H. J., Gilfanov, M., & Sunyaev, R. 2003, MNRAS, 339, 793
- He et al. (2013) He, C., Ng, C. Y., & Kaspi, V. M. 2013, ApJ, 768, 64
- Heintz et al. (2020) Heintz, K. E., Prochaska, J. X., Simha, S., et al. 2020, ApJ, 903, 152
- Ibar et al. (2009) Ibar, E., Ivison, R. J., Biggs, A. D., et al. 2009, MNRAS, 397, 281
- Ioka & Zhang (2020) Ioka, K. & Zhang, B. 2020, ApJ, 893, L26
- Johnson et al. (2019) Johnson, B. D., Leja, J. L., Conroy, C., & Speagle, J. S. 2019, Prospector: Stellar population inference from spectra and SEDs
- Kale & Ishwara-Chandra (2021) Kale, R. & Ishwara-Chandra, C. H. 2021, Experimental Astronomy, 51, 95
- Katz (2016) Katz, J. I. 2016, ApJ, 826, 226
- Kennicutt (1998) Kennicutt, Robert C., J. 1998, ARA&A, 36, 189
- Kilpatrick et al. (2021) Kilpatrick, C. D., Fong, W., Prochaska, J. X., et al. 2021, The Astronomer’s Telegram, 14516, 1
- Kirsten et al. (2021) Kirsten, F., Marcote, B., Nimmo, K., et al. 2021, arXiv e-prints, arXiv:2105.11445
- Klein et al. (2018) Klein, U., Lisenfeld, U., & Verley, S. 2018, A&A, 611, A55
- Kraft et al. (1991) Kraft, R. P., Burrows, D. N., & Nousek, J. A. 1991, ApJ, 374, 344
- Kumar et al. (2017) Kumar, P., Lu, W., & Bhattacharya, M. 2017, MNRAS, 468, 2726
- Kumar et al. (2021) Kumar, P., Shannon, R. M., Moss, V., Qiu, H., & Bhandari, S. 2021, The Astronomer’s Telegram, 14502, 1
- Law et al. (2021) Law, C., Tendulkar, S., Clarke, T., Aggarwal, K., & Bethapudy, S. 2021, The Astronomer’s Telegram, 14526, 1
- Lehmer et al. (2016) Lehmer, B. D., Basu-Zych, A. R., Mineo, S., et al. 2016, ApJ, 825, 7
- Leja et al. (2017) Leja, J., Johnson, B. D., Conroy, C., van Dokkum, P. G., & Byler, N. 2017, ApJ, 837, 170
- Li et al. (2021) Li, C. K., Lin, L., Xiong, S. L., et al. 2021, Nature Astronomy, 5, 378
- Licquia & Newman (2015) Licquia, T. C. & Newman, J. A. 2015, ApJ, 806, 96
- Lorimer et al. (2007) Lorimer, D. R., Bailes, M., McLaughlin, M. A., Narkevic, D. J., & Crawford, F. 2007, Science, 318, 777
- Lorimer & Kramer (2004) Lorimer, D. R. & Kramer, M. 2004, Handbook of Pulsar Astronomy (Cambridge, UK: Cambridge University Press)
- Lyubarsky (2021) Lyubarsky, Y. 2021, Universe, 7, 56
- Mannings et al. (2021) Mannings, A. G., Fong, W.-f., Simha, S., et al. 2021, ApJ, 917, 75
- Marcote et al. (2021) Marcote, B., Kirsten, F., Hessels, J. W. T., et al. 2021, The Astronomer’s Telegram, 14603, 1
- Margalit et al. (2019) Margalit, B., Berger, E., & Metzger, B. D. 2019, ApJ, 886, 110
- McMullin et al. (2007) McMullin, J. P., Waters, B., Schiebel, D., Young, W., & Golap, K. 2007, in Astronomical Society of the Pacific Conference Series, Vol. 376, Astronomical Data Analysis Software and Systems XVI, ed. R. A. Shaw, F. Hill, & D. J. Bell, 127
- Mendel et al. (2014) Mendel, J. T., Simard, L., Palmer, M., Ellison, S. L., & Patton, D. R. 2014, ApJS, 210, 3
- Mereghetti et al. (2020) Mereghetti, S., Savchenko, V., Ferrigno, C., et al. 2020, ApJ, 898, L29
- Metzger et al. (2017) Metzger, B. D., Berger, E., & Margalit, B. 2017, ApJ, 841, 14
- Murphy et al. (2011) Murphy, E. J., Condon, J. J., Schinnerer, E., et al. 2011, ApJ, 737, 67
- O’Connor et al. (2021) O’Connor, B., Troja, E., Dichiara, S., et al. 2021, MNRAS, 502, 1279
- Panessa & Giroletti (2013) Panessa, F. & Giroletti, M. 2013, MNRAS, 432, 1138
- Parma et al. (1999) Parma, P., Murgia, M., Morganti, R., et al. 1999, A&A, 344, 7
- Petroff et al. (2019) Petroff, E., Hessels, J. W. T., & Lorimer, D. R. 2019, A&A Rev., 27, 4
- Popov & Postnov (2010) Popov, S. B. & Postnov, K. A. 2010, in Evolution of Cosmic Objects through their Physical Activity, ed. H. A. Harutyunian, A. M. Mickaelian, & Y. Terzian, 129–132
- Prandoni et al. (2017) Prandoni, I., Murgia, M., Tarchi, A., et al. 2017, A&A, 608, A40
- Prescott et al. (2007) Prescott, M. K. M., Kennicutt, Robert C., J., Bendo, G. J., et al. 2007, ApJ, 668, 182
- Rajwade et al. (2020) Rajwade, K., Stappers, B., Williams, C., et al. 2020, in Ground-based and Airborne Instrumentation for Astronomy VIII, ed. C. J. Evans, J. J. Bryant, & K. Motohara, Vol. 11447, International Society for Optics and Photonics (SPIE), 78 – 85
- Ranalli et al. (2003) Ranalli, P., Comastri, A., & Setti, G. 2003, A&A, 399, 39
- Ransom (2001) Ransom, S. M. 2001, PhD thesis, Harvard University
- Ravi et al. (2021) Ravi, V., Law, C. J., Li, D., et al. 2021, arXiv e-prints, arXiv:2106.09710
- Ricci et al. (2021) Ricci, R., Piro, L., Panessa, F., et al. 2021, The Astronomer’s Telegram, 14549, 1
- Saintonge et al. (2016) Saintonge, A., Catinella, B., Cortese, L., et al. 2016, MNRAS, 462, 1749
- Schlafly & Finkbeiner (2011) Schlafly, E. F. & Finkbeiner, D. P. 2011, ApJ, 737, 103
- Schober et al. (2017) Schober, J., Schleicher, D. R. G., & Klessen, R. S. 2017, MNRAS, 468, 946
- Scholz et al. (2017) Scholz, P., Bogdanov, S., Hessels, J. W. T., et al. 2017, ApJ, 846, 80
- Scholz & Chime/Frb Collaboration (2020) Scholz, P. & Chime/Frb Collaboration. 2020, The Astronomer’s Telegram, 13681, 1
- Scholz et al. (2020) Scholz, P., Cook, A., Cruces, M., et al. 2020, ApJ, 901, 165
- Shepherd (1997) Shepherd, M. C. 1997, in Astronomical Society of the Pacific Conference Series, Vol. 125, Astronomical Data Analysis Software and Systems VI, ed. G. Hunt & H. Payne, 77
- Skrutskie et al. (2006) Skrutskie, M. F., Cutri, R. M., Stiening, R., et al. 2006, AJ, 131, 1163
- Tabatabaei et al. (2017) Tabatabaei, F. S., Schinnerer, E., Krause, M., et al. 2017, ApJ, 836, 185
- Taggart & Perley (2021) Taggart, K. & Perley, D. A. 2021, MNRAS, 503, 3931
- Tendulkar et al. (2021) Tendulkar, S. P., Gil de Paz, A., Kirichenko, A. Y., et al. 2021, ApJ, 908, L12
- The CHIME/FRB Collaboration et al. (2021) The CHIME/FRB Collaboration, :, Amiri, M., et al. 2021, arXiv e-prints, arXiv:2106.04352
- van Dokkum (2001) van Dokkum, P. G. 2001, PASP, 113, 1420
- Wadiasingh & Timokhin (2019) Wadiasingh, Z. & Timokhin, A. 2019, The Astrophysical Journal, 879, 4
- Wharton et al. (2021a) Wharton, R., Bethapudi, S., Gautam, T., et al. 2021a, The Astronomer’s Telegram, 14529, 1
- Wharton et al. (2021b) Wharton, R., Bethapudi, S., Marthi, V., et al. 2021b, The Astronomer’s Telegram, 14538, 1
- Willingale et al. (2013) Willingale, R., Starling, R. L. C., Beardmore, A. P., Tanvir, N. R., & O’Brien, P. T. 2013, MNRAS, 431, 394
- Woods & Thompson (2006) Woods, P. M. & Thompson, C. 2006, Soft gamma repeaters and anomalous X-ray pulsars: magnetar candidates, Vol. 39, 547–586
- Yang et al. (2020) Yang, G., Boquien, M., Buat, V., et al. 2020, MNRAS, 491, 740
- Yang & Zhang (2021) Yang, Y.-P. & Zhang, B. 2021, ApJ, 919, 89
- Zhang (2020) Zhang, B. 2020, Nature, 587, 45
Appendix A VLA discovery of a quiescent radio source
We pointed the FRB position from Day et al. (2021b) with the VLA on April 9, May 11, and June 22, 2021 (project code SG9112). The first two runs were performed in D-configuration, while the latter in C. The observing bands were S (2-4 GHz) and X (8-12 GHz) for the first epoch, S, C (4-8 GHz), and X for the second one, and L (1-2 GHz), X, and K (18-26 GHz) for the third one (see Tab. 1 for a summary). The calibrator 3C 147 was used both for amplitude scale and bandpass corrections, while the phase calibrator paired to the target was J0534+1927 for the first two epochs ( apart), and J0431+2037 for the third one ( apart), due to the configuration change. Data were reduced with the Common Astronomy Software Applications package (CASA; McMullin et al. 2007). We processed the raw data with pipeline version 5.6.2. The calibrated visibilities were then imaged with the task TCLEAN, applying natural weighting to optimize sensitivity.
A constant radio source was detected in the different epochs, offset by 3.3 arcsec with respect to the Day et al. (2021b) localization, but consistent with later ones (Ricci et al. 2021). The flux density was consistent within errors in the different epochs, at the common frequencies of 3, 9, and 11 GHz (see Tab. 1). The estimated radio luminosity is . The morphology is unresolved at angular resolutions larger than 1″, while the 22 GHz observations in C-configuration from the latest epoch revealed an elongated emission region, with an extension of 2″. A Gaussian fit with a single component results in a deconvolved size of 2.20.60.50.3″, with a position angle of 1408∘, confirming the resolved morphology. The component is centered at RA 05:08:03.500.01s, Dec +26:03:38.360.18″, consistent with the position of the FRB. The astrometric accuracy was estimated by adopting a conservative VLA positional uncertainty of 10% of the FWHM222https://science.nrao.edu/facilities/vla/docs/manuals/oss/performance/positional-accuracy (0.11″), and summing that in quadrature with the peak location error from the Gaussian fit. We obtained a total uncertainty for the Gaussian centroid location of 0.21″.
| Telescope | Date | Frequency | Bandwidth | Time on source | Flux density | FWHM |
| (dd/mm/yyyy) | (GHz) | (GHz) | (min) | (Jy) | (″) | |
| uGMRT | 24/07/2021 | 0.19 | 0.125 | 45 | 3600 | 21.610.4 |
| uGMRT | 21/07/2021 | 0.38 | 0.24 | 98 | 1700200 | 7.04.9 |
| VLA-D | 09/04/2021 | 3 | 2 | 28 | 34030 | 18.016.1 |
| 9 | 2 | 33 | 15010 | 7.46.7 | ||
| VLA-D | 11/05/2021 | 3 | 2 | 38 | 33518 | 31.716.9 |
| 5 | 2 | 11 | 25910 | 20.211.4 | ||
| 7 | 2 | 11 | 16511 | 18.58.2 | ||
| 9 | 2 | 22 | 1597 | 10.46.8 | ||
| 11 | 2 | 22 | 12610 | 8.45.4 | ||
| VLA-C | 22/06/2021 | 1.5 | 1 | 14 | 70676 | 12.812.1 |
| 9 | 2 | 10 | 14212 | 2.62.6 | ||
| 11 | 2 | 10 | 10414 | 2.32.1 | ||
| 22 | 8 | 26 | 788 | 1.11.0 | ||
| e-MERLIN | 11/07/2021 | 5 | 0.5 | 500 | 85 | 0.0850.045 |
| EVN | 12/05/2021 | 5 | 0.1-0.5 | 245 | 54 | 0.00350.0017 |
Appendix B X-ray imaging with Swift and Chandra
We carried out observations (PI: Piro) with Swift/XRT in PC mode starting at 2021-04-06 19:47:02 UT and ending at 2021-04-07 14:53:17 UT for a total of 9.9 ks exposure under ObsIDs 00014258001 and 00014258002. The data were processed using the xrtpipeline task, and the individual ObsIDs were stacked using XSELECT. Results are presented in §2.3.
Chandra X-ray Observatory (CXO) observations (ObsID: 25016; PI: Piro), carried out under Director’s Discretionary Time (DDT), occurred on April 20, 2021 for a total of 29.7 ks. Data were processed using the Chandra Interactive Analysis of Observations (CIAO v. 4.13; Fruscione et al. 2006) software and the latest calibration database (CALDB v. 4.9.4). Our analysis was performed in the keV energy range. The native astrometry of the image was corrected by aligning 2 common point sources in the Sloan Digital Sky Survey (SDSS) Catalog. We restricted these sources to those within arcmin of the Chandra/ACIS-S3 detector’s optical axis. This resulted in an astrometric shift by ″, with tie uncertainty ″. Further analysis of the astrometric uncertainty using a total of 4 common point sources with SDSS, including those at arcmin from the optical axis of ACIS-S3, yielded a consistent astrometric solution and did not change the result.
A weak X-ray detection at the position of the EVN VLBI (Marcote et al. 2021) with a 0.5-7.0 keV count-rate of 1.0 10-4 cts s-1 corresponds to a luminosity of erg s-1, assuming that absorption is limited to our Galaxy (§2.3). If we also take into account the large DM= associated to the FRB (Appendix H), the intrinsic absorption component could be as high as cm-2 (He et al. 2013). This would imply an unabsorbed flux erg cm-2 s-1 (2-10 keV) and a luminosity .
These values fit well within the correlation between FIR and X-ray luminosities in star-forming galaxies (Ranalli et al. 2003), and imply a recent star formation rate SFR = 10 yr-1 (Lehmer et al. 2016). Whereas radio and FIR indicators probe the SFR over 100 Myr timescales, studies of local star-forming galaxies show that the dominant component of the X-ray emission are high-mass X-ray binaries (HMXBs) associated with a young (30 Myr) stellar population (Grimm et al. 2003).
Appendix C Follow-up of the persistent radio source with EVN, e-MERLIN, and uGMRT
Following the detection of a persistent radio source with the VLA, we triggered a Very Long Baseline Interferometry (VLBI) campaign involving the European VLBI Network (EVN) and the enhanced Multi Element Remotely Linked Interferometer Network (e-MERLIN). EVN observations were performed on May 12th, 2021, in e-VLBI mode with the standard setup at 5 GHz (project code RP032A, PI: Panessa). The array was composed by 9 EVN antennas (IR, BD, SV, HH, SH, O8, EF, WB, JB) plus 6 from e-MERLIN (JL, PI, KN, DE, DA, CM). The data rate was 2 Gbps for all antennas except for SV and BD (1 Gbps), and the e-Merlin array (512 Mbps). This reflected into different bandwidths, from 0.1 to 0.5 GHz. Sources J0237+2848 and J0555+3948 were used as fringe finders at the beginning/end of the experiment, while J0502+2516 for target phase-referencing (1.4∘ apart). A total on-source time of 4 hours was reached. Data were reduced with the Astronomical Image Processing System (AIPS) software, following standard calibration procedures for continuum data. Visibilities were then imaged using the DIFMAP software (Shepherd 1997), applying natural weighting. The obtained angular resolution was 3.51.7 mas, with a position angle of 7.15∘. The RMS was 9 Jy/beam.
We did not detect any compact source above a confidence level of 6 sigma, resulting in an upper limit of 54 uJy/beam. This result confirms with deeper observations the previous one from the PRECISE project (Marcote et al. 2021), also obtained with the EVN but at 1.4 GHz. Those authors concluded that the nature of the emission detected with the VLA must be of extended nature, not being visible at VLBI resolution. From non-detections on the shortest baseline of the array (Effelsberg-Westerbork; 270 km) they could estimate an angular size 140 mas for the extended emission, corresponding to a projected linear size 260 pc. In our observation, the sub-array composed by e-MERLIN antennas plus JB - i.e. the array baselines more sensitive to extended emission - gave an angular resolution of 6036 mas, and an RMS of 43 Jy/beam (applying natural weighting). Considering a threshold of 6 sigma, the e-MERLIN non-detection implies a surface brightness 0.045 Jy/kpc2.
Given the results of the EVN run, we performed deeper observations with e-MERLIN at 5 GHz on July 11, 2021 (DDT project DD11007, PI: Bruni), with the aim of recovering the SFR emission at an intermediate scale between our previous VLA and EVN observations. The run originally included also 1.5 GHz, the frequency band where most of the flux density was expected, however the sensitivity was hampered by the lack of suitable, unresolved, phase calibrators near to target. At 5 GHz, we observed with the full 512 MHz bandwidth, for a total of 11 hours on target, reaching an RMS of 17 Jy/beam. The phase calibrator was J0506+2141, with an angular separation of 4.4∘. The angular resolution, applying natural weighting, was 8545 mas. Also at this sensitivity, no emission was detected at a significance level larger than 5 sigma (see Fig. 1), implying a surface brightness 0.008 Jy/kpc2.
To further complete the frequency coverage on the persistent radio source, we requested DDT observations with the upgraded Giant Metrewave Radio Telescope (uGMRT). Observations were carried out on July 21 and 24, 2021 (project code ddtC194, PI: Bruni), using the band-3 (260-500 MHz) and band-2 (125-250 MHz) receivers, respectively. The amplitude scale and bandpass calibrations were performed on 3C 147, while the adopted phase calibrator was J0534+1927. Data were reduced with the CAPTURE pipeline (Kale & Ishwara-Chandra 2021). In band-3, the final image RMS was 50 Jy/beam, and the angular resolution 7.0″4.9″. We detected the source as an unresolved component with a flux density of 1.70.2 mJy. Band-2 was hampered by radio frequency interferences, with more than 50% of data flagged on each antenna. The final image showed no detection at an RMS level of 1.2 mJy/beam, resulting in a 3 upper limit of 3.6 mJy. The angular resolution was 21.6″10.4″.
Appendix D The radio spectrum from star formation in the host galaxy
Star-forming galaxies emit both thermal (free-free) and non-thermal (synchrotron) radiation in the radio regime. The synchrotron component, resulting from SNR, dominates at frequencies up to about 20 GHz, while free-free emission becomes significant at higher frequencies (Klein et al. 2018). At low frequencies, typically well below 1 GHz, free-free absorption takes place (Schober et al. 2017). The resulting spectrum is thus described as
| (1) |
with
| (2) |
The first term in the equation is the synchrotron component, modelled with a power law with a slope of . The second, flatter component, in the optically thin regime, is due to free-free emission. In fig.3 we present the best fit model on our VLA and GMRT data (Tab.1). The radio spectrum is dominated by the synchrotron component with , no evidence of absorption and an upper limit (3) of of the thermal fraction at 1.4 GHz. Those values are consistent with the range observed in radio spectra of star forming galaxies (Tabatabaei et al. 2017).
Appendix E Optical spectroscopy
We obtained optical spectroscopy of the putative host galaxy of FRB 20201124A on 2021-04-21 starting at 03:18:35.51 with the DeVeny spectrograph mounted on the 4.3-m LDT for a total exposure of 4600 s. DeVeny was configured with the 300 g mm-1 grating and a 1.5″slit width. The slit was aligned at position angle East of North and covers the location of the FRB determined by the EVN VLBI localization. However we note that the width of the slit does not cover completely either the full extension of persistent radio source or the host galaxy. We reduced the data using standard procedures in the IRAF package to perform bias subtraction, flat field correction, and cosmic ray removal with L.A.Cosmic (van Dokkum 2001).
The spectrum was calibrated using the spectrophotometric standard star Feige 34. The resulting spectrum is displayed in Figure 6. We detect emission features at , , , and associated to H, the [NII] doublet, and the [SII] doublet. Given the sensitivity of these observations, our non-detection of H or Oxygen lines is consistent with the fluxes reported by Fong et al. (2021). Using the observed lines, we derive a redshift . Line properties were derived by fitting the lines with Gaussian functions using the specutils package in Python. The emission line fluxes were corrected for Galactic extinction mag (Schlafly & Finkbeiner 2011) assuming a Cardelli et al. (1989) extinction law. The line properties are reported in Table 2.
From the H emission line, we derived an SFR yr-1 (Kennicutt 1998), assuming a Chabrier initial mass function (IMF, Chabrier 2003). From the analysis of the host galaxy’s spectral energy distribution (SED; Appendix F) we inferred a global value of mag for the intrinsic extinction. By applying this correction to our spectrum, the optically-derived SFR is SFR yr-1.
| Line | Flux | |
|---|---|---|
| [] | [ erg cm-2 s-1] | |
| H | 5345.1 | |
| H | 7206.8 | |
| NIIλ6585 | 7229.6 | |
| SIIλ6718 | 7373.5 | |
| SIIλ6732 | 7391.3 |
Appendix F Galaxy SED analysis
We modeled the spectral energy distribution (SED) of the host galaxy using prospector (Johnson et al. 2019) and the methodology outlined in O’Connor et al. (2021). We made use of archival photometry from SDSS, the Two Micron All Sky Survey (2MASS; Skrutskie et al. 2006), and the Wide-field Infrared Survey Explorer (WISE; Cutri et al. 2021). This photometry covers optical and near-infrared wavelengths in addition to two WISE infrared bands ( and ). We exclude the WISE and photometry due to the uncertainty surrounding thermal dust emission models (see, e.g., Leja et al. 2017). From the archival SDSS/-band image, we derive a upper limit mag on an underlying source. This is consistent with the deeper limit from Swift/UVOT ( mag), which we include in our modeling. We also include the measured H emission line flux as pseudo narrow-band photometry in order to better constrain the SFR. The photometry was corrected for Galactic extinction in the direction of the FRB, mag (Schlafly & Finkbeiner 2011), prior to modeling with prospector. We adopt a Chabrier (2003) IMF with integration limits of 0.08 and 120 (imf_type = 1), an intrinsic dust attenuation using the extinction law of Cardelli et al. (1989) and accounting for both additional dust in nebular regions (dust1) and diffuse dust throughout the galaxy (dust1), and a delayed- (sfh=4) star-formation history characterized by an e-folding timescale, . We account for the contribution of nebular emission using the photoionization code Cloudy (Ferland et al. 2013). The synthetic spectral energy distributions (SEDs) corresponding to these models were computed with the flexible stellar population synthesis (FSPS) code (Conroy et al. 2009). The free parameters in these models are the total stellar mass formed , the age of the galaxy, the e-folding timescale , the intrinsic reddening , and the metallicity . We adopt uniform priors in log , log , log , as in Mendel et al. (2014, cf. their Table 2). From these parameters, we derive the stellar mass, , the mass-weighted stellar age, , and the star-formation rate, SFR.
The best fit model spectrum is shown in Figure 3, the corner plot in Figure 7 and the best fit parameters reported in Sect.3. We note that the mass-weighted stellar age and stellar mass are slightly smaller compared to those presented by Ravi et al. (2021) and Fong et al. (2021). We find that this is likely due to different model assumptions within prospector. We compare the stellar mass and star formation rate to the host galaxies of CCSNe, LGRBs, and other FRBs in Fig. 5.
The X-ray luminosity expected from such a galaxy is derived as follows. There are three main components of galaxy X-ray emission: low-mass X-ray binaries (LMXB), high-mass X-ray binaries (HMXB), and hot gas. The strengths of these components can be modeled as a function of galaxy properties such as and SFR. We adopt the recipe from Fragos et al. (2013) and Yang et al. (2020):
| (3) |
| (4) |
| (5) |
where luminosities are in erg s-1. The functions and are given in Fragos et al. (2013). Substituting the best fit values one obtains erg s-1, consistent with the observed X-ray luminosity. This emission is dominated (80%) by the HMXB component associated with young stellar populations.
Appendix G Origin of the persistent emission from radio to X-rays
Our EVN observation demonstrated that the emission is extended and that the bulk of the radio emission must arise on scales larger than about 200 pc. We argue that this emission is produced by star formation in the host galaxy. First, the radio luminosity in galaxies is correlated with SFR (Murphy et al. 2011) as SFR= that, in the case of FRB 20201124A gives SFR. This is consistent with the value derived from X-rays, and also in agreement with the smaller values derived from from optical/IR (2-4 ), considering that the radio may include additional emission from heavily obscured star formation (Prescott et al. 2007; Dye et al. 2008) or from enhanced star formation that may have occurred over the longer time scale ( Myr) probed by radio observations (Condon 1992). Furthermore, the radio spectrum in the 0.4-10 GHz range has a slope of , that is consistent with the average of observed in star forming galaxies (Ibar et al. 2009).
Alternative scenario involving a low-surface-brightness AGN-driven radio emission, e.g. jets, are unlikely (Biggs et al. 2010). A low-luminosity radio quiet AGN, like low-ionization nuclear emission-line regions and Seyfert galaxies would be characterized by a more compact morphology (e.g., Panessa & Giroletti 2013). A small fraction of radio active nuclei are in the so-called dying or remnant phase. The active phase of a radio AGN can last several tens of Myr, after which the nuclear activity stops and the source starts to fade away (e.g., Parma et al. 1999). The core and the jets disappear and only the lobes remain visible, radiating their energy away. Such a scenario can account for the non-detection of the compact core component. However, the observed properties of the extended radio source in FRB 20201124A are markedly different from those observed in the remnant phase of radio galaxies. First, the radio spectrum of the remnant of Radio Loud (RL) AGN is much brighter at lower frequency, with a very steep spectrum ( above a few hundred MHz), due to the exponential cut-off from rapidly cooling electrons. Furthermore, the physical size of the region and the total radio power associated with remnants are respectively about two and three orders of magnitude larger than observed in our case, excluding this scenario.
Appendix H Chandra limits on X-ray counterparts of FRB detected by FAST and SRT
We have organized a simultaneous coverage of the Chandra observation with FAST and SRT observations aimed at searching for X-ray counterparts of FRB. Chandra observation took place on April 20, from 5:28 to 13:50 UT and lasted for 8.3 hrs.
SRT (Bolli et al. 2015; Prandoni et al. 2017) observed FRB 20201124A on 20 April 2021 for 3 hours starting at 10:30 UT. Observations were performed both at 1.5 GHz and 330 MHz. Data at 1.5 GHz were recorded with the ATNF digital backend PDFB3333http://www.srt.inaf.it/media/uploads/astronomers/dfb.pdf in search mode over an effective bandwidth of 420 MHz split into 1 MHz channels. Total intensity data were 2-bit sampled every 100 s. Data at 330 MHz were recorded with the ROACH1 digital backend in baseband mode over a bandwidth of 64 MHz which was subsequently split into 0.25 MHz channels. The raw data were coherently dedispersed (removing the intrachannel smearing only) at the DM of the FRB (DM = 413 pc cm-3, as quoted by, i.e., Chime/Frb Collaboration 2021) and the resulting total intensity data were 8-bit sampled every 128 s. A search for single pulses was performed on the data using the spandak pipeline444https://github.com/gajjarv/PulsarSearch (Gajjar et al. 2018). The pipeline uses rfifind from the presto package555https://github.com/scottransom/presto (Ransom 2001) for high-level radio frequency interference (RFI) excision. It then performs a first search for bursts through Heimdall (Barsdell et al. 2012). A DM range from 0 to 1000 pc cm-3 was searched for at 1.5 GHz using a maximum window size for matched-filtering of 130 ms. In the case of the coherently dedispersed 330 MHz data, a finer search was performed in the DM range 400–450 pc cm-3, with a maximum window size of 260 ms. The pipeline finally performs sifting of the dedispersed data and produces plots for the surviving candidates. Each candidate found by Heimdall at DMs within the range 400–450 pc cm-3 was visually examined. In order to validate genuine candidates, we ran an ad-hoc program with more sensitive RFI excision procedures optimized for SRT data. This program searches for the most corrupted frequency channels in the DM zero data using the spectral kurtosis algorithm, with thresholding, as provided by the software package your 666https://github.com/thepetabyteproject/your/ (Aggarwal et al. 2020). It then applies baseline subtraction and normalizes the data for the average bandpass. A check for possible corrupted temporal bins due to the presence of impulsive RFI is then performed with inter-quantile range mitigation, similarly to Rajwade et al. (2020). Finally, it dedisperses the data to the derived DM and smooths them via a 2D Gaussian filter. A single candidate not resembling RFI was found in the data at 1.5 GHz at barycentric time 10:44:13.815 TDB (reported at infinite frequency) at a DM compatible with that of FRB 20201124A: DM = 421 4 pc cm-3. The burst had a signal-to-noise ratio and a width ms, resulting in a fluence Jy ms. Since the data are uncalibrated, the estimated fluence of the burst was calculated using the modified radiometer equation (see e.g. Lorimer & Kramer 2004) adopting an antenna gain of 0.55 K/Jy, a system temperature of 30 K. No burst was observed in the data at 330 MHz either simultaneously with the burst at 1.5 GHz (with the time series both shifted to infinite frequency in order to remove the delay introduced by DM at the two different frequencies), or at any other time during the observing session, down to a limiting fluence of 7 Jy ms.
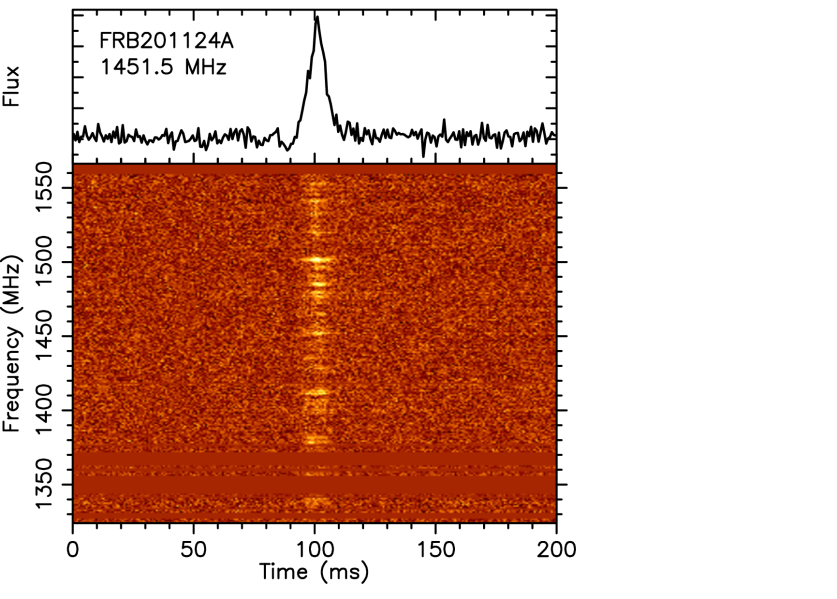
FAST carried out a 55-day observational campaign starting from April 1st 2021, soon after the CHIME alert (Chime/Frb Collabortion 2021). More than 1600 FRB bursts were detected in 1.0-1.5 GHz frequency band. The details of FAST observations will be reported in a separate paper (H. Xu et al. 2021, in preparation). During the Chandra observation FAST observed for 2 hours (8:00-10:00 UT) detecting 48 bursts with fluences in the range 0.017-5.5 Jy ms (median=0.22 Jy ms; average= 0.65 Jy ms) and duration from 4 ms to 49 ms (median=14 ms; average=19 ms).
We have searched for coincidences with the 3 X-ray photons detected by Chandra. The X-ray photon arrival times were barycenter corrected using the barycorr task within HEASoft v. 6.27.2. The closest FRB-X-ray photon time difference is 314 s. Considering the number of burst and the count rate the probability of a random association is close to 100%, thus we can exclude a significant coincidence with a FRB. We derive a 5 upper limit on the X-ray fluence of the FRB as follows (Scholz et al. 2017). For an X-ray burst arriving at the time of a FRB we obtain an upper limit of 14 counts (at 5 sigma (Kraft et al. 1991) that corresponds to an upper limit of on the fluence, and of E= erg on the X-ray burst energy, assuming the X-ray spectrum described in Appendix B. As the Chandra background is negligible, this limit is independent of the duration of the FRB up to the difference in arrival time of the closest Chandra photon (Scholz et al. 2017). In order to derive the upper limit for an X-ray burst occurring at a later time than 314 s after an FRB, we consider the number of trials and derive the single-trial confidence level that is used to compute the upper limit following the prescription of Kraft et al. (1991). The number of trials is equal to the duration of the observation divided by the flare duration. Assuming a typical duration of 19 msec, comparable to the radio burst, and considering the negligible background, we derive an upper limit of 29 counts, corresponding to a fluence and energy E erg). Under the assumption that X-ray bursts are emitted for each of the 49 radio bursts, we can stack individual limits to derive an upper limit of 0.3 cts. The corresponding upper limits on the fluence and energy of the putative X-ray bursts are thus and erg. This corresponds to an upper limit on the ratio of the flare energy in X-rays to radio , and to a radio-to-X-ray spectral index (F().
In Tab.3 we compare the limits derived on the X-ray burst associated to FRBs with two repeating FRBs (FRB 20121102A; Scholz et al. 2017, and, FRB 20180916B; Scholz et al. 2020). Overall, the most constraining observations for X-ray bursts in coincidence with FRB is E erg for a single burst in FRB 20180916B and E erg in FRB 20201124A, assuming that all FRB have an associated XRB.