The SUrvey for Pulsars and Extragalactic Radio Bursts II: New FRB discoveries and their follow-up
Abstract
We report the discovery of four Fast Radio Bursts (FRBs) in the ongoing SUrvey for Pulsars and Extragalactic Radio Bursts (SUPERB) at the Parkes Radio Telescope: FRBs 150610, 151206, 151230 and 160102. Our real-time discoveries have enabled us to conduct extensive, rapid multi-messenger follow-up at 12 major facilities sensitive to radio, optical, X-ray, gamma-ray photons and neutrinos on time scales ranging from an hour to a few months post-burst. No counterparts to the FRBs were found and we provide upper limits on afterglow luminosities. None of the FRBs were seen to repeat. Formal fits to all FRBs show hints of scattering while their intrinsic widths are unresolved in time. FRB 151206 is at low Galactic latitude, FRB 151230 shows a sharp spectral cutoff, and FRB 160102 has the highest dispersion measure (DM = pc cm-3) detected to date. Three of the FRBs have high dispersion measures (DM ¿ pc cm-3), favouring a scenario where the DM is dominated by contributions from the Intergalactic Medium. The slope of the Parkes FRB source counts distribution with fluences Jy ms is and still consistent with a Euclidean distribution (). We also find that the all-sky rate is FRBs/( sr)/day above and there is currently no strong evidence for a latitude-dependent FRB sky-rate.
keywords:
surveys radiation mechanisms: general intergalactic medium radio continuum: general methods: observational methods: data analysis1 Introduction
High-time resolution studies of the radio Universe have led to the discovery of Fast Radio Bursts (FRBs). First seen in 2007 in archival Parkes radio telescope data (Lorimer et al., 2007), FRBs have dispersion measures (DMs) which can exceed the Milky Way contribution by more than an order of magnitude (Petroff et al., 2016) and typically have durations of a few milliseconds. In the past couple of years the discovery rate has accelerated — including those reported here, there are now 31 FRBs known — which include discoveries from the Green Bank Telescope (GBT), the Parkes radio telescope, the Arecibo Observatory, the upgraded Molonglo synthesis telescope (UTMOST) and the Australian SKA Pathfinder (ASKAP) (Lorimer et al., 2007; Keane et al., 2012; Thornton et al., 2013; Burke-Spolaor & Bannister, 2014; Spitler et al., 2014; Petroff et al., 2015a; Ravi et al., 2015; Champion et al., 2016; Masui et al., 2015; Keane et al., 2016; Ravi et al., 2016; Petroff et al., 2017; Caleb et al., 2017; Bannister et al., 2017).
The origin of these bursts is currently unknown, with leading theories suggesting giant flares from magnetars (Thornton et al., 2013; Pen & Connor, 2015), compact objects located in young expanding supernovae (Connor et al., 2016; Piro, 2016) and supergiant pulses from extragalactic neutron stars (Cordes & Wasserman, 2016) as possible progenitors. Other theories involve cataclysmic models including neutron star mergers (Totani, 2013) and “blitzars” occurring when a neutron star collapses to a black hole (Falcke & Rezzolla, 2014).
Independent of the physical mechanism/process, an FRB may leave an afterglow through interaction with the surrounding medium. Yi et al. (2014) have estimated FRB afterglow luminosities, using standard GRB afterglow models in radio, optical and X-ray bands, assuming a plausible range of total kinetic energies and redshifts. Lyutikov & Lorimer (2016) have discussed possible electromagnetic counterparts for FRBs; searching for such counterparts is thus one strategy for localising FRB host galaxies. Chatterjee et al. (2017) directly localised the repeating FRB 121102 (Spitler et al., 2016) using the Karl G. Jansky Very Large Array Telescope (VLA) and identified its host to be a dwarf galaxy at a redshift (Tendulkar et al., 2017). The host is co-located with a persistent variable radio source. Additionally, the radio follow-ups of FRB 131104 (Shannon & Ravi, 2016) and FRB 150418 (Keane et al., 2016; Johnston et al., 2017) have shown the presence of variable radio emission from Active Galactic Nuclei (AGN) in the fields of FRBs.
The SUrvey for Pulsars and Extragalactic Radio Bursts (SUPERB) is currently ongoing at the Parkes radio telescope and is described in detail in Keane et al. (2017), hereafter Paper 1. Initial results from the SUPERB survey have already been published elsewhere — this includes investigations into radio frequency interference (RFI) at the Parkes site (Petroff et al., 2015c), the discovery of FRB 150418 (Keane et al., 2016) and the discovery of new pulsars (Paper 1). Here we report further results from the survey, in particular the discovery of four new FRBs —150610, 151206, 151230 and 160102 — as well as the multi-messenger follow-up of the four FRBs.In §2, we provide an overview of the observations and techniques for the FRB search. Next we present the new FRB discoveries and their properties in §3. FRB multi-messenger follow-up observations and their results are described in §4. Finally, in §5 and §6 we present our conclusions and discuss the implications of our results.
2 Observations and Techniques
The full details of the SUPERB observing system and analysis setup can be found in Paper 1; here we briefly summarise the key points relevant to this work. Real-time searches are conducted for both transient and periodic signals in the incoming data. These data are also searched offline through a more rigorous process which operates slower than real time. These two streams are called the “Fast” (F) and “Thorough” (T) pipelines, respectively. For the single pulse pipeline, data are acquired in the form of a time, frequency and total intensity matrix. These are fed to the transient detection pipeline, heimdall111https://sourceforge.net/projects/heimdall-astro/, which applies sliding boxcar filters of various widths and performs a threshold search. This produces candidate detections that are classified as FRBs if they meet the following criteria:
| (1) |
where DM and DMGalaxy are the dispersion measures of the candidate and the Milky Way contribution along the line of sight, respectively. The latter is estimated using the NE2001 model (Cordes & Lazio, 2002). S/N is the peak signal-to-noise ratio of the candidate, Nbeams,adj is the number of adjacent beams in which the candidate is detected and W is the width of the boxcar. The final criterion measures the number of candidates detected within a 4-second window centred on the time of occurrence of the pulse. If there are too many candidates in a time region around the candidate of interest, it is flagged as RFI. These criteria are followed by the T-pipeline, and for the purposes of keeping the processing to real-time, for the F-pipeline, we raise the detection threshold to and only search for pulses with widths . When a candidate meets these criteria, an alert email is issued and an astronomer evaluates a series of diagnostic plots to determine the validity of the candidate. If the candidate is deemed credible, multi-wavelength follow-up is triggered. Upon detection of a candidate matching the above criteria, 8-bit full-Stokes data are saved to disk for further offline processing.
3 FRB discoveries
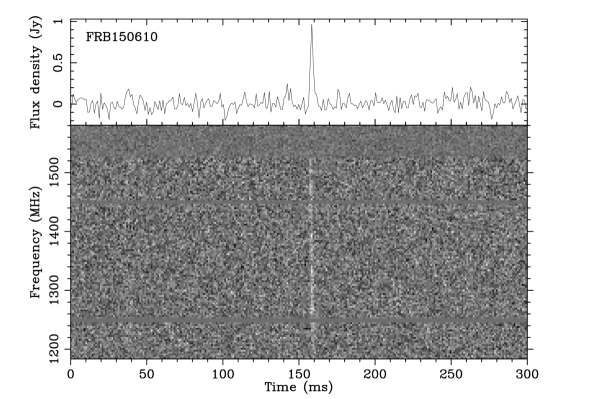
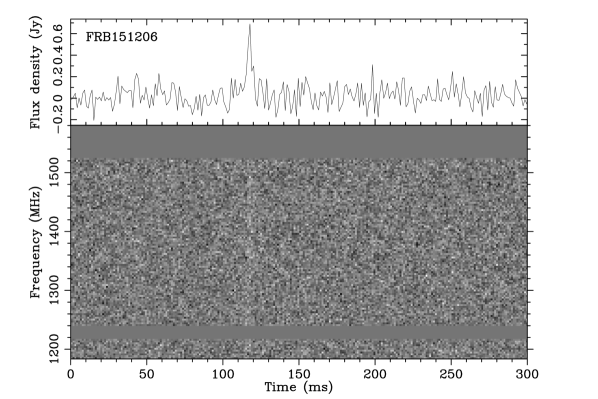
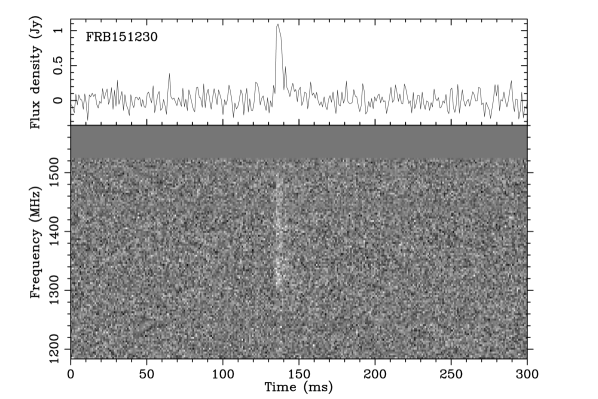
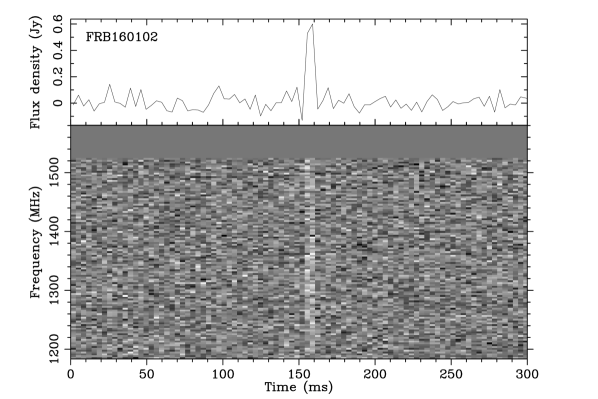
The individual pulse profiles for the FRBs are shown in Fig 1 and Table 1 presents their measured and derived properties. The FRBs were detected in single beam of the Parkes multi-beam receiver. Each FRB has a positional uncertainty with a radius of 7.5. The inferred properties including redshift, energy, co-moving and luminosity distance are derived using the YMW16 model (Yao et al., 2017) of the electron density in the Milky Way. Our results are consistent within the uncertainties if we adopt the NE2001 model (Cordes & Lazio, 2002) instead. To measure the scattering properties of the bursts, the procedure adopted in Champion et al. (2016) was applied. The resulting scattering time was scaled to a standard frequency of 1 GHz, using a spectral index of . In the fitting process, we varied the assumed intrinsic width of the burst and find in all cases that the best fit is given by a burst duration that is solely determined by a combination of DM-smearing across the filterbank channels and interstellar scattering. Hence, due to the high DM of the FRBs reported here, all four FRBs are unresolved in width. We note that the estimated isotropic energies of the FRBs at source had an incorrect redshift correction in Caleb et al. (2016). The FRBs analysed at that time were mainly at redshifts , and the conclusions of the paper are unaffected. In this paper, three of the reported FRBs have DM pc cm-3, for which cosmological effects become important. We follow Hogg (2000) and estimate the in-band intrinsic energies of the FRBs as:
| (2) |
where is the observed fluence for FRBs in Jy ms, is the bandwidth at Parkes in Hz, is the luminosity distance in meters, is the inferred redshift of FRBs and is the spectral index of the source. Note that the denominator incorporates both the -correction for the spectral index and the time-dilation correction. Since we generally assume the spectral index to be flat and thus , there is no -correction in practice.
FRB YYMMDD FRB 150610 FRB 151206 FRB 151230 FRB 160102 Measured Properties Event time at 1.4 GHz UTC 2015-06-10 05:26:59.396 2015-12-06 06:17:52.778 2015-12-30 16:15:46.525 2016-01-02 08:28:39.374 Parkes beam number 02 03 04 13 RA, DEC (J2000) 10:44:26, 40:05:23 19:21:25, 04:07:54 09:40:50, 03:27:05 22:38:49, 30:10:50 (, ) , 16.5 32.6, 8.5 239.0, 34.8 18.9, 60.8 Signal to noise ratio, (S/N) 18 10 17 16 Dispersion measure, DM (pc cm-3) 1593.90.6 1909.80.6 960.40.5 2596.10.3 Scattering time at 1 GHz (ms) 3.00.9 112 186 41 Measured width, W50 (ms) 2.01.0 3.00.6 4.40.5 3.40.8 Instrumental dispersion smearing (ms) 2.0 2.3 1.2 3.2 Observed peak flux density, Speak (Jy) 0.2 0.300.04 0.420.03 0.50.1 Measured fluence (Jy ms) 1.30.7 0.90.2 1.90.3 1.80.5 Model-dependent properties DMGal (pc cm-3) 122 160 38 13 Max. inferred 1.2 1.5 0.8 2.1 Max. comoving distance (Gpc) 3.9 4.3 2.7 5.5 Max. luminosity distance (Gpc) 8.6 10.6 4.8 17.2 Max. isotropic energy (1033 J) 1.81.0 1.70.4 1.00.2 7.02.0 Average luminosity (1036 W) 0.90.7 0.60.2 0.20.04 2.00.7
FRB 150610 was not detected in the F-pipeline. The reason for this was the final selection criterion described in Equation 1. At the time of observation, the number of events detected in a 4-second window did not make a distinction by beam and as such was overly harsh. In this case, one beam (beam 10) had a large number of RFI events in the time window, which resulted in all other (unrelated) beams being flagged. This criterion has since been corrected in the F-pipeline. FRB 150610 was discovered in the T-pipeline which makes less severe cuts to generated candidates. Since this burst was found in the offline processing, no prompt follow-up observations could be performed upon detection. The burst is slightly scattered but unresolved.222In the lowest subbands a second peak is visible, but statistical tests suggest that it is not significant and caused by noise fluctuations. We determine the frequency dependence of the observed dispersion, tdelay DM , to be , perfectly consistent with a cold-plasma law.
FRB 151206 fell just between search trials in the F pipeline, placing it slightly below the detection threshold. However the T-pipeline (which samples DM parameter space more completely) identified it soon after. As a result the full-Stokes data were not retained and no polarisation information is available. The burst is unresolved and slightly scattered. The limited signal-to-noise ratio prevents a fit for the DM index. The trigger was issued only 25 hours after the time of occurrence and eleven telescopes observed the Parkes position over the following days to months. Observations and results from each of these telescopes are described in §4.
FRB 151230 shows peak intensity near the centre of our observing band, similar to some of the events described in Spitler et al. (2016) for FRB 121102. The FRB is bright in the upper 200 MHz of the band and disappears at the lower frequencies in the band, below 1300 MHz. The burst is unresolved and shows scattering, possibly partly responsible for the non-detection at the lowest frequencies. We can determine the DM-index to be . This burst was discovered by the F-pipeline, an alert was raised, and a trigger was issued to telescopes after an hour of the detection. This burst was followed up by 12 telescopes ranging from radio to gamma-ray wavelengths.
FRB 160102 is the highest-DM FRB yet observed with DM = 2596.10.3 pc cm-3, and has an inferred luminosity distance of Gpc, assuming the nominal redshift from the models of Ioka (2003) and Inoue et al. (2014) for the observed DM excess. We find indications of scattering and determine the DM-index to . For this FRB, a trigger was issued approximately one hour after the event and this burst was followed up by 8 telescopes spanning radio to gamma-ray wavelengths.
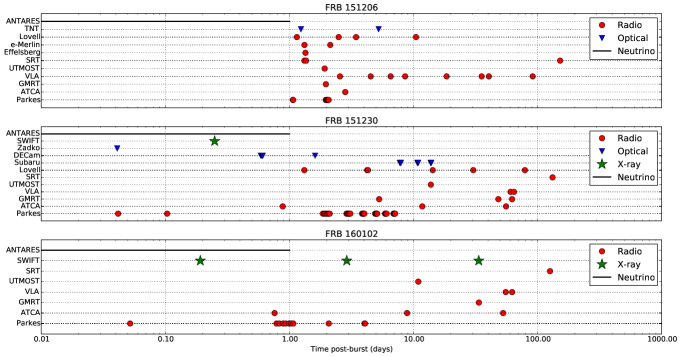
4 Follow-up studies
Follow-up observations of each FRB’s field were carried out with four optical telescopes, nine radio telescopes, one high energy telescope and the ANTARES neutrino detector. Fig. 2 shows the summary of observations performed on each field. Imaging observations with radio and optical telescopes were performed in order to search for any variable or transient sources that might be associated with the FRBs. Radio follow-up also included searching for repeat pulses from each FRB location. A complete record of all observations performed is included in Tables A1 to A4 in the Appendix.
4.1 Radio follow-up for repeat bursts
Follow-up observations were performed with the Parkes telescope using the Berkeley Parkes Swinburne Recorder (BPSR) observing setup (Keith et al., 2010) immediately after the discovery of each real-time FRB. The Sardinia radio telescope (SRT; Bolli et al., 2015) observed the FRB fields in single pulse search mode at a centre frequency of 1548 MHz with a bandwidth of 512 MHz. Observations were also performed by the Lovell and Effelsberg radio telescopes (Lovell, 1985; Hachenberg et al., 1973) in L-Band (1.4 GHz) and single pulse searches were performed with PRESTO (Ransom et al., 2002) around the DM of the FRB. The UTMOST telescope (Bailes et al., 2017) also observed three of the FRB fields (all except FRB 150610). The UTMOST observations were performed at 843 MHz with a bandwidth of 31 MHz in fan beam mode with 352 fan beams covering (see Caleb et al. (2017) for the details of this observing mode). The details of the time spent on each FRB field are listed in Table 2. None of the observations showed repeated bursts from their respective FRB fields.
| FRB | Parkes | SRT | Effelsberg | Lovell | UTMOST | Total |
|---|---|---|---|---|---|---|
| Tobs(hrs) | Tobs(hrs) | Tobs(hrs) | Tobs(hrs) | Tobs(hrs) | (hrs) | |
| FRB 150610 | 10 | - | - | - | - | 10 |
| FRB 151206 | 3 | 9.3 | 3 | 3.3 | 3.75 | 22.3 |
| FRB 151230 | 36 | 2.9 | - | 8.5 | 7.5 | 54.9 |
| FRB 160102 | 9.2 | 2 | - | - | 4.7 | 15.9 |
4.2 Radio interferometric follow-up for possible counterparts
Radio imaging observations were performed using the Australian Telescope Compact Array (ATCA) (Wilson et al., 2011), VLA, the Giant Metrewave Radio Telescope (GMRT) (Ananthakrishnan, 1995) and the e-Merlin radio telescope (Garrington et al., 2004), spanning 4 to 8 GHz and 1 to 1.4 GHz. The details of the observations, data analysis and variability criteria are listed in Appendix B. Here we present the results of the follow-ups and the implications of the variability are discussed in §5.
FRB 151206: ATCA observed the field of FRB 151206 on 2015 December 9, 3 days after the burst. Visibilities were integrated for 3 hours yielding a radio map with an rms noise of Jy/beam at 5.5 GHz and 60 Jy/beam at 7.5 GHz. The declination of the FRB field () was not favourable for ATCA observations, therefore no subsequent observations were performed and no variability analysis was conducted on these data.
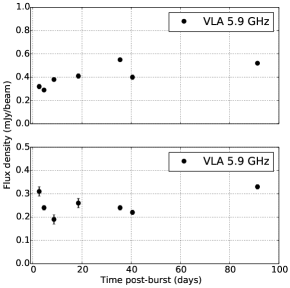
This field was observed for eight epochs with the VLA starting from 2015 December 8. The radio images reached an rms of Jy/beam. Observations at epoch 3 were severely affected by RFI and hence excluded from the analysis. To form mosaic images, each of the 7 single pointings were stitched together for every epoch and were deconvolved using the clean algorithm (Högbom, 1974). Two significantly variable sources were detected in this field, details of which are listed in Table 4. Fig. 3 shows their light curves. No non-radio counterpart was identified for either of the sources.
Observations were performed with the GMRT on 2015 December 9. The field was observed for 4 hours and the map yielded an rms of 30 Jy/beam. No subsequent observations were performed and no variability analysis was conducted on these data.
The field was also observed with e-Merlin on 2015 December 7 and 8. Observations ran from 14:00–19:30 UTC on December 7 and 09:30–19:30 on December 8. A total of 1,945 overlapping fields were imaged and then combined using the AIPS task FLATN. The combined image covered a circular area of 10 diameter and has an rms of 34 Jy/beam (beam size =171 31 mas, PA=19.4). At the declination of the source, snapshot imaging is quite challenging for e-Merlin, so the combined full sensitivity image from 1.5 runs was searched for significant detections with SExtractor and nothing significant ( 6-sigma) was found.
FRB 151230: ATCA was triggered 1 day after the event and visibilities were recorded for 8 hours. Subsequent observations were performed on 2016 January 11 and 2016 February 24 for 9.5 and 4.5 hours, respectively. We performed a variability analysis of all compact sources at 5.5 GHz and 7.5 GHz. Following the criteria described in Appendix B, we conclude that there are no significant variable sources present in the field of FRB 151230.
Observations were performed using the VLA on 2016 February 29 and 2016 March 4 and images were produced at the center frequency of 5.9 GHz with an rms of 15 Jy/beam. All ATCA sources were detected. None of the compact sources were found to be significantly variable.
GMRT observations were performed on 2016 January 6, 2016 February 17 and 2016 March 3. The integration times of 4 hours yielded an rms of 30 Jy/beam at 1.4 GHz. None of the sources showed any significant variability.
| Telescope | ATCA | VLA | GMRT | |||||||||
|---|---|---|---|---|---|---|---|---|---|---|---|---|
| Centre freq. | 5.5 GHz | 7.5 GHz | 5.9 GHz | 1.4 GHz | ||||||||
| Ntotal | Nanalysis | Nvariable | Ntotal | Nanalysis | Nvariable | Ntotal | Nanalysis | Nvariable | Ntotal | Nanalysis | Nvariable | |
| FRB 151206 | 1 | - | - | 1 | - | - | 10 | 10 | 2 | 13 | - | - |
| FRB 151230 | 9 | 6 | 0 | 5 | 2 | 0 | 25 | 20 | 0 | 27 | 18 | 0 |
| FRB 160102 | 12 | 10 | 1 | 12 | 10 | 0 | 21 | 19 | 0 | 48 | - | - |
FRB 160102: ATCA observed the FRB 160102 field on 2016 January 3, 2016 January 11 and 2016 February 24. The best map yielded an rms of 40 Jy/beam at 5.5 GHz and 50 Jy/beam at 7.5 GHz. The search for sources was performed over an area of sky that is twice the region of the localisation error, i.e. a radius of 15 because this FRB was detected in the outer beam of the Parkes telescope.
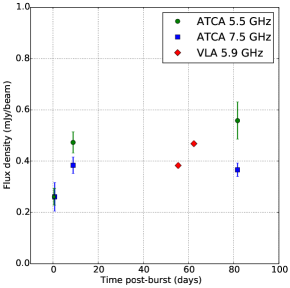
The final variability analysis was performed on 10 compact sources. Source 22383011 was found to vary significantly at 5.5 GHz but not at 7.5 GHz. We identify it to the quasar 2QZ J223831.1301152 from the “Half a Million Quasar Survey” (Flesch, 2015) at = 1.6. This source is also present in the GALEX survey (Bianchi et al., 2011) (GALEX J223831.1301152) and has a DSS (Eisenstein et al., 2011) optical counterpart. Table 4 and Figure 3 lists the details and light-curve of the source 22383011. The flux density of the source was observed to be rising at ATCA epochs at 5.5 GHz.
The VLA observations were performed on 2016 February 26 and 2016 March 4. Flux densities were derived from mosaics with the best rms being 10 Jy/beam. ATCA source 2238-3011 showed a low level variability with the fractional change (defined in Appendix B), S 20 (). None of the remaining sources were found to vary significantly at 5.9 GHz.
The field was also observed with the GMRT on 2016 February 6. The integration of 4 hours yielded an rms of 30 Jy/beam. This GMRT epoch was used to cross-check sources detected in the ATCA and VLA images and no variability analysis was performed on these data.
| Name | RA | DEC | S | |||
| () | () | |||||
| FRB 151206 field | ||||||
| VLA1921-0414 | 19:21:27.21 (0.2) | 04:14:55.67 (0.2) | 478.6 | 24.3 | 21.3 | 63.4 |
| VLA1921-0412 | 19:21:43.85 (0.2) | 04:12:17.43 (0.2) | 91.0 | 24.3 | 16.8 | 54.7 |
| FRB 160102 field | ||||||
| ATCA2238-3011 | 22:38:31.17 (0.2) | 30:11:51.38 (0.6) | 24.16 | 13.8 | 26.4 | 69.0 |
The results of the radio follow-up are summarised in Table 3.
4.3 Follow-up at non-radio frequencies
We have carried out optical and high energy follow-up and searched for neutrino counterparts to these four SUPERB FRBs. The results are presented in this section and the details of the observations and magnitude limits are listed in Appendix C.
4.3.1 Thai National Telescope (FRB 151206)
The observations were performed with ULTRASPEC on the Thai National Telescope (TNT) on the night of 2015 December 7. Four optically variable sources were found in the field of FRB 151206. The change in magnitude mag provides a measurement of the variability of a given source in the field, such that mag ¿ 0 reflects a dimming source. The only source detected with a negative mag is also bright at infrared wavelengths, with , , respectively from 2MASS (Skrutskie et al., 2006). Further photometric observations of the four variable sources were obtained using the 0.5-m robotic telescope “pt5m” (Hardy et al., 2015). In all cases, the variability seen for these sources can be explained by stellar variability, either eclipsing, ellipsoidal or stochastic (accretion, flaring etc).
4.3.2 Subaru Telescope (FRB 151230)
We performed follow-up imaging observations of the field of FRB 151230 in the -, -, -bands on 2016 January 7, 10 and 13, with Subaru/Hyper Suprime-Cam that covers a 1.5 deg diameter field-of-view. The images taken on January 13 were used as the reference images and were subtracted from the images of January 7 and 10 using the HSC pipeline (Bosch et al., 2017). Ninty-seven variable source candidates with either positive or negative flux difference were detected in the error circle of FRB 151230 on the differential images. These candidates were examined by eye, and approximately half of them appear to be real objects while the other half are artefacts by subtraction failure. Most of the real variable sources are likely to be either Galactic variable stars (point sources without host galaxy) or AGNs (variable sources located at centres of galaxies). There are three objects associated with galaxies and offset from galaxy centres, which are most likely supernovae. This number is consistent with those detected outside the FRB error region considering the area difference, and also consistent with a theoretically predicted number of supernovae with the depth and cadence of our observations (Niino et al., 2014). No object shows evidence for an association with the FRB, although we cannot exclude the possibility that one of them is associated. The nature of the variable objects will be investigated and discussed in detail in a forthcoming paper (Tominaga et al. in prep).
4.3.3 DECam (FRB 151230)
We obtained DECam u-g-r-i dithered images centred on the coordinates of FRB 151230, with observations taken approximately 14 hours after the detection at Parkes. The field was also re-observed with the filter 39 hours after the FRB detection. We searched these -band images for transient sources (10-sigma significance) between the two consecutive nights, within the localisation error region of 15, using Mary pipeline (Andreoni et al.,under review). We detected 5 variable sources and 4 of them were cataloged333NASA/JPL SB identification system: ssd.jpl.nasa.gov as small bodies, i.e. Main-belt asteroids. A fifth object was detected at a magnitude = 22.510.08 on 2016 January 1, which had not been detected on the previous night, 2015 December 31 ( 23.37 at 5-sigma confidence). This transient is located at RA=9:40:56.34, DEC=3:27:38.29 (J2000) and is not present in the NASA/JPL small body catalog but is most likely to be an asteroid unrelated to FRB. However, it is not detected in the u-g-r-i images taken on 2015 December 31. All other transient events were rejected as bonafide transients due to poor local subtraction and bad pixels after a visual inspection of the residuals.
We have also compared the radio sources detected in the GMRT and ATCA images with the DECam images to look for optical counterparts; more details are given in Appendix C.
| Galactic latitude | HTRU | HTRU | RRAT | FRB | SUPERB | Fermi | Misc | Total | ||
|---|---|---|---|---|---|---|---|---|---|---|
| medlat | hilat | search | follow-up | timing | time | time | ||||
| (deg) | (hrs) | (hrs) | (hrs) | (hrs) | (hrs) | (hrs) | (hrs) | (hrs) | FRBs sky-1 day-1 | |
| 1157 | 402 | 483 | 0 | 700 | 281 | 0 | 3024 | 4 | 2.4 103 | |
| 0 | 942 | 28 | 50 | 1115 | 10 | 100 | 2245 | 6 | 4.8 103 | |
| 0 | 982 | 39 | 60 | 907 | 9 | 90 | 2088 | 9 | 7.8 103 |
4.3.4 The Zadko Telescope (FRB 151230)
On 2015 December 30, the Zadko telescope was shadowing the Parkes telescope at the time of the discovery of FRB 151230. However, due to technical difficulties, the first science images were taken at 18:03:20.6 UTC, i.e 1 hour after the FRB event. Following this initial imaging, a series of 19 images of 5 tiles each were obtained during about 2 hrs through to the end of the night. Each image had an exposure time of 60 seconds in the -band. The localisation error region (15) around FRB 151230 is completely covered by the central image of the tiles and partly contained () in the peripheral images.
We analysed the individual images to search for new optical or variable sources in the field of FRB 151230. We particularly focused on the central image of the tile that fully covers the error radius around the FRB position. We found no convincing new or variable optical sources.
4.3.5 High energy follow-up (FRB 151230, FRB 160102)
We acquired follow-up observations with Swift on FRB 151230 burst on 2015 December 30 at 23:14:45 UTC, about 7 hours after the FRB for a duration of 2.05 ks. No sources were detected above a 2.5-sigma limit in the X-ray image. The data were analysed using the tools available at the Swift website (Evans et al., 2007, 2009) on an observation-by-observation basis. Count rates were converted to X-ray flux assuming a GRB-like spectral index of 2.0 and Galactic HI column density estimates from the HEAsoft tool “nH”.
We acquired 3 epochs on the field of FRB 160102 with the Swift XRT of durations 3.5 ks, 3.3 ks, and 1.8 ks, respectively. No sources were detected above a 2.5-sigma limit in any of the images. We did not trigger Swift for FRB 150610 (due to the delay in its detection), nor FRB 151206 (as it was Sun constrained for 31 days after the FRB).
No Swift-BAT REALTIME triggers were issued for short duration gamma-ray transients during the follow-up observations for each FRB field.
4.3.6 ANTARES follow-up (all FRBs)
Multi-messenger observations with high-energy neutrino telescopes can help to constrain the FRB origin and offer a unique way to address the nature of the accelerated particles in FRBs. The ANTARES telescope (Ageron et al., 2011) is a deep-sea Cherenkov neutrino detector, located 40 km off Toulon, France, in the Mediterranean Sea and dedicated to the observation of neutrinos with . ANTARES aims primarily at the detection of neutrino-produced muons that induce Cherenkov light in the detector. Therefore, by design, ANTARES mainly observes the Southern sky (2 steradian at any time) with a high duty cycle. Searches for neutrino signals from the four detected FRBs have been performed within two different time windows around the respective FRB trigger time, T0, within a 2∘ radius region of interest (ROI) around the FRB position (3-sigma ANTARES point spread function for the online track reconstruction method). The first time window = [T500 s; T0+500 s] is short and was defined for the case where FRBs are associated with short transient events, e.g. short Gamma-Ray Bursts (Baret et al., 2011). A longer time window = [T1 day; T0+1 day] is then used to take into account longer delays between the neutrino and the radio emission. The number of atmospheric background events within the ROI is directly estimated from the data measured in the visible Southern sky using a time window = [T12 hr; T0+12 hr]. The stability of the counting rates has been verified by looking at the event rates detected in time slices of 2 hours within . Within and , no neutrino events were found in correlation with FRB 150610, FRB 151206, FRB 151230 or FRB 160102.
5 Results and Discussion
5.1 Cosmological implications of high DM FRBs
Assuming FRBs are extragalactic, the DM may be divided into contributions along the line-of-sight from the ISM in the Milky Way (DMGalaxy), the Intergalactic Medium (DMIGM), a host galaxy (DMhost) and the circum-burst medium (DMsource):
| (3) |
For all the FRBs reported here, the DMGalaxy contribution is minor ( of the total observed DM). It is currently difficult to disentangle the DM contributions of the remaining DM terms for these bursts. Xu & Han (2015) showed the DMhost to peak in the range of 30 to 300 pc cm-3 for different inclination angles of a spiral galaxy and average DMhost to be 45 pc cm-3 and 37 pc cm-3 for a dwarf and an elliptical galaxy respectively. In such cases, the remaining DM is expected to arise from the IGM if the sources are cosmological in nature.
If the DM of our FRBs is indeed dominated by the IGM contribution, then we are potentially probing the IGM at redshifts beyond . If we can find FRBs with DM pc cm-3, we could begin to probe the era in which the second helium reionisation in the Universe occurred (Fialkov & Loeb, 2016), which is important for determining the total optical depth to reionisation of the Cosmic Microwave Background (CMB), . We note that we discovered FRB 160102 soon after our pipelines were modified to allow for DM searches above 2000 pc cm-3 (the current upper limit is 10,000 pc cm-3). Even in the absence of scattering being a dominant factor higher sensitivity instruments will likely be needed to probe such high redshifts.
5.2 FRB latitude dependence revisited
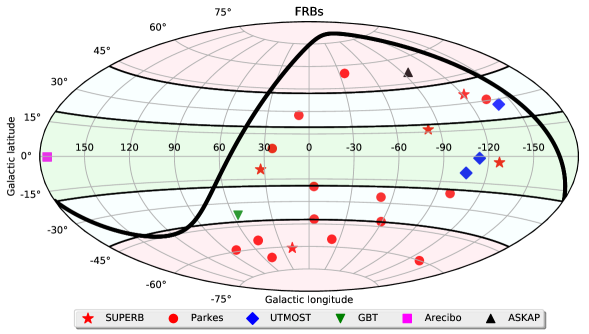
With an ever increasing sample of FRBs detected with the BPSR backend it is worthwhile to revisit the Galactic latitude dependence in FRB detectability first examined in Petroff et al. (2014). Table 5 summarises the data from SUPERB, as well as several other projects using BPSR that have each observed the sky with essentially the same sensitivity to FRBs resulting in the total of 19 bursts. We consider three regions on the sky, delineated in Galactic latitude as follows: , , and . The time on sky in each of these regions and the updated FRB rate at the 95 confidence level are presented in the table. Fig. 4 shows these FRBs on an Aitoff projection in the Galactic coordinate frame. For the studies considered here Parkes has spent of the total time in the lowest Galactic latitude region (this is mostly driven by pulsar searches and/or continued monitoring studies). Despite this only 4 of the 19 bursts have been found in this range. At the highest latitudes 9 FRBs have been detected in of the total time.
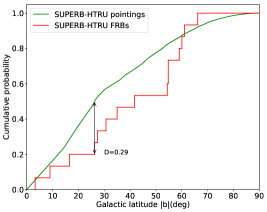
We performed a Kolmogorov-Smirnov test (K-S) between the expected cumulative distribution of for isotropically distributed FRBs based on the integration-time-weighted Galactic latitudes of the combined HTRU-SUPERB survey pointings, and the observed cumulative distribution of the 15 FRBs (see Fig 5). We obtain the KS statistic and values of 0.29, 0.10 respectively, and conclude that departure from isotropy is not significant. Thus any disparity in the FRB rate with Galactic latitude has low significance () in our now larger sample of 15 FRBs. If such a disparity exists, it could be explained by diffractive scintillation boosting at high Galactic latitudes as discussed in Macquart & Johnston (2015).
5.3 FRB populations and distributions
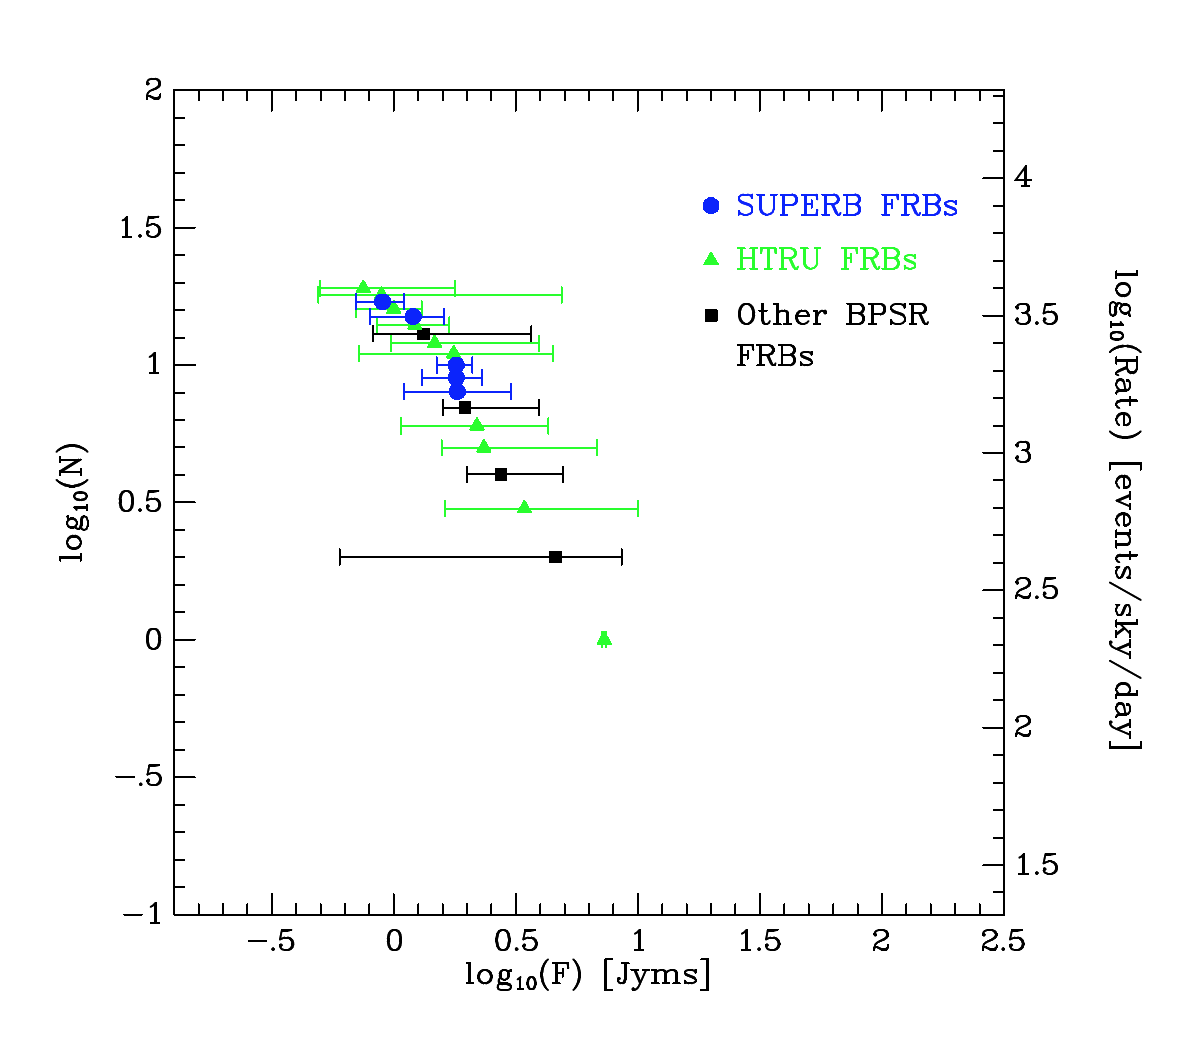
Sources with constant space density in a Euclidean Universe yield an integral source counts, , as a function of fluence, , the so-called “logN-log”-relation, with a slope of . The relation flattens in CDM cosmologies, depending on the redshift distribution of the sources being probed, and depends to some extent on the luminosity function of the sources, and observational factors like the effects that DM smearing have on the S/N of events (Caleb et al., 2016; Vedantham et al., 2016; CHIME Scientific Collaboration et al., 2017).
In Fig. 6, we present the FRB source count distribution as a function of fluence, for FRBs found with the BPSR instrument at Parkes. The sample consists of 10 FRBs found in the HTRU survey (Thornton et al., 2013; Champion et al., 2016); Petroff et al (in prep), 5 FRBs found with SUPERB (Keane et al., 2016, FRB 150418) and this paper, and 4 FRBs found at Parkes with the same instrumentation and search technique (Ravi et al., 2015, 2016; Petroff et al., 2015b, 2017).
We note the following caveats about the logN-log distribution. Firstly, the fluences are lower limits, as most of the FRBs are poorly localised within the Parkes beam pattern. Secondly, all FRB surveys are incomplete below some fluence, due to the effects of DM smearing, scattering and the underlying width distribution of the events (see §5.4 and Fig. 7). Although both these affect the shape of logN-log, simulations performed by Caleb et al. (2016) show that the slope of the relation is mainly set by cosmological effects. They found for the 9 HTRU FRBs.
We measure a slope of the integral source counts using the maximum likelihood method (Crawford et al., 1970) and obtain for FRBs above a fluence limit of 2 Jy ms as shown in Fig 6. This is consistent with the source count slope for Parkes FRBs found by Macquart & Ekers (2017), who find The large uncertainty in is due to the small sample size. Similarly to Macquart & Ekers (2017), we are unable to rule out that the source counts are not Euclidean ().
5.4 Parkes sky rates
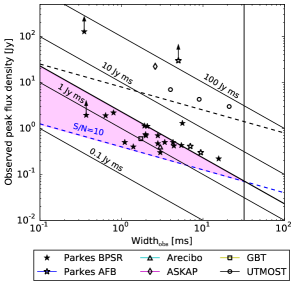
With the increased number of FRBs we update the all-sky rate estimates for Parkes. The all-sky lower limit on the rate is FRBs/( sr)/day. This is based on the observed rate of events in days of observing with BPSR, assuming the events occur within the full-width-half-power field-of-view of the receiver, and extrapolating this to the entire sky. The quoted uncertainties are Poisson uncertainties (Gehrels, 1986). Additionally we update the fluence complete rate, which is a more useful quantity when scaling FRB rates to other telescopes and/or frequencies. Figure 7 shows the observed peak flux density and observed widths of the FRB population, with Parkes sensitivity and completeness regions highlighted. Following Keane & Petroff (2015) and considering those FRBs in the fluence complete region we estimate a rate above of FRBs/( sr)/day.
5.5 Variable and transient source densities in the field of FRBs
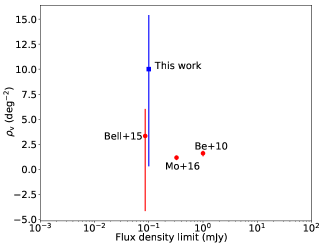
We essentially performed a targeted survey to search for significantly variable and transient radio sources in the three of our FRB fields. We covered 0.15 deg2 of sky for all fields with VLA at a sensitivity of 100 Jy and 0.3 deg2 of sky for all fields with ATCA at a sensitivity of 300 Jy from 4 GHz to 8 GHz. We detected two sources in the VLA images of the field of FRB 151206 and one source in the ATCA images of the field of FRB 160102 to vary significantly.
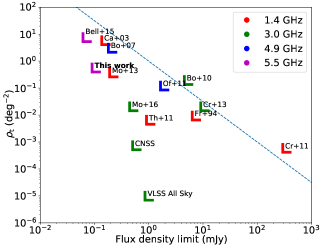
However, no radio transients were detected. The significant variable source surface density for our survey is deg-2 (1-sigma Poisson error). The Poisson uncertainties are calculated following Gehrels (1986). The upper limits on the transient source density for zero detections at 95% confidence is given by ¡ 0.56 deg-2 above the flux limit of 100 Jy. (Fig 8).
Bell et al. (2015) performed a search for variable sources in 0.3 deg2 with comparable flux limits and at similar frequencies as our search. They reported deg-2 (1-sigma Poisson error) for significant variable sources. We also compared our with Becker et al. (2010) and Mooley et al. (2016). The results are presented in Fig 8. The flux density limit () and for Mooley et al. (2016) were scaled to 5.5 GHz from 3 GHz using the relation and where is the frequency and is the spectral index (which is assumed to be ). We find that the surface density of significant variable sources is consistent within the uncertainty estimates with surveys done in the past in non-FRB fields. Consequently, we find no strong evidence that the FRBs reported here are associated with the highly variable sources in the fields, subject to the caveats that somewhat different variability search criteria, different frequencies and different sensitivity limits were used in the comparison surveys.
The probability of detecting variable sources in an area is given by:
| (4) |
where, is the variable source density, is the prior probability for that variable, normalised such that . We calculate the prior probability using Bell et al. (2015) as our control survey, which is given by:
| (5) |
where C is the normalisation constant, and are the number of highly variable source and the area covered in the control survey. We use results from our VLA observations of FRB fields to compare with the control survey because of their comparable sensitivities and found that the probability of detecting two highly variable sources in a 0.15 deg2 area of sky is 14.8. Currently with the available data, we lack sufficient information to conclusively associate any of these variable sources with FRB 151206 or FRB 160102. However, the detection of a known variable quasar in the field of FRB 160102, the presence of variable AGN in the field of FRB 150418 (Johnston et al., 2017), FRB 131104 (Shannon & Ravi, 2016) and the persistent variable radio source in the field of FRB 121102 (Chatterjee et al., 2017) hint that FRBs might be related to AGN activity in the host galaxy, however in the absence of a large FRB population and their localisation, this remains speculative.
6 Summary and conclusions
We report the discoveries of four new FRBs in the SUPERB survey being conducted with the Parkes radio telescope: FRB 150610, 151206, 151230 and 160201. We have performed multi-messenger follow-up of these using 2, 11, 12 and 8 telescopes respectively. No repeating radio pulses were detected in 103.1 hrs of radio follow-up. We continue to follow all SUPERB and bright HTRU FRBs in our ongoing SUPERB observations.
| Property | FRB 121102 | SUPERB FRBs |
|---|---|---|
| 100 MHz spectral features | Yes | 1 of 5 sources |
| time resolved | Yes | No |
| range of spectral index | 15 to 10 | 0 |
| scattering | No | Yes |
| width | ms | ms |
A comparison of the repeating FRB with the published non-repeating FRBs has been performed by Palaniswamy & Zhang (2017), who present evidence that there are two distinct populations of FRBs – repeating and non-repeating – based on the distribution of pulse fluences and the amount of followup time for each source. The FRBs reported here differ from FRB121102 (the repeating FRB) in a number of ways, as shown in Table 6. The pulses from the repeater are time resolved and their pulse widths vary from 39 ms whereas the SUPERB FRBs are unresolved (in time): the width is instead dominated by the effects of DM smearing and scattering. This appears to provide further support for the two source population conclusion of Palaniswamy & Zhang (2017).
With our larger sample of FRBs detected at Parkes, we have revisited the FRB event rate and derived an updated all sky FRB rate of FRBs/( sr)/day above a fluence of . We have also computed the volumetric rate of FRBs for the 19 FRB sample using the fluence complete rate as our basis. We get volumetric rates in the range 2000 to 7000 Gpc-3 out to a redshift of . This is consistent with volumetric rates for a range of transients (e.g. low luminosity long GRBs, short GRBs, NS-NS mergers, and supernovae (CC, Type Ia, etc)) (Kulkarni et al., 2014; Totani, 2013).
Our follow-up campaign of the reported FRBs yielded no multi-wavelength or multi-messenger counterparts and we have placed upper limits on their detection. We have also concluded that variability in the optical/radio images alone does not provide a reliable association with the FRBs. We encourage wide-field and simultaneous multi-wavelength observations of FRBs. In future, the detection of FRBs with an interferometer would be able to provide a robust host galaxy association.
Acknowledgements
The Parkes radio telescope and the Australia Telescope Compact Array are part of the Australia Telescope National Facility which is funded by the Commonwealth of Australia for operation as a National Facility managed by CSIRO. Parts of this research were conducted by the Australian Research Council Centre of Excellence for All-sky Astrophysics (CAASTRO), through project number CE110001020. The GMRT is run by the National Centre for Radio Astrophysics of the Tata Institute of Fundamental Research. VLA is run by the National Radio Astronomy Observatory (NRAO). NRAO is a facility of the National Science Foundation operated under cooperative agreement by Associated Universities, Inc. This work was performed on the gSTAR national facility at Swinburne University of Technology. gSTAR is funded by Swinburne and the Australian Government’s Education Investment Fund. This work is also based on data collected at Subaru Telescope, which is operated by the National Astronomical Observatory of Japan. We thank the LSST Project for making their code available as free software at http://dm.lsstcorp.org. Funding from the European Research Council under the European Union’s Seventh Framework Programme (FP/2007-2013) / ERC Grant Agreement n. 617199 (EP). Access to the Lovell Telescope is supported through an STFC consolidated grant. The 100-m telescope in Effelsberg is operation by the Max-Planck-Institut für Radioastronomie with funds of the Max-Planck Society. The Sardinia Radio Telescope (SRT) is funded by the Department of University and Research (MIUR), the Italian Space Agency (ASI), and the Autonomous Region of Sardinia (RAS) and is operated as National Facility by the National Institute for Astrophysics (INAF). TB and RWW are grateful to the STFC for financial support (grant reference ST/P000541/1). Research support to IA is provided by the Australian Astronomical Observatory. The ANTARES authors acknowledge the financial support of the funding agencies: Centre National de la Recherche Scientifique (CNRS), Commissariat à l’énergie atomique et aux énergies alternatives (CEA), Commission Européenne (FEDER fund and Marie Curie Program), Institut Universitaire de France (IUF), IdEx program and UnivEarthS Labex program at Sorbonne Paris Cité (ANR-10-LABX-0023 and ANR-11-IDEX-0005-02), Labex OCEVU (ANR-11-LABX-0060) and the A*MIDEX project (ANR-11-IDEX-0001-02), Région Île-de-France (DIM-ACAV), Région Alsace (contrat CPER), Région Provence-Alpes-Côte d’Azur, Département du Var and Ville de La Seyne-sur-Mer, France; Bundesministerium für Bildung und Forschung (BMBF), Germany; Istituto Nazionale di Fisica Nucleare (INFN), Italy; Stichting voor Fundamenteel Onderzoek der Materie (FOM), Nederlandse organisatie voor Wetenschappelijk Onderzoek (NWO), the Netherlands; Council of the President of the Russian Federation for young scientists and leading scientific schools supporting grants, Russia; National Authority for Scientific Research (ANCS), Romania; Ministerio de Economía y Competitividad (MINECO): Plan Estatal de Investigación (refs. FPA2015-65150-C3-1-P, -2-P and -3-P, (MINECO/FEDER)), Severo Ochoa Centre of Excellence and MultiDark Consolider (MINECO), and Prometeo and Grisolía programs (Generalitat Valenciana), Spain; Ministry of Higher Education, Scientific Research and Professional Training, Morocco. We also acknowledge the technical support of Ifremer, AIM and Foselev Marine for the sea operation and the CC-IN2P3 for the computing facilities. This work made use of data supplied by the UK Swift Science Data Centre at the University of Leicester. This research has made use of data, software and/or web tools obtained from the High Energy Astrophysics Science Archive Research Center (HEASARC), a service of the Astrophysics Science Division at NASA/GSFC and of the Smithsonian Astrophysical Observatory’s High Energy Astrophysics Division. This work is based in part on data collected at Subaru Telescope, which is operated by the National Astronomical Observatory of Japan. This paper makes use of software developed for the Large Synoptic Survey Telescope. We thank the LSST Project for making their code available as free software at http://dm.lsstcorp.org. RPE/MK gratefully acknowledges support from ERC Synergy Grant ”BlackHoleCam” Grant Agreement Number 610058
SB would like to thank Tara Murphy, Martin Bell, Paul Hancock, Keith Bannister, Chris Blake and Bing Zhang for useful discussions.
References
- Adrian-Martínez et al. (2016) Adrian-Martínez S., et al., 2016, preprint, (arXiv:1608.08840)
- Ageron et al. (2011) Ageron M., et al., 2011, Nuclear Instruments and Methods in Physics Research A, 656, 11
- Alard (2000) Alard C., 2000, A&AS, 144, 363
- Alard & Lupton (1998) Alard C., Lupton R. H., 1998, ApJ, 503, 325
- Ananthakrishnan (1995) Ananthakrishnan S., 1995, Journal of Astrophysics and Astronomy Supplement, 16, 427
- Axelrod et al. (2010) Axelrod T., Kantor J., Lupton R. H., Pierfederici F., 2010, in Software and Cyberinfrastructure for Astronomy. p. 774015, doi:10.1117/12.857297
- Bailes et al. (2017) Bailes M., et al., 2017, preprint, (arXiv:1708.09619)
- Bannister et al. (2017) Bannister K., et al., 2017, preprint, (arXiv:1705.07581)
- Baret et al. (2011) Baret B., et al., 2011, Astroparticle Physics, 35, 1
- Becker et al. (2010) Becker R. H., Helfand D. J., White R. L., Proctor D. D., 2010, The Astronomical Journal, 140, 157
- Bell et al. (2015) Bell M. E., Huynh M. T., Hancock P., Murphy T., Gaensler B. M., Burlon D., Trott C., Bannister K., 2015, MNRAS, 450, 4221
- Bianchi et al. (2011) Bianchi L., Herald J., Efremova B., Girardi L., Zabot A., Marigo P., Conti A., Shiao B., 2011, Ap&SS, 335, 161
- Bolli et al. (2015) Bolli P., et al., 2015, Journal of Astronomical Instrumentation, 4, 1550008
- Bosch et al. (2017) Bosch J., et al., 2017, preprint, (arXiv:1705.06766)
- Bower et al. (2007) Bower G. C., Saul D., Bloom J. S., Bolatto A., Filippenko A. V., Foley R. J., Perley D., 2007, ApJ, 666, 346
- Bower et al. (2010) Bower G. C., et al., 2010, ApJ, 725, 1792
- Burke-Spolaor & Bannister (2014) Burke-Spolaor S., Bannister K. W., 2014, ApJ, 792, 19
- CHIME Scientific Collaboration et al. (2017) CHIME Scientific Collaboration et al., 2017, preprint, (arXiv:1702.08040)
- Caleb et al. (2016) Caleb M., Flynn C., Bailes M., Barr E. D., Hunstead R. W., Keane E. F., Ravi V., van Straten W., 2016, MNRAS, 458, 708
- Caleb et al. (2017) Caleb M., et al., 2017, preprint, (arXiv:1703.10173)
- Carilli et al. (2003) Carilli C. L., Ivison R. J., Frail D. A., 2003, ApJ, 590, 192
- Chambers et al. (2016) Chambers K. C., et al., 2016, preprint, (arXiv:1612.05560)
- Champion et al. (2016) Champion D. J., et al., 2016, MNRAS, 460, L30
- Chatterjee et al. (2017) Chatterjee S., et al., 2017, Nature, 541, 58
- Connor et al. (2016) Connor L., Sievers J., Pen U.-L., 2016, MNRAS, 458, L19
- Cordes & Lazio (2002) Cordes J. M., Lazio T. J. W., 2002, ArXiv Astrophysics e-prints,
- Cordes & Wasserman (2016) Cordes J., Wasserman I., 2016, Monthly Notices of the Royal Astronomical Society, 457, 232
- Coward et al. (2017) Coward D. M., et al., 2017, Publ. Astron. Soc. Australia, 34, e005
- Crawford et al. (1970) Crawford D. F., Jauncey D. L., Murdoch H. S., 1970, ApJ, 162, 405
- Croft et al. (2011) Croft S., Bower G. C., Keating G., Law C., Whysong D., Williams P. K. G., Wright M., 2011, ApJ, 731, 34
- Croft et al. (2013) Croft S., Bower G. C., Whysong D., 2013, ApJ, 762, 93
- Dhillon et al. (2014) Dhillon V. S., et al., 2014, MNRAS, 444, 4009
- Diehl & Dark Energy Survey Collaboration (2012) Diehl H. T., Dark Energy Survey Collaboration 2012, in American Astronomical Society Meeting Abstracts #219. p. #413.05
- Eisenstein et al. (2011) Eisenstein D. J., et al., 2011, AJ, 142, 72
- Evans et al. (2007) Evans P. A., et al., 2007, A&A, 469, 379
- Evans et al. (2009) Evans P. A., et al., 2009, MNRAS, 397, 1177
- Falcke & Rezzolla (2014) Falcke H., Rezzolla L., 2014, A&A, 562, A137
- Fialkov & Loeb (2016) Fialkov A., Loeb A., 2016, J. Cosmology Astropart. Phys., 5, 004
- Flaugher et al. (2012) Flaugher B. L., et al., 2012, in Society of Photo-Optical Instrumentation Engineers (SPIE) Conference Series. p. 11, doi:10.1117/12.926216
- Flesch (2015) Flesch E. W., 2015, Publ. Astron. Soc. Australia, 32, e010
- Frail et al. (1994) Frail D. A., et al., 1994, ApJ, 437, L43
- Garrington et al. (2004) Garrington S. T., et al., 2004, in Oschmann Jr. J. M., ed., Proc. SPIEVol. 5489, Ground-based Telescopes. pp 332–343, doi:10.1117/12.553235
- Gehrels (1986) Gehrels N., 1986, ApJ, 303, 336
- Hachenberg et al. (1973) Hachenberg O., Grahl B.-H., Wielebinski R., 1973, IEEE Proceedings, 61, 1288
- Hancock et al. (2012) Hancock P. J., Murphy T., Gaensler B. M., Hopkins A., Curran J. R., 2012, MNRAS, 422, 1812
- Hardy et al. (2015) Hardy L. K., Butterley T., Dhillon V. S., Littlefair S. P., Wilson R. W., 2015, MNRAS, 454, 4316
- Högbom (1974) Högbom J. A., 1974, A&AS, 15, 417
- Hogg (2000) Hogg D. W., 2000, arXiv preprint astro-ph/9905116, 184
- Huynh et al. (2005) Huynh M. T., Jackson C. A., Norris R. P., Prandoni I., 2005, AJ, 130, 1373
- Inoue et al. (2014) Inoue A. K., Shimizu I., Iwata I., Tanaka M., 2014, MNRAS, 442, 1805
- Ioka (2003) Ioka K., 2003, ApJL, 598, L79
- Ivezić et al. (2008) Ivezić Ž., et al., 2008, in Bailer-Jones C. A. L., ed., American Institute of Physics Conference Series Vol. 1082, American Institute of Physics Conference Series. pp 359–365 (arXiv:0810.5155), doi:10.1063/1.3059076
- Johnston et al. (2017) Johnston S., et al., 2017, MNRAS, 465, 2143
- Jurić et al. (2015) Jurić M., et al., 2015, preprint, (arXiv:1512.07914)
- Keane & Petroff (2015) Keane E. F., Petroff E., 2015, MNRAS, 447, 2852
- Keane et al. (2012) Keane E. F., Stappers B. W., Kramer M., Lyne A. G., 2012, MNRAS, 425, L71
- Keane et al. (2016) Keane E., et al., 2016, Nature, 530, 453
- Keane et al. (2017) Keane E. F., et al., 2017, preprint, (arXiv:1706.04459)
- Keith et al. (2010) Keith M. J., et al., 2010, MNRAS, 409, 619
- Kulkarni et al. (2014) Kulkarni S. R., Ofek E. O., Neill J. D., Zheng Z., Juric M., 2014, preprint, (arXiv:1402.4766)
- Lorimer et al. (2007) Lorimer D. R., Bailes M., McLaughlin M. A., Narkevic D. J., Crawford F., 2007, Science, 318, 777
- Lovell (1985) Lovell B., 1985, The Jodrell Bank telescopes
- Lyutikov & Lorimer (2016) Lyutikov M., Lorimer D. R., 2016, ApJ, 824, L18
- Macquart & Ekers (2017) Macquart J.-P., Ekers R., 2017, preprint, (arXiv:1710.11493)
- Macquart & Johnston (2015) Macquart J.-P., Johnston S., 2015, MNRAS, 451, 3278
- Masui et al. (2015) Masui K., et al., 2015, preprint, (arXiv:1512.00529)
- McMullin et al. (2007) McMullin J. P., Waters B., Schiebel D., Young W., Golap K., 2007, in Shaw R. A., Hill F., Bell D. J., eds, Astronomical Society of the Pacific Conference Series Vol. 376, Astronomical Data Analysis Software and Systems XVI. p. 127
- Mooley et al. (2013) Mooley K. P., Frail D. A., Ofek E. O., Miller N. A., Kulkarni S. R., Horesh A., 2013, ApJ, 768, 165
- Mooley et al. (2016) Mooley K., et al., 2016, arXiv preprint arXiv:1601.01693
- Niino et al. (2014) Niino Y., Totani T., Okumura J. E., 2014, PASJ, 66, L9
- Ofek et al. (2011) Ofek E., Frail D., Breslauer B., Kulkarni S., Chandra P., Gal-Yam A., Kasliwal M., Gehrels N., 2011, The Astrophysical Journal, 740, 65
- Palaniswamy & Zhang (2017) Palaniswamy D., Zhang B., 2017, preprint, (arXiv:1703.09232)
- Pen & Connor (2015) Pen U.-L., Connor L., 2015, ApJ, 807, 179
- Petroff et al. (2014) Petroff E., et al., 2014, ApJL, 789, L26
- Petroff et al. (2015a) Petroff E., et al., 2015a, MNRAS, 447, 246
- Petroff et al. (2015b) Petroff E., et al., 2015b, MNRAS, 447, 246
- Petroff et al. (2015c) Petroff E., et al., 2015c, MNRAS, 451, 3933
- Petroff et al. (2016) Petroff E., et al., 2016, preprint, (arXiv:1601.03547)
- Petroff et al. (2017) Petroff E., SUPERB Collaboration HESS Collaboration ANTARES Collaboration 2017, in American Astronomical Society Meeting Abstracts. p. 330.05
- Piro (2016) Piro A. L., 2016, ApJ, 824, L32
- Ransom et al. (2002) Ransom S. M., Eikenberry S. S., Middleditch J., 2002, AJ, 124, 1788
- Ravi et al. (2015) Ravi V., Shannon R. M., Jameson A., 2015, ApJ, 799, L5
- Ravi et al. (2016) Ravi V., et al., 2016, Science, 354, 1249
- Sault et al. (1995) Sault R. J., Teuben P. J., Wright M. C. H., 1995, in Shaw R. A., Payne H. E., Hayes J. J. E., eds, Astronomical Society of the Pacific Conference Series Vol. 77, Astronomical Data Analysis Software and Systems IV. p. 433 (arXiv:astro-ph/0612759)
- Shannon & Ravi (2016) Shannon R. M., Ravi V., 2016, preprint, (arXiv:1611.05580)
- Skrutskie et al. (2006) Skrutskie M. F., et al., 2006, AJ, 131, 1163
- Spitler et al. (2014) Spitler L. G., et al., 2014, ApJ, 790, 101
- Spitler et al. (2016) Spitler L., et al., 2016, Nature, 531, 202
- Tendulkar et al. (2017) Tendulkar S. P., et al., 2017, ApJ, 834, L7
- Thornton et al. (2013) Thornton D., et al., 2013, Science, 341, 53
- Thyagarajan et al. (2011) Thyagarajan N., Helfand D. J., White R. L., Becker R. H., 2011, ApJ, 742, 49
- Totani (2013) Totani T., 2013, PASJ, 65, L12
- Vedantham et al. (2016) Vedantham H. K., Ravi V., Hallinan G., Shannon R. M., 2016, ApJ, 830, 75
- Wells (1985) Wells D. C., 1985, in di Gesu V., Scarsi L., Crane P., Friedman J. H., Levialdi S., eds, Data Analysis in Astronomy. p. 195
- Wilson et al. (2011) Wilson W. E., et al., 2011, MNRAS, 416, 832
- Wright (2006) Wright E. L., 2006, PASP, 118, 1711
- Xu & Han (2015) Xu J., Han J. L., 2015, Research in Astronomy and Astrophysics, 15, 1629
- Yao et al. (2017) Yao J. M., Manchester R. N., Wang N., 2017, ApJ, 835, 29
- Yi et al. (2014) Yi S.-X., Gao H., Zhang B., 2014, ApJ, 792, L21
Appendices
A FRB follow-up summary
Tables A1 to A4 below summarise all of the follow-up observations that have been performed for the four FRBs presented in this paper.
| Telescope | UTC | T postburst | Tobs(sec) | Sensitivity limit |
|---|---|---|---|---|
| ANTARES | 2015-06-10 05:26:58 | TFRB | TFRB - day; TFRB + day | Ref. Table A10 |
| Parkes | 2017-06-08 03:22:10 | 728 days, 21:55:12 | 7200 | 466 mJy at 1.4 GHz |
| Parkes | 2017-06-08 05:26:02 | 728 days, 23:59:04 | 7200 | 466 mJy at 1.4 GHz |
| Parkes | 2017-06-08 07:38:43 | 729 days, 2:11:45 | 7200 | 466 mJy at 1.4 GHz |
| Parkes | 2017-06-08 09:43:47 | 729 days, 4:16:49 | 7200 | 466 mJy at 1.4 GHz |
| Parkes | 2017-06-08 11:48:30 | 729 days, 6:21:32 | 7200 | 466 mJy at 1.4 GHz |
| Telescope | UTC | T postburst | Tobs(sec) | Sensitivity limit |
|---|---|---|---|---|
| ANTARES | 2015-12-06 06:17:52 | TFRB | TFRB - day; TFRB + day | Ref. Table A10 |
| Parkes | 2015-12-07 07:52:39 | 1 day, 1:37:43 | 120 | 466 mJy at 1.4 GHz |
| Parkes | 2015-12-07 07:55:28 | 1 day, 1:40:32 | 45.4 | 466 mJy at 1.4 GHz |
| Parkes | 2015-12-07 07:57:16 | 1 day, 1:42:20 | 830 | 466 mJy at 1.4 GHz |
| Lovell | 2015-12-07 09:49:43 | 1 day, 3:34:47 | 2982 | 350 mJy at 1.5 GHz |
| TNT | 2015-12-07 12:00:27 | 1 day, 5:45:31 | 1500 | = 22.0 |
| SRT | 2015-12-07 13:57:30 | 1 day, 7:42:34 | 12177 | 1.7 Jy at 1.5 GHz |
| e-Merlin | 2015-12 07-14:00:00 | 1 day, 7:45:04 | 18000 | 5 GHz - 204 Jy |
| Effelsberg | 2015-12 07-14:36:10 | 1 day, 8:21:14 | 10800 | 240 mJy at 1.4 GHz |
| SRT | 2015-12-07 15:00:00 | 1 day, 8:45:04 | 10800 | 1.7 Jy at 1.5 GHz |
| UTMOST | 2015-12-08 04:26:42 | 1 day, 22:11:46 | 13500 | 11 Jy at 843 MHz |
| Parkes | 2015-12-08 05:24:47 | 1 day, 23:09:51 | 1800 | 466 mJy at 1.4 GHz |
| Parkes | 2015-12-08 05:55:27 | 1 day, 23:40:31 | 1800 | 466 mJy at 1.4 GHz |
| Parkes | 2015-12-08 06:26:07 | 2 days, 0:11:11 | 1800 | 466 mJy at 1.4 GHz |
| Parkes | 2015-12-08 06:56:47 | 2 days, 0:41:51 | 1800 | 466 mJy at 1.4 GHz |
| Parkes | 2015-12-08 07:27:28 | 2 days, 1:12:32 | 1800 | 466 mJy at 1.4 GHz |
| Parkes | 2015-12-08 07:58:06 | 2 days, 1:43:10 | 550 | 466 mJy at 1.4 GHz |
| e-Merlin | 2015-12-08 09:30:00 | 2 days, 3:15:04 | 32400 | 204 Jy at 5 GHz |
| Lovell | 2015-12-08 18:09:16 | 2 days, 11:54:20 | 2985 | 350 mJy at 1.5 GHz |
| VLA | 2015-12-08 19:38:01 | 2 days, 13:23:11 | 4497 | 70 Jy at 5.9 GHz |
| ATCA | 2015-12-09 01:58:35 | 2 days, 19:43:39 | 10800 | 200 Jy at 5.5 GHz |
| 280 Jy at 7.5 GHz | ||||
| GMRT | 2015-12 09-04:15:00 | 2 days, 22:00:05 | 16200 | 180 Jy at 1.4 GHz |
| Lovell | 2015-12 09-17:02:04 | 3 days, 10:47:08 | 2990 | 350 mJy at 1.5 GHz |
| VLA | 2015-12 10-18:45:22 | 4 days, 12:30:26 | 4498 | 70 Jy at 5.9 GHz |
| TNT | 2015-12 11-11:57:22 | 5 days, 5:42:26 | 2940 | = 22.0 |
| VLA | 2015-12 12-19:22:22 | 6 days, 13:07:26 | 4498 | Badly affected by RFI |
| VLA | 2015-12 14-19:44:22 | 8 days, 13:29:26 | 4498 | 70 Jy 5.9 GHz |
| Lovell | 2015-12 16-17:40:27 | 10 days, 11:25:31 | 2970 | 350 mJy at 1.5 GHz |
| VLA | 2015-12-24 17:52:47 | 18 days, 11:37:51 | 4498 | 70 Jy at 5.9 GHz |
| VLA | 2016-01-10 16:51:57 | 35 days, 10:37:01 | 4498 | 70 Jy at 5.9 GHz |
| VLA | 2016-01-15 17:45:42 | 40 days, 11:30:46 | 4498 | 70 Jy at 5.9 GHz |
| VLA | 2016-03-06 13:39:23 | 91 days, 7:24:27 | 4328 | 70 Jy at 5.9 GHz |
| SRT | 2016-05-06 05:04:13 | 151 days, 22:49:17 | 10480 | 1.7 Jy at 1.5 GHz |
| Telescope | UTC | T postburst | Tobs(sec) | Sensitivity limit |
|---|---|---|---|---|
| ANTARES | 2015-12-30 17:03:26 | TFRB | TFRB - day; TFRB + day | Ref. Table A10 |
| Zadko | 2015-12-30 18:03:21 | 00:59:55 | 7457 | 19.8 |
| Parkes | 2015-12-30 18:03:30 | 01:00:04 | 3616.01 | 466 mJy at 1.4 GHz |
| Parkes | 2015-12-30 19:32:28 | 02:29:02 | 3618.11 | 466 mJy at 1.4 GHz |
| SWIFT | 2015-12-30 23:14:45 | 06:11:19 | 2056.5 | 1.918 1013 erg-1cm2 s-1 |
| DECam | 2015-12-31 07:11:17 | 14:07:51 | 900 | 21.5 |
| DECam | 2015-12-31 07:28:42 | 14:25:16 | 375 | 22.5 |
| DECam | 2015-12-31 07:37:22 | 14:33:56 | 200 | 23.8 |
| DECam | 2015-12-31 07:43:06 | 14:39:40 | 750 | 24.1 |
| ATCA | 2015-12-31 14:15:45 | 21:12:19 | 28800 | 288 Jy at 5.5 GHz |
| 348 Jy at 7.5 GHz | ||||
| Lovell | 2016-01-01 00:44:43 | 1 day, 7:41:17 | 7200 | 350 mJy at 1.5 GHz |
| DECam | 2016-01-01 07:44:44 | 1 day, 14:41:18 | 200 | 22.6 |
| Parkes | 2016-01-01 13:42:56 | 1 day, 20:39:30 | 3619.95 | 466 mJy at 1.4 GHz |
| Parkes | 2016-01-01 14:43:39 | 1 day, 21:40:13 | 3617.06 | 466 mJy at 1.4 GHz |
| Parkes | 2016-01-01 15:44:19 | 1 day, 22:40:53 | 3617.06 | 466 mJy at 1.4 GHz |
| Parkes | 2016-01-01 16:45:09 | 1 day, 23:41:43 | 3617.06 | 466 mJy at 1.4 GHz |
| Parkes | 2016-01-01 17:45:49 | 2 days, 0:42:23 | 3617.06 | 466 mJy at 1.4 GHz |
| Parkes | 2016-01-01 18:46:28 | 2 days, 1:43:02 | 3618.11 | 466 mJy at 1.4 GHz |
| Parkes | 2016-01-01 19:47:09 | 2 days, 2:43:43 | 3617.06 | 466 mJy at 1.4 GHz |
| Parkes | 2016-01-02 14:20:00 | 2 days, 21:16:34 | 3616.01 | 466 mJy at 1.4 GHz |
| Parkes | 2016-01-02 15:20:38 | 2 days, 22:17:12 | 3618.11 | 466 mJy at 1.4 GHz |
| Parkes | 2016-01-02 16:21:18 | 2 days, 23:17:52 | 3618.11 | 466 mJy at 1.4 GHz |
| Parkes | 2016-01-02 17:22:10 | 3 days, 0:18:44 | 3616.01 | 466 mJy at 1.4 GHz |
| Parkes | 2016-01-02 18:22:47 | 3 days, 1:19:21 | 3618.9 | 466 mJy at 1.4 GHz |
| Parkes | 2016-01-02 19:23:28 | 3 days, 2:20:02 | 3618.11 | 466 mJy at 1.4 GHz |
| Parkes | 2016-01-03 13:32:51 | 3 days, 20:29:25 | 3624.93 | 466 mJy at 1.4 GHz |
| Parkes | 2016-01-03 14:33:38 | 3 days, 21:30:12 | 3618.11 | 466 mJy at 1.4 GHz |
| Parkes | 2016-01-03 15:34:19 | 3 days, 22:30:53 | 3617.06 | 466 mJy at 1.4 GHz |
| Parkes | 2016-01-03 16:35:09 | 3 days, 23:31:43 | 3617.06 | 466 mJy at 1.4 GHz |
| Parkes | 2016-01-03 17:35:48 | 4 days, 0:32:22 | 3618.11 | 466 mJy at 1.4 GHz |
| Lovell | 2016-01-03 22:41:31 | 4 days, 5:38:05 | 5580 | 350 mJy at 1.5 GHz |
| Lovell | 2016-01-04 00:16:07 | 4 days, 7:12:41 | 1596 | 350 mJy at 1.5 GHz |
| Parkes | 2016-01-04 14:54:30 | 4 days, 21:51:04 | 3616.01 | 466 mJy at 1.4 GHz |
| Parkes | 2016-01-04 15:55:10 | 4 days, 22:51:44 | 3616.01 | 466 mJy at 1.4 GHz |
| Parkes | 2016-01-04 16:56:00 | 4 days, 23:52:34 | 3616.01 | 466 mJy at 1.4 GHz |
| Parkes | 2016-01-04 17:58:08 | 5 days, 0:54:42 | 3618.11 | 466 mJy at 1.4 GHz |
| Parkes | 2016-01-04 18:58:49 | 5 days, 1:55:23 | 1258.03 | 466 mJy at 1.4 GHz |
| Parkes | 2016-01-04 19:20:18 | 5 days, 2:16:52 | 3618.11 | 466 mJy at 1.4 GHz |
| Parkes | 2016-01-05 14:40:00 | 5 days, 21:36:34 | 3616.01 | 466 mJy at 1.4 GHz |
| Parkes | 2016-01-05 15:40:39 | 5 days, 22:37:13 | 3617.06 | 466 mJy at 1.4 GHz |
| Parkes | 2016-01-05 16:41:42 | 5 days, 23:38:16 | 3623.88 | 466 mJy at 1.4 GHz |
| Parkes | 2016-01-05 17:43:03 | 6 days, 0:39:37 | 3623.09 | 466 mJy at 1.4 GHz |
| Parkes | 2016-01-05 18:52:06 | 6 days, 1:48:40 | 3619.95 | 466 mJy at 1.4 GHz |
| Parkes | 2016-01-06 14:41:36 | 6 days, 21:38:10 | 3619.95 | 466 mJy at 1.4 GHz |
| Parkes | 2016-01-06 15:42:16 | 6 days, 22:38:50 | 3619.95 | 466 mJy at 1.4 GHz |
| Parkes | 2016-01-06 16:43:10 | 6 days, 23:39:44 | 3616.01 | 466 mJy at 1.4 GHz |
| Parkes | 2016-01-06 17:43:47 | 7 days, 0:40:21 | 3618.9 | 466 mJy at 1.4 GHz |
| Parkes | 2016-01-06 18:48:33 | 7 days, 1:45:07 | 3623.09 | 466 mJy at 1.4 GHz |
| GMRT | 2016-01-06 18:30:00 | 7 days, 1:26:34 | 15588 | 180 Jy at 1.4 GHz |
| Parkes | 2016-01-06 19:53:13 | 7 days, 2:49:47 | 1900.28 | 466 mJy at 1.4 GHz |
| Subaru | 2016-01-07 11:23:19 | 7 days, 18:19:53 | 4200 | Refer table A7 |
| Subaru | 2016-01-07 13:17:22 | 7 days, 20:13:56 | 3150 | Refer table A7 |
| Subaru | 2016-01-07 15:12:39 | 7 days, 22:09:13 | 4200 | Refer table A7 |
| Subaru | 2016-01-10 11:11:39 | 10 days, 18:08:13 | 3600 | Refer table A7 |
| Subaru | 2016-01-10 13:03:29 | 10 days, 20:00:03 | 3600 | Refer table A7 |
| Subaru | 2016-01-10 15:07:20 | 10 days, 22:03:54 | 4080 | Refer table A7 |
| ATCA | 2016-01-11 11:36:55 | 11 days, 18:33:29 | 34440 | 288 Jy at 5.5 GHz |
| 390 Jy at 7.5 GHz |
| Telescope | UTC | T postburst | Tobs(sec) | Sensitivity limit |
|---|---|---|---|---|
| Subaru | 2016-01-13 11:21:54 | 13 days, 18:18:28 | 3600 | Refer table A7 |
| UTMOST | 2016-01-13 12:13:48 | 13 days, 19:10:22 | 27000 | 11 Jy at 843 MHz |
| Subaru | 2016-01-13 13:12:52 | 13 days, 20:09:26 | 3600 | Refer table A7 |
| Subaru | 2016-01-13 15:13:35 | 13 days, 22:10:09 | 3600 | Refer table A7 |
| Lovell | 2016-01-14 00:03:12 | 14 days, 6:59:46 | 7200 | 350 mJy at 1.5 GHz |
| Lovell | 2016-01-30 00:32:04 | 30 days, 7:28:38 | 7200 | 350 mJy at 1.5 GHz |
| GMRT | 2016-02-17 19:30:00 | 49 days, 2:26:34 | 14400 | 180 Jy at 1.4 GHz |
| ATCA | 2016-02-24 09:48:15 | 55 days, 16:44:49 | 16500 | 240 Jy at 5.5 GHz |
| 252 Jy at 7.5 GHz | ||||
| VLA | 2016-02-29 06:42:11 | 60 days, 13:38:45 | 4353 | 105 Jy at 5.9 GHz |
| GMRT | 2016-03-03 13:30:00 | 63 days, 20:26:34 | 14400 | 180 Jy at 1.4 GHz |
| VLA | 2016-03-04 06:26:25 | 64 days, 13:22:59 | 4353 | 84 Jy at 5.9 GHz |
| Lovell | 2016-03-18 18:34:51 | 79 days, 1:31:25 | 1965 | 350 mJy at 1.5 GHz |
| SRT | 2016-05-10 17:58:43 | 132 days, 0:55:17 | 10350 | 1.7 Jy at 1.5 GHz |
| Telescope | UTC | T postburst | Tobs (sec) | Sensitivity limit |
|---|---|---|---|---|
| ANTARES | 2016-01-02 08:28:38 | TFRB | TFRB - day; TFRB + day | Ref. Table A10 |
| Parkes | 2016-01-02 09:44:28 | 01:15:50 | 3618.11 | 466 mJy at 1.4 GHz |
| SWIFT | 2016-01-02 13:05:17 | 04:36:39 | 3582 | 1.434 1013 erg-1cm2 s-1 |
| ATCA | 2016-01-03 02:42:45 | 18:14:07 | 14400 | 420 Jy at 5.5 GHz |
| 450 Jy at 7.5 GHz | ||||
| Parkes | 2016-01-03 03:23:01 | 18:54:23 | 3624.93 | 466 mJy at 1.4 GHz |
| Parkes | 2016-01-03 04:23:47 | 19:55:09 | 3618.9 | 466 mJy at 1.4 GHz |
| Parkes | 2016-01-03 05:50:16 | 21:21:38 | 3619.95 | 466 mJy at 1.4 GHz |
| Parkes | 2016-01-03 06:51:11 | 22:22:33 | 3624.93 | 466 mJy at 1.4 GHz |
| Parkes | 2016-01-03 08:15:34 | 23:46:56 | 3622.04 | 466 mJy at 1.4 GHz |
| Parkes | 2016-01-03 09:16:18 | 1 day, 0:47:39 | 3618.11 | 466 mJy at 1.4 GHz |
| Parkes | 2016-01-03 10:16:59 | 1 day, 1:48:21 | 1556.87 | 466 mJy at 1.4 GHz |
| Parkes | 2016-01-04 10:18:14 | 2 days, 1:49:35 | 1179.39 | 466 mJy at 1.4 GHz |
| SWIFT | 2016-01-05 06:04:58 | 2 days, 21:36:20 | 1827 | 1.966 1013 erg-1cm2 s-1 |
| Parkes | 2016-01-06 09:11:36 | 4 days, 0:42:57 | 3619.95 | 466 mJy at 1.4 GHz |
| Parkes | 2016-01-06 10:12:17 | 4 days, 1:43:38 | 896.27 | 466 mJy at 1.4 GHz |
| ATCA | 2016-01-11 05:34:35 | 8 days, 21:05:57 | 21060 | 330 Jy at 5.5 GHz |
| 360 Jy at 7.5 GHz | ||||
| UTMOST | 2016-01-13 06:43:00 | 10 days, 22:14:22 | 16920 | 11 Jy at 843 MHz |
| SWIFT | 2016-02-04 22:12:06 | 33 days, 13:43:28 | 3349 | 1.491 1013 erg-1cm2 s-1 |
| GMRT | 2016-02-06 06:30:00 | 34 days, 22:01:22 | 14400 | 180 Jy at 1.4 GHz |
| ATCA | 2016-02-24 02:40:05 | 52 days, 18:11:27 | 23400 | 240 Jy at 5.5 GHz |
| 300 Jy at 7.5 GHz | ||||
| VLA | 2016-02-26 17:50:17 | 55 days, 9:21:39 | 4283 | 70 Jy at 5.9 GHz |
| VLA | 2016-03-04 17:14:41 | 62 days, 8:46:03 | 4283 | 70 Jy at 5.9 GHz |
| SRT | 2016-05-07 07:52:08 | 125 days, 23:23:30 | 7200 | 1.7 Jy at 1.5 GHz |
B Interferometric observational details and variability criteria
| ATCA | VLA | GMRT | ||||||||||
|---|---|---|---|---|---|---|---|---|---|---|---|---|
| No. of epochs | Area (deg2) | PC & SC | No. of epochs | Area (deg2) | PC & SC | No. of epochs | Area (deg2) | PC & SC | ||||
| FRB 151260 | 1 | 0.05 | 1934638 | 1937101 | 8 | 0.05 | 3C286 | J2355+4950 | 1 | 0.05 | 3C286 | 2011067 |
| FRB 151230 | 3 | 0.05 | 1934638 | 0941080 | 2 | 0.05 | 3C138 | J09430819 | 3 | 0.05 | 3C48 | 0943083 |
| FRB 160102 | 3 | 0.2 | 1934638 | 2240260 | 2 | 0.05 | 3C48 | J22483235 | 1 | 0.2 | 3C48 | 3C286 |
Table A5 summarises the observations performed by the ATCA, VLA and GMRT on the field of SUPERB FRBs. For all detected sources the following statistics were used to test for variability using a method very similar to Bell et al. (2015). Firstly, the chi-square probability that the source is not variable is estimated with:
| (6) |
where is the flux value in an epoch , is the inverse of individual error in the flux measurement and is the weighted mean flux. Using distribution tables for degrees of freedom, a source is classified as variable if where is the probability that is produced by chance. Additionally, the de-biased modulation index is calculated using:
| (7) |
where is the mean flux density. Lastly, the fractional variability is computed using:
| (8) |
where and are the maximum and minimum flux densities for a source over epochs. A source is regarded to be a significant variable if the is greater than threshold and S ¿ 50, similar to Bell et al. (2015).
B.1 The Australian Telescope Compact Array
The follow-up of three of the FRB fields was performed with the ATCA , using compact array broadband backend (CABB) (Wilson et al., 2011) with a bandwidth of 2 GHz each centred at 5.5 GHz and 7.5 GHz to search for radio afterglows or variable sources associated with FRBs. The observations were done in a 42 pointing mosaic mode encompassing the localisation error radius of 7.5. The data were reduced following the standard steps of imaging in miriad (Sault et al., 1995). Aegean (Hancock et al., 2012) was used as a source finding and flux estimation software along with miriad tasks IMSAD and IMFIT. The images were searched for sources down to the threshold of 6-sigma in all ATCA data and a variability analysis (described above) was performed to identify variable sources.
B.2 The Karl G. Jansky VLA
The VLA observations were performed in the 4 GHz to 8 GHz band with a centre frequency of 5.9 GHz. A seven pointing mosaic was done to encompass Parkes localisation error radius of 7.5. The data reduction was performed using CASA (McMullin et al., 2007). All sources detected above 7-sigma were monitored between the epochs to search for variable sources. We note here that the flux density scale using wide-band VLA mosaics is unreliable due to poorly constrained primary beam shape over the wide frequency band, however the flux scale is stable between epochs such that although the absolute flux scale of the mosaic images is wrong, the variability analysis will be correct.
B.3 The Giant Metrewave Radio Telescope
The GMRT (Ananthakrishnan, 1995) observed the FRB fields at the center frequency of 1.4 GHz and bandwidth of 120 MHz. The data reduction was performed using the data reduction software AIPS (Wells, 1985). Aegean was used as source finding algorithm and a search for sources was performed down to 6-sigma noise level.
B.4 e-Merlin radio telescope
C Observational details and magnitude limits for non radio follow-ups.
C.1 Thai National Telescope
Optical follow up imaging was conducted on the field of FRB 151206 with the 2.4m Thai National Telescope (TNT), using the ULTRASPEC camera, with field of view 8 (Dhillon et al., 2014). Four tilings were observed on the night of 2015 December 7. Each tile observation consisted of 6 -band images with exposure times of 60 seconds. The same 4 tiles were repeated 4 days later, enabling a comparative analysis of sources. The effective overlapping area observed on both occasions was 15, centred on 19:21:27, 04:07:35 (J2000). The estimated 5-sigma detection limits for both epochs were = 22.0. The variable sources detected are presented in Table A6.
| RA | DEC | r′ mag | mag |
|---|---|---|---|
| 19:21:28.47 | 04:08:50.5 | 17.8 | +0.5 |
| 19:21:50.00 | 04:13:38.2 | 17.9 | +0.2 |
| 19:21:01.30 | 04:12:00.4 | 18.3 | +0.2 |
| 19:21:07.99 | 04:11:38.7 | 15.2 | 0.1 |
C.2 Subaru Telescope
The Hyper Suprime-Cam (HSC) data are reduced using HSC pipeline version 4.0.5 (Bosch et al., 2017), which is developed based on the LSST pipeline (Ivezić et al., 2008; Axelrod et al., 2010; Jurić et al., 2015), in the usual manner including bias subtraction, flat-fielding, astrometry, flux calibration, mosaicing, warping, coadding, and image subtraction. The astrometric and photometric calibration is made relative to the Pan-STARRS1 (Chambers et al., 2016) with a 4.0 (24 pixel) aperture diameter.
For transient finding, the HSC pipeline adopts the frequently used image subtraction algorithm developed by Alard (2000) and Alard & Lupton (1998); an image with narrower point spread functions (PSFs) are convolved with spatially varying kernels to match the wider PSFs of the other image, and the image subtraction is made for the PSF-matched images. In the analysis, we set the images taken on Jan 13 as the reference images and are subtracted from the science images taken on Jan 7 and 10. The 5-sigma limiting magnitude on the variability are estimated by apertures with a diameter being twice as large as the FWHM size of PSF. The apertures are randomly sampled from positions without any detection in the science and reference images and are locally sky subtracted.
Since the detected sources include many fakes, transient candidates are further selected using their measured properties and the spatially varying PSF and elongation of the difference images. We select the transient candidates detected at least twice with the following detection criteria; (1) the detection significance is higher than 5-sigma, (2) the PSF size is between 0.8 and 1.3 of PSF size of the difference image, (3) the elongation is larger than 0.65 of elongation of the difference image, and (4) the residual of the subtraction of the PSF kernel from the detected source is less than 3-sigma. The limiting magnitudes for Subaru observations are listed in Table A7.
| Band | 2016-01-07 - 2016-01-13 | 2016-01-10 - 2016-01-13 |
|---|---|---|
| HSC-G | ¿26.1 | ¿26.3 |
| HSC-R | ¿25.8 | ¿25.8 |
| HSC-I | ¿26.00 | ¿26.1 |
C.3 DECam
The Dark Energy Camera (DECam; Diehl & Dark Energy Survey Collaboration, 2012; Flaugher et al., 2012) is a wide-field optical imager mounted at the primary focus of the 4-m Blanco telescope at CTIO. Table A8 and A9 summarises the details of these observations and the limiting magnitudes
| Obs. time (UTC) | Filter | Exp (s) | |
|---|---|---|---|
| 2015-12-31, 07:11:17.1 | 180 | 5 | |
| 2015-12-31, 07:28:42.5 | 75 | 5 | |
| 2015-12-31, 07:37:22.2 | 40 | 5 | |
| 2015-12-31, 07:43:06.8 | 150 | 5 | |
| 2016-01-01, 07:44:44.4 | 40 | 5 |
| Detection limits | |||
| filter | Date | mag (AB) | |
| Dec 31st | 21.52 | 5 | |
| Dec 31st | 23.37 | 5 | |
| 22.55 | 10 | ||
| Jan 1st | 23.53 | 5 | |
| 22.68 | 10 | ||
| Dec 31st | 23.84 | 5 | |
| Dec 31st | 24.17 | 5 | |
The radio sources in ATCA and GMRT images for the FRB 151230 field were compared with DECam optical image to look for optical counterparts. Optical sources present above 5-sigma of the background noise are considered to be a detection in each --- filter. We found that 52 of the radio sources have an optical counterpart in at least one filter, for a search radius of 3 arcsec. This result of radio-to-optical source association is consistent with the work of Huynh et al. (2005).
C.4 The Zadko Telescope
The Zadko Telescope (Coward et al., 2017) is a 1 m f/4 Cassegrain telescope situated in the state of Western Australia. The Zadko telescope has a moderate field of view of , so the complete shadowing of the Parkes multi-beam receiver required 5-tile images.
C.5 The ANTARES neutrino detector
Searches for up-going track events in the ANTARES data have been optimised to give a 3-sigma discovery potential for one neutrino event in a search time window of = [T6 hr; T] within the ROI. For the four FRBs, the expected background event rate in a ROI of 2∘ is of the order of . Thus, the Poisson probability of observing zero event, knowing the background event rate, is 99 for any of the four FRBs. Hence, the null result is compatible with the background expectation.
The non detection of neutrino counterparts allows to derive upper limits at 90 confidence level on the neutrino fluence of the four FRBs based on the instantaneous acceptance of ANTARES at the FRB trigger time: . Two generic neutrino energy spectra were considered and defined by a power law function with spectral indices . The limits are then computed using a dedicated Monte Carlo simulation that takes into account the response of the detector at the FRB trigger time. The energy range [; ] corresponds to the 5-95 range of the energy distribution of the events in the optimised dataset. The results on the neutrino fluence upper limits for the two considered neutrino spectra are given in Table A10.
| FRB | ||||
|---|---|---|---|---|
| [] | [] | |||
| log10[GeV] | log10[GeV] | |||
| 150610 | (20) | [3.4; 6.8] | 2.54 (1600) | [5.8; 7.9] |
| 151206 | (11) | [3.6; 6.9] | 0.41 (250) | [5.8; 8.0] |
| 151230 | (11) | [3.2; 6.8] | 0.76 (470) | [5.8; 8.0] |
| 160102 | (16) | [3.6; 7.0] | 0.47 (290) | [5.8; 8.0] |
Constraints on the isotropic energy released in neutrinos can be set depending on the distance of the considered FRB: , where D is the effective distance travelled by the neutrinos. For the spectral model, three FRB distance scenarios have been tested: a galactic environment with D = 50 kpc (), a nearby extragalactic distance with Mpc () and a cosmological scenario with D = D() depending on the cosmological parameters and the maximum inferred from DM as listed in Table 1. The cosmological distance, D(), travelled by the neutrinos from each FRB was computed from the Eq. 4 of Adrian-Martínez et al. (2016) and found to be D() = 6.61, 6.75, 3.67, 10.17 Gpc respectively. For the four FRBs, the ANTARES constraints given by are at the level of , and erg, respectively for the three distance scenarios. In particular, if these four FRBs are associated with neutrino emission following a spectrum and with erg, ANTARES excludes their origin at distance within 100 Mpc.
The ANTARES Collaboration
A. Albert32, M. André33, M. Anghinolfi34, G. Anton35, M. Ardid36, J.-J. Aubert37, T. Avgitas38, B. Baret38,
J. Barrios-Martí39, S. Basa40, B. Belhorma41,
V. Bertin37,
S. Biagi42, R. Bormuth43,44, S. Bourret38, M.C. Bouwhuis43,
H. Brânzaş45,
R. Bruijn43,46, J. Brunner37,
J. Busto37,
A. Capone47,48, L. Caramete45, J. Carr37,
S. Celli47,48,49, R. Cherkaoui El Moursli50,
T. Chiarusi51, M. Circella52, J.A.B. Coelho38, A. Coleiro38,39,
R. Coniglione42,
H. Costantini37,
P. Coyle37,
A. Creusot38,
A. F. Díaz53,
A. Deschamps54, G. De Bonis47,48,
C. Distefano42,
I. Di Palma47,48,
A. Domi,34,55
C. Donzaud38,56, D. Dornic37,
D. Drouhin32,
T. Eberl35,
I. El Bojaddaini57, N. El Khayati50,
D. Elsässer58, A. Enzenhöfer37,
A. Ettahiri50,
F. Fassi50,
I. Felis36,
L.A. Fusco51,59, P. Gay60,38, V. Giordano61, H. Glotin62,63, T. Gregoire38, R. Gracia-Ruiz38,
K. Graf35,
S. Hallmann35,
H. van Haren64, A.J. Heijboer43,
Y. Hello54,
J.J. Hernández-Rey39,
J. Hößl35,
J. Hofestädt35,
C. Hugon34,59, G. Illuminati39,
C.W. James35,
M. de Jong43,44,
M. Jongen43,
M. Kadler58,
O. Kalekin35,
U. Katz35,
D. Kießling35,
A. Kouchner38,63, M. Kreter58,
I. Kreykenbohm65, V. Kulikovskiy37,66, C. Lachaud38,
R. Lahmann35,
D. Lefèvre67, E. Leonora61,68, S. Loucatos69,38,
M. Marcelin40,
A. Margiotta51,59,
A. Marinelli70,71, J.A. Martínez-Mora36,
R. Mele72,73,
K. Melis43,46,
T. Michael43,
P. Migliozzi72, A. Moussa57, S. Navas74,
E. Nezri40,
M. Organokov75,
G.E. Păvălaş45,
C. Pellegrino51,59,
C. Perrina47,48,
P. Piattelli42,
V. Popa45,
T. Pradier75, L. Quinn37, C. Racca32,
G. Riccobene42,
A. Sánchez-Losa52, M. Saldaña36,
I. Salvadori37, D. F. E. Samtleben43,44,
M. Sanguineti34,55,
P. Sapienza42,
F. Schüssler69,
C. Sieger35,
M. Spurio51,59,
Th. Stolarczyk69,
M. Taiuti34,55,
Y. Tayalati50,
A. Trovato42,
D. Turpin37,
C. Tönnis39,
B. Vallage69,38,
V. Van Elewyck38,63,
F. Versari51,59,
D. Vivolo72,73,
A. Vizzocca47,48, J. Wilms65,
J.D. Zornoza39,
J. Zúñiga39
1Centre for Astrophysics and Supercomputing, Swinburne University of Technology, Mail H30, PO Box 218, VIC 3122, Australia
2ARC Centre of Excellence for All-sky Astrophysics (CAASTRO)
3CSIRO Astronomy Space Science, Australia Telescope National Facility, P.O. Box 76, Epping, NSW 1710, Australia
4SKA Organisation, Jodrell Bank Observatory, Cheshire, SK11 9DL, UK
5ASTRON, The Netherlands Institute for Radio Astronomy, Postbus 2, 7990 AA Dwingeloo, The Netherlands
6National Radio Astronomy Observatory, 1003 Lopezville Rd., Socorro, NM 87801, USA
7Department of Physics and Astronomy, West Virginia University, P.O. Box 6315, Morgantown, WV 26506, USA; Center for Gravitational Waves and Cosmology, West Virginia University, Chestnut Ridge Research Building, Morgantown, WV 26505
8Australian Astronomical Observatory, 105 Delhi Rd, North Ryde, NSW 2113, Australia.
9Max Planck Institut für Radioastronomie, Auf dem Hügel 69, D-53121 Bonn, Germany
10International Centre for Radio Astronomy Research, Curtin University, Bentley, WA 6102, Australia
11INAF-Osservatorio Astronomico di Cagliari, Via della Scienza 5, I-09047 Selargius (CA), Italy.
12Research School of Astronomy and Astrophysics, Australian National University, ACT, 2611, Australia
13National Centre for Radio Astrophysics, Tata Institute of Fundamental Research, Pune University Campus, Ganeshkhind, Pune 411 007, India
14Department of Physics and Astronomy, University of Sheffield, Sheffield S3 7RH, UK
15Jodrell Bank Centre for Astrophysics, University of Manchester, Alan Turing Building, Oxford Road, Manchester M13 9PL, United Kingdom
16Fakultät fur Physik, Universität Bielefeld, Postfach 100131, D-33501 Bielefeld, Germany
17Institute for Radio Astronomy and Space Research, Auckland University of Technology, 120 Mayoral Drive, Auckland 1010, New Zealand
18University of British Columbia,2329 West Mall, Vancouver, BC V6T 1Z4, Canada
19Konan University, 8-9-1 Okamoto, Higashinada Ward, Kobe, Hyogo Prefecture 658-0072, Japan
20University of Tokyo, 7 Chome-3-1 Hongo, Bunkyo, Tokyo 113-8654, Japan
21School of Physics, University of Western Australia, M013, Crawley WA 6009, Australia
22Université de Toulouse; UPS-OMP; IRAP; Toulouse, France
23CNRS; IRAP; 14, avenue Edouard Belin, F-31400 Toulouse, France
24International Centre for Radio Astronomy Research, M468, The University of Western Australia, Crawley, WA 6009, Australia
25Subaru Telescope, National Astronomical Observatory of Japan, 650 North A‘ohoku Place, Hilo, HI 96720, USA
26National Astronomical Observatory of Japan, 2-21-1 Osawa, Mitaka, Tokyo 181-8588, Japan
27Instituto de Astrof‘õsica de Canarias, E-38205 La Laguna, Tenerife, Spain
28Department of Physics, University of Warwick, Coventry CV4 7AL, UK
29Center for Advanced Instrumentation, Department of Physics, University of Durham, South Road, Durham DH1 3LE, UK
30National Astronomical Research Institute of Thailand, 191 Siriphanich Building, Huay Kaew Road, Chiang Mai 50200, Thailand
31 Kavli Institute for the Physics and Mathematics of the Universe (WPI), The University of Tokyo, 5-1-5 Kashiwanoha, Kashiwa, Chiba 277-8583, Japan
32GRPHE - Université de Haute Alsace - Institut universitaire de technologie de Colmar, 34 rue du Grillenbreit BP 50568 - 68008 Colmar, France
33Technical University of Catalonia, Laboratory of Applied Bioacoustics, Rambla Exposició, 08800 Vilanova i la Geltrú, Barcelona, Spain
34INFN - Sezione di Genova, Via Dodecaneso 33, 16146 Genova, Italy
35Friedrich-Alexander-Universität Erlangen-Nürnberg, Erlangen Centre for Astroparticle Physics, Erwin-Rommel-Str. 1, 91058 Erlangen, Germany
36Institut d’Investigació per a la Gestió Integrada de les Zones Costaneres (IGIC) - Universitat Politècnica de València. C/ Paranimf 1, 46730 Gandia, Spain
37Aix Marseille Univ, CNRS/IN2P3, CPPM, Marseille, France
38APC, Univ Paris Diderot, CNRS/IN2P3, CEA/Irfu, Obs de Paris, Sorbonne Paris Cité, France
39IFIC - Instituto de Física Corpuscular (CSIC - Universitat de València) c/ Catedrático José Beltrán, 2 E-46980 Paterna, Valencia, Spain
40LAM - Laboratoire d’Astrophysique de Marseille, Pôle de l’Étoile Site de Château-Gombert, rue Frédéric Joliot-Curie 38, 13388 Marseille Cedex 13, France
41National Center for Energy Sciences and Nuclear Techniques, B.P.1382, R. P.10001 Rabat, Morocco
42INFN - Laboratori Nazionali del Sud (LNS), Via S. Sofia 62, 95123 Catania, Italy
43Nikhef, Science Park, Amsterdam, The Netherlands
44Huygens-Kamerlingh Onnes Laboratorium, Universiteit Leiden, The Netherlands
45Institute for Space Science, RO-077125 Bucharest, Măgurele, Romania
46Universiteit van Amsterdam, Instituut voor Hoge-Energie Fysica, Science Park 105, 1098 XG Amsterdam, The Netherlands
47INFN - Sezione di Roma, P.le Aldo Moro 2, 00185 Roma, Italy
48Dipartimento di Fisica dell’Università La Sapienza, P.le Aldo Moro 2, 00185 Roma, Italy
49Gran Sasso Science Institute, Viale Francesco Crispi 7, 00167 L’Aquila, Italy
50University Mohammed V in Rabat, Faculty of Sciences, 4 av. Ibn Battouta, B.P. 1014, R.P. 10000
Rabat, Morocco
51INFN - Sezione di Bologna, Viale Berti-Pichat 6/2, 40127 Bologna, Italy
52INFN - Sezione di Bari, Via E. Orabona 4, 70126 Bari, Italy
53Department of Computer Architecture and Technology/CITIC, University of Granada, 18071 Granada, Spain
54Géoazur, UCA, CNRS, IRD, Observatoire de la Côte d’Azur, Sophia Antipolis, France
55Dipartimento di Fisica dell’Università, Via Dodecaneso 33, 16146 Genova, Italy
56Université Paris-Sud, 91405 Orsay Cedex, France
57University Mohammed I, Laboratory of Physics of Matter and Radiations, B.P.717, Oujda 6000, Morocco
58Institut für Theoretische Physik und Astrophysik, Universität Würzburg, Emil-Fischer Str. 31, 97074 Würzburg, Germany
59Dipartimento di Fisica e Astronomia dell’Università, Viale Berti Pichat 6/2, 40127 Bologna, Italy
60Laboratoire de Physique Corpusculaire, Clermont Université, Université Blaise Pascal, CNRS/IN2P3, BP 10448, F-63000 Clermont-Ferrand, France
61INFN - Sezione di Catania, Viale Andrea Doria 6, 95125 Catania, Italy
62LSIS, Aix Marseille Université CNRS ENSAM LSIS UMR 7296 13397 Marseille, France; Université de Toulon CNRS LSIS UMR 7296, 83957 La Garde, France
63Institut Universitaire de France, 75005 Paris, France
64Royal Netherlands Institute for Sea Research (NIOZ) and Utrecht University, Landsdiep 4, 1797 SZ ’t Horntje (Texel), the Netherlands
65Dr. Remeis-Sternwarte and ECAP, Universität Erlangen-Nürnberg, Sternwartstr. 7, 96049 Bamberg, Germany
66Moscow State University, Skobeltsyn Institute of Nuclear Physics, Leninskie gory, 119991 Moscow, Russia
67Mediterranean Institute of Oceanography (MIO), Aix-Marseille University, 13288, Marseille, Cedex 9, France; Université du Sud Toulon-Var, CNRS-INSU/IRD UM 110, 83957, La Garde Cedex, France
68Dipartimento di Fisica ed Astronomia dell’Università, Viale Andrea Doria 6, 95125 Catania, Italy
69Direction des Sciences de la Matière - Institut de recherche sur les lois fondamentales de l’Univers - Service de Physique des Particules, CEA Saclay, 91191 Gif-sur-Yvette Cedex, France
70INFN - Sezione di Pisa, Largo B. Pontecorvo 3, 56127 Pisa, Italy
71Dipartimento di Fisica dell’Università, Largo B. Pontecorvo 3, 56127 Pisa, Italy
72INFN - Sezione di Napoli, Via Cintia 80126 Napoli, Italy
73Dipartimento di Fisica dell’Università Federico II di Napoli, Via Cintia 80126, Napoli, Italy
74Dpto. de Física Teórica y del Cosmos & C.A.F.P.E., University of Granada, 18071 Granada, Spain
75Université de Strasbourg, CNRS, IPHC UMR 7178, F-67000 Strasbourg, France