From radio-quiet to radio-silent: low luminosity Seyfert radio cores
Abstract
A strong effort has been devoted to understand the physical origin of radio emission from low-luminosity AGN (LLAGN), but a comprehensive picture is still missing. We used high-resolution (arcsec), multi-frequency (1.5, 5.5, 9 and 14 GHz) NSF’s Karl G. Jansky Very Large Array (VLA) observations to characterise the state of the nuclear region of ten Seyfert nuclei, which are the faintest members of a complete, distance-limited sample of 28 sources. With the sensitivity and resolution guaranteed by the VLA-A configuration, we measured radio emission for six sources (NGC3185, NGC3941, NGC4477, NGC4639, NGC4698 and NGC4725), while for the remaining four (NGC0676, NGC1058, NGC2685 and NGC3486) we put upper limits at tens Jy beam-1 level, below the previous Jy beam-1level of Ho Ulvestad (2001), corresponding to luminosities down to W Hz-1 at 1.5 GHz for the highest RMS observation. Two sources, NGC4639 and NGC4698, exhibit spectral slopes compatible with inverted spectra (0, ), hint for radio emission from an optically-thick core, while NGC4477 exhibits a steep (+0.520.09) slope. The detected sources are mainly compact on scales arcseconds, predominantly unresolved, except NGC3185 and NGC3941, in which the resolved radio emission could be associated to star-formation processes. A significant X-ray - radio luminosities correlation is extended down to very low luminosities, with slope consistent with inefficient accretion, expected at such low Eddington ratios. Such sources will be one of the dominant Square Kilometre Array (SKA) population, allowing a deeper understanding of the physics underlying such faint AGN.
keywords:
galaxies: active - galaxies: nuclei - galaxies: Seyfert - radio continuum: galaxies - X -rays: galaxies1 Introduction
There has been increasing evidence in literature that radio-quiet Active Galactic Nuclei (AGN) are radio emitters at some level (e.g. Ho & Ulvestad, 2001; Nagar et al., 2000). Several works (e.g. Ho & Ulvestad, 2001; Nagar et al., 2000; Giroletti & Panessa, 2009; Panessa & Giroletti, 2013; Baldi et al., 2018) have been dedicated to understand the physical origin of radio emission in Low-Luminosity AGN (LLAGN), a category comprising low-luminosity Seyferts, LINERs and transition nuclei (Nagar et al., 2000), and defined as AGN with 1040 ergs s-1 by Ho et al. (1997a). Although differences between the two classes can be found in the X-ray and radio bands, they share some properties, e.g. the absence of a Big Blue Bump in the Optical/UV, which clearly make them distinguishable from the classical Seyferts and Quasars (Ho, 2008). The faintness of their radio emission (radio luminosities between 1032 and 1040 ergs s-1, Baldi et al., 2018) requires high-sensitivity observations to carry out a robust study. LLAGN often show flat-spectrum radio cores, usually explained in terms of free-free emission/absorption or Advection-Dominated Accretion Flow (ADAF, Narayan & Yi, 1994), synchrotron self-absorbed emission from a scaled-down version of a more powerful AGN jet (e.g. Falcke & Biermann, 1999; Nagar et al., 2000), possibly coupled with an ADAF (Falcke & Markoff, 2000), or a standard thin accretion disk (Ghisellini et al., 2004). A flat spectrum is also observed from Star-Forming (SF) regions, accompanied by diffuse and low surface brightness emission (Orienti & Prieto, 2010). Synchrotron emission from shocked regions in low collimated outflows has been claimed as the origin of radio emission in quasar (Zakamska & Greene, 2014) and, in a few cases, the outflow structure has been mapped at high resolution in the local Universe (Kharb et al., 2006).
Observations with very-long baseline interferometry (VLBI) have established the occurrence of compact cores in a fraction of LLAGN (e.g. Anderson & Ulvestad, 2005; Wrobel & Ho, 2006) down to milli-arcseconds (mas) scales, with high brightness temperatures (108 K), and extended features resembling jet-like outflows (e.g. Falcke et al., 2000; Bontempi et al., 2012). High brightness temperature coupled with flat-spectrum radio cores at mas scales have been interpreted as signatures of non-thermal synchrotron self-absorbed (SSA) emission originating from the base of a jet. However, some high-resolution observations led to different conclusions, like in the case of NGC 1068 and NGC 4477, in which the nuclear radio emission has been attributed to thermal free-free emission from an X-ray heated corona (Gallimore et al., 2004; Bontempi et al., 2012).
In the last two decades, a strong effort has been devoted to the understanding of the origin of the radio emission (that typically traces the ejected material) and its relation to the X-ray emission (tracing the disc corona accreting system) in black holes at different luminosity levels, leading to the formulation of the ’Fundamental Plane’ of black-hole activity (Merloni et al., 2003; Falcke et al., 2004), suggesting a disk-jet coupling from low to high mass black holes. Moreover, Panessa et al. (2007) found a correlation between the nuclear keV X-ray luminosity and radio luminosity (at 2, 6 and 20 cm) for a number of local Seyfert galaxies, suggesting again a strong physical coupling. These relations are interesting in light of a possible AGN - X-ray binaries (XRB) analogy. According with this analogy LLAGN, similarly to ’hard state’ XRB, would follow an inefficient accretion track (e.g. Falcke et al., 2004). This analogy has been suggested by Gu & Cao (2009) for a sample of LINERs and local Seyferts and, more recently, by Panessa & Giroletti (2013), who found a slope for the X-ray - radio luminosity relation comparable with the 0.7 found by Gallo et al. (2003) in low-hard state XRBs for a sample of local Seyfert galaxies.
In spite of the hints provided by the above mentioned efforts, however, a conclusive picture has not emerged, yet. Moreover, a number of LLAGN have remained undetected (e.g. Ho & Ulvestad, 2001), posing intriguing questions about the nature of their nuclei. In this work we present multi-frequency NSF’s Karl G. Jansky Very Large Array (VLA) observations for ten Seyfert galaxies belonging to the complete, distance limited sample of Cappi et al. (2006), refined by Panessa & Giroletti (2013), for which radio nuclei were not detected in previous radio studies. For these ten sources, we take advantage of the improved sensitivity of the upgraded VLA, reaching lower flux limits thanks to a sensitivity level as low as 27 Jy beam-1(3), characterising their radio spectra and the morphology of the radio emission. Having completed the radio information for the whole sample of Cappi et al. (2006), we provide detection rates and investigate the correlation between the X-ray and radio luminosity down to very low regimes.
The paper is organised as follows. In Section 2, we introduce the sample used for our analysis; in Section 3, we describe the observations and the data reduction procedure; in Section 4, we show the results obtained in the data analysis; in Section 5, we discuss the results and in Section 6 we summarise our findings and considerations.
Throughout the paper, we use a flat CDM cosmological model with =0.3, 0.7 and a Hubble constant of 70 km s-1 Mpc-1 (Bennett et al., 2003).
2 The Sample
| Name | RA | Dec | Seyfert Type | Distance |
|---|---|---|---|---|
| (J2000) | (J2000) | (Mpc) | ||
| (1) | (2) | (3) | (4) | (5) |
| NGC 676 | 01 48 57.38 0.11 | +05 54 25.7 1.7 | S2: | 19.5 |
| NGC 1058 | 02 43 30.24 0.22 | +37 20 27.2 2.6 | S2 | 9.1 |
| NGC 2685 | 08 55 34.79 0.39 | +58 44 01.6 3.1 | S2/T2: | 16.2 |
| NGC 3185 | 10 17 38.66 0.12 | +21 41 17.2 1.7 | S2: | 21.3 |
| NGC 3486 | 11 00 24.10 0.20 | +28 58 31.6 2.7 | S2 | 7.4 |
| NGC 3941 | 11 52 55.42 0.21 | +36 59 10.5 2.5 | S2: | 12.2 |
| NGC 4477 | 12 30 02.22 0.18 | +13 38 11.3 2.6 | S2 | 16.8 |
| NGC 4639 | 12 42 52.36 0.03 | +13 15 26.5 0.1 | S1 | 22.9 |
| NGC 4698 | 12 48 22.98 0.16 | +08 29 14.8 2.4 | S2 | 16.8 |
| NGC 4725 | 12 50 26.69 0.16 | +25 30 02.3 2.2 | S2: | 13.2 |
In this work we present results of VLA A-configuration observations for a group of ten Seyferts (’Reference sample’, Table 1), nine Type 2 and one Type 1, the faintest members of the sample of 28 Seyfert galaxies in Cappi et al. (2006) (’Parent sample’). Indeed, the sources in the Reference Sample are characterised by an average Eddington ratio -5.6, nearly an order of magnitude lower than the average Eddington ratio for the Parent sample (). However, the original sample was initially constituted by only 27 sources: NGC 3982 was excluded because of lack of XMM-Newton observations. Panessa & Giroletti (2013) updated the sample to 28 galaxies including NGC 3982. This last sample, which we will call ’Parent sample’, is complete and distance limited (D23 Mpc) and sources have been chosen as the nearest ones in the optically selected sample of 52 Seyfert galaxies given in Ho et al. (1997a), that was extracted from the Palomar optical spectroscopic survey of nearby galaxies (Filippenko & Sargent, 1985; Ho et al., 1995), comprising 486 northern (>) galaxies provided with homogeneous spectral classification (Ho et al., 1997a). This sample is complete to 12.0 mag and 80 per cent complete to 12.5 mag (Sandage et al., 1979), and it has also other several advantages, concerning selection biases and the wide range of radio luminosities, see Ho & Ulvestad (2001) for a deeper discussion.
Recently, Baldi et al. (2018), in their LeMMINGs 1.5-GHz parsec-scale survey, have revised the optical classification of Ho et al. (1997b) using the spectroscopic diagnostic diagrams based on criteria by Kewley et al. (2006) and Buttiglione et al. (2010). The basic difference in this classification is in the transition from Seyferts to LINERs, as low Seyferts are classified as LINERs, and the use of a more stable index, which is the average of low-ionisation line ratios. Moreover, they removed the ’Transition Galaxies’ class (for the details see Baldi et al., 2018). We reconsidered the Parent and Reference sample optical classification in the light of the revised classification of Baldi et al. (2018) finding that approximately 40 per cent of sources in the Parent sample (11/28) can be classified as LINERs, and the same percentage holds if we select only the Reference sample (4/10), i.e., NGC 3941, NGC 1058, NGC 4477 and NGC 4639. Note however, that these objects populate a region very close to the Seyferts/LINERS boundaries. Considering the related uncertainties, we prefer to keep the Seyfert classification, in order to be consistent with previous works of our group and literature (e.g. Panessa & Giroletti, 2013).
The Palomar sample has been the subject of extensive observational campaigns, through VLA (e.g. Nagar et al., 2000, 2005; Ho & Ulvestad, 2001), VLBI (e.g. Falcke et al., 2000; Nagar et al., 2005; Panessa & Giroletti, 2013) and, more recently, of the LeMMINGs 1.5-GHz parsec-scale survey (Baldi et al., 2018, D. R. A. Williams’ thesis) and the 15-GHz survey performed by Saikia et al. (2018).
In particular, Ho & Ulvestad (2001) conducted a radio continuum survey at 6 and 20 cm with the VLA (in configuration B and A, respectively) at 1 arcsec resolution for the sample of 52 Seyfert galaxies in Ho et al. (1997a). They detected radio emission in the 85 per cent of cases at 6 cm and in the 71 per cent at 20 cm for the whole sample, but when considering the subsample of 28 sources in the Parent sample, the VLA detection rates are 82 and 64 per cent at 6 and 20 cm, respectively (Panessa & Giroletti, 2013). The morphology is predominantly compact on arcseconds scales, either unresolved or slightly resolved, and the nuclear spectral indices range from steep to flat/inverted. Among the sources of the reference sample listed in Table 1, five, namely NGC 0676, NGC 1058, NGC 2685, NGC 3486 and NGC 4725 have not been detected by Ho & Ulvestad (2001) at the 3 sensitivity threshold of 0.120.14 Jy beam-1at either 20 or 6 cm. The remaining sources have not been detected at 20 cm, at 6 cm they are considered marginal detections, as they have peak intensities of 3.56, and their morphology is classified as ambiguous.
At very-long baseline interferometry (VLBI) milli-arcseconds scales, Giroletti & Panessa (2009) analysed five sources, NGC 4051, NGC 4388, NGC 4501, NGC 5033 and NGC 5273, among the sources in the Parent sample, detecting radio emission at 100 Jy beam-1level, except for NGC 5273, with physical parameters consistent with different underlying physical processes. Bontempi et al. (2012) performed a dual-frequency, 1.7 and 5 GHz, analysis with the European VLBI Network (EVN) of the faintest Seyferts nuclei in the Parent sample. They did not detect radio emission at the 3 sensitivity level of 20-120 Jy beam-1for the four sources NGC 3185, NGC 3941, NGC 4639 and NGC 4698 which have been identified by Ho & Ulvestad (2001) as marginal detections. Only NGC 4477 has been detected at 5 GHz, although with a low significance, exhibiting flux density compatible with that quoted by Ho & Ulvestad (2001), and physical parameters which would rule out synchrotron self-absorption (SSA) as emission mechanism in favour of thermal free-free emission.
Moreover, Panessa & Giroletti (2013) conducted a census of physical properties of these 28 galaxies using published VLA data (at 20 and 6 cm, mostly from Ho & Ulvestad 2001) and new and published VLBI data (at 20 and 6 cm) for 23/28 galaxies. They found that the brightness temperature as derived from VLBI observations is higher, on average, in type 1 than in type 2, and this evidence has been interpreted as hint for a free-free domination in type 2. They also found that there is a significant radio-X-rays luminosity relation when considering VLA scales, but at VLBI scales they did not find any correlation.
In the present work we present new VLA - configuration A observations for the ten faintest members of the Cappi et al. (2006) sample (’Reference sample’) and, coupled with previous data available for the remaining sources in the Cappi et al. (2006) sample, we will establish for the first time, radio detection rates for a complete, distance limited sample of nearby Seyfert galaxies with homogeneous observations.
3 Observations and Data Reduction
| Calibrators | |||
| Target | Obs Date | Flux | Phase |
| (dd/mm/yy) | |||
| (1) | (2) | (3) | (4) |
| NGC 0676 | 09/11/12 | 3C48 | J0149+0555 |
| NGC 1058 | 09/11/12 | 3C48 | J0230+4032 |
| NGC 2685 | 05/01/13 | 3C286 | J0854+5757 |
| NGC 3185 | 05/01/13 | 3C286 | J1014+2301 |
| NGC 3486 | 30/12/12 | 3C286 | J1102+2757 |
| NGC 3941 | 30/12/12 | 3C286 | J1146+3958 |
| NGC 4477 | 17/12/12 | 3C286 | J1254+1141 |
| NGC 4639 | 17/12/12 | 3C286 | J1254+1141 |
| NGC 4698 | 17/12/12 | 3C286 | J1239+0730 |
| NGC 4725 | 17/12/12 | 3C286 | J1221+2813 |
| L-band | C-band | X-band | Ku-band | |||||
|---|---|---|---|---|---|---|---|---|
| Target | Time | Time | Time | Time | ||||
| (min) | (Jy beam-1) | (min) | (Jy beam-1) | (min) | (Jy beam-1) | (min) | (Jy beam-1) | |
| NGC 0676 | 6 | 25 | 7 | 9 | 8 | 9 | 8 | 11 |
| NGC 1058 | 6 | 25 | 7 | 9 | 8 | 9 | 8 | 11 |
| NGC 2685 | 6 | 25 | 6 | 10 | 8 | 9 | 8 | 11 |
| NGC 3185 | 6 | 25 | 6 | 10 | 8 | 9 | 8 | 11 |
| NGC 3486 | 6 | 25 | 7 | 9 | 8 | 9 | 8 | 11 |
| NGC 3941 | 8 | 20 | 8 | 9 | 8 | 9 | 8 | 11 |
| NGC 4477 | 8 | 20 | 8 | 9 | 8 | 9 | 10 | 10 |
| NGC 4639 | 8 | 20 | 8 | 9 | 8 | 9 | 10 | 10 |
| NGC 4698 | 6 | 25 | 7 | 9 | 8 | 9 | 8 | 11 |
| NGC 4725 | 6 | 25 | 7 | 9 | 8 | 9 | 8 | 11 |
A total of 10 hours of observations, divided over 4 days in November, December 2012 and January 2013, were obtained with the VLA in A array configuration. The ten targets of the Reference sample were observed in five groups, with 2 hours dedicated to each group. Table 2 lists the observations, sub-divided by group (based upon observing date).
The observations were conducted in L (1.5 GHz), C (5.5 GHz), X (9 GHz) and Ku (14 GHz) bands, and each source has been observed for a total of 32 minutes, while the flux density calibrator has been observed for a total of 18 minutes per group. The scheduling blocks have been organised as follows. For a single observing block, the observations at different frequencies have been switched from one source to the other, in order to optimise the (u,v) plane coverage. Therefore, the exposure time of a source at a certain frequency have been split into several scans, each one bracketed by the observation of the phase calibrators, which are thus observed every 2-3 min depending on the scheduling block.
Table 3 lists, for each source and for each frequency, the Time-On-Source (TOS) together with the expected theoretical sensitivity. The total observing bandwidths were 1024 MHz for L band, while 2048 MHz were used for the C, X and Ku bands. All bands were subdivided into 16 spectral windows of 64 channels.
The data calibration and reduction were performed using the Common Astronomy Software Applications (casa 5.3.0 version, McMullin et al. 2007). The full, unaveraged datasets (five in total) were downloaded from the NRAO science data archive111https://archive.nrao.edu/archive/archiveproject.jsp as SDM-BDF datasets with flags generated during the observations applied. Each dataset contained the calibrators (flux, phase and bandpass) and two targets for the four frequency bands. The calibration was performed using the casa calibration pipeline 5.1.1-5. After calibration, the resulting plots of the calibrators were inspected for RFI and the different bands were split into separate MS files.
Since the observations covered wide bandwidths, the calibrators were imaged using the multi-frequency synthesis (mfs) algorithm (Conway et al., 1990; Rau & Cornwell, 2011), with nterms=2. The integrated flux densities of the flux calibrators (3C48 dataset 1, and 3C286 all other datasets) were measured using the casa task imfit, and compared to the modelled flux densities given by Perley & Butler (2013). All measured flux densities were found to be within the 5 per cent of the tabulated flux densities, so we adopted an average 5 per cent flux calibration error. The accuracy of phase calibrators is typically of order of 1 mas, so our estimates of radio positions in the four bands are dominated by uncertainties associated to the estimation of the peak of elliptical gaussian fit performed by the casa task imfit.
We adopted different imaging strategies for the L-band and for the C, X and Ku bands, performed using the casa task, tclean.
For the L-band data, we used the deconvolution procedure of Högbom (1974) in tclean with image size of 8192 pixels (0.26 arcsec per pixel); we adopted wide-imaging technique w-projection in order to take into account the non-coplanarity of baselines and we applied a primary-beam correction in a non-interactive mode. The L-band maps have then been visually inspected and, in cases in which artifacts were still present due to outlier sources, we rerun the clean algorithm with outliers field in an interactive mode. The position of the outliers have been checked via the FIRST Survey222Faint Images of the Radio Sky at Twenty cm (Becker et al., 1995).
Considering the C, X and Ku bands, each target field has been imaged in tclean using a multi-term, multi-frequency synthesis algorithm (with nterms=2) and image size of 2048 pixels (0.07, 0.04 and 0.03 arcsec per pixel for C, X and Ku bands, respectively). As before, in cases in which artifacts in final maps were still present, we rerun the clean algorithm with outliers field.
In all the four frequency bands, initial imaging of each target field has been performed using the full array angular resolution (i.e. no tapering), with Briggs (Briggs, 1995) weighting with robust parameter equal to 0.5.
The positions, peak intensities, integrated flux densities, deconvolved sizes and position angle (PA) of the sources were estimated by fitting a two-dimensional Gaussian in the image plane via the casa task imfit. We determined the rms noise of each map from a source-free annular region around the source. The resulting average RMS in the four bands is approximately 40, 12, 10 and 9 Jy beam-1in the L, C, X and Ku bands, respectively. The uncertainty in the final flux density measurements are affected by fitting errors from imfit, and flux calibration error of 5 per cent, which are added in quadrature and adopted as the error measurements. The positional accuracy of the detected radio nuclei is limited by the positional accuracy of the phase calibrators, typically few mas, and by the accuracy of the gaussian fit to the source brightness distribution as performed by imfit. The uncertainty on radio position expressed in columns 8 and 9 in Table 4 is therefore the sum in quadrature of the two contributions.
4 Results
Target Band Ftotal Fpeak P.A. (1) (2) (3) (4) (5) (6) (7) (8) (8) NGC0676 L 89 267 C 18 54 X 10.5 31.5 Ku 9 27 NGC1058 L 32 96 C 11 33 X 9 27 Ku 9 27 NGC2685 L 36 108 C 11 33 X 9 27 Ku 9.5 28.5 NGC3185 L 9250470 113096 5.053.8 C 16 3240160 58348 3.73.5 X 14 66847 11634 3.71.9 Ku 10 30 NGC3486 L 34 102 C 10 30 X 8 24 Ku 9 27 NGC3941 L 30 32070 22130 1.500.590.120.56 12028 11:52:55.3970.149 +36.59.10.8540.073 C 11 4616 549 <0.80.55 11:52:55.3640.161 +36.59.10.8610.05 X 12 36 Ku 14 <42 NGC4477 L 44 21076 20942 0.60 0.5 12:30:02.230.141 +13.38.11.6860.085 C 10 9115 727 0.17 0.15 12:30:02.1970.017 +13.38.11.5460.018 X 9 679 845 0.10 0.09 12:30:02.1950.004 +13.38.11.5700.004 Ku 8 619 937 0.07 0.06 12:30:02.1960.003 +13.38.11.5470.003 NGC4639 L 27 35355 30328 0.60 0.56 12:42:52.3800.057 +13.15.26.7350.044 C 10 40417 39310 0.170.15 12:42:52.3780.003 +13.15.26.7300.004 X 9 48815 4779 0.10 0.09 12:42:52.3780.002 +13.15.26.7350.002 Ku 8 58613 6108 0.07 0.06 12:42:52.3790.001 +13.15.26.7340.001 NGC4698 L 38 15053 11933 0.78 0.58 12:48:22.9020.167 +08.29.14.7110.047 C 10 23817 24110 0.21 0.15 12:48:22.9100.008 +08.29.14.6670.006 X 9 25915 2759 0.13 0.10 12:48:22.9090.003 +08.29.14.6730.003 Ku 9 25816 2679 0.08 0.06 12:48:22.9090.003 +08.29.14.6640.002 NGC4725 L 39 117 C 11 6615 8410 0.18 0.15 12:50:26.5700.016 +25.30.02.6910.014 X 9 11814 1339 0.10 0.10 12:50:26.5690.007 +25.30.02.7490.004 Ku 8 8111 1058 0.07 0.06 12:50:26.5690.005 +25.30.02.7480.003
We detected radio emission in six out of ten sources: NGC 3185, NGC 3941, NGC 4477, NGC 4639, NGC 4698 and NGC 4725. Images of the detected sources (contours and coloured maps) are shown in Figs 5 - 10. A source is considered detected if the peak intensity is . However, a source exhibiting a peak intensity 3 is considered as marginal detection, following the same criterion as in Ho & Ulvestad (2001). Following this criterion, the detection rates are 5/10 in the L-band (with NGC 4477 and NGC 4698 as marginal detections), 6/10 in the C-band (with NGC 3941 as marginal detection), 5/10 in the X band (with NGC 3185 as marginal detection) and 4/10 in Ku band.
As can be seen from images shown in Figs 5 - 10, four out of six sources (NGC 4477, NGC 4639, NGC 4698 and NGC 4725) are are not resolved in our VLA observations, and for them we could only set an upper limit to their sizes which correspond to half of the beam size, in analogy with Ho & Ulvestad (2001).
Four sources, NGC 0676, NGC 1058, NGC2685 and NGC 3486, have not been detected at any wavelength at 3 sensitivity thresholds ranging from 270 Jy beam-1in L-band down to 27 Jy beam-1in Ku band, and in these cases we provide upper limits on peak intensities defined as three times the rms noise.
Initially, we detected NGC 3185 and NGC 3941 only in the L-Band (at 1.5 GHz), with un-tapered maps exhibiting diffuse radio emission (see Figs. 5 and 6). In order to further investigate this issue, the C, X and Ku datasets of these sources have been re-imaged with a uv-taper equal to the L-band clean beam size (via the parameter uvtaper with sub-parameter outertaper=[’1.21arcsec’,’1.15arcsec’,’-74.63deg’] in tclean), applied to match their respective L-band observation. This has been done in order to be more sensitive to the extended radio emission. Then, the final uv-tapered images have been smoothed to the final resolution of the L-band beam (via the restoringbeam parameter of the casa task tclean). In the case of NGC 3941, which is fainter with respect to NGC 3185, we used a briggs weighting with robust parameter equal to 2: this value ensures that the weighting is close to a natural weighting. Natural weighting guarantees a better surface brightness sensitivity but degraded resolution, and for this reason it is more appropriate when considering diffuse emission. We have thus recovered radio emission in C band for NGC 3185 and NGC 3941 at a level above 5, and radio emission in NGC 3185 in X band at a level 3.5 (images are shown in Figs. 5 and 6).
In the case of NGC 3185, in order to estimate source parameters we considered interactively defined boundaries via the casa viewer. The uncertainties associated to peak and integrated flux densities are calculated as , where N is the number of beam areas covered by a source of flux density S, and it is taken into account an uncertainty of 5 per cent in the absolute flux density scale.
In Table 4 we summarise our findings.
4.1 Detection rates
In Table 5 we list the sources belonging to the Parent sample, and in boldface we indicate the sources of the Reference sample, for which we provided new estimates of the parameters based on the new VLA data.
Target D Seyfert Type Hubble Type (Mpc) VLA VLA VLA () (1) (2) (3) (4) (5) (6) (7) (8) (9) (10) (11) NGC 676 19.5 S2: S0/a:spin <35.1 <35.2 40.8 <-5.7 NGC 1058 9.1 S2 Sc <34.2 <34.1 <37.5 -3.35 4.9 -5.4 NGC 1068 14.4 S1.9 Sb 38.8 38.6 42.8 -4.0 0.7 7.2 -2.5 NGC 2685 16.2 S2/T2: SB0+ pec <34.7 <34.7 39.9 -5.2 7.1 -5.3 NGC 3031 3.5 S1.5 Sab 36.8 36.15 40.2 -3.5 -0.16 7.8 -5.6 NGC 3079 17.3 S2 SBc spin 38.2 37.6 42.6 -4.4 -0.18 7.7 -3.13 NGC 3185 21.3 S2: Sbc 40.8 <-0.12 6.1 -3.4 NGC 3227 20.6 S1.5 SABa pec 37.7 37.6 41.7 -4.0 0.82 7.6 -3.9 NGC 3486 7.4 S2 SABc <34.0 <34.0 38.9 <-4.9 6.1 -5.4 NGC 3941 12.2 S2: SB0 34.7 34.7 38.9 -4.2 +1.52 8.2 -7.4 NGC 3982 20.5 S1.9 SABb: 36.7 36.3 41.2 -4.5 0.39 6.1 -3.0 NGC 4051 17.0 S1.2 SABbc 36.6 36.3 41.3 -4.7 0.55 6.1 -2.9 NGC 4138 13.8 S1.9 S0+ 35.6 35.2 41.3 -5.3 -0.32 7.6 -4.6 NGC 4151 20.3 S1.5 SABab: 38.3 38.1 42.5 -4.2 0.6 7.2 -2.8 NGC 4258 7.2 S1.9 SABbc 35.8 35.2 40.9 -5.1 -0.01 7.6 -4.8 NGC 4388 16.7 S1.9 Sb: spin 37.0 36.8 41.7 -4.7 0.69 6.8 -3.2 NGC 4395 2.6 S1 Sm: 34.4 34.2 39.8 -5.4 0.66 5.0 -3.3 NGC 4472 16.7 S2:: E2 37.5 37.2 <39.3 >-1.8 0.42 8.8 -7.6 NGC 4477 16.8 S2 SB0? 35.1 35.0 39.6 -4.5 +0.52 7.9 -6.4 NGC 4501 16.8 S1.9 Sb 36.2 35.9 39.6 -3.4 0.44 7.9 -6.4 NGC 4565 9.7 S1.9 Sb? spin 36.2 35.5 39.4 -3.2 -0.19 7.7 -6.4 NGC 4579 16.8 S1 SABb 37.8 36.9 41.0 -3.2 0.56 7.8 -4.8 NGC 4639 22.9 S1.0 SABbc 36.1 35.4 40.2 -4.1 -0.40 6.9 -4.7 NGC 4698 16.8 S2 Sab 35.6 34.7 39.2 -3.6 -0.13 7.3 -6.2 NGC 4725 13.2 S2: SABab pec 34.9 34.5 38.9 -4.0 <-0.5 7.5 -6.7 NGC 5033 18.7 S1.5 Sc 36.8 36.5 41.1 -4.3 0.51 7.3 -4.3 NGC 5194 8.4 S2 Sbc pec 35.6 35.4 40.9 -5.3 0.6 7.0 -4.14 NGC 5273 16.5 S1.5 S0 36.2 35.9 41.4 -5.2 0.49 6.5 -3.2 Column (1), name of the source; Column (2), distance of the source; Columns (3) and (4); Seyfert and Hubble type; Columns (5) and (6), log VLA 5 and 1.4 GHz peak luminosities in erg/s, respectively; Column (7), log 2-10 keV X-ray luminosity; Column (8), radio-loudness parameter as defined by Terashima & Wilson (2003); Column (9), spectral index defined as ; Column (10), BH mass; Column (11), Eddington ratio. Columns (2), (3), (4), (7) and (10) are taken from Panessa et al. (2006). For NGC 4725 and NGC 3185 we kept the upper limit on spectral index provided by Panessa & Giroletti (2013).
We provide the detection rates at 5 and 1.4 GHz for the Parent sample, together with other average values for relevant quantities, indicated in Table 6. The Parent sample is constituted by 19 type-2 Seyferts and 9 type-1 Seyferts. We found a detection rate at 1.5 GHz of 15/19 (79 per cent) and 9/9 (100 per cent), respectively, while at 5 GHz we found detection rates of 16/19 (84 per cent) for type 2 objects and 9/9 (100 per cent) for type 1 objects. Similar detection rates are obtained when considering detections at both frequencies. The detection rate for the Parent sample at 5 and 1.4 GHz is 24/28 (86 per cent). Indeed, as already shown in Section 4, four sources, namely NGC 0676, NGC 1058, NGC 2685 and NGC 3486 remain undetected at our tens Jy beam-1sensitivity level. Clearly, given the new detections, such rates are higher with respect to Panessa & Giroletti (2013).
All sources in the Parent sample, except NGC 1068, NGC 2685, NGC 3185, NGC 3486, NGC 4477, NGC 4501, NGC 4639, NGC 4698 and NGC 4725, are part of the 15-GHz survey performed by Saikia et al. (2018) at sub-arcsec resolution with the VLA-A configuration. Only five sources, namely NGC 3982, NGC 4051, NGC 4395, NGC 5194 and NGC 5273, have been detected by them, with peak intensities ranging from 0.5 Jy beam-1 (NGC 3982) to 0.17 Jy beam-1 (NGC 4395). If we consider only the Reference sample, the three sources in common, NGC 0676, NGC 1058 and NGC 3941, have not been detected by Saikia et al. (2018) and the upper limits on the peak intensities are in agreement with our limits listed in Table 4.
Target Det rate 1.4 GHz Det rate 5 GHz Det. rate at either freq. flat:steep Full 24/28 (86%) 24/28 (86%) 24/28 (86%) 36.10.3∗ 0.300.10 12:11 -4.400.15∗ Type 1 9/9 (100%) 9/9 (100%) 9/9 (100%) 36.70.4 0.400.13 1:2 -4.30.2 Type 2 15/19 (79%) 16/19 (84%) 15/19 (79%) 35.80.3∗ 0.280.13 9:5 -4.50.2∗ Notes: ∗, cases in which the mean may be ill-defined, see Section 4.2 In the calculation of mean values we neglected NGC 3185; in the calculation of mean radio-loudness parameter we excluded NGC 1058 and NGC 4472, for which we have upper limits on X-ray luminosities. The flat-to-steep threshold for the spectral index is 0.5.
4.2 Radio Spectra
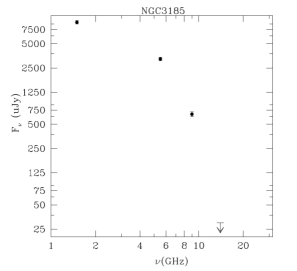
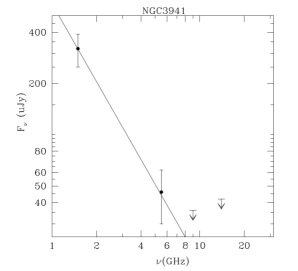
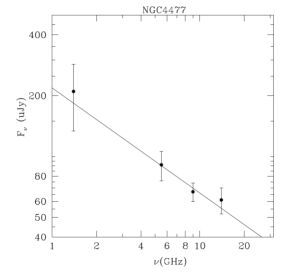
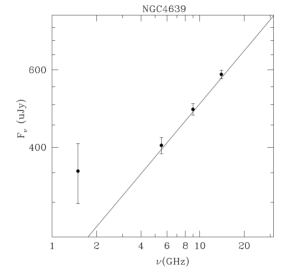
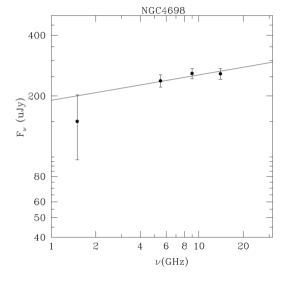
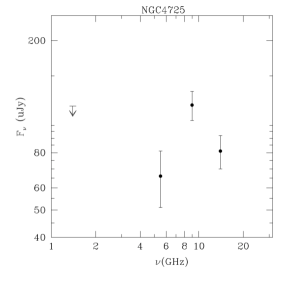
We have built radio spectra for the sources which have been detected in two or more frequencies: NGC 3185, NGC 3941, NGC 4477, NGC 4639, NGC 4698 and NGC 4725 (Fig. 1 - upper limits are represented as arrows), considering all the available data points. We performed a weighted linear least squares fit using the Sci-Py (Jones et al., 01) routine curve_fit, weighting for the uncertainties in the flux densities.
In three cases, NGC 4477, NGC 4639 and NGC 4698, the targets were found to fit a typical power-law to the spectrum333We define a steep spectrum as one having 0.5, and a flat one as 0.5, following Panessa & Giroletti (2013), with . We also define an inverted spectrum as one having 0. For NGC 4639 we considered only the 5.5, 9 and 14 GHz data points, as the 1.5 GHz data point seems to deviate with respect to the power-law behaviour, being probably associated with a different emitting component which dominates at lower frequencies. We found an inverted spectral index for NGC 4639 and NGC 4698 of -0.400.01 and -0.130.07, respectively, and a steep spectral index of +0.520.09 for NGC 4477.
We computed the spectral index also for NGC 3941 with the only two frequency points at 1.4 and 5 GHz, and we found a spectral slope of +1.520.33, in which the uncertainty in the slope has been estimated as , where and are the uncertainties on the flux density and the flux density at the two frequencies (Ho & Ulvestad, 2001). We remark that initially this source was detected only at 1.4 GHz and that we recovered emission at 5 GHz by applying a uv-tapering equal to the L-band clean beam size.
The spectral index for NGC 3185 has not been computed as the radio emission from this source has a complex morphology and it may be due to other components, like star-formation.
In Table 6, we indicate the average values of the slope for the objects in the Parent sample in order to test if there are significant differences between the general population and the type-1 and type-2 sub-populations. We used the routine KMESTM in the Astronomy Survival Analysis software package (ASURV, Isobe et al., 1990; Lavalley et al., 1992), which gives the Kaplan-Meier estimator for the distribution function of a randomly censored sample 444We caution that such averaged values may suffer from statistical biases, in the case in which the lowest value in the sample is an upper limit, for details see the ASURV documentation.. Using the aforementioned Kaplan-Meier estimator, we computed an average spectral index and the flat-to-steep ratio for the full sample and for the type-1-only and type-2-only sub-populations. We find that the Parent sample exhibits a nearly equal number of flat and steep spectral indices (12:11 flat-to-steep ratio), with an average spectral slope compatible with being flat (0.300.10). However, if we consider type 1 and type 2 objects separately, the two mean values in our case are consistent one with each other within errors: 0.400.13 and 0.280.13, respectively.
4.3 The nuclear Radio and X-rays luminosity correlation
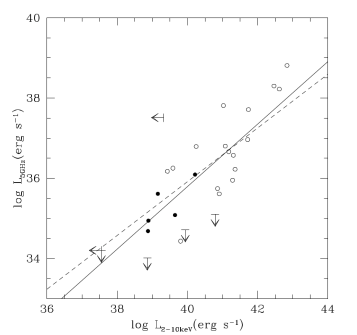
In order to study the relation between nuclear radio luminosity and the X-rays one, we correlated the 5 GHz VLA peak luminosity with the 2-10 keV X-rays luminosity (corrected for Compton-thin and Compton-thick absorption) for the Parent sample (Panessa & Giroletti, 2013) including our new data.
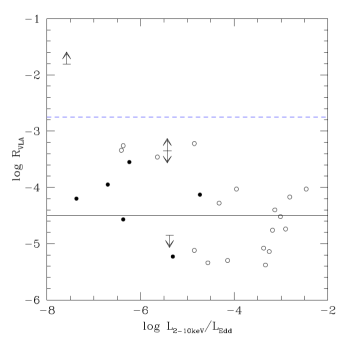
Given the presence of dual censored data, we performed a Schmitt’s linear regression algorithm to compute the correlation slope and a generalised Kendall’s tau test for the significance of the correlation using the ASURV package. In Fig. 2 we show a plot of 5 GHz VLA luminosity as a function of 2-10 keV luminosity. NGC 3185 has been excluded from this fit, for its complex morphology not ascribable to a core emission (see the L-band map in Fig. 5).
The slope of the Schmitt’s regression is . The generalised Kendall’s tau test for correlation results in a probability P that a correlation is not present of 1.810-6 (z-value4.8, 4.5). Even though our sources are all nearby (d23 Mpc), in order to eliminate distance effects, we performed correlation test for the associated flux-flux relation, finding a P 2.610-6 for the null hypothesis (z-value, 4.5), so the correlation is significant. For three out of four undetected sources, the derived upper limits are nearly an order of magnitude smaller than the fluxes derived via the luminosity-luminosity relation.
4.4 Radio loudness and Accretion efficiency
The distribution of VLA X-ray radio-loudness parameter 555, as defined by Terashima & Wilson (2003) for the detected sources in the Parent sample is such that there is a prevalence of radio-loud sources, based on the radio-loudness limit -4.5 by Terashima & Wilson (2003), but if we consider the -2.75 limit of Panessa et al. (2007), then all our sources (except NGC 4472) are radio-quiet.
We note that the BH masses, as in Panessa et al. (2006), are taken from literature, and therefore they have been derived with different methods: maser kinematics, gas kinematics, stellar kinematics, reverberation mapping and mass-velocity dispersion, with reverberation mapping and stellar kinematics measurements which have been identified by Woo & Urry (2002) as the most reliable ones. As noted in Panessa et al. (2006), the BH mass estimates should be affected by a typical 0.3 - 0.5 dex uncertainty, mainly due to the mass-velocity relation scatter.
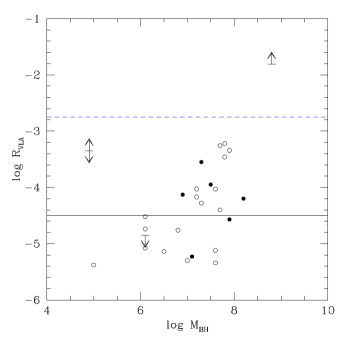
In Fig. 3, we show as function of BH mass and Eddington ratio (), left and right panel, respectively. We performed a Kendall’s tau test for the significance of the correlation between the radio-loudness parameter and the black-hole mass (Fig. 3, left panel), finding that there is a weak trend (z-value3.17 and a probability P0.0015), while no significant correlation is found with the Eddington ratio (z-value1.28 and a P0.2). We have also investigated the correlation between the spectral index and black-hole mass and Eddington ratio as recently reported in Laor et al. (2019), however we do not find significant correlations with either the black-hole mass or the Eddington ratio. In order to deepen this issue, a larger sample of sources would allow a more statistically robust study.
The population of sources in between the two radio-loudness thresholds (see Fig. 3) could be referred to as Radio-Intermediate (RI) AGN, see for instance Falcke et al. (1996). For the PG quasar sample, Falcke et al. (1996) find that, when considering intermediate values of the radio loudness parameter R (in the Kellerman definition), an approximately equal fraction of flat-spectrum sources emerges. Kellermann et al. (1994) showed that these flat-spectrum radio-intermediate sources are compact on VLA scales. Interestingly, in our Parent sample, 12 sources out of the 23 having and spectral index information can be considered as Radio-Intermediate, with 7 of them exhibiting a flat-spectrum with a compact VLA component (with the exception of NGC 3079). If we consider the sources (9 out of 23), then only three are both compact and flat-spectrum.
In Table 6 we indicate the average values for the 5 GHz luminosity and for the X-ray radio-loudness parameter (as defined by Terashima & Wilson (2003)). If we consider the average 5 GHz VLA luminosity and the average radio-loudness parameter for type 1 and type 2 Seyferts, no significant difference is found.
5 Discussion
We detected radio emission in six out of ten sources, with detection rates of 5/10 in L-band, 6/10 in C-band, 5/10 in X-band and 4/10 in Ku-band. The new VLA A-configuration observations allowed us to reach sensitivity levels down to 270 Jy beam-1in L-band (highest RMS for NGC 0676) and 27 Jy beam-1in Ku-band, which translates into radio powers of and W Hz-1 at 1.5 and 14 GHz respectively. This allows us to increase the detection rates for the 28 sources of the Parent sample compared to Panessa & Giroletti (2013): from 64 to 86 per cent in L-band and from 82 to 86 per cent in C-band (see table 6), thus sampling among the lowest radio luminosities for AGN. In the C-band, we find a detection rate of 84 per cent for the type-2 Seyferts and 100 per cent for the type-1s.
Clues on the origin of the radio emission can be obtained by analyzing observational information, such as the spectral slope and the morphology. In two cases, namely NGC 4639 and NGC 4698, we have found spectral slopes of -0.400.01 and -0.130.07, respectively. Inverted or slightly-inverted radio spectra from very compact sources (like the above cases) are usually associated with optically thick synchrotron emission from the base of a jet (e.g. Blandford & Königl, 1979; Reynolds, 1982), in which multiple self-absorbed components, peaking at different frequencies, overlap and flatten the overall spectrum with respect to the 2.5 SSA slope (Falcke & Biermann, 1995). Alternatively, thermal processes like free-free emission may also produce flat/inverted spectral slopes (Bontempi et al., 2012). The other detected sources exhibit different spectra: NGC 4477 has been found to fit an intermediate spectral index between flat and steep (0.520.09), NGC 3941 has a very steep (=) spectrum, both compatible with optically-thin synchrotron emission. NGC 4725 exhibits a peculiar spectrum and further observations are needed to derive meaningful information for this source.
The above consideration could be strengthened via brightness temperature arguments. Indeed, following Falcke & Biermann (1999), the natural limit between thermal and non-thermal processes is roughly K, in which a brightness temperature much greater than this value suggests a non-thermal origin. However, we cannot put strong limits on the brightness temperature from VLA observation, given the loose upper limit on the deconvolved size. The only VLBI detection of the Reference Sample is for NGC 4477 at 5 GHz (Bontempi et al., 2012). A very inverted spectrum and an intermediate brightness temperature between thermal and non-thermal processes (6.5) was found. The derived physical parameters, under the assumption that the spectrum is due to synchrotron-self absorption, would agree with a thermal emission originating in a compact, hot corona surrounding the accretion disc, as proposed by coronal models by Laor & Behar (2008).
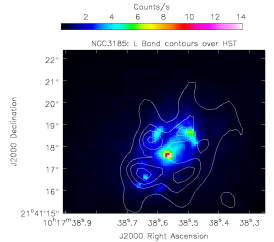
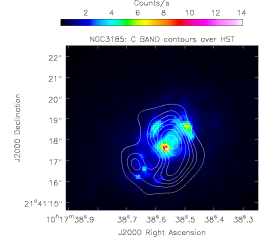
We detected radio emission for six sources, but while the morphology of radio emission in four over six cases is compact on arcseconds scales, predominantly unresolved, for NGC 3185 and NGC 3941 we find a more complex morphology. The estimated radio luminosities at this frequency are L and W Hz-1 for NGC 3185 and NGC 3941, respectively, well below the Radio-Loud/Radio-Quiet threshold of L W Hz-1 defined by Condon (1992). Considering NGC 3185, the structure observed in L-Band has a size of 53.8 arcsec, which translates into a linear scale of 0.50.4 kpc666If instead we use z-independent distance provided in the Nasa/Ipac Extra-galactic Database (NED) of 23.2 Mpc, then the linear scale would be 0.560.42 kpc, so our linear scales estimates are affected by a per cent error, which do not affect our considerations.. Analogous considerations can be made for the C and X Bands, leading to linear scales of 0.380.36 kpc. There is evidence for radio emission spread over the host galaxy scale for a number of Seyferts when observed with adequate angular resolution and sensitivity (Orienti et al., 2015). In particular, circumnuclear starburst rings with knots of star formation are observed. Orienti & Prieto (2010) observed diffuse radio emission with knots of star formation for a number of Seyferts, on scales smaller than 1 kpc (NGC 5506, NGC 7469 and NGC 7582). Analogously, the morphology of the radio emission in the case of NGC 3185 as observed in our radio maps may be consistent with emission from circumnuclear rings of star formation. In order to check this hypothesis, we overlapped L-band and C-band radio contours to an archivial HST image777Taken from the Hubble Legacy Archive (HLA), https://hla.stsci.edu/ for NGC 3185, as shown in Fig. 4. The radio contours overlap with optical emission, from which a nearly circular, ring-like structure emerges. However, further work is needed to understand the link between radio emission and star formation in the form of circumnuclear rings in this source. In particular, intermediate angular resolution scales radio observations (such as those of e-MERLIN) combined with H maps would allow us to confirm the star-formation hypothesis. If we consider the Parent sample with our new data, then we find that the average spectral slope is compatible with flat (0.300.10), with a nearly equal number of flat and steep slopes. If we consider the two sub-populations of type-1 and type-2 Seyferts, then no significant differences are found with respect to the average spectral index and the average radio-loudness parameter, the only difference being that type-1 sources are slightly more luminous. Considering the X-ray radio loudness parameter, the black-hole mass and the Eddington ratio, we do not find significant differences between the type-1 and type-2 sub-classes. We note that, even though the sources in the Reference sample have an Eddington ratio nearly an order of magnitude smaller than the average for the Parent sample, the X-ray radio-loudness parameter does not exhibit anomalous values.
We also investigated the relation between the 5 GHz luminosity and the nuclear 2-10 keV X-ray luminosity. The latter is usually considered a tracer of accretion luminosity, while the former may have a core and a jet contribution. Nevertheless, we performed this analysis in order to understand if there is an interplay between the emitting components. We have found a significant correlation between the two quantities at scales traced by the VLA, in agreement with considerations of Panessa et al. (2007). The increased sensitivity of our observations allows us to put stringent limits on the derived flux densities at very low luminosities, resulting in a steepening of the correlation slope with respect to the previous estimate of Panessa & Giroletti (2013), i.e., . However, our value is still in agreement with the general 0.7 slope of Gallo et al. (2003) found in the case of ’low-hard’ state XRBs. During their outburst activity, XRBs experience transitions between different accretion and ejection states, likely in dependence of the efficiency of the accretion flow (Fender et al., 2004). In their low-hard state, XRBs show a radio spectrum which is flat/slightly inverted, and can be interpreted as synchrotron self-absorbed emission from an optically thick core, probably the base of a jet as may be occurring in AGN (Blandford & Königl, 1979). The fact that LLAGNs do exhibit a slope of the radio - X-rays correlation comparable to that of low-hard state XRB has been interpreted as symptom of a common underlying physics (e.g. Falcke et al., 2004). The two classes of low-accreting sources would therefore be associated with a radiatively inneficient accretion (RIAF) coupled with a jet (Ho, 2008), although there have been successful attempts in modelling in terms of jet-only and RIAF-only models (e.g. Körding et al., 2006). Indeed, the observed low Eddington ratios favour an inefficient regime for our sources. However, we have to note that the jet origin of radio emission, associated to the low/hard state of XRBs, for the sources in our sample can not be confirmed. Indeed, a possible non-negligible contribution to radio emission might come from central star-formation regions (like in the case of NGC 3185). Moreover, the interpretation of spectral indices is not unique: different processes, such as low-power jets, outflows or star formation could produce steep or flat spectra, dependently on the conditions (for a review see Panessa et al., 2019).
| Target | Spectral index |
|---|---|
| (1) | (2) |
| NGC 3941 | +1.520.33 |
| NGC 4477 | +0.520.09 |
| NGC 4639 | -0.400.01 |
| NGC 4698 | -0.130.07 |
6 Conclusions
We present new multi-frequency (L, C, X and Ku bands), high resolution (A configuration) VLA observations for ten Seyferts (Reference sample), which are the faintest members of the complete, distance limited sample of Cappi
et al. (2006) (Parent sample). Below, we summarize our results:
- We detected radio emission in six out of ten sources, with four of them, namely NGC 0676, NGC 1058, NGC 2685 and NGC 3486 which remain radio-silent at 3 sensitivity levels ranging from 270 Jy/beam (L-band) down to 27 Jy/beam (Ku-Band), this translates into upper limits on luminosities of L and L W Hz-1 at 1.5 and 14 GHz, respectively.
- The increased sensitivity of the new observations translates into a higher detection rate in the Parent sample, from 64 to 86 per cent in the L-band and from 82 to 86 per cent in the C-band, with respect to previous works (Panessa &
Giroletti, 2013), suggesting that all nuclei should be radio emitters when observed with the adequate sensitivity.
- For the detected sources we computed radio spectral slopes, and we found: +0.52 for NGC 4477, compatible with both a steep and flat spectrum; -0.40 for NGC 4639 and -0.13 for NGC 4698, slightly inverted spectra compatible with both compact optically-thick emission and thermal (e.g. free-free) emission; +1.52 for NGC 3941, with the spectral index defined as . NGC 4725 exhibits a peculiar spectrum, that deserves further investigation.
- We studied the morphology of the radio emission for the ten faintest Seyferts, and we found it to be predominantly compact on scales arcsec, which corresponds to linear scales smaller than 100 pc, except in two cases, NGC 3185 and NGC 3941, which show complex morphology at sub-kpc scales, probably due to star formation processes.
- We did not find particular trends with neither the black-hole mass nor the Eddington ratio considering the Parent sample. Even though the sources in the Reference sample have an Eddington ratio an order of magnitude lower than the average for the Parent sample, they do not exhibits any specific trend for the X-ray radio-loudness parameter (as defined by Terashima &
Wilson, 2003)
- Considering the type-1 and type-2 sub-populations for the Parent sample, we did not find a clear dichotomy when considering the average radio-loudness parameter and the average spectral index, the only difference being that type-1 Seyferts have a prevalence of steep spectra with respect to type-2.
- We correlated the radio 5 GHz luminosity with the 2-10 keV luminosity for the Parent sample, taking into account censored data. The slope we find of 0.80.1 is consistent with the slope of found by Gallo
et al. (2003) for the low-hard state XRBs, which would suggest a possible common inefficient accretion physics.
These faint nuclei will constitute one of the dominant source population in the Square Kilometer Array (SKA) sky, allowing to investigate several different physical processes that are possibly producing radio emission in these nuclei.
Acknowledgements
We thank the referee for the comments which significantly contributed to improve the quality of the paper. EC thanks D.R.A. Williams for comments that improved the manuscript. EC acknowledges the National Institute of Astrophysics (INAF) and the University of Rome - Tor Vergata for the PhD scholarship in the XXXIII PhD cycle. GB acknowledges financial support under the INTEGRAL ASI-INAF agreement 2013-025-R.1. FP and MG acknowledge support from a grant PRIN-INAF SKA-CTA 2016. FT acknowledges support by the Programma per Giovani Ricercatori – anno 2014 “Rita Levi Montalcini”.
References
- Anderson & Ulvestad (2005) Anderson J. M., Ulvestad J. S., 2005, ApJ, 627, 674
- Baldi et al. (2018) Baldi R. D., et al., 2018, MNRAS, 476, 3478
- Becker et al. (1995) Becker R. H., White R. L., Helfand D. J., 1995, ApJ, 450, 559
- Bennett et al. (2003) Bennett C. L., et al., 2003, ApJS, 148, 1
- Blandford & Königl (1979) Blandford R. D., Königl A., 1979, ApJ, 232, 34
- Bontempi et al. (2012) Bontempi P., Giroletti M., Panessa F., Orienti M., Doi A., 2012, MNRAS, 426, 588
- Briggs (1995) Briggs D. S., 1995, in American Astronomical Society Meeting Abstracts. p. 1444
- Buttiglione et al. (2010) Buttiglione S., Capetti A., Celotti A., Axon D. J., Chiaberge M., Macchetto F. D., Sparks W. B., 2010, A&A, 509, A6
- Cappi et al. (2006) Cappi M., et al., 2006, A&A, 446, 459
- Condon (1992) Condon J. J., 1992, ARA&A, 30, 575
- Conway et al. (1990) Conway J. E., Cornwell T. J., Wilkinson P. N., 1990, MNRAS, 246, 490
- Falcke & Biermann (1995) Falcke H., Biermann P. L., 1995, A&A, 293, 665
- Falcke & Biermann (1999) Falcke H., Biermann P. L., 1999, A&A, 342, 49
- Falcke & Markoff (2000) Falcke H., Markoff S., 2000, A&A, 362, 113
- Falcke et al. (1996) Falcke H., Sherwood W., Patnaik A. R., 1996, ApJ, 471, 106
- Falcke et al. (2000) Falcke H., Nagar N. M., Wilson A. S., Ulvestad J. S., 2000, ApJ, 542, 197
- Falcke et al. (2004) Falcke H., Körding E., Markoff S., 2004, A&A, 414, 895
- Fender et al. (2004) Fender R. P., Belloni T. M., Gallo E., 2004, MNRAS, 355, 1105
- Filippenko & Sargent (1985) Filippenko A. V., Sargent W. L. W., 1985, ApJS, 57, 503
- Gallimore et al. (2004) Gallimore J. F., Baum S. A., O’Dea C. P., 2004, ApJ, 613, 794
- Gallo et al. (2003) Gallo E., Fender R. P., Pooley G. G., 2003, MNRAS, 344, 60
- Ghisellini et al. (2004) Ghisellini G., Haardt F., Matt G., 2004, A&A, 413, 535
- Giroletti & Panessa (2009) Giroletti M., Panessa F., 2009, ApJL, 706, L260
- Gu & Cao (2009) Gu M., Cao X., 2009, MNRAS, 399, 349
- Hakobyan et al. (2012) Hakobyan A. A., Adibekyan V. Z., Aramyan L. S., Petrosian A. R., Gomes J. M., Mamon G. A., Kunth D., Turatto M., 2012, A&A, 544, A81
- Ho (2008) Ho L. C., 2008, ARA&A, 46, 475
- Ho & Ulvestad (2001) Ho L. C., Ulvestad J. S., 2001, ApJS, 133, 77
- Ho et al. (1995) Ho L. C., Filippenko A. V., Sargent W. L., 1995, ApJS, 98, 477
- Ho et al. (1997a) Ho L. C., Filippenko A. V., Sargent W. L. W., 1997a, ApJS, 112, 315
- Ho et al. (1997b) Ho L. C., Filippenko A. V., Sargent W. L. W., 1997b, ApJ, 487, 568
- Högbom (1974) Högbom J. A., 1974, A&AS, 15, 417
- Isobe et al. (1990) Isobe T., Feigelson E. D., Akritas M. G., Babu G. J., 1990, ApJ, 364, 104
- Jones et al. (01 ) Jones E., Oliphant T., Peterson P., et al., 2001–, SciPy: Open source scientific tools for Python, http://www.scipy.org/
- Kellermann et al. (1994) Kellermann K. I., Sramek R. A., Schmidt M., Green R. F., Shaffer D. B., 1994, AJ, 108, 1163
- Kewley et al. (2006) Kewley L. J., Groves B., Kauffmann G., Heckman T., 2006, MNRAS, 372, 961
- Kharb et al. (2006) Kharb P., O’Dea C. P., Baum S. A., Colbert E. J. M., Xu C., 2006, ApJ, 652, 177
- Körding et al. (2006) Körding E., Falcke H., Corbel S., 2006, A&A, 456, 439
- Laor & Behar (2008) Laor A., Behar E., 2008, MNRAS, 390, 847
- Laor et al. (2019) Laor A., Baldi R. D., Behar E., 2019, MNRAS, 482, 5513
- Lavalley et al. (1992) Lavalley M., Isobe T., Feigelson E., 1992, in Worrall D. M., Biemesderfer C., Barnes J., eds, Astronomical Society of the Pacific Conference Series Vol. 25, Astronomical Data Analysis Software and Systems I. p. 245
- McMullin et al. (2007) McMullin J. P., Waters B., Schiebel D., Young W., Golap K., 2007, in Shaw R. A., Hill F., Bell D. J., eds, Astronomical Society of the Pacific Conference Series Vol. 376, Astronomical Data Analysis Software and Systems XVI. p. 127
- Merloni et al. (2003) Merloni A., Heinz S., di Matteo T., 2003, MNRAS, 345, 1057
- Nagar et al. (2000) Nagar N. M., Falcke H., Wilson A. S., Ho L. C., 2000, ApJ, 542, 186
- Nagar et al. (2005) Nagar N. M., Falcke H., Wilson A. S., 2005, A&A, 435, 521
- Narayan & Yi (1994) Narayan R., Yi I., 1994, ApJL, 428, L13
- Orienti & Prieto (2010) Orienti M., Prieto M. A., 2010, MNRAS, 401, 2599
- Orienti et al. (2015) Orienti M., D’Ammando F., Giroletti M., Giovannini G., Panessa F., 2015, Advancing Astrophysics with the Square Kilometre Array (AASKA14), p. 87
- Panessa & Giroletti (2013) Panessa F., Giroletti M., 2013, MNRAS, 432, 1138
- Panessa et al. (2006) Panessa F., Bassani L., Cappi M., Dadina M., Barcons X., Carrera F. J., Ho L. C., Iwasawa K., 2006, A&A, 455, 173
- Panessa et al. (2007) Panessa F., Barcons X., Bassani L., Cappi M., Carrera F. J., Ho L. C., Pellegrini S., 2007, A&A, 467, 519
- Panessa et al. (2019) Panessa F., Baldi R. D., Laor A., Padovani P., Behar E., McHardy I., 2019, arXiv e-prints,
- Perley & Butler (2013) Perley R. A., Butler B. J., 2013, ApJS, 204, 19
- Rau & Cornwell (2011) Rau U., Cornwell T. J., 2011, A&A, 532, A71
- Reynolds (1982) Reynolds S. P., 1982, ApJ, 256, 13
- Saikia et al. (2018) Saikia P., Körding E., Coppejans D. L., Falcke H., Williams D., Baldi R. D., Mchardy I., Beswick R., 2018, A&A, 616, A152
- Sandage et al. (1979) Sandage A., Tammann G. A., Yahil A., 1979, ApJ, 232, 352
- Terashima & Wilson (2003) Terashima Y., Wilson A. S., 2003, ApJ, 583, 145
- Woo & Urry (2002) Woo J.-H., Urry C. M., 2002, ApJ, 579, 530
- Wrobel & Ho (2006) Wrobel J. M., Ho L. C., 2006, ApJL, 646, L95
- Zakamska & Greene (2014) Zakamska N. L., Greene J. E., 2014, MNRAS, 442, 784
Appendix A Radio Maps
| NGC 3185 | NGC 3185 |
|---|---|
![[Uncaptioned image]](/html/1902.10670/assets/x12.png) |
![[Uncaptioned image]](/html/1902.10670/assets/x13.png) |
![[Uncaptioned image]](/html/1902.10670/assets/x14.png) |
![[Uncaptioned image]](/html/1902.10670/assets/x15.png) |
| NGC 3941 | NGC 3941 |
|---|---|
![[Uncaptioned image]](/html/1902.10670/assets/x16.png) |
![[Uncaptioned image]](/html/1902.10670/assets/x17.png) |
![[Uncaptioned image]](/html/1902.10670/assets/x18.png) |
![[Uncaptioned image]](/html/1902.10670/assets/x19.png) |
| NGC 4477 | NGC 4477 |
|---|---|
![[Uncaptioned image]](/html/1902.10670/assets/x20.png) |
![[Uncaptioned image]](/html/1902.10670/assets/x21.png) |
![[Uncaptioned image]](/html/1902.10670/assets/x22.png) |
![[Uncaptioned image]](/html/1902.10670/assets/x23.png) |
| NGC 4639 | NGC 4639 |
|---|---|
![[Uncaptioned image]](/html/1902.10670/assets/x24.png) |
![[Uncaptioned image]](/html/1902.10670/assets/x25.png) |
![[Uncaptioned image]](/html/1902.10670/assets/x26.png) |
![[Uncaptioned image]](/html/1902.10670/assets/x27.png) |
| NGC 4698 | NGC 4698 |
|---|---|
![[Uncaptioned image]](/html/1902.10670/assets/x28.png) |
![[Uncaptioned image]](/html/1902.10670/assets/x29.png) |
![[Uncaptioned image]](/html/1902.10670/assets/x30.png) |
![[Uncaptioned image]](/html/1902.10670/assets/x31.png) |
| NGC 4725 | NGC 4725 |
|---|---|
![[Uncaptioned image]](/html/1902.10670/assets/x32.png) |
![[Uncaptioned image]](/html/1902.10670/assets/x33.png) |
![[Uncaptioned image]](/html/1902.10670/assets/x34.png) |
![[Uncaptioned image]](/html/1902.10670/assets/x35.png) |