A methodology to select galaxies just after the quenching of star formation
Abstract
We propose a new methodology aimed at finding star-forming galaxies in the phase which immediately follows the star-formation (SF) quenching, based on the use of high- to low-ionization emission line ratios. These ratios rapidly disappear after the SF halt, due to the softening of the UV ionizing radiation. We focus on [O III] 5007/H and [Ne III] 3869/[O II] 3727, studying them with simulations obtained with the CLOUDY photoionization code.\textcolorblack If a sharp quenching is assumed, we find that the two ratios are very sensitive tracers as they drop by a factor 10 within 10 Myr from the interruption of the SF; instead, if a smoother and slower SF decline is assumed (i.e. an exponentially declining star-formation history with -folding time 200 Myr), they decrease by a factor 2 within 80 Myr. We mitigate the ionization – metallicity degeneracy affecting our methodology using pairs of emission line ratios separately related to metallicity and ionization, adopting the [N II] 6584/[O II] 3727 ratio as metallicity diagnostic. Using a Sloan Digital Sky Survey galaxy sample, \textcolorblackwe identify 10 examples among the most extreme quenching candidates within the [O III] 5007/H vs. [N II] 6584/[O II] 3727 plane, characterized by low [O III] 5007/H, \textcolorblackfaint [Ne III] 3869, and by blue dust-corrected spectra and colours, as expected if the SF quenching has occurred in the very recent past. Our results also suggest that the observed fractions of quenching candidates can be used to constrain the quenching mechanism at work \textcolorblackand its time-scales.
keywords:
galaxies: evolutiongalaxies: ISMISM: HII regionsISM: lines and bands.1 Introduction
One of the key question in the current studies of galaxy evolution is to understand the origin of the dichotomy which segregates galaxies into the blue cloud (i.e. late-type, star-forming and disc dominated galaxies) and the red sequence (i.e. early-type, quiescent and bulge dominated galaxies). For , this bimodality is clearly visible both at (Strateva
et al., 2001; Blanton
et al., 2003; Kauffmann
et al., 2003a; Baldry
et al., 2004) and at higher redshifts (Bell
et al., 2004, Willmer
et al., 2006, Cassata
et al., 2008, Brammer
et al., 2009, Whitaker
et al., 2011, Wuyts
et al., 2011, Bell
et al., 2012, Cheung
et al., 2012, Muzzin
et al., 2013) and concerns both galaxy colours and structure (McIntosh
et al., 2014).
There is a general consensus that the main process underlying the galaxy bimodality is the build-up of the red sequence population at , driven by the quenching of the star formation and by a morphological transformation, which turns late-type into early-type morphologies (e.g. Drory et al., 2004, Faber
et al., 2005, Pozzetti
et al., 2010).
What is still unconstrained are the mechanisms able to modify both star-formation and morphology and their corresponding time-scales. Several hypothesis have been proposed to explain the quenching of the star formation in blue galaxies, such as gas stripping (e.g. Gunn &
Gott, 1972), morphological or gravitational quenching (Martig et al., 2009, Genzel
et al., 2014), shock heating of infalling cold gas by the hot halo (Dekel &
Birnboim, 2006), or an exhaustion of the gas supply (e.g. Larson
et al., 1980). Moreover, in massive galaxies, the role of AGNs in influencing galaxy evolution and quenching star formation is supported by several observations (Hopkins et al., 2005; Kaviraj et al., 2007; Diamond-Stanic
et al., 2012; Fabian, 2012 and references therein, Cimatti
et al., 2013, Cicone
et al., 2014, Förster
Schreiber et al., 2014), and corroborated by the theoretical results obtained combining N-body simulations of dark matter halos evolution (Springel
et al., 2005, Boylan-Kolchin et al., 2009) with semi-analytic models for galaxy formation (White &
Frenk, 1991, Springel
et al., 2005, Lu
et al., 2011, Benson, 2012). However, other models are capable to form rapidly quiescent galaxies without invoking the AGN feedback (e.g. Naab
et al., 2006, 2009; Khochfar &
Silk, 2006, Johansson et al., 2012). Stellar or supernova (SN) feedback is most likely channel for the star formation (SF) quenching in low-mass galaxies (e.g. ; Kaviraj et al., 2007).
Several mechanisms have also been invoked to explain the morphological transformation. Numerical simulations have shown that major merging can give rise to elliptical and S0 galaxies (Bekki, 1998) and that also minor merging can play an important role in spheroid and bulge growth (Bournaud
et al., 2007; Naab et al., 2007). From an observational point of view, evidences that the morphological transformation can be also induced by environmental mechanisms (Larson
et al., 1980; Bekki
et al., 2002, Farouki &
Shapiro, 1981; Moore
et al., 1999, Quilis
et al., 2000) or by the secular growth of pseudo-bulges (Courteau et al., 1996; Norman
et al., 1996; MacArthur et al., 2003; Kormendy &
Kennicutt, 2004; Debattista et al., 2006) have been found.
Having intermediate colours between the blue cloud and the red sequence, galaxies populating the so-called ’green-valley’ (e.g. Salim, 2014, Schawinski
et al., 2014) are generally considered as the transiting objects par excellence (Martin
et al., 2007, Mendel et al., 2013, Salim, 2014, Schawinski
et al., 2014).
Among these, the most interesting population certainly consists of those galaxies which have just entered the quenching phase (within a few Myr). Although hampered by the short duration of the quenching process, the search for galaxies in this critical phase of evolution has been carried on by several authors in the past decades. Galaxies characterized by both a tidally disturbed morphology and intermediate colours (e.g. Schweizer &
Seitzer, 1992; Tal et al., 2009) or low-level of recent SF (Kaviraj, 2010), young elliptical galaxies (Sanders
et al., 1988; Genzel et al., 2001; Dasyra
et al., 2006) and very recent post-merger remnants with strong morphological disturbances (Hibbard & van
Gorkom, 1996; Rothberg &
Joseph, 2004; Carpineti et al., 2012) have been considered as valid ’recent time’ quenching candidates. Moreover, many attempts aimed at spectroscopically identifying quenching galaxies come from the investigations of the post-starburst (E+A or K+A) galaxies UV and optical spectra, whose strong Balmer absorption lines and missing [O II] 3727 ([O II], hereafter) and H emission lines (Couch &
Sharples, 1987, Quintero
et al., 2004, Poggianti
et al., 2004; Balogh
et al., 2011; Muzzin
et al., 2012; Mok et al., 2013; Wu et al., 2014) have been interpreted as signs of a recent halt of the SF (Dressler &
Gunn, 1983; Zabludoff
et al., 1996; Quintero
et al., 2004, Poggianti
et al., 2008, Wild
et al., 2009).
The scarcity of galaxies that are in the transition phase suggests that, whatever mechanism may be responsable of the star formation shut-off, it has to happen on short time-scales (Tinker
et al., 2010, Salim, 2014). \textcolorblackThe relatively short duration of the quenching process is also suggested by the surprising identification of a significant number of galaxies that look already quiescent at , when the Universe was only 1 – 1.5 Gyr old. (e.g. Mobasher
et al., 2005, Wiklind
et al., 2008, Juarez
et al., 2009, Brammer
et al., 2011, Marsan
et al., 2015, Citro et al., 2016). However, a general and coherent picture concerning the SF quenching is still lacking. Very recently, evidences that the quenching of the star formation could be a separated process with respect to the morphological transformation have come from the photometric and spectroscopic investigations of passive spiral galaxies (Fraser-McKelvie
et al., 2016).
Further uncertainties concern the typical time-scales of the quenching process, which are far to be constrained. For instance, galaxies with early-type morphologies seem to be characterized by shorter quenching time-scales, with respect to galaxies with late-type morphologies (Schawinski
et al., 2014), and the time-scales derived observationally are generally shorter than the ones derived using N-body simulations and semi-analytic models (Muzzin
et al., 2012; Wetzel et al., 2013; Mok et al., 2013, Taranu et al., 2014).
Emission line ratios have been proved to be powerful tools to constrain the ionization state and the properties of galaxies both at and at higher redshift (e.g. Dopita et al., 2000, Kewley et al., 2001, Dopita
et al., 2006, Levesque
et al., 2010, Kewley
et al., 2013, Kashino
et al., 2016), but this kind of studies are always hampered by the degeneracies affecting spectra and emission lines, which in many cases make it difficult to disentangle what is the origin of the emission line ratios intensity (e.g. Dopita
et al., 2006). However, a general view on how the emission line ratios can help in tracing the quenching phase is lacking, especially when the very early epochs after the quenching are involved.
\textcolorblackIn this work, we propose a methodology aimed at identifying galaxies in the phase which immediately follows the quenching of the SF, based on the search for galaxies with weak high-ionization and strong low-ionization emission lines in their spectra. In particular, we adopt the [O III] 5007 ([O III], hereafter) and [Ne III] 3869 ([Ne III], hereafter) high-ionization lines, and the H and [O II] ([O II], hereafter) low-ionization lines. [O III] and [Ne III] probe the presence of short-lived and very massive O stars able to provide photons hard enough to doubly ionize oxygen and neon; H and [O II], being excited by softer photons, probe the presence of colder O stars and B stars.
We simulate the emission line ratios using the photoionization code CLOUDY (Ferland et al., 1998), \textcolorblackassuming short time-scales for the quenching. We also combine the emission line ratios with metallicity diagnostics, in order to mitigate the ionization – metallicity degeneracy.
2 The proposed approach
We propose a methodology able to identify galaxies in the phase just after the quenching of the star formation, based on emission line ratios. If the star formation is quenched in a star-forming region, the number of UV hydrogen ionizing photons (i.e. Å) provided by the central ionizing source declines. In particular, since massive O stars are the first to disappear, the harder UV photons are the first to drop, leading to a softening of the UV ionizing spectrum. As a consequence, high-ionization lines, which can be excited only by the hardest ionizing photons, rapidly disappear; \textcolorblacklow-ionization lines, which can be produced also by colder O stars and B stars, remain strong at later times.
\textcolorblackThis allows us to devise a new methodology for identifying quenching galaxies. We search for galaxy spectra characterized by very faint high-ionization lines, \textcolorblacklike [O III] and [Ne III], but still strong low-ionization lines, like H and [O II]. We put into practice our methodology by looking for galaxy spectra with high signal-to-noise (S/N) H emission but very low values of the [O III]/H and the [Ne III]/[O II] emission line ratios. These lines are observable in a wide range of redshifts (e.g. 0 < z < 2) with optical and near infrared spectroscopy. \textcolorblackIn particular, [Ne III]/[O II], despite involving a very faint emission line like [Ne III] 3869 ([Ne III], hereafter), has the advantage of being basically unaffected by dust extinction, including emission lines which are very close in wavelength. We also investigated the possibility to use a line ratio less affected by dust extinction correction such as the [O III] 5007/H ([O III]/H, hereafter), which has also the advantage of involving stronger emission lines than [Ne III]/[O II].
\textcolorblack\textcolorblackIn the following, we assume a sharp quenching of the SF as extreme case. Moreover, we illustrate the results obtained if a more realistic, smoother but still short decline of the SF is adopted.
This is in agreement with recent studies arguing that quenching processes occurring on 100 – 200 Myr time-scales can be modelled by a sudden interruption of the SF (e.g. Schawinski
et al., 2014, Ciesla
et al., 2016, Schaefer
et al., 2017).
3 Modelling the quenching phase
blackIn order to investigate the behaviour of the proposed emission line ratios during the quenching phase, we simulate \textcolorblackstar-forming regions until their quiescent phase. Here we describe the main ingredients of our photoionization models.
We consider \textcolorblacka star-forming region as formed by a central source of energy, with a given spectral energy distribution (SED) and intensity, surrounded by a spherical cloud. We simulate its final spectrum by means of the photoionization code CLOUDY (Version 13.03, Ferland et al., 1998, Ferland
et al., 2013), adopting a plane-parallel geometry (i.e. the simplest geometry allowed by the code), in which the thickness of the photoionized nebula is very small compared to the distance to the photoionizing source.
\textcolorblackThe shape of the ionizing source is simulated by means of different stellar synthetic spectra, such as the Leitherer
et al., 1999 (Starburst99) and Bruzual &
Charlot, 2003 (BC03) models.
The adopted Starburst99 synthetic spectra are simple stellar populations (SSPs) with a fixed mass of , metallicities Z = 0.004, 0.008, 0.02, 0.04 and a Salpeter initial mass function (IMF) (with =1 and =100 M☉). They are computed using Lejeune – Schmutz stellar atmospheres (Lejeune
et al., 1997; Schmutz et al., 1992) and Geneva-HIGH 1994 evolutionary tracks (Meynet et al., 1994, Leitherer
et al., 1999).
This set of ingredients is in agreement with the ones generally used in the literature (e.g. Levesque
et al., 2010, Kewley et al., 2001, Dopita
et al., 2006).
For BC03 synthetic spectra, we adopt SSPs with metallicities Z = 0.004, 0.008, 0.02, \textcolorblack0.04. In particular, since the default BC03 highest metallicity is Z = 0.05, we interpolate the metallicities to create BC03 models with Z = 0.04, in order to be consistent with the Starburst99 results. These models are normalized to and assume a Chabrier IMF with =0.1 and =100 . \textcolorblackThe slope of these two IMFs differs at , but we expect this difference not to influence the shape of the final SED, since very low mass stars contribute mostly to the mass of a stellar population rather than to its UV spectral properties. \textcolorblackMoreover, since we are interested in emission line ratios, we can neglect the different mass normalization of the two models.
blackThe intensity of the ionizing source is parametrized by the adimensional ionization parameter , which is defined as the ratio between the mean intensity of the radiation field and the density of the ionized gas. \textcolorblackIn the plane parallel case, can be written as (Tielens, 2010):
| (1) |
where is the hydrogen number density of the photoionized gas, is the speed of light and \textcolorblackis the flux of the UV ionizing photons ( < 912 Å) \textcolorblackstriking the photoionized cloud. \textcolorblackis proportional to the number of UV hydrogen ionizing photons , which in turns depends on the stellar metallicity, the stellar mass, the star-formation rate, the age and the IMF of the ionizing central source. \textcolorblackFor instance, higher masses, higher star formation rates (SFRs), younger ages or top-heavy IMFs, which all imply an higher number of massive stars, lead to increase. Moreover, depends on the proximity of the central stars to the photoionized nebula. As explained in Sect. 2, when a galaxy quenches its star formation, declines due to the aging and the softening of the ionizing SED. As a consequence, decreases and so does the ionization parameter.
\textcolorblackThroughout this work, we adopt two kind of models, accounting for the decrease of the ionization parameter and the decline of the number of ionizing photons due to the quenching process.
-
1.
Fixed-age models. To fit with the majority of the literature studies (e.g. Dopita et al., 2006, Levesque et al., 2010, Kashino et al., 2016), we assume the central source to be an SSP with a given metallicity (Z = 0.004, 0.008, 0.02, 0.04) and a fixed age of 0.01 Myr. Moreover, \textcolorblackwe adopt a grid of decreasing ionization parameters in order to simulate different ionization levels. We assume \textcolorblacka grid of fixed-age ionization parameters log(U)0 going from to with steps of 0.1 dex, to be consistent with the observations of unresolved star-forming H II regions (log(U), see Yeh & Matzner, 2012), local H II regions (log(U), see Dopita et al., 2000) and star-forming galaxies (see Moustakas et al., 2006; Moustakas et al., 2010). \textcolorblackIn these models, given a metallicity, the shape of the ionizing source is fixed, regardless of the ionization parameter, and models with the lowest log(U)0 can describe star-forming regions, but with very low densities of ionizing photons.
-
2.
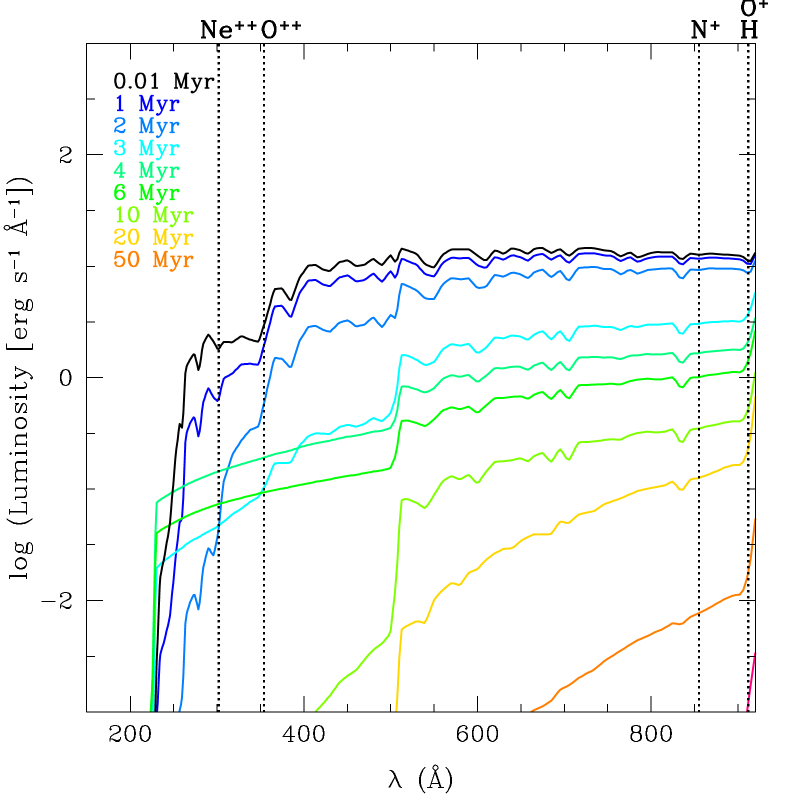
Evolving-age models. \textcolorblackWe also construct models which take account of the shape variation of the ionizing SED as a function of time after SF is stopped. This evolution is illustrated in Fig. 1 for an SSP of solar metallicity. The UV ionizing flux decreases as a function of time, with harder energies disappearing first, due to the sudden disappearence of the most massive O stars able to produce them. This behaviour is also visible in Fig. 2, which shows the time evolution of the number of ionizing photons below different energy thresholds (i.e. the ones relative to the emission lines studied in this work: H and O+, 13.6 eV; O++, 35 eV and Ne++, 41 eV) and for different metallicities. The number of ionizing photons decreases with time, and its decline is more pronounced for harder energies and higher metallicities. Moreover, the effect of the increased metallicity is more visible at the harder energies, which are more absorbed \textcolorblackdue to the larger stellar opacities. \textcolorblackTo account for the softening of the UV ionizing spectrum as a function of time after the SF quenching, in these models we simulate the central ionizing source using an SSP with given metallicity (Z = 0.004, 0.008, 0.02, 0.04) and age going from 0.01 to 10 Myr. In particular, the youngest SSP of 0.01 Myr is taken as representative of a still star-forming region (this kind of assumption is often used in literature, e.g. Kewley et al., 2001, Dopita et al., 2006, Levesque et al., 2010), while older SSPs are used to describe the epochs subsequent to the SF quenching. The still star-forming region can have \textcolorblacka ionization state described by one of the \textcolorblackfixed-age ionization parameters log(U)0 defined before, which then evolves with time according to the time evolution (see Rigby & Rieke, 2004). Since decreases after the SF quenching, \textcolorblackwe expect the ionization parameter to get lower as a function of time. For this reason, each model with a given age will be characterized by an evolving-age ionization parameter log(U)t.

For the ionized nebula, we adopt \textcolorblackan hydrogen density cm-3, which is in agreement with the typical densities in observed star-forming regions (Dopita et al., 2000, Kewley et al., 2001, Dopita
et al., 2006), and the solar chemical composition by Asplund
et al., 2005 (the abundances of the various elements adopted in this work are listed in Table 1 of Dopita
et al., 2006). \textcolorblackIn particular, we match the metallicity of the ionized nebula with the metallicity of the ionizing stellar population111It is important to note that the solar metallicity of the Starburst99 (and BC03) models is slightly higher (Z = 0.02) than the Asplund
et al., 2005 one (i.e. Z = 0.016)..
For non-solar metallicities, we linearly rescale the abundance of each element, except for He, C and N, for which we assume the metallicity dependences reported in Dopita
et al. (2006). Depletion factors are fixed at the same values regardless of metallicity (e.g. Dopita
et al., 2006, Nakajima &
Ouchi, 2014). \textcolorblackThis implies that the dust-to-metal ratio is fixed regardless of metallicity, and that the dust-to-gas ratio is proportional to metallicity (e.g. Issa
et al., 1990; Lisenfeld &
Ferrara, 1998; Draine
et al., 2007; da Cunha et al., 2010). To account for the presence of dust, we adopt the default ISM grain distribution implemented in CLOUDY. However, throughout this work we always use the intrinsic fluxes provided by the CLOUDY code for all the analysed emission lines, i.e. those that not require any correction for the dust extinction.
Finally, since the emission lines we are interested in require very high gas kinetic temperature (i.e. K) to be produced, we stop the calculation at the point in which the kinetic temperature of the gas has fallen down to K, since at this temperature not even the hydrogen can be ionized.
4 Testing the reliability of the photoionization model
Before describing the behaviour of the proposed quenching diagnostics, in this section we verify the reliability of our models comparing them with data and literature.
4.1 Comparison with data
We perform the comparison with data using the Baldwin, Phillips Terlevich diagram (BPT; Baldwin et al., 1981), which is generally adopted to distinguish star-forming from AGN ionization sources (Veilleux &
Osterbrock, 1987, Kewley et al., 2001, Kauffmann
et al., 2003b, Stasińska et al., 2006). To verify the consistency of our models with real data, we use a sample of star-forming galaxies extracted from the Sloan Digital Sky Survey Data Release 8 (SDSS DR8, e.g. Eisenstein
et al., 2011, see Quai et al. 2017, in prep., for details), \textcolorblackclassified as star-forming on the basis of the BPT diagram itself, using the definition by Kauffmann
et al. (2003b). Galaxies in this sample have , log(M/M☉) , signal-to-noise ratio (S/N) of the H flux > 5 and of the H flux > 3. \textcolorblackThe threshold of S/N (H) has been adopted because we expect just quenched galaxy spectra to be still characterized by relatively strong low-ionization lines (see Sect. 2).
The emission line measurements for each object are derived from the MPA-JHU group (Brinchmann
et al., 2004) and are corrected for dust extinction assuming the Calzetti extinction curve (Calzetti et al., 2000) and using the H/H ratio to estimate the nebular colour excess .
\textcolorblackStarting from the selected sample, in the following sections we consider different subsamples of objects, selected according to the signal-to-noise ratio (S/N) of the emission lines under analysis. Throughout the work, emission lines characterized by a S/N < 2 are regarded as not-detected lines, thus their fluxes are treated as upper limits and set to 2. We consider, in particular, upper limits for objects with [O III] 5007 ([O III], hereafter) and [Ne III] undetected. On the contrary, S/N > 2 are associated to emission lines like [O II], [N II] 6584 ([N II], hereafter) and [S II] 6717,6731 ([S II], hereafter).
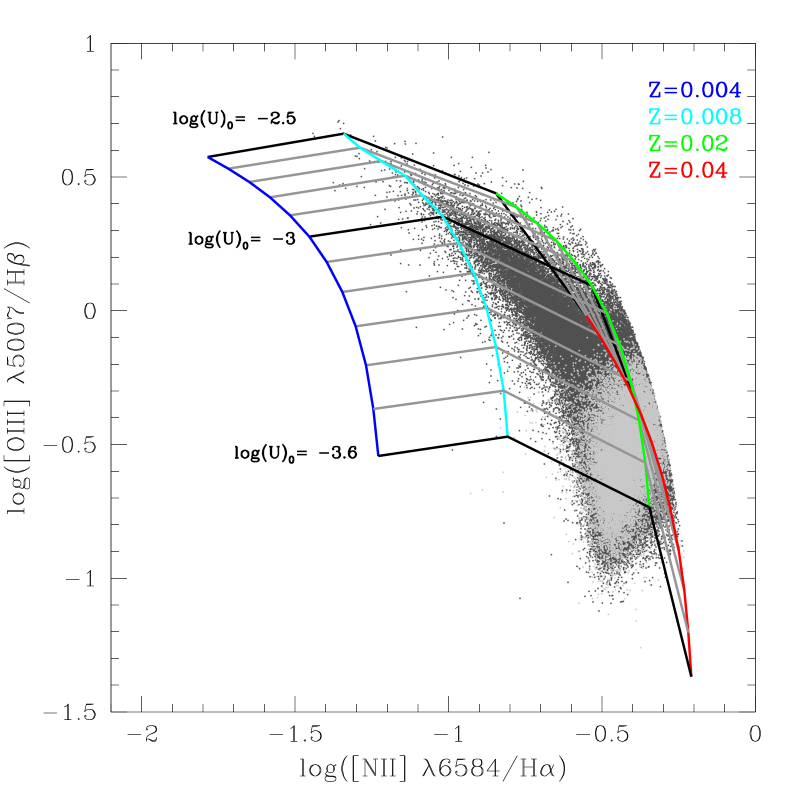
As illustrated in Fig. 3, models are able to reproduce the bulk of the data distribution in the BPT star-forming branch, with galaxies spanning the entire range of ionization parameters and metallicities considered in our study. \textcolorblackThe discrepancy of the uppermost envelope of the SF region could be also due to residual contamination by AGN or composite sources (e.g. Stasińska et al., 2006) or to shortcomings related to models. For instance, recent works have argued that, at the present state, many of the synthetic spectra generally used in the literature can produce too soft UV ionizing fluxes, especially at high metallicities (e.g. Levesque
et al., 2010). Moreover, first evidences that local galaxies can have higher N/O ratios and/or higher dust-to-metal ratios especially at high metallicities have been found in the very last years (Brinchmann
et al., 2013, Pérez-Montero et al., 2013, Wu et al., 2014, Morisset
et al., 2016), suggesting that they could help in filling the gaps between models and data.
At Z > 0.02, models with different metallicities and ionization parameters overlap between each other. This can be mainly attributed to the fact that the [N II] 6584/H ([N II]/H, hereafter) ratio has not a smooth increase with Z, flattening at supersolar metallicities (see Sect. 6 for further details).
\textcolorblackHowever, defining more sophisticated models able to explain the BPT diagram is beyond the aims of this work and would not influence our studies on the galaxy quenching phases.
\textcolorblackIt is important to note that the adopted SDSS data are sensitive enough for our methodology, which basically relies on the detection of variations in emission line ratios. Our assumptions of S/N (H) > 5 and S/N ([O III]) 2 allow to detect differences between these two lines (and thus variations in their ratio) by up to a factor 10. More precisely, the limiting fluxes for [O III] and H in our sample are erg s-1 cm-2 and erg s-1 cm-2, respectively, and the lowest detected log([O III]/H) is –1.5, which corresponds to a difference by a factor 30 between the two lines (cfr. Quai et al, 2017, in prep). Furthermore, the analyzed SDSS individual spectra have a continuum S/N around the [O III] line > 5, which has been proved to be sufficient to provide reasonable measurements of emission line fluxes (e.g. Thomas
et al., 2013). This further implies a good sensitivity to variations in ratios involving emission lines in this spectral region.
4.2 Comparison with other models
blackWe verify the reliability of our models comparing them with other predictions available in the literature: i.e. those presented in Kewley et al. (2001) (Kew01, hereafter) and those by Levesque
et al. (2010) (Lev10, hereafter). In Table 1 we summarize the main parameters characterising Kew01, Lev10, and our model.
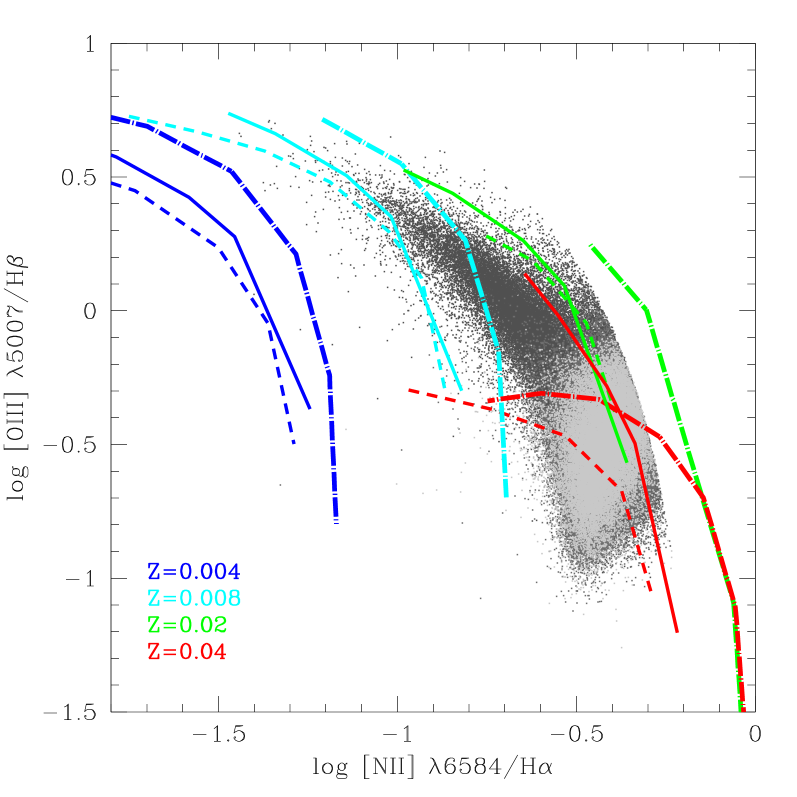
Fig. 4 shows the results within the BPT plane.
Note that, to be consistent with the literature, this comparison is performed only in the case of fixed-age models.
Our models are in reasonable agreement with the literature ones, at each metallicity. However, at Z , the dispersion among different predictions is more pronounced, and in some cases (e.g. Kew01) models produce too high [N II]/H values with respect to the data.
\textcolorblackWe also find that, at Z = 0.04, a difference in the [O III]/H vs. [N II]/H slope is present. This can be due to the different dust-prescriptions adopted, which lead our models to be dustier than those of Kew01 and Lev10. The discrepancy is larger at higher metallicities, where our models have an higher dust-to-gas ratios with respect to those of the literature (see Sect. 3).
In particular, when many ionizing photons are provided by the central source (i.e. at high log(U)), the larger amount of dust in our models amplifies grain photoelectric heating processes, which produce free electrons able to collisionally- excite the [O III]. This increases the [O III]/H ratio more than the Kev01 and Lev01 models, hence producing a steeper slope for our models. At lower log(U)0, when grain photoelectric heating processes decrease because of the very low number of ionizing photons, there is instead a better agreement among different models.
Note that this does not affect the lowest log(U)0 regimes (i.e. log(U)), which are the ones relevant in our study.
\textcolorblackMore generally, the discrepancies among different models are related to the different ingredients and photoionization codes adopted for the simulations. In particular, as already mentioned in Sect. 4.1, different stellar atmospheres can produce UV SEDs with different slopes, affecting the emission line ratios which are more sensitive to the UV hardness (Schmutz et al., 1992, Hillier &
Miller, 1998, Dopita et al., 2000, Pauldrach et al., 2001, Kewley et al., 2001, Levesque
et al., 2010). Furthermore, Kew01 models adopt higher depletion factors for some elements (e.g. C and Fe) and thus higher dust-to-metal ratios for a given metallicity. This produces an increase of the gas electron temperature, which favours the cooling from metal optical lines like [O III] and [N II] (e.g. Shields &
Kennicutt, 1995, Charlot &
Longhetti, 2001; Brinchmann
et al., 2013), increasing their fluxes and thus the emission line ratios in which they are involved.
| This work | Kew01 | Lev10 | |
|---|---|---|---|
| Code | CLOUDY 13.03 | MAPPINGS III | MAPPINGS III |
| Evolutionary tracks | Geneva High 1994 | Geneva High 1994 | Geneva High 1994 |
| Stellar atmospheres | Lejeune-Shmutz | Lejeune-Shmutz | Paldruach-Hillier |
| log(U)0 | log(U) | log(U) | log(U) |
| Ionizing source SFH | SSP | SSP | SSP |
| Ionizing source age | 0.01 Myr | 0.01 Myr | 0.01 Myr |
| Metallicity | 0.001, 0.004, 0.008, 0.02, 0.04 | 0.004, 0.008, 0.02, 0.04 | 0.004, 0.008, 0.02, 0.04 |
5 Quenching diagnostics
Before describing how the two emission line ratios mentioned above can help in identifying galaxies which are quenching their SF, in the following sections we describe in more details their behaviour as a function of time, ionization parameter and metallicity, and the relative degeneracies.
5.1 Emission lines ratios and their evolution with time
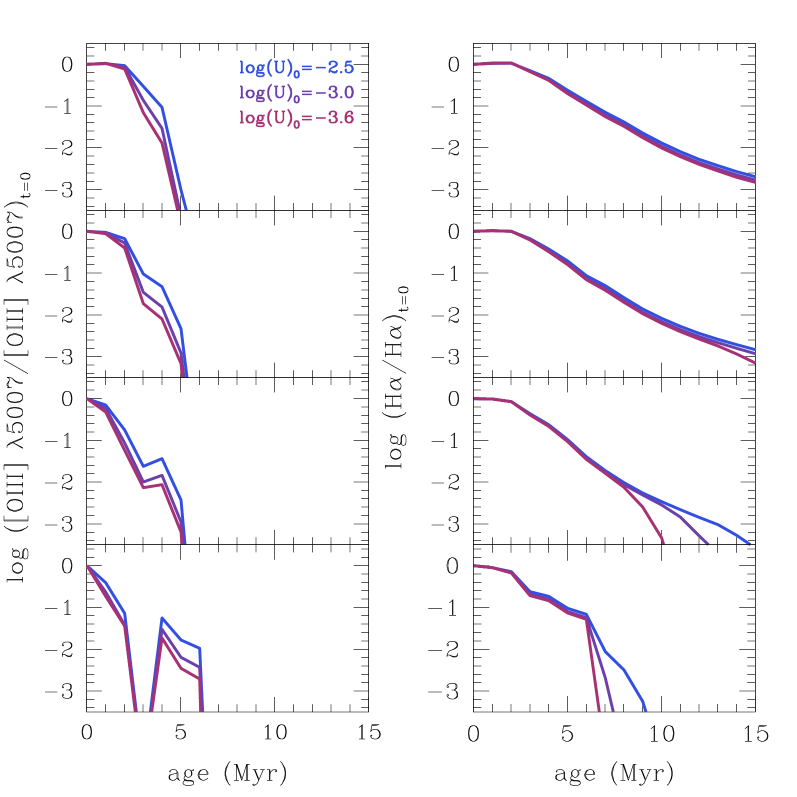
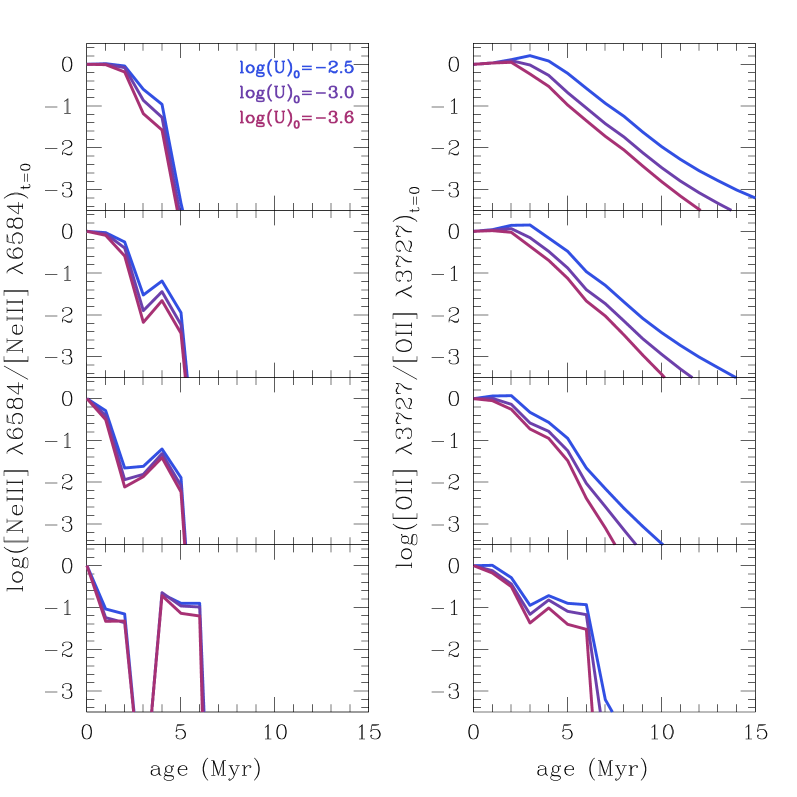
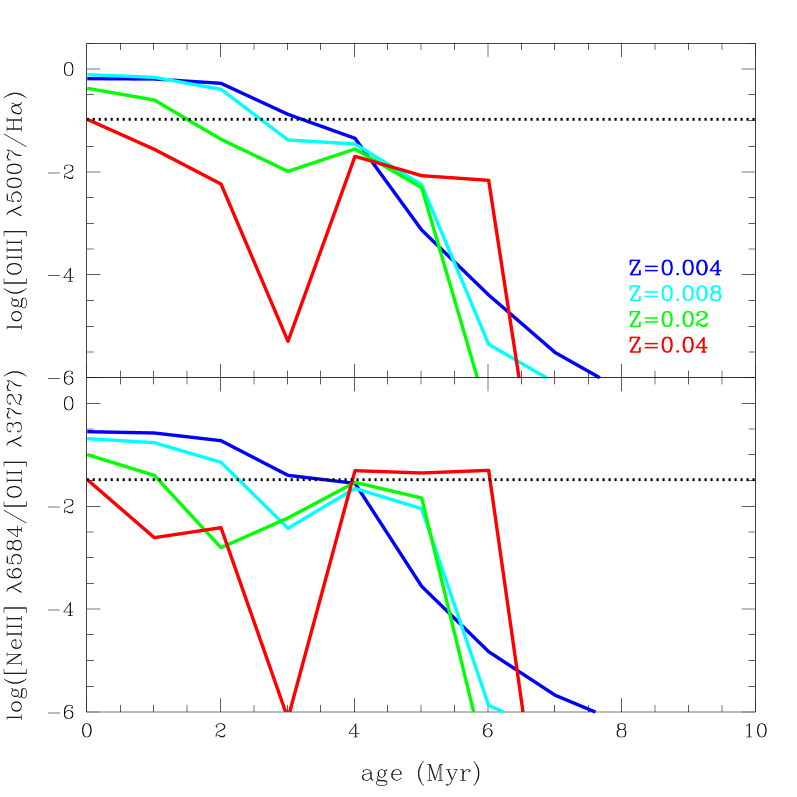
The two proposed emission line ratios are expected to suddenly react to the halt of the SF within a star-forming region. In this regard, Figs. 5 and 6 show the percentage variation of the emission lines as a function of time from the SF quenching, \textcolorblackfor different metallicities and initial log(U)0. Regardless of the initial log(U)0, high-ionization lines behave differently from low-ionization ones, with the former changing more significantly as a function of the various parameters. For instance, [O III] and [Ne III] drop by more than a factor 10 within the first Myr after the SF quenching, especially at the highest metallicity and the lowest log(U)0. Moreover, they experience a temporary rise at 4 Myr, which is particularly pronounced at the highest metallicities. This rise can be attributed to Wolf-Rayet (WR) stars, which are more numerous at higher metallicities (Schaller et al., 1992; see also Levesque
et al., 2010) and can supply, on short time intervals, very energetic photons able to re-ionize O++ and Ne++, producing a temporary increase of the line fluxes. \textcolorblackAfter Myr from the SF quenching, for all metallicities, both [O III] and [Ne III] have declined by a factor 100 with respect to their values in the star-forming phase and, at 10 Myr they are more than a factor 1000 lower than their initial value.
\textcolorblackCompared to [O III] and [Ne III], H and [O II] have a slower decline as a function of time, which is also delayed with respect to high-ionization lines. [O II], which differently from H depends on metallicity, is also less dependent on it than [O III] and [Ne III]. At Myr, when the high-ionization lines definitely drop, [O II] and H have declined by a factor 10 less, regardless of metallicity. In particular, it takes Myr for the low-ionization lines to decline by a factor . \textcolorblackThese predictions confirm that just quenched galaxies could lack of high-ionization emission lines, still having relatively strong low-ionization lines in their spectra.
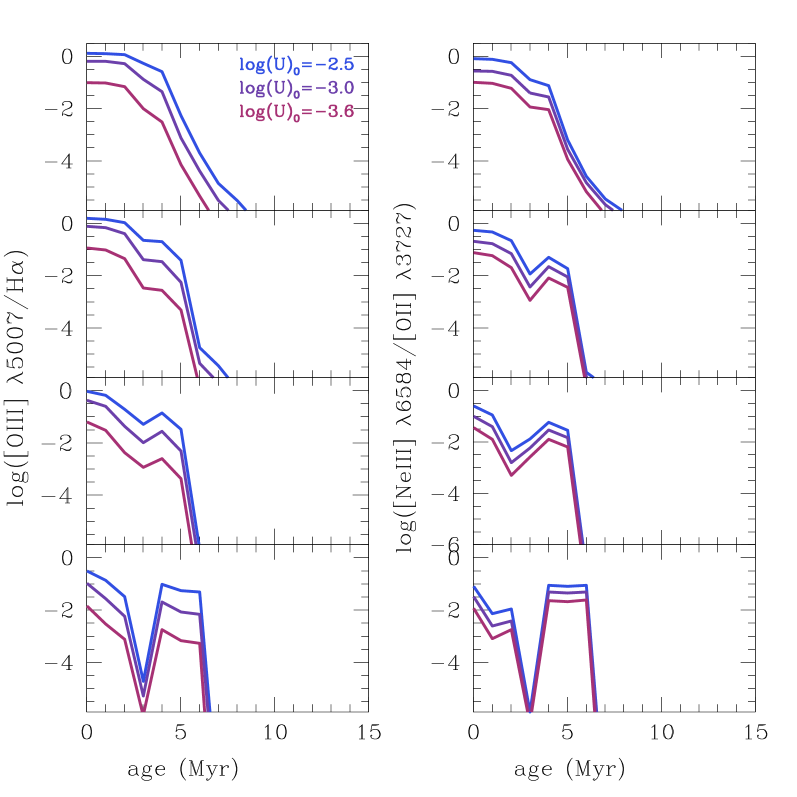
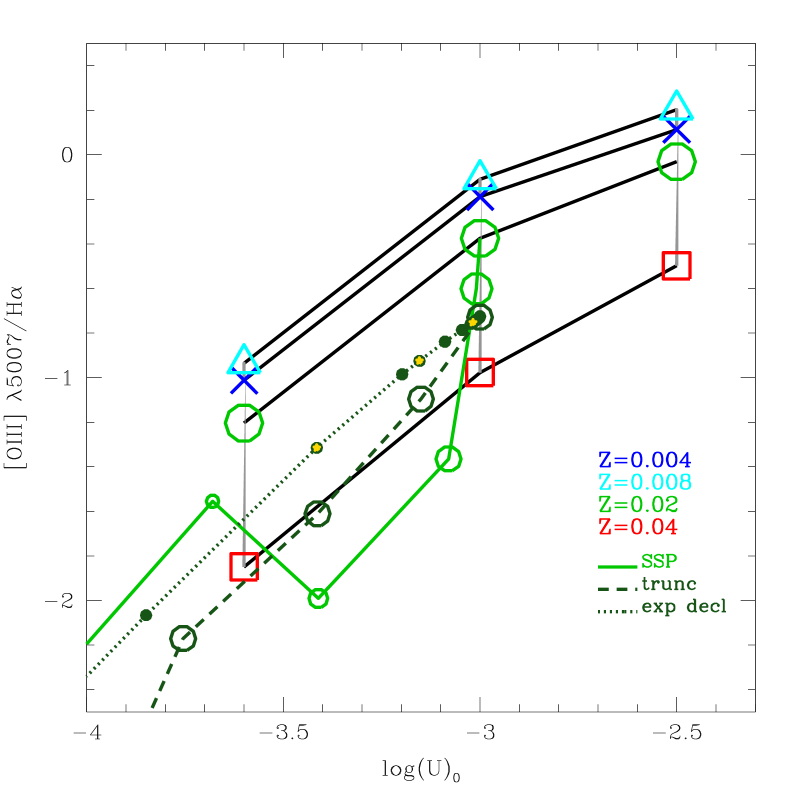
The behaviour of individual emission lines is reflected in the two emission line ratios considered in our study, as illustrated in Fig. 7. In particular, both [O III]/H and [Ne III]/[O II] decrease for increasing age and metallicity, at each log(U)0. For both emission line ratios, the decline is more pronounced at higher metallicities, \textcolorblacksince for a given age, more metallic massive stars have softer UV spectra. Indeed, at log(U) and at the lowest Z, [O III]/H and [Ne III]/[O II] decrease by 0.1 dex and 0.2 dex within 2 Myr from the SF quenching respectively, while at the highest Z they drop by 1.3 dex and 1 dex, within the same time interval. However, regardless of metallicity, the two emission line ratios are characterized by a decline by a factor 10 within Myr from the epoch of the SF quenching. \textcolorblackAlthough fixed-age models assume a fixed shape for the SED of the ionizing source, the ones which are characterized by the lowest log(U)0 can in some sense describe star-forming regions that are quenching their SF, since low-ionization parameters are related to low numbers of ionizing photons and then to low levels of star formation. For this reason, it can be interesting to investigate the behaviour of the emission line ratios under analysis as a function of both log(U)0 and log(U)t. Fig. 8 illustrates the case of [O III]/H. \textcolorblackFor Z=0.02, a decline by a factor 10 of this ratio corresponds to a decrease in log(U)t by 0.1 dex (starting from an initial log(U)), within a time interval of 2 Myr, while only a more pronounced decrease by 1 dex in log(U)0 can produce the same effect. Therefore, the decline of [O III]/H is more rapid for evolving-age models than for fixed-age ones. This is due to the fact that the former include the additional effect of the UV softening as a function of time.
5.2 \textcolorblackThe influence of different hydrogen densities
black
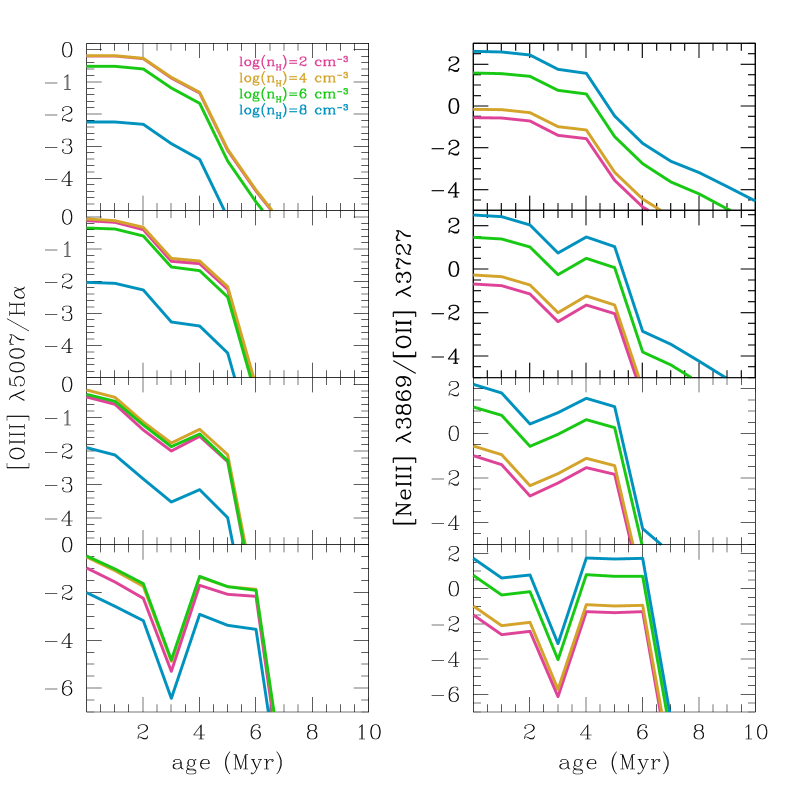
The typical hydrogen densities of H II regions are of the order of 100 cm-3, and are therefore well below the critical densities of the forbidden lines considered in our analysis222( cm-3, cm-3), cm-3).. However, it can be interesting to investigate how [O III]/H and [Ne III]/[O II] are affected by an increase of nH towards the critical densities () of [O III], [Ne III] and [O II].
As illustrated in Fig. 9, we find that [O III]/H increases by only 0.2 dex for < ([O III]), i.e. when H and [O III] are both increasing due to the increment of ionized hydrogen and free electrons able excite metal ions. On the contrary, when > ([O III]), [O III]/H rapidly drops, due to the prevalence of collisional on radiative de-excitations for the [O III] line.
The [Ne III]/[O II] ratio has a more complex behaviour, since it involves two forbidden lines. In particular, it increases by 0.5 dex for < ([O II]), while it starts to rapidly increase when ([O II]) is reached and [O II] saturates. This trend is inverted when also ([Ne III]) is reached.
In general, we find that zero-age models with high-nH can produce the same [O III]/H values as quenching ones with low-nH (and zero age models with low-nH can produce the same [Ne III]/[O II] values as quenching ones with high-nH), at each metallicity. This means that our models can in principle be affected by the nH degeneracy. However, this holds true for n, which is much larger than the typical nH in H II regions. This allows to exclude the very low [O III]/H and [Ne III]/[O II] found in this work to be related to density rather than quenching effects. Finally, we notice that the sudden drop of the emission line ratios after a few Myr from the SF quenching is present regardless of nH.
5.3 The influence of different synthetic stellar spectra
In this section we verify if the results illustrated in Sect. 5.1 are influenced by the use of different synthetic spectra to describe the central ionizing source. Fig. 10 illustrates a comparison between Starburst99 and BC03 models, in the case of log(U) and for the four metallicities considered in this work. The general behaviour of [O III]/H and [Ne III]/[O II] obtained using BC03 models is in agreement with the ones resulting from Starburst99 spectra. \textcolorblackBoth emission line ratios decline by a factor 10 within 10 Myr from the quenching of the SF, at each metallicity. After the SF shutdown, the behaviour of the two emission line ratios is more uneven in the case of BC03 models than for Starburst99 ones. This is probabily due to the different stellar atmospheres (see Charlot & Longhetti, 2001) and evolutionary tracks (see Bruzual & Charlot, 2003) used to compute the models. For instance, BC03 models are based on the Padova1994 evolutionary tracks (Bressan et al., 1994), which are characterized by a higher number of WR stars with respect to the Geneva-HIGH 1994 ones (as discussed in Bruzual & Charlot, 2003). This can give more pronounced discontinuities in the emission line ratios at the very early ages after the SF quenching. \textcolorblackThe time at which the two emission line ratios begin to definitely drop is the same in the case of BC03 and Starburst99 spectra. After this epoch, the time required to have a decrease by a factor 1000 is slightly higher for BC03 models, with a shift of Myr for both emission line ratios. Apart from these small differences, we can conclude that our methodology is valid also when BC03 models are adopted. This is an interesting result, since BC03 models are generally used only to describe more advanced evolutionary phases of galaxy evolution (e.g. Leitherer et al., 1999, Bruzual & Charlot, 2003, Chen et al., 2010).

5.4 The influence of different star formation histories
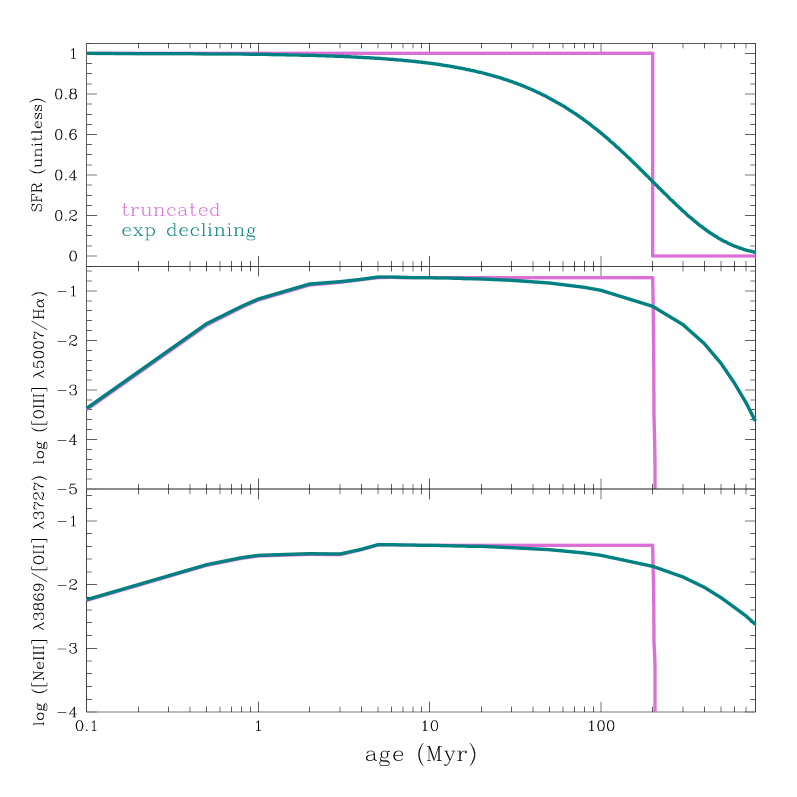
blackThe instantaneous SF quenching modelled so far can be considered an extreme case, which allows to better show the strength of our approach to probe SF quenching on very short time-scales. In this section we investigate how the behaviour of [O III]/H and [Ne III]/[O II] changes if different star-formation histories (SFHs) and if a \textcolorblackmore realistic and smoother SFHs are assumed. In particular, using Starburst99 models, we analyse the case of a truncated SFH, with SFR = 1 yr-1 up to 200 Myr and zero at older ages, and the case of a smoother decline described by an exponentially declining SFR (i.e. SFR ), with 200 Myr, since this is the SFH shape generally assumed to describe local star-forming galaxies (e.g. Bell & de
Jong, 2001). \textcolorblackFor the truncated SFH, a SFR = 1 yr-1 is chosen to match the typical SFRs of SDSS star-forming galaxies (Brinchmann
et al., 2004, Whitaker
et al., 2014) at stellar masses comparable with the ones of our sample. For the exponentially declining SFH, \textcolorblackmodels are normalized to . Moreover, we do not consider very high values of Myr, since in this case the SFH would extend at much larger times, incompatible with our assumption that galaxies are quenching their SF\textcolorblack. Furthermore, larger ’s have been demonstrated to produce galaxies which never leave the blue cloud (e.g. Schawinski
et al., 2014).
For both SFHs, we consider Z = 0.02 and an initial ionization level log(U). In particular, to be consistent with the SSP case (see Sect. 5.1), for the truncated SFH we attribute log(U) at the time corresponding to the last act of SF (i.e. 200 Myr in this case). For the exponentially declining SFH, log(U) is instead associated to the age at which begins to drop ( Myr), since we are interested in the epochs at which the SF starts to quench. \textcolorblackMoreover, these choices allow to avoid, at very early times (O stars) (i.e. yr), the short transient phase during which a rapid rise of ionizing photons characterizes both SFHs (see Madau
et al., 1998), \textcolorblackalso reflecting on the two emission line ratios under analysis (see Fig. 11).
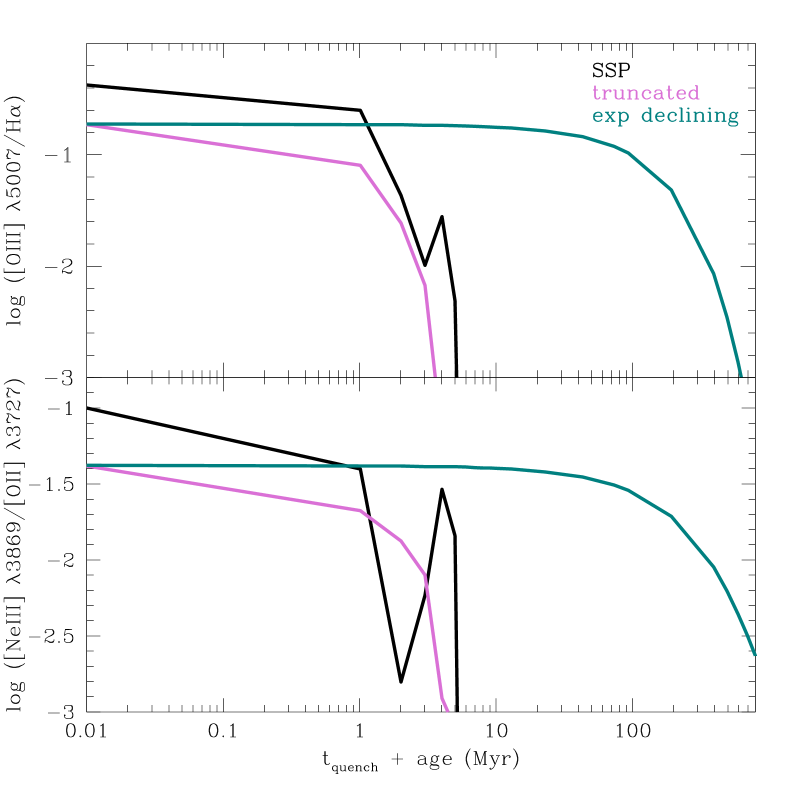
\textcolorblackFig. 12 shows the time evolution of [O III]/H and [Ne III]/[O II] for the three assumed SFHs, starting from the time of quenching.
For the truncated SFH stopping at 200 Myr, the two emission line ratios drop by a factor 10 within 2 Myr and by more than a factor 1000 within 10 Myr from the quenching of the SF, similarly to the SSP case.
In the case of an exponentially declining SFR, instead, they decrease following the decline of the SFR. In particular, we find that the star-forming region takes 80 Myr to become quiescent, reaching specific star-formation rate (sSFR) yr-1 (which are typical of quiescent galaxies) and, within this time interval, both [O III]/H and [Ne III]/[O II] decrease by a factor 2.
\textcolorblackThis decline corresponds to a decrease in log(U)t by only 0.2 dex, as illustrated in Fig. 8, implying that, when smoother SFHs are considered, log(U)t has a smoother decline. Moreover, 500 Myr are necessary for the two emission line ratios to decline by a factor 10.
\textcolorblackIt is interesting to note that the value of the two emission line ratios at the age at which the SF stops \textcolorblack(200 Myr for the truncated and 10 Myr for the exponentially declining SFH) is lower by a factor \textcolorblack2 \textcolorblackfor more complex SFHs than for a 0.01 Myr SSP with the same log(U). Therefore, if an ionizing stellar population forms stars \textcolorblackcontinuously on a longer time interval, its SED at the time of quenching is softer than the SED of a stellar population which forms all its stars into a single burst. \textcolorblackThis can be due to the accumulation of long lived stars contributing mostly to the flux at longer wavelengths. Moreover, the temporary increase of [O III]/H and [Ne III]/[O II] due to Wolf-Rayet stars is less evident for more complex SFHs than for the SSP case, \textcolorblacksince, even after the SF quenching, the evolution is dominated by the numerous generations of stars formed during time rather than by the short lived WR stars.
\textcolorblackAll these trends confirm that the decline of [O III]/H and [Ne III]/[O II] takes place regardless of the shape of the assumed SFH and that very low values of these emission line ratios are expected whether galaxies have abruptly quenched their SF or they have gradually reached low levels of SF.
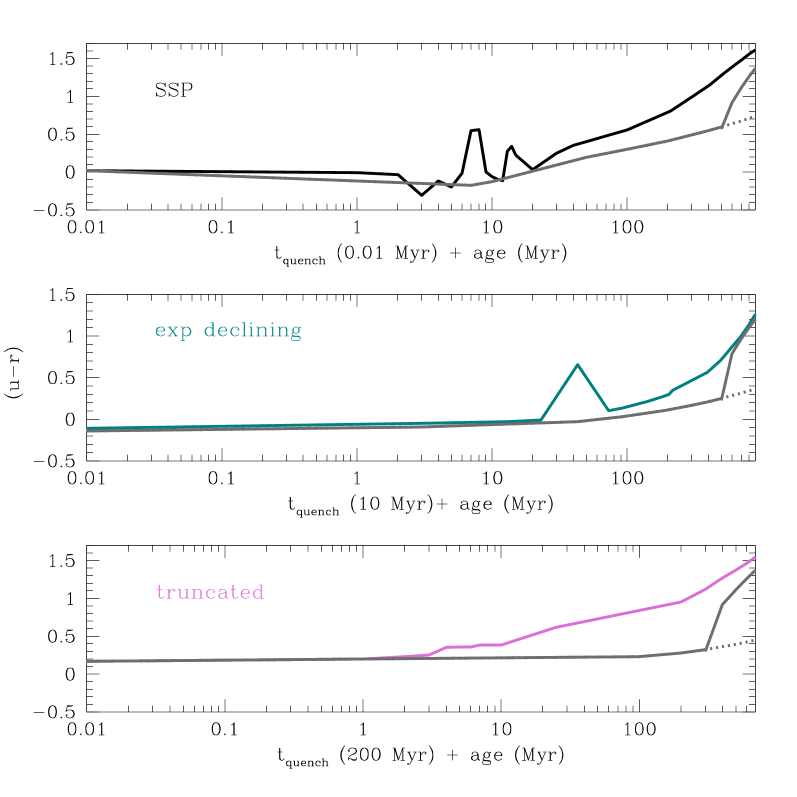
5.5 The time evolution of optical colours
black\textcolorblackThe softening of the SED associated to the SF quenching also implies an evolution of galaxy colours with time. Since we are analyzing optical SDSS spectra, in this section we focus on the intrinsic optical colour, showing its evolution as a function of time in Fig. 13. In particular, the three analyzed quenching SFHs are compared to a continuous SFH with SFR = 1 M☉ yr-1 and to a quenching SFH with SFR = 1 M☉ yr-1 until 500 Myr and zero at later ages. The colour reddening is fast for the quenching SFHs, and colours are always redder than the colours of a continuous SF model even when a significant population of old stars has already been built up (i.e. after 500 Myr - 1 Gyr). We find that the typical colours of green valley (, depending on mass) or red sequence () galaxies (Schawinski et al., 2014) are reached at later times (i.e. 1 Gyr) with respect to the time-scales considered so far (i.e. 10 – 100 Myr). This happens even when an old stellar population is already present for a continuous SF model at the time of the SF halt (as in the case of the 500 Myr-truncated SFH). It is important to note that all these trends refer to an individual quenching stellar population and could thus be diluted by the mutual effects of the multiple stellar populations inside a galaxy which are experiencing different evolutionary stages.
5.6 The expected fractions of quenching candidates
In the previous sections we found that [O III]/H and [Ne III]/[O II] are very sensitive to the SF quenching and that star-forming galaxies characterized by low values of these two emission line ratios might be objects caught in the act of quenching. However, the precise time-scales that the emission line ratios are able to trace depend on the SFH of the central ionizing source. \textcolorblackDeriving these time-scales can be useful to understand what is the physical phenomenon associated to the SF quenching and to estimate the fraction of galaxies observed in the phase of quenching. In particular, the faster the SF is quenched, the faster the galaxies move from the blue cloud to the red sequence, and the less they clump in the transition zone. To estimate the percentages of objects which are expected to be in the quenching phase, \textcolorblackwe use the following eq. 2:
| (2) |
where is the expected fraction of quenching galaxies, is the time needed for the emission line ratios to decrease by a factor 10 (i.e. 10 Myr for the SSP/truncated case and 500 Myr for the exponentially declining SFH, see Sect. 5.1) and is the doubling-mass time (e.g. Guzmán
et al., 1997, Madau &
Dickinson, 2014), which we consider as a proxy of the typical life-time of a SF galaxy (Guzmán
et al., 1997 and Greis et al., 2016). In particular, since the typical sSFRs of SF galaxies with redshift and masses comparable to ours (i.e. 0.2 < < 0.4 and 9 < log(M/M☉) < 12) range from 100.3 Gyr-1 to 100.1 Gyr-1 (e.g. Karim
et al., 2011), we can deduce that the typical for our sample range from 3 Gyr to 10 Gyr, increasing for increasing mass.
\textcolorblackThe expected fractions of quenching galaxies are 0.06 – 0.2 for the SSP/truncated SFHs and to 5 – 15 for the exponentially declining one, respectively, decreasing for increasing mass.
\textcolorblackIt is interesting to note that, once that a complete sample of quenching candidates is selected from a SF galaxy sample, the observed fractions derived from data can help in disentangling what are the effective time-scales of the quenching mechanism at work. However, degeneracies (see Sect. 6) and especially observational limits (e.g. the limiting fluxes of the analyzed emission line) can hamper the detections of the whole population of existing quenching candidates. Therefore, the derived percentages should be considered as lower limits, as well as the inferred quenching time-scales.
6 Mitigating the ionization - metallicity degeneracy
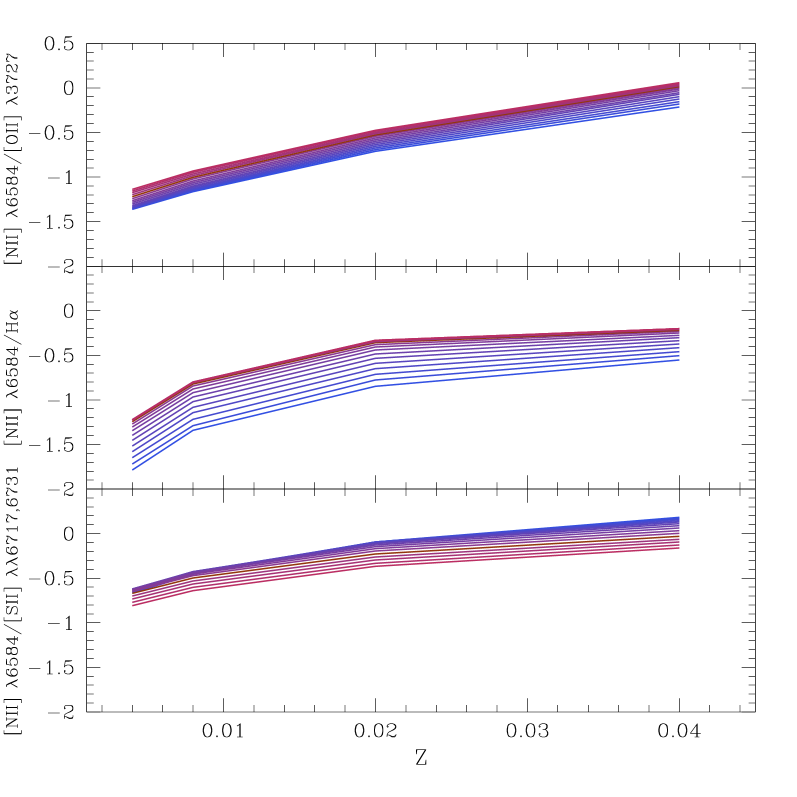
blackOne of the limitations of our methodology is the metallicity degeneracy. Indeed, since higher metallicity ionizing SEDs are softer than lower metallicity ones due to the larger opacity of the ionizing stars (see Fig. 2), they can have the same effects on the emitted spectrum and emission line ratios as quenched, low-ionization ones. Reducing this degeneracy is extremely important for our analysis, in order to exclude objects whose [O III]/H and [Ne III]/[O II] are low because of high metallicities rather than low ionization. The main effect of the metallicity degeneracy is illustrated in Fig. 14, for log(U). The same value of an emission line ratio can be produced by different combinations of age (i.e. log(U)t) and metallicity. In particular, younger star-forming regions with higher metallicity can produce the same results as older star-forming regions with lower metallicity. This occurs for both [O III]/H and [Ne III]/[O II].
To mitigate the effects of the metallicity degeneracy, we suggest the use of independent pairs of emission line ratios, depending separately on ionization and metallicity as much as possible. In particular, we combine [O III]/H and [Ne III]/[O II] with the [N II] 6584/[O II] 3727 ([N II]/[O II], hereafter) emission line ratio, whose behaviour in our model as a function of the stellar metallicity is illustrated in Fig. 15, for a fixed age of 0.01 Myr. Here we also compare [N II]/[O II] with other two metallicity indicators, i.e. [N II]/H (e.g. Pettini & Pagel, 2004; Denicoló et al., 2002, Nagao et al., 2006) and [N II] 6584/[S II] 6717,6731 (e.g. Nagao et al., 2006) ([N II]/[S II], hereafter). While the [N II]/H and [N II]/[S II] ratios flatten at high metallicities (Kewley & Dopita, 2002, Levesque et al., 2010) and have a larger dependences on the ionization level, [N II]/[O II] scales smoothly from low to high abundances and has a little dependence on log(U)0 (e.g. van Zee et al., 1998, Dopita et al., 2000, Kewley & Dopita, 2002). Moreover, even if the [N II]/[S II] ratio is less affected by reddening effects (it involves emission lines which are closer in wavelength), \textcolorblackit has a weaker dependence on metallicity with respect to [N II]/[O II], which has also the advantage of including stronger, and thus more easily detectable, emission lines. Therefore, it can be preferable once that the observed emission lines are corrected for dust extinction. In the following, in order to mitigate the metallicity degeneracy, we combine the two proposed quenching diagnostics with the [N II]/[O II] ratio.
7 Identifying galaxies in the quenching phase
blackIn the previous sections we found that \textcolorblack galaxies which have quenched their SF in the recent past can be characterized by low values of the [O III]/H and the [Ne III]/[O II] emission line ratios. \textcolorblackIn this section, we test the reliability of our approach by applying it to the SDSS sample described in Sect. 4.1, and analyzing the properties of some of the extreme candidates selected.
\textcolorblackHowever, it is important to remind that it is beyond the scope of this work to identify a complete sample of quenching candidates and to investigate their detailed properties, for which we refer to a companion paper (Quai et al. 2017, in prep).
\textcolorblackOur methodology consists in selecting galaxies with high S/N H in their spectra and lying at the lowest envelope (i.e. lowest log(U)0) of the SF galaxy distribution within the [O III]/H vs. [N II]/[O II] diagnostic diagram. Following the results discussed in Sect. 6, this plane is able to mitigate the metallicity degeneracy. \textcolorblackSince [O III]/H and [N II]/[O II] are affected by dust extinction, we corrected the involved emission lines adopting the Calzetti extinction curve (Calzetti et al., 2000) and using the H/H ratio to estimate the nebular colour excess . It is worth noting that, since the metallicity degeneracy strongly affects the [O III]/H vs. [N II]/H plane, we do not use it to identify possible quenching candidates, although all the objects lying below log([O III]/H)< – 0.5 would fulfill our selection criterion (see Fig. 3).
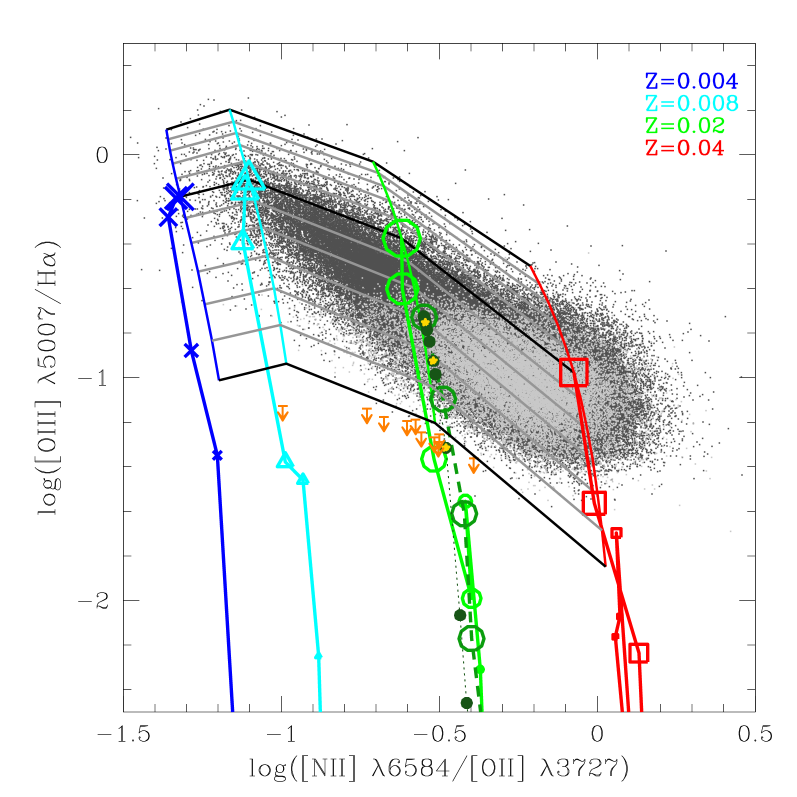
As it is possible to note from Fig. 16, the bulk of the data distribution lies within a range of fixed-age ionization parameters going from log(U) – 3 to log(U) – 3.6, and spans the entire metallicity range of our models (the discrepancy between data and models at high values of [N II]/[O II] can be explained as in Sect. 4.1). The median of the data distribution can be described by log(U) decreasing for increasing metallicity, in agreement with the literature results concerning star-forming galaxies at low redshifts (e.g. Dopita
et al., 2006, Nakajima &
Ouchi, 2014, Shirazi et al., 2014, Hayashi
et al., 2015, Kashino
et al., 2016, Onodera
et al., 2016). Given this latter consideration, we also show evolving-age models characterized by log(U) at the time in which the SF stops, both in the SSP and the smoother SFHs cases (see Sect. 5.4), for Z = 0.02. We find that the initial value of the [O III]/H ratio is lower for smoother SFHs than for SSPs, as already discussed in Sect. 5.4. Furthermore, for the exponentially declining SFH, the decrease of [O III]/H is very slow, with the [O III]/H values corresponding to the first 10 Myr after the SF quenching accumulating within 0.1 dex.
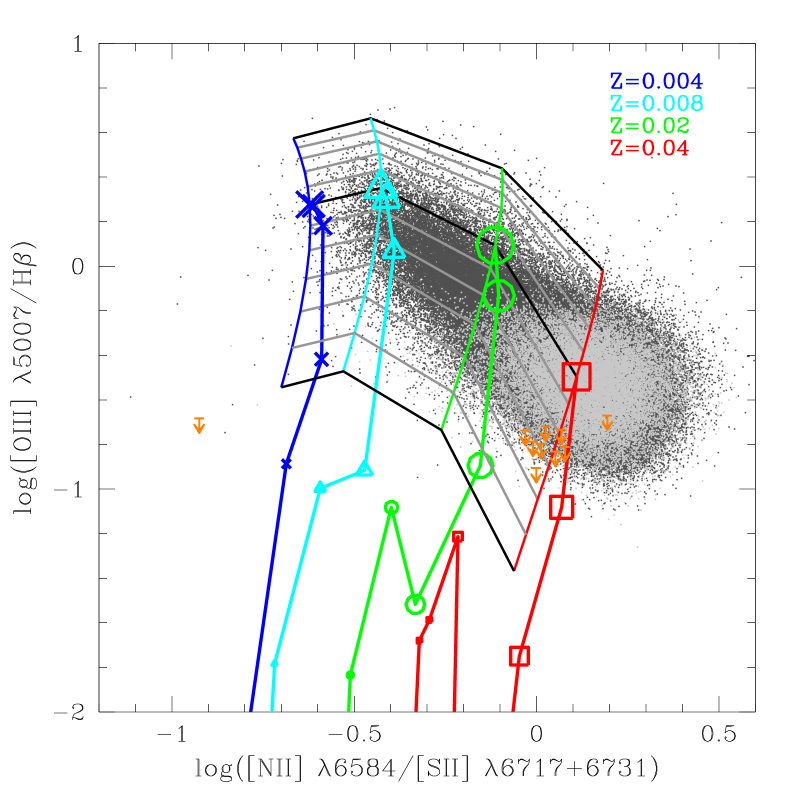
Since within this diagnostic diagram metallicity effects are separated from ionization ones, at each [N II]/[O II] (i.e. at each metallicity), objects with the lowest [O III]/H ratios could be considered as quenching candidates. Starting from this, we select a subsample of 10 extreme objects with [O III]/H below the values corresponding to the lowest log(U) and with S/N([O III]) < 2. \textcolorblack \textcolorblackThis ionization level is consistent with the quiescent phase of SSP evolving-age models, reached Myr after quenching and corresponding to log(U). \textcolorblackIf smoother SFHs are assumed, these very low levels of [O III]/H are instead reached 200 Myr after the SF quenching, at log(U).
\textcolorblack
The 10 selected objects are not detected in [O III] and they have upper limits – 1.1 on the OIII/Halpha ratio. Moreover, basing on our models of [N II]/[O II] and on Tremonti
et al. (2004) models, they have intermediate metallicities (i.e. log([N II]/[O II]) ranging from – 1 to – 0.4),
\textcolorblackand a faint [Ne III] emission line with S/N([Ne III]) < 2 (see Sect. 4.1). This is compatible with our suggestion that galaxies that have quenched their SF in the recent past can be characterized by the absence of high-ionization lines. Moreover, it confirms that the two proposed emission line ratios are complementary in the identification of quenching candidates.
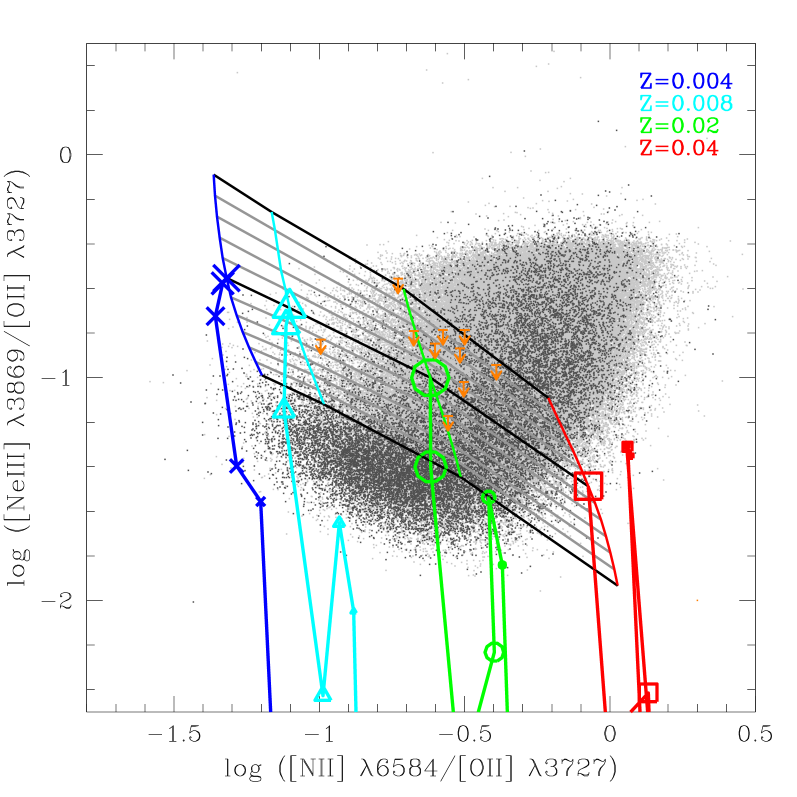
Fig. 17 illustrates the 10 objects in the [Ne III]/[O II] vs. [N II]/[O II] diagnostic diagram. Within this plane, the candidates have apparently high [Ne III]/[O II] ratios but, since [Ne III] is undetected, these values are actually upper limits, thus the real [Ne III]/[O II] ratios of the 10 objects can be much lower than the illustrated ones. The same holds for all the objects lying in the upper right or outside the model grid in Fig. 17, which are characterized by 2 < S/N([Ne III]) < 4.
7.1 \textcolorblackProperties of the quenching candidates
blackIn this section we \textcolorblackillustrate the main properties of the 10 selected quenching galaxies, verifying if they are compatible with a recent quenching of the SF.
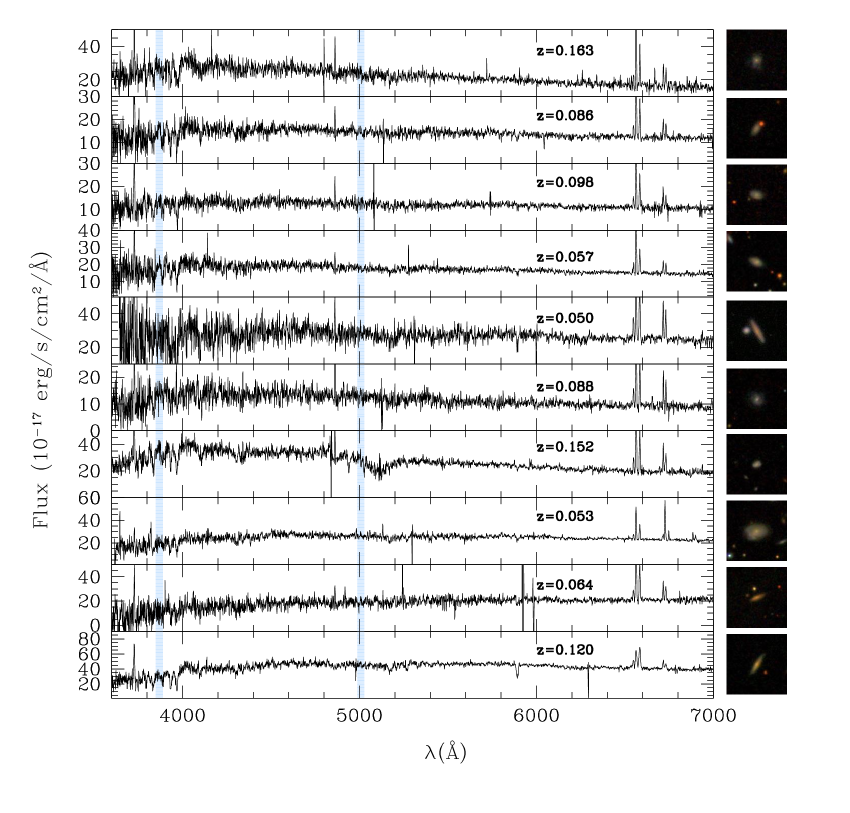
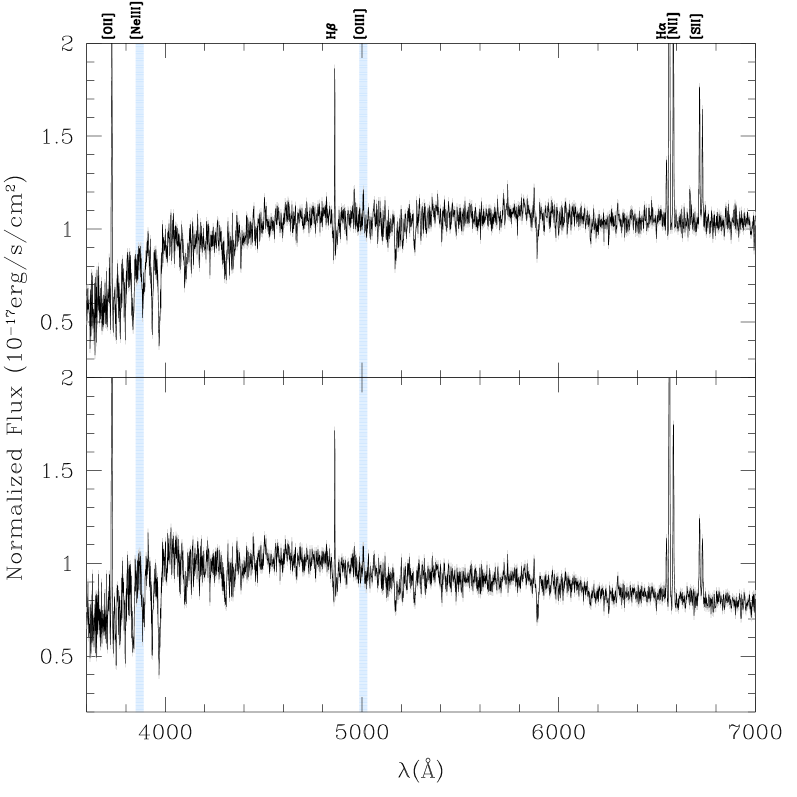
Figs. 18 and 19 illustrate the candidate spectra, corrected for dust extinction adopting the Calzetti extinction curve (Calzetti et al., 2000) and the H/H ratio to estimate the nebular colour excess . \textcolorblackIn particular, we applied the same correction for both the continuum and the emission lines. Spectra lack of strong absorption Balmer lines, which are characteristic of the post-starburst phase. This indicates that the candidates may have been caught in an earlier evolutionary phase with respect to the post-starburst (E+A, K+A) one (e.g. Dressler &
Gunn, 1983, Couch &
Sharples, 1987, Poggianti
et al., 2008). Moreover, they have strong H and [O II] lines\textcolorblack, in agreement with our predictions that low-ionization lines decrease by a small factor with respect to high-ionization ones in just quenched objects (cfr Sect. 5.1).
Fig. 19 \textcolorblackshows the median stacked spectrum of the 10 candidates obtained by stacking \textcolorblackthe individual spectra before and after applying the correction for dust extinction. In this latter case we assumed the Calzetti et al. (2000) extinction curve and the same nebular colour excess for both emission lines and continuum. \textcolorblackThe 10 candidates have , with a mean . The large of some of them explain why the stacked spectrum derived from individual spectra corrected for dust extinction is significantly bluer than the one derived from dust-extincted spectra. We find that, even after the stacking, which increases the S/N of the individual spectra, \textcolorblackthe stacked spectrum has very faint high-ionization lines in both cases. This confirms that the absence of the high-ionization emission lines \textcolorblackis a real feature and not an artifact due to low signal in the individual spectra.
\textcolorblackThe 10 candidates have high H luminosities L(H) (as expected from the evolution described in Sect. 5.1), ranging from 1040 to 1042 erg/s/Å, and a median SFR . However, we remind that the usual recipes to convert L(H) into SFR cannot be applied to our galaxies because most O stars are missing compared to a galaxy where star-formation is still ongoing. Therefore, the L(H)-derived SFRs represent the past SFRs (i.e. the ones before the quenching) and thus should be considered as upper limits. \textcolorblackWe also find that the 10 candidates have Elliptical and S0 morphologies. We refer to the companion paper Quai et al. (2017, in prep.) for a detailed discussion about the typical morphologies of complete samples of quenching candidates and how they relate to the parent population of SF galaxies.
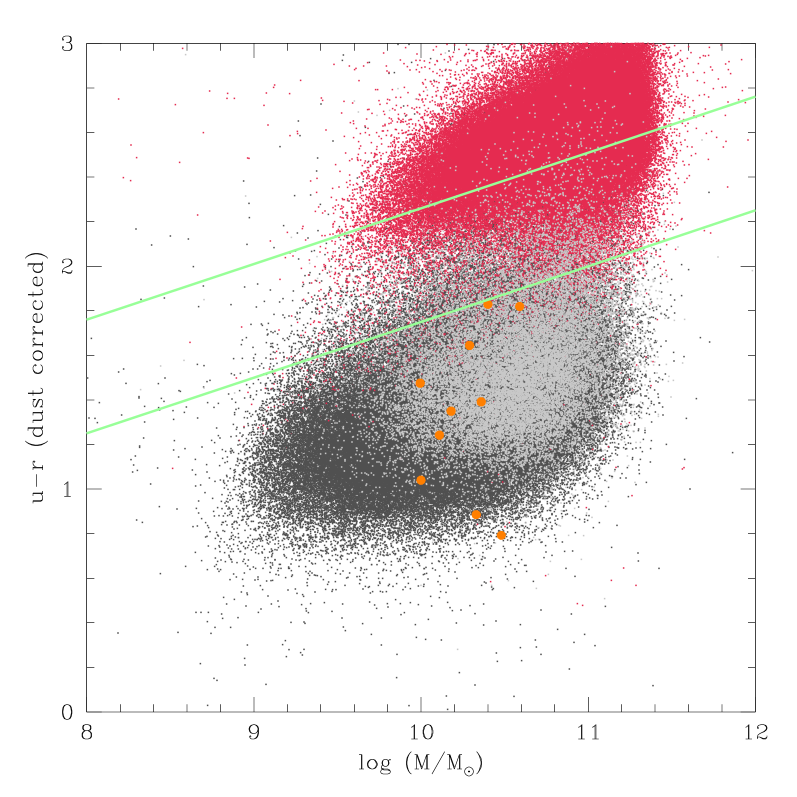
\textcolorblackThe nature of the 10 quenching candidates is also shown in Fig. 20, which illustrates the – mass diagram for our sample. Following Schawinski
et al. (2014), we corrected colours for dust extinction assuming the colour excess of the stellar continuum, defined as , where is the nebular continuum adopted so far (Calzetti et al., 2000). Colours are compatible with the evolution discussed in Sect. 5.5 at early times after the SF halt, and are bluer than the green valley colours (corrected for dust extinction) derived by Schawinski
et al. (2014). This suggests that the 10 galaxies may be at the beginning of the quenching process, not being yet as red as green valley galaxies. Furthermore, it is interesting to note that they have log(M/M☉) 10, compatible with the mass of the passive galaxy population building up at low-intermediate redshifts (e.g. Pozzetti
et al., 2010).
black
Since the [O III]/H and the [N II]/[O II] emission line ratios are affected by dust extinction, we verified if our results are influenced
\textcolorblackby the choice of the extinction law assumed to correct our data.\textcolorblack We adopt the Allen (1976) extinction curve, comparing the results with the ones obtained so far using the Calzetti et al. (2000) one. We quantify the effect of the two extinction laws on the emission line ratios [O III]/H and [N II]/[O II] by calculating the median extinction differences () and () for both cases.
We find that () is 0.35 in both cases, while () differs by 0.03 mag, with the Allen (1976) extinction curve producing slightly higher [N II]/[O II]. This very small discrepancy leads us to conclude that our approach is not influenced by the choice of the extinction curve.
We also investigated if our results are valid when dust-free diagnostic diagrams are used, which would have the advantage of producing results not relying on the assumption of an extinction law.
Fig. 21 shows the 10 quenching candidates within the [O III]/H vs. [N II]/[S II] plane, which involves ratios between emission lines closer in wavelength, and thus is basically unaffected by dust extinction. Although the discrepancy between models and data at the highest metallicities is still present, within this plane the 10 galaxies are located at the lowest edge of the data distribution, suggesting that the [O III]/H can be used as a dust-free, quenching diagnostic, similarly to [O III]/H. However, the [N II]/[S II] ratio, although being appropriate to avoid the uncertainties related to dust extinction, involves weaker lines like [S II] and is less efficient in separating different metallicities compared to [N II]/[O II], also producing larger errors relative to the covered range in metallicity.
blackSince the 10 selected objects are just an example of quenching candidates, they do not represent a complete sample of just quenched galaxies and cannot be used to derive reliable quenching candidate fractions (see Sect. 5.6). We refer to Quai et al (2017, in prep.) for a detailed discussion about them.
8 Conclusions
In this work, we propose a \textcolorblackmethodology aimed at identifying galaxies in the phase which immediately follows the quenching of the star formation, \textcolorblackunder the assumption of a fast quenching (shorter than 200 Myr), both for an extreme sharp case and for a more realistic, smoother SF decline. Our approach is based on the use of specific emission line ratios involving high- and low-ionization lines, which are expected to be strongly affected by quenching, rapidly dropping when the most massive O stars able to produce high-ionization lines, disappear. Our main findings can be summarized as follows.
-
1.
We focus in particular on the [O III]/H and [Ne III]/[O II] emission line ratios, modelling them by means of the CLOUDY (Ferland et al., 2013) photoionization code. We find that they are able to trace the phase just after the SF quenching, decreasing even by more than a factor 10 after its occurrence. The time-scales of this decline depend on the SFH adopted to characterize the ionizing stellar population. In particular, if \textcolorblackthe extreme case of a sharp quenching is assumed, the emission line ratios definitively drop on time-scales of 10 Myr after the SF quenching, while, if a smoother \textcolorblackand more realistic quenching is considered (e.g. an exponentially declining SFR with an -folding time = 200 Myr) they decline by a factor 2 within the time interval needed by the star-forming region to become quiescent (i.e. 80 Myr);
-
2.
Our methodology is valid even when different synthetic stellar spectra are assumed to characterize the central ionizing source. In particular, in the case of a sharp quenching, we find a good agreement between Starburst99 and BC03 models: the decline of the two emission line ratios occurs in both cases and happens on similar time-scales, at each metallicity. This is an interesting result, since BC03 models are generally used to describe more advanced phases of galaxy evolution;
-
3.
We find that our approach is influenced by the ionization – metallicity degeneracy, since more metallic ionizing sources, being characterized by a low number of hard UV ionizing photons, can produce the same low values of the analysed emission line ratios as quenching ionizing sources. We find that this degeneracy can be reduced using pairs of independent emission line ratios, separately related to metallicity and ionization. In particular, due to its strong dependence on metallicity and weak dependence on ionization parameter, we propose the [N II]/[O II] ratio as metallicity diagnostic to mitigate the degeneracy, and alternatively the [N II]/[S II] one, less affected by dust attenuation but involving weaker lines like [S II];
-
4.
We compare our models to a sample of 174,000 SDSS DR8 star-forming galaxies, in order to verify if objects characterized by low values of [O III]/H and [Ne III]/[O II] are indeed present in the global galaxy population and if their properties are compatible with a recent SF quenching. We mainly use the [O III]/H vs. [N II]/[O II] diagnostic diagram, since it is able to separate metallicity effects from ionization ones. Within this plane, we identify 10 objects with extremely low [O III]/H ratios and S/N([O III]) < 2. \textcolorblackWe find that their spectra are characterized by the absence of the [Ne III] line but rather strong H and [O II]. \textcolorblackAll these properties agree with the hypothesis that they may have quenched their SF in the recent past;
-
5.
\textcolor
blackWithin the dust-corrected – mass diagram, the 10 candidates lie outside the green valley, due to the bluer colours. These latter are compatible with the evolution predicted by our models after 10 – 100 Myr from the SF quenching, further suggesting that the 10 objects may be at the beginning of the quenching process;
-
6.
We find that \textcolorblackour methodology is independent from the dust extinction curve adopted to correct the data. Moreover, the [O III]/H ratio is similar to [O III]/H in identifying quenching candidates, while [N II]/[S II], although being unaffected by dust extinction, has the disadvantage to involve the weaker [S II] line and of being less efficient in separating metallicities with respect to [N II]/[O II], also producing larger errors relative to the covered range in metallicity;
-
7.
We verify that our approach is valid also when dust-free diagnostic diagrams, such as the [O III]/H vs. [N II]/[S II] one, are used. Indeed, the 10 quenching candidates lie at the lowest edge of the data distribution also in this plane.
blackThe proposed methodology suggests that emission line ratios involving high- and low-ionization lines are powerful tools to identify galaxies in the quenching phase. Moreover, this kind of approach has the advantage of being applicable also at higher redshifts, once that suitable pairs of emission lines are chosen. Therefore, our methodology can be used for the analysis of large spectroscopic surveys data such as JWST (Gardner et al., 2006), WFIRST (Spergel et al., 2013) and Euclid (Laureijs et al., 2011), which identify a large number of H emitters at (e.g. Pozzetti et al., 2016). \textcolorblackSince the 10 candidates identified in this work are just examples of quenching galaxies, they cannot be used to derive reliable quenching fractions. However, our results indicate that, once that a complete sample of quenching candidates is identified within a SF galaxy sample, their observed fraction, compared to the global population of star-forming galaxies, could be used to disentangle what is the quenching mechanism at work and what are its typical time-scales. We refer to a companion paper (Quai et al., 2017, in prep.) both for this purpose and for the investigation of the detailed properties of \textcolorblackcomplete samples of quenching candidates.
Acknowledgements
The authors are grateful to Emanuele Daddi and Grażyna Stasińska for useful discussion. ACit is also grateful to Lucia Armillotta, Alfonso Veropalumbo and Gianni Zamorani for helpful discussion and suggestions. The authors also acknowledge the support of the grant PRIN MIUR 2010-2011 The dark Universe and the cosmic evolution of baryons: from current surveys to Euclid, PRIN MIUR 2015 Cosmology and Fundamental Physics: illuminating the Dark Universe with Euclid and the grants ASI n.I/023/12/0 Attivit relative alla fase B2/C per la missione Euclid. Funding for the SDSS and SDSS-II has been provided by the Alfred P. Sloan Foundation, the Participating Institutions, the National Science Foundation, the U.S. Department of Energy, the National Aeronautics and Space Administration, the Japanese Monbukagakusho, the Max Planck Society, and the Higher Education Funding Council for England. The SDSS Web Site is http://www.sdss.org/. The SDSS is managed by the Astrophysical Research Consortium for the Participating Institutions. The Participating Institutions are the American Museum of Natural History, Astrophysical Institute Potsdam, University of Basel, University of Cambridge, Case Western Reserve University, University of Chicago, Drexel University, Fermilab, the Institute for Advanced Study, the Japan Participation Group, Johns Hopkins University, the Joint Institute for Nuclear Astrophysics, the Kavli Institute for Particle Astrophysics and Cosmology, the Korean Scientist Group, the Chinese Academy of Sciences (LAMOST), Los Alamos National Laboratory, the Max-Planck-Institute for Astronomy (MPIA), the Max-Planck-Institute for Astrophysics (MPA), New Mexico State University, Ohio State University, University of Pittsburgh, University of Portsmouth, Princeton University, the United States Naval Observatory, and the University of Washington.
References
- Allen (1976) Allen C. W., 1976, Astrophysical Quantities
- Asplund et al. (2005) Asplund M., Grevesse N., Sauval A. J., 2005, in Barnes III T. G., Bash F. N., eds, Astronomical Society of the Pacific Conference Series Vol. 336, Cosmic Abundances as Records of Stellar Evolution and Nucleosynthesis. p. 25
- Baldry et al. (2004) Baldry I. K., Glazebrook K., Brinkmann J., Ivezić Ž., Lupton R. H., Nichol R. C., Szalay A. S., 2004, ApJ, 600, 681
- Baldwin et al. (1981) Baldwin J. A., Phillips M. M., Terlevich R., 1981, PASP, 93, 5
- Balogh et al. (2011) Balogh M. L., et al., 2011, MNRAS, 412, 2303
- Bekki (1998) Bekki K., 1998, ApJ, 502, L133
- Bekki et al. (2002) Bekki K., Couch W. J., Shioya Y., 2002, ApJ, 577, 651
- Bell & de Jong (2001) Bell E. F., de Jong R. S., 2001, ApJ, 550, 212
- Bell et al. (2004) Bell E. F., et al., 2004, ApJ, 600, L11
- Bell et al. (2012) Bell E. F., et al., 2012, ApJ, 753, 167
- Benson (2012) Benson A. J., 2012, New Astron., 17, 175
- Blanton et al. (2003) Blanton M. R., et al., 2003, ApJ, 594, 186
- Bournaud et al. (2007) Bournaud F., Jog C. J., Combes F., 2007, A&A, 476, 1179
- Boylan-Kolchin et al. (2009) Boylan-Kolchin M., Springel V., White S. D. M., Jenkins A., Lemson G., 2009, MNRAS, 398, 1150
- Brammer et al. (2009) Brammer G. B., et al., 2009, ApJ, 706, L173
- Brammer et al. (2011) Brammer G. B., et al., 2011, ApJ, 739, 24
- Bressan et al. (1994) Bressan A., Chiosi C., Fagotto F., 1994, ApJS, 94, 63
- Brinchmann et al. (2004) Brinchmann J., Charlot S., White S. D. M., Tremonti C., Kauffmann G., Heckman T., Brinkmann J., 2004, MNRAS, 351, 1151
- Brinchmann et al. (2013) Brinchmann J., Charlot S., Kauffmann G., Heckman T., White S. D. M., Tremonti C., 2013, MNRAS, 432, 2112
- Bruzual & Charlot (2003) Bruzual G., Charlot S., 2003, MNRAS, 344, 1000
- Calzetti et al. (2000) Calzetti D., Armus L., Bohlin R. C., Kinney A. L., Koornneef J., Storchi-Bergmann T., 2000, ApJ, 533, 682
- Carpineti et al. (2012) Carpineti A., Kaviraj S., Darg D., Lintott C., Schawinski K., Shabala S., 2012, MNRAS, 420, 2139
- Cassata et al. (2008) Cassata P., et al., 2008, A&A, 483, L39
- Charlot & Longhetti (2001) Charlot S., Longhetti M., 2001, MNRAS, 323, 887
- Chen et al. (2010) Chen X. Y., Liang Y. C., Hammer F., Prugniel P., Zhong G. H., Rodrigues M., Zhao Y. H., Flores H., 2010, A&A, 515, A101
- Cheung et al. (2012) Cheung E., et al., 2012, ApJ, 760, 131
- Cicone et al. (2014) Cicone C., et al., 2014, A&A, 562, A21
- Ciesla et al. (2016) Ciesla L., et al., 2016, A&A, 585, A43
- Cimatti et al. (2013) Cimatti A., et al., 2013, ApJ, 779, L13
- Citro et al. (2016) Citro A., Pozzetti L., Moresco M., Cimatti A., 2016, A&A, 592, A19
- Couch & Sharples (1987) Couch W. J., Sharples R. M., 1987, MNRAS, 229, 423
- Courteau et al. (1996) Courteau S., de Jong R. S., Broeils A. H., 1996, ApJ, 457, L73
- Dasyra et al. (2006) Dasyra K. M., et al., 2006, ApJ, 651, 835
- Debattista et al. (2006) Debattista V. P., Mayer L., Carollo C. M., Moore B., Wadsley J., Quinn T., 2006, ApJ, 645, 209
- Dekel & Birnboim (2006) Dekel A., Birnboim Y., 2006, MNRAS, 368, 2
- Denicoló et al. (2002) Denicoló G., Terlevich R., Terlevich E., 2002, MNRAS, 330, 69
- Diamond-Stanic et al. (2012) Diamond-Stanic A. M., Moustakas J., Tremonti C. A., Coil A. L., Hickox R. C., Robaina A. R., Rudnick G. H., Sell P. H., 2012, ApJ, 755, L26
- Dopita et al. (2000) Dopita M. A., Kewley L. J., Heisler C. A., Sutherland R. S., 2000, ApJ, 542, 224
- Dopita et al. (2006) Dopita M. A., et al., 2006, ApJS, 167, 177
- Draine et al. (2007) Draine B. T., et al., 2007, ApJ, 663, 866
- Dressler & Gunn (1983) Dressler A., Gunn J. E., 1983, ApJ, 270, 7
- Drory et al. (2004) Drory N., Bender R., Feulner G., Hopp U., Maraston C., Snigula J., Hill G. J., 2004, ApJ, 608, 742
- Eisenstein et al. (2011) Eisenstein D. J., et al., 2011, AJ, 142, 72
- Faber et al. (2005) Faber S. M., Huang J.-S., Noeske K. G., Bundy K., DEEP2 Team IRAC GTO Team Palomar K-band Team 2005, in American Astronomical Society Meeting Abstracts. p. 1298
- Fabian (2012) Fabian A. C., 2012, ARA&A, 50, 455
- Farouki & Shapiro (1981) Farouki R., Shapiro S. L., 1981, ApJ, 243, 32
- Ferland et al. (1998) Ferland G. J., Korista K. T., Verner D. A., Ferguson J. W., Kingdon J. B., Verner E. M., 1998, PASP, 110, 761
- Ferland et al. (2013) Ferland G. J., et al., 2013, Rev. Mex. Astron. Astrofis., 49, 137
- Förster Schreiber et al. (2014) Förster Schreiber N. M., et al., 2014, ApJ, 787, 38
- Fraser-McKelvie et al. (2016) Fraser-McKelvie A., Brown M. J. I., Pimbblet K. A., Dolley T., Crossett J. P., Bonne N. J., 2016, MNRAS, 462, L11
- Gardner et al. (2006) Gardner J. P., et al., 2006, Space Sci. Rev., 123, 485
- Genzel et al. (2001) Genzel R., Tacconi L. J., Rigopoulou D., Lutz D., Tecza M., 2001, ApJ, 563, 527
- Genzel et al. (2014) Genzel R., et al., 2014, ApJ, 785, 75
- Greis et al. (2016) Greis S. M. L., Stanway E. R., Davies L. J. M., Levan A. J., 2016, MNRAS, 459, 2591
- Gunn & Gott (1972) Gunn J. E., Gott III J. R., 1972, ApJ, 176, 1
- Guzmán et al. (1997) Guzmán R., Gallego J., Koo D. C., Phillips A. C., Lowenthal J. D., Faber S. M., Illingworth G. D., Vogt N. P., 1997, ApJ, 489, 559
- Hayashi et al. (2015) Hayashi M., et al., 2015, PASJ, 67, 80
- Hibbard & van Gorkom (1996) Hibbard J. E., van Gorkom J. H., 1996, AJ, 111, 655
- Hillier & Miller (1998) Hillier D. J., Miller D. L., 1998, ApJ, 496, 407
- Hopkins et al. (2005) Hopkins P. F., Hernquist L., Cox T. J., Di Matteo T., Martini P., Robertson B., Springel V., 2005, ApJ, 630, 705
- Issa et al. (1990) Issa M. R., MacLaren I., Wolfendale A. W., 1990, A&A, 236, 237
- Johansson et al. (2012) Johansson J., Thomas D., Maraston C., 2012, MNRAS, 421, 1908
- Juarez et al. (2009) Juarez Y., Maiolino R., Mujica R., Pedani M., Marinoni S., Nagao T., Marconi A., Oliva E., 2009, A&A, 494, L25
- Karim et al. (2011) Karim A., et al., 2011, ApJ, 730, 61
- Kashino et al. (2016) Kashino D., et al., 2016, preprint, (arXiv:1604.06802)
- Kauffmann et al. (2003a) Kauffmann G., et al., 2003a, MNRAS, 341, 54
- Kauffmann et al. (2003b) Kauffmann G., et al., 2003b, MNRAS, 346, 1055
- Kaviraj (2010) Kaviraj S., 2010, MNRAS, 408, 170
- Kaviraj et al. (2007) Kaviraj S., Kirkby L. A., Silk J., Sarzi M., 2007, MNRAS, 382, 960
- Kewley & Dopita (2002) Kewley L. J., Dopita M. A., 2002, ApJS, 142, 35
- Kewley et al. (2001) Kewley L. J., Dopita M. A., Sutherland R. S., Heisler C. A., Trevena J., 2001, ApJ, 556, 121
- Kewley et al. (2013) Kewley L. J., Dopita M. A., Leitherer C., Davé R., Yuan T., Allen M., Groves B., Sutherland R., 2013, ApJ, 774, 100
- Khochfar & Silk (2006) Khochfar S., Silk J., 2006, ApJ, 648, L21
- Kormendy & Kennicutt (2004) Kormendy J., Kennicutt Jr. R. C., 2004, ARA&A, 42, 603
- Larson et al. (1980) Larson R. B., Tinsley B. M., Caldwell C. N., 1980, ApJ, 237, 692
- Laureijs et al. (2011) Laureijs R., et al., 2011, preprint, (arXiv:1110.3193)
- Leitherer et al. (1999) Leitherer C., et al., 1999, ApJS, 123, 3
- Lejeune et al. (1997) Lejeune T., Cuisinier F., Buser R., 1997, A&AS, 125
- Levesque et al. (2010) Levesque E. M., Kewley L. J., Larson K. L., 2010, AJ, 139, 712
- Lisenfeld & Ferrara (1998) Lisenfeld U., Ferrara A., 1998, ApJ, 496, 145
- Lu et al. (2011) Lu Y., Mo H. J., Weinberg M. D., Katz N., 2011, MNRAS, 416, 1949
- MacArthur et al. (2003) MacArthur L. A., Courteau S., Holtzman J. A., 2003, ApJ, 582, 689
- Madau & Dickinson (2014) Madau P., Dickinson M., 2014, ARA&A, 52, 415
- Madau et al. (1998) Madau P., Pozzetti L., Dickinson M., 1998, ApJ, 498, 106
- Marsan et al. (2015) Marsan Z. C., et al., 2015, ApJ, 801, 133
- Martig et al. (2009) Martig M., Bournaud F., Teyssier R., Dekel A., 2009, ApJ, 707, 250
- Martin et al. (2007) Martin D. C., et al., 2007, ApJS, 173, 342
- McIntosh et al. (2014) McIntosh D. H., et al., 2014, MNRAS, 442, 533
- Mendel et al. (2013) Mendel J. T., Simard L., Ellison S. L., Patton D. R., 2013, MNRAS, 429, 2212
- Meynet et al. (1994) Meynet G., Maeder A., Schaller G., Schaerer D., Charbonnel C., 1994, A&AS, 103
- Mobasher et al. (2005) Mobasher B., et al., 2005, ApJ, 635, 832
- Mok et al. (2013) Mok A., et al., 2013, MNRAS, 431, 1090
- Moore et al. (1999) Moore B., Lake G., Quinn T., Stadel J., 1999, MNRAS, 304, 465
- Morisset et al. (2016) Morisset C., et al., 2016, A&A, 594, A37
- Moustakas et al. (2006) Moustakas J., Kennicutt Jr. R. C., Tremonti C. A., 2006, ApJ, 642, 775
- Moustakas et al. (2010) Moustakas J., Kennicutt Jr. R. C., Tremonti C. A., Dale D. A., Smith J.-D. T., Calzetti D., 2010, ApJS, 190, 233
- Muzzin et al. (2012) Muzzin A., et al., 2012, ApJ, 746, 188
- Muzzin et al. (2013) Muzzin A., et al., 2013, ApJS, 206, 8
- Naab et al. (2006) Naab T., Khochfar S., Burkert A., 2006, ApJ, 636, L81
- Naab et al. (2007) Naab T., Johansson P. H., Ostriker J. P., Efstathiou G., 2007, ApJ, 658, 710
- Naab et al. (2009) Naab T., Johansson P. H., Ostriker J. P., 2009, ApJ, 699, L178
- Nagao et al. (2006) Nagao T., Maiolino R., Marconi A., 2006, A&A, 459, 85
- Nakajima & Ouchi (2014) Nakajima K., Ouchi M., 2014, MNRAS, 442, 900
- Norman et al. (1996) Norman C. A., Sellwood J. A., Hasan H., 1996, ApJ, 462, 114
- Onodera et al. (2016) Onodera M., et al., 2016, ApJ, 822, 42
- Pauldrach et al. (2001) Pauldrach A. W. A., Hoffmann T. L., Lennon M., 2001, A&A, 375, 161
- Pérez-Montero et al. (2013) Pérez-Montero E., et al., 2013, A&A, 549, A25
- Pettini & Pagel (2004) Pettini M., Pagel B. E. J., 2004, MNRAS, 348, L59
- Poggianti et al. (2004) Poggianti B. M., Bridges T. J., Komiyama Y., Yagi M., Carter D., Mobasher B., Okamura S., Kashikawa N., 2004, ApJ, 601, 197
- Poggianti et al. (2008) Poggianti B. M., et al., 2008, ApJ, 684, 888
- Pozzetti et al. (2010) Pozzetti L., et al., 2010, A&A, 523, A13
- Pozzetti et al. (2016) Pozzetti L., et al., 2016, A&A, 590, A3
- Quilis et al. (2000) Quilis V., Moore B., Bower R., 2000, Science, 288, 1617
- Quintero et al. (2004) Quintero A. D., et al., 2004, ApJ, 602, 190
- Rigby & Rieke (2004) Rigby J. R., Rieke G. H., 2004, ApJ, 606, 237
- Rothberg & Joseph (2004) Rothberg B., Joseph R. D., 2004, AJ, 128, 2098
- Salim (2014) Salim S., 2014, Serbian Astronomical Journal, 189, 1
- Sanders et al. (1988) Sanders D. B., Soifer B. T., Elias J. H., Madore B. F., Matthews K., Neugebauer G., Scoville N. Z., 1988, ApJ, 325, 74
- Schaefer et al. (2017) Schaefer A. L., et al., 2017, MNRAS, 464, 121
- Schaller et al. (1992) Schaller G., Schaerer D., Meynet G., Maeder A., 1992, A&AS, 96, 269
- Schawinski et al. (2014) Schawinski K., et al., 2014, MNRAS, 440, 889
- Schmutz et al. (1992) Schmutz W., Leitherer C., Gruenwald R., 1992, PASP, 104, 1164
- Schweizer & Seitzer (1992) Schweizer F., Seitzer P., 1992, AJ, 104, 1039
- Shields & Kennicutt (1995) Shields J. C., Kennicutt Jr. R. C., 1995, ApJ, 454, 807
- Shirazi et al. (2014) Shirazi M., Brinchmann J., Rahmati A., 2014, ApJ, 787, 120
- Spergel et al. (2013) Spergel D., et al., 2013, preprint, (arXiv:1305.5422)
- Springel et al. (2005) Springel V., et al., 2005, Nature, 435, 629
- Stasińska et al. (2006) Stasińska G., Cid Fernandes R., Mateus A., Sodré L., Asari N. V., 2006, MNRAS, 371, 972
- Strateva et al. (2001) Strateva I., et al., 2001, AJ, 122, 1861
- Tal et al. (2009) Tal T., van Dokkum P. G., Nelan J., Bezanson R., 2009, AJ, 138, 1417
- Taranu et al. (2014) Taranu D. S., Hudson M. J., Balogh M. L., Smith R. J., Power C., Oman K. A., Krane B., 2014, MNRAS, 440, 1934
- Thomas et al. (2013) Thomas D., et al., 2013, in Thomas D., Pasquali A., Ferreras I., eds, IAU Symposium Vol. 295, The Intriguing Life of Massive Galaxies. pp 129–132, doi:10.1017/S174392131300450X
- Tielens (2010) Tielens A. G. G. M., 2010, The Physics and Chemistry of the Interstellar Medium
- Tinker et al. (2010) Tinker J. L., Wechsler R. H., Zheng Z., 2010, ApJ, 709, 67
- Tremonti et al. (2004) Tremonti C. A., et al., 2004, ApJ, 613, 898
- Veilleux & Osterbrock (1987) Veilleux S., Osterbrock D. E., 1987, ApJS, 63, 295
- Wetzel et al. (2013) Wetzel A. R., Tinker J. L., Conroy C., van den Bosch F. C., 2013, MNRAS, 432, 336
- Whitaker et al. (2011) Whitaker K. E., et al., 2011, ApJ, 735, 86
- Whitaker et al. (2014) Whitaker K. E., et al., 2014, ApJ, 795, 104
- White & Frenk (1991) White S. D. M., Frenk C. S., 1991, ApJ, 379, 52
- Wiklind et al. (2008) Wiklind T., Dickinson M., Ferguson H. C., Giavalisco M., Mobasher B., Grogin N. A., Panagia N., 2008, ApJ, 676, 781
- Wild et al. (2009) Wild V., Walcher C. J., Johansson P. H., Tresse L., Charlot S., Pollo A., Le Fèvre O., de Ravel L., 2009, MNRAS, 395, 144
- Willmer et al. (2006) Willmer C. N. A., et al., 2006, ApJ, 647, 853
- Wu et al. (2014) Wu P.-F., Gal R. R., Lemaux B. C., Kocevski D. D., Lubin L. M., Rumbaugh N., Squires G. K., 2014, ApJ, 792, 16
- Wuyts et al. (2011) Wuyts S., et al., 2011, ApJ, 742, 96
- Yeh & Matzner (2012) Yeh S. C. C., Matzner C. D., 2012, ApJ, 757, 108
- Zabludoff et al. (1996) Zabludoff A. I., Zaritsky D., Lin H., Tucker D., Hashimoto Y., Shectman S. A., Oemler A., Kirshner R. P., 1996, ApJ, 466, 104
- da Cunha et al. (2010) da Cunha E., Eminian C., Charlot S., Blaizot J., 2010, MNRAS, 403, 1894
- van Zee et al. (1998) van Zee L., Salzer J. J., Haynes M. P., O’Donoghue A. A., Balonek T. J., 1998, AJ, 116, 2805