A polarized fast radio burst at low Galactic latitude
Abstract
We report on the discovery of a new fast radio burst, FRB 150215, with the Parkes radio telescope on 2015 February 15. The burst was detected in real time with a dispersion measure (DM) of 1105.60.8 pc cm-3, a pulse duration of 2.8 ms, and a measured peak flux density assuming the burst was at beam center of 0.7 Jy. The FRB originated at a Galactic longitude and latitude of 24.66∘, 5.28∘, 25 degrees away from the Galactic Center. The burst was found to be 435% linearly polarized with a rotation measure (RM) in the range rad m-2 (95% confidence level), consistent with zero. The burst was followed-up with 11 telescopes to search for radio, optical, X-ray, -ray and neutrino emission. Neither transient nor variable emission was found to be associated with the burst and no repeat pulses have been observed in 17.25 hours of observing. The sightline to the burst is close to the Galactic plane and the observed physical properties of FRB 150215 demonstrate the existence of sight lines of anomalously low RM for a given electron column density. The Galactic RM foreground may approach a null value due to magnetic field reversals along the line of sight, a decreased total electron column density from the Milky Way, or some combination of these effects. A lower Galactic DM contribution might explain why this burst was detectable whereas previous searches at low latitude have had lower detection rates than those out of the plane.
keywords:
surveys — methods: data analysis — polarization — ISM: structure1 Introduction
Fast radio bursts (FRBs) are bright, millisecond duration pulses identified in high time resolution radio observations (see Petroff et al., 2016, and references therein). Like radio pulses from pulsars, FRBs experience dispersion due to ionised matter which can be quantified by a dispersion measure (DM); observationally this is seen as a frequency-dependent time delay of the radio pulse across the observing band. FRBs have DMs well in excess of the expected contribution from free electrons in the interstellar medium (ISM) leading to theories that they have an extragalactic origin Katz (2016). If a significant population of FRBs originate at redshift they may be useful as powerful cosmological probes Deng & Zhang (2014); Gao et al. (2014); Macquart et al. (2015). Twenty-one FRB sources have been reported to date111All reported FRBs can be found in the FRBCAT; http://www.astronomy.swin.edu.au/pulsar/frbcat/; however, a rapid population growth is expected in the near future due to new instruments and ongoing surveys (Keane et al., 2016; Caleb et al., 2017; Ng et al., 2017; van Leeuwen, 2014).
The nature of FRB progenitors remain highly debated and progenitor theories currently outnumber published bursts. Only FRB 121102 has been seen by several telescopes to repeat, ruling out cataclysmic progenitors for this particular FRB (Spitler et al., 2016; Scholz et al., 2016). This burst was localized to a dwarf galaxy at a redshift , at a distance of approximately 1 Gpc (Chatterjee et al., 2017; Tendulkar et al., 2017). The small host galaxy also contains a radio source co-located with the position of the FRB (Marcote et al., 2017). A convincing model for the source of the millisecond radio bursts from FRB 121102 remains unknown although extreme neutron star progenitors such as a millisecond magnetar (Metzger et al., 2017) have recently been invoked. Repeat bursts from this source are highly clustered in time and some pulses are several times brighter than the original burst detection. No such behaviour has been seen yet for other FRBs despite, in some cases, hundreds of hours of follow-up, or from known magnetars in the Galaxy. It remains unknown whether FRB 121102 is typical of the FRB population as no other FRBs have been localised to their host galaxies from their detected radio pulses
Other attempts at FRB localization have relied on multi-wavelength follow-up to search for coincident transient emission. Radio imaging following the real-time detection of FRB 150418 by Keane et al. (2016) revealed a variable radio source dropping rapidly in flux density on a timescale of a few days post-burst, possibly associated with the FRB, although this case remains contested. Long-term radio imaging has revealed that the radio source varies in flux density (Williams & Berger, 2016; Johnston et al., 2017) consistent with an active galactic nucleus (AGN) (Akiyama & Johnson, 2016). Although Williams & Berger (2016) have argued against an association, new data from Johnston et al. shows that the probability of coincident detections is . However, the variable radio sky is poorly understood at Jy levels on these timescales. The unusual variability seen for this radio source may or may not be related to the progenitor of the FRB and it may be that, much like the early days of short gamma-ray bursts (Berger, 2014), this source remains a borderline case at least until similar follow-ups have been performed for a large number of FRBs.
Other recent follow-up efforts have produced exciting results. DeLaunay et al. (2016) have reported a 380-s -ray transient detected weakly by the Swift satellite temporally coincident with FRB 131104. They propose an association between this transient and the FRB, implying an extremely energetic engine. Further follow-up with radio imaging by Shannon & Ravi (2017) in the field of FRB 131104 revealed a variable AGN at a different position from the -ray transient. Ultimately, neither source can be precisely attributed to the progenitor of the burst at present, and more data will be needed.
Here we present the discovery of FRB 150215 close to the Galactic plane with the Parkes radio telescope. This burst was detected in real time with recorded polarization and multi-wavelength follow-up, including observations with the H.E.S.S. telescope at TeV -ray energies and the first limits on neutrino flux coincident with a FRB from the ANTARES neutrino detector. In Section 2 we briefly describe the Parkes telescope observing setup; in Section 3 we present FRB 150215 and the polarization properties of the burst. Section 4 presents the multi-wavelength data taken after the FRB detection. We discuss the results of our observations in Section 5 and compare these to results from previously detected bursts.
2 Observations
The results presented in this paper are from observations taken as part of the 4-year project “Transient Radio Neutron Stars” at the Parkes radio telescope (Parkes PID 786). The purpose of this project was to study rotating radio transients (RRATs), pulsars that emit irregularly and are best found through their bright single pulses rather than through periodicity searches (McLaughlin et al., 2006). New candidates found in the Parkes Multibeam Pulsar Survey (PMPS) and the High Time Resolution Universe survey (HTRU), both conducted at Parkes (Manchester et al., 2001; Keith et al., 2010), were re-observed and confirmed. Known RRATs were monitored regularly to obtain period and period derivative measurements when possible (Keane et al., 2011; Burke-Spolaor et al., 2011).
Observations between June 2011 and October 2013 used only the central beam of the 13-beam Parkes multibeam receiver Staveley-Smith et al. (1996), totalling 207 hours. From October 2013 until the conclusion of the project in March 2015 all 13 beams were used both as a coincidence check to reduce spurious candidates from terrestrial radio frequency interference (RFI) and to use all 13 beams to search for FRBs; a further 311 hours of observations were performed in this configuration. The majority of the observations for this project were at low Galactic latitudes where the population of pulsars is larger.
All data were recorded with the Berkeley Parkes Swinburne Recorder (BPSR; Keith et al., 2010) as time-frequency data cubes in filterbank format222http://sigproc.sourceforge.net/. The BPSR system records 1024 frequency channels over 400 MHz of bandwidth centered at 1382 MHz; approximately 60 MHz (15%) of the total bandwidth is discarded at the highest frequencies due to satellite interference. The system records 8-bit data with a sampling time of 64 s which is then downsampled to 2-bit for storage to disk, preserving only total intensity. For single pulse processing, all data have been searched for single pulses with the heimdall333http://sourceforge.net/projects/heimdall-astro/ software. As early as June 2013 it was possible to view streaming data from the telescope via an online interface through the BPSR web controller. The capability to search through incoming data in real-time for FRBs was implemented in March 2014 and this search is run for all observations taken with the BPSR backend. The data are searched for single pulses with DM pc cm-3, where is the modeled DM of the Milky Way along the line of sight from the NE2001 electron density model (Cordes & Lazio, 2002). While the real-time search is being performed, 120 seconds of 8-bit data are stored in a ring buffer connected to the BPSR system. If a pulse is found in any beam which matches the criteria for an FRB candidate, the 8-bit data for all 13 beams are saved to disk and can be calibrated to obtain the Stokes parameters from the full polarization information. Further details of the real-time search pipeline, which was used to find FRB 150215 in this project, are described in Petroff et al. (2015a).
3 FRB 150215
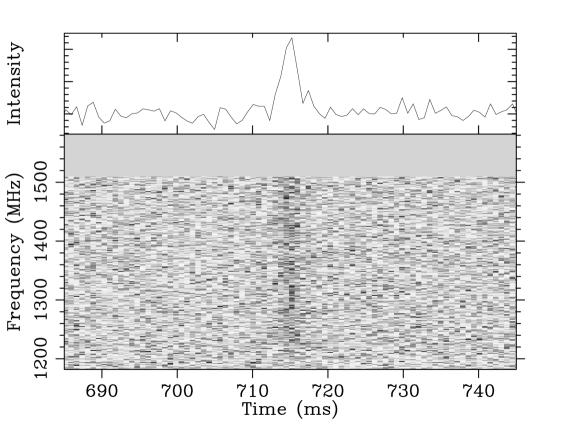
FRB 150215 was detected in an outer beam (beam 13) of the Parkes multibeam receiver at UTC 2015 February 15 20:41:41.714, the time of arrival at 1.382 GHz. The burst has a best-fit DM of 1105.60.8 pc cm-3 and observed pulse duration of 2.8 ms, as shown in Figure 1; it was detected in only a single beam of the receiver with an observed peak flux density of 0.7 Jy and a fluence of 2.1 Jy ms. The burst was detected in a beam centered at the position RA 18h:17m:27s Dec 04:54:15 (J2000), at Galactic coordinates (, ) = (24.66∘, 5.28∘). The beam half-power half-width is 7 which we take as the uncertainty on position along the inner dimension; however, since it was detected in an outer beam the position is not well constrained on one side. As such the above quoted flux density and fluence are to be interpreted as lower limits. The full properties of the event are given in Table 1, including derived cosmological parameters based upon the DM excess from the NE2001 model by Cordes & Lazio (2002) (see Petroff et al., 2016, for a full discussion of these calculations).
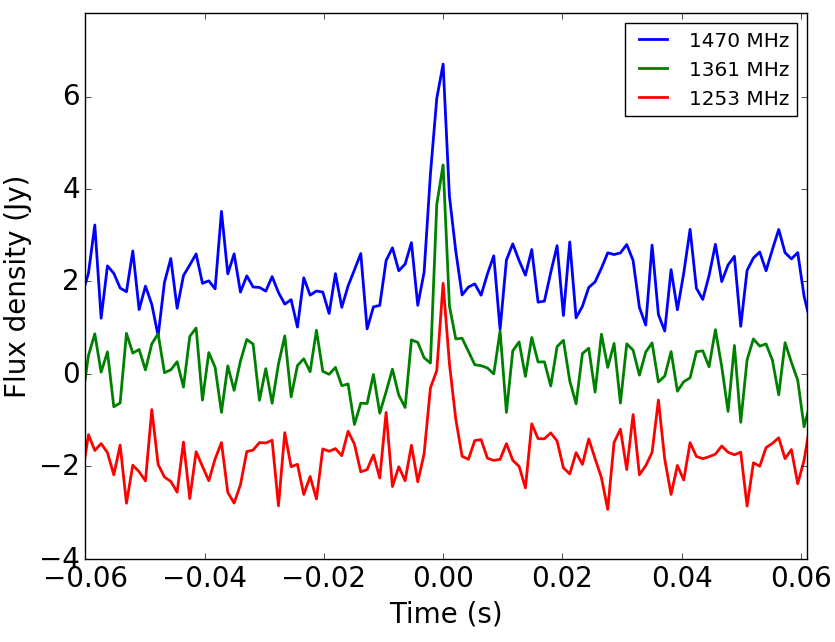
The burst was found approximately 25∘ from the Galactic Center, the smallest angular separation for any burst to date, at a low Galactic latitude. The estimated DM contribution from the Milky Way along this sightline is 427 pc cm-3 from the NE2001 model Cordes & Lazio (2002) but 275 pc cm-3 from the YMW model, lower by 40% (Yao et al., 2017). We take the difference in these two estimates as an indication of the uncertainty in this parameter444It should be noted that these models have high uncertainty, perhaps 50% or more, when estimating the electron density in the Galactic halo or in regions of low pulsar density (Deller et al., 2009).. Despite having travelled through a larger fraction of the ionised Milky Way than any other burst except FRB 010621 (Keane et al., 2012), FRB 150215 shows neither significant scattering nor scintillation, as shown in Figure 2.
In December 2014 a radio frequency interference monitor was installed at the Parkes telescope site. This monitor enabled perytons, seemingly frequency-swept signals that resembled FRBs in many ways (Burke-Spolaor et al., 2011), to be traced back to their source, the on-site microwave ovens, through the detection of coincident out-of-band RFI Petroff et al. (2015b). No correlated out-of-band RFI was detected coincident with FRB 150215.
| Event date UTC | 15 February, 2015 |
|---|---|
| Event time UTC, | 20:41:41.714 |
| Event time, | 20:41:39.313 |
| Event time MJD, | 57068.86228837 |
| Event time, | 57068.86226057 |
| RA (J2000) | 18:17:27 |
| Dec (J2000) | 04:54:15 |
| (,) | (24.6∘, 5.2∘) |
| Beam diameter (at 1.4 GHz) | 14.4 |
| DMFRB (pc cm-3) | 1105.6(8) |
| DMMW,NE2001 (pc cm-3) | 427 |
| DMMW,YMW (pc cm-3) | 275 |
| Detection S/N | 19(1) |
| Observed width, (ms) | 2.8 |
| Instrumental dispersion smearing, (ms) | 1.3 |
| Modeled scattering time, (ms) | 0.05 |
| Dispersion index, | –2.001(2) |
| Peak flux density, (Jy) | 0.7 |
| Fluence, (Jy ms) | 2.1 |
| DMexcess (pc cm-3) | 678 |
| 0.56 | |
| Co-moving distance (Gpc) | 2.1(6) |
| Luminosity distance (Gpc) | 3.3(1.3) |
| Energy (J) | 1.2 |
3.1 Polarization
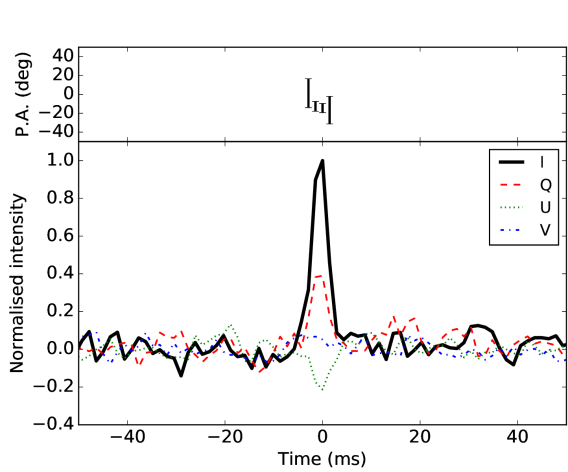
The real-time detection system in operation at the Parkes telescope detected the burst less than 10 seconds after it occurred. The detection triggered a recording of 4.1 seconds of full-Stokes data centered on the time of FRB 150215. A calibrator observation was taken 1.5 hours after the detection of the burst allowing for a polarized pulse profile to be constructed. FRB 150215 was found to have high linear polarization, L = 435%, where , with very low circular polarization, V = 31%, shown in Figure 3. Flux calibration was performed using a calibrator dataset taken 6 days after the FRB during which time no receiver or cabling changes were made. The uncertain position of the FRB in the beam may affect the detected polarization level. Studies of the polarization attenuation due to source location in a Parkes beam were done by Ravi et al. (2016) after the detection of FRB 150807 and it was shown for this particular burst that even at the best-fit location for the burst far off beam centre (in a non-central beam of the receiver) the recovered polarization for a test pulsar was consistent with the published profile. Even in the extreme case that the true position of FRB 150215 is significantly offset from the beam center, then, we may expect that the polarization profile recovered in our observations is a reasonably accurate measurement of the intrinsic polarization properties.
Only four FRBs have previously published measurements of their polarized profiles and no two look alike. FRB 140514 shows only significant circular polarization (%; Petroff et al., 2015a), FRB 150418 shows only low level linear polarization (%; Keane et al., 2016), FRB 110523 shows both linear and possible circular polarization (%, %; Masui et al., 2015) and FRB 150807 shows extremely high linear polarization (%; Ravi et al., 2016). The presence of significant polarization of any kind on such short timescales is indicative of coherent emission, much like the polarized pulses seen from pulsars (Lyne & Graham-Smith, 2012). The two bursts from this sample with the highest levels of linear polarization, FRBs 110523 and 150807, show significant rotation measures (RMs); however, the RM of FRB 150807 is consistent with that of a nearby pulsar indicating that a significant fraction of the Faraday rotation may be produced in the Galaxy.
The linear polarization data for the burst reported here were examined for the effects of Faraday rotation using the implementation of rotation measure synthesis described in Macquart et al. (2012) (see also Brentjens & de Bruyn, 2005). After accounting for RFI, the 289 MHz of usable bandwidth centered on 1357.5 MHz with 0.39 MHz channels yielded a RM spread function with a half-power at half-maximum width of 92 rad m-2. A search over the range rad m-2 detected a 9- signal with a RM of rad m-2 for which the associated 2- confidence interval spans the range rad m-2, consistent with zero.
The low measured RM for this FRB is unexpected. Given that FRB 150215 was seen along a sightline approximately 25 from the Galactic Center, one might expect a considerable RM contribution from the Galactic foreground ( rad m-2), making a zero total RM unlikely.
3.2 Rotation measure of the Galactic foreground
The RM contribution of the Galaxy can be estimated in a variety of ways. Here we discuss three possible methods for determining the foreground Galactic contribution: nearby polarized extragalactic sources, rotation measure maps, and rotation measures from nearby pulsars.
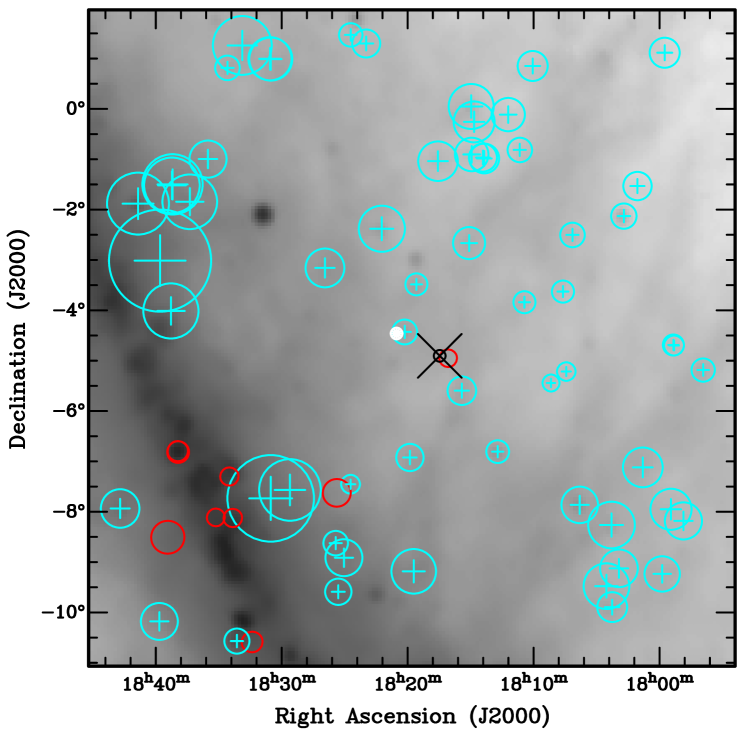
The rotation measure foreground from the Galaxy can be estimated from the measured RMs of nearby sources from the NRAO VLA Sky Survey (NVSS; Taylor et al., 2009). The extragalactic sources in the region have largely positive RMs but the nearest source to the FRB, approximately 0.2 degrees away on the sky, NVSS J181647-045659, shows a deviation and has a low RM = rad m-2 consistent with zero, as shown in Figure 4.
This is also seen by Oppermann et al. (2015) who present a smoothed map of the Galactic foreground produced using a large sample of RMs from extragalactic sources. Based on these maps the expected RM at the position of FRB 150215 is rad m-2, consistent with our measurement from RM synthesis. However, within the larger map of Galactic Faraday rotation, the FRB lies in what appears to be a small ( 1 degree) region of low RM surrounded by several much larger regions of high positive RM.
The third possible method for determining the Galactic RM foreground is from the rotation measures of Galactic pulsars along nearby sightlines. The closest pulsar to FRB 150215 with a measured RM is PSR J1820–0427 of +69.22 rad m-2 (Hamilton & Lyne, 1987), drastically different from the RM of the FRB. This pulsar is offset from the location of FRB 150215 by approximately one degree and lies within a region of expected positive RM from the Oppermann et al. (2015) map where the predicted value integrated through the entire Galactic sightline is RM = rad m-2. It is also worth noting that the pulsar samples only the local field and cannot measure the RM along the full sightline through the Galaxy.
The combination of these three methods points to the conclusion that the position where FRB 150215 was discovered may lie in a small null region in the Galactic RM. Rapid foreground variations in RM are known to exist along sightlines at low Galactic latitude due either to turbulence or to magnetic field reversals along spiral arms (Han et al., 2006). The null in RM along this line of sight could also indicate a void in the Galactic ISM, reducing the Galactic contribution to the burst’s total DM and increasing the derived distance even further. Variations in the Galactic ISM on these scales cannot be seen in current electron density models such as NE2001 or the YMW model (Cordes & Lazio, 2002; Yao et al., 2017).
FRB 150215 is also located near the base of the North Polar Spur (NPS), a large extended structure in the radio sky. The NPS is known to contribute significantly to the Galactic foreground RM (Sun et al., 2015), but has been more extensively studied at higher Galactic latitudes () where measurements are less entangled with other Galactic contributions. As outlined above, small-scale variations in the foreground are difficult to constrain, particularly if, as might be the case for the NPS, the foreground is due to a supernova remnant or turbulent wind (Sun et al., 2015).
The low RM of FRB 150215 does not preclude the presence of an intrinsic RM imparted on the burst at the source. The presence of high fractional linear polarization suggests an ordered magnetic field at the progenitor. However, if the progenitor is at high redshift, then the observed RM from the host is reduced compared to the rest-frame value by ; for FRB 150215 at an estimated redshift of this could attenuate a significant rest-frame RM contribution (RM 25 rad m-2) from the host so that it becomes undetectable within our measurement errors. However a rest-frame RM value of 180 rad m-2 like the one for FRB 110523 would still be present at a detectable level in the data. Additionally, Oppermann et al. (2015) show a typical observing-frame extragalactic RM contribution of 7 rad m-2 which is consistent with both an attenuated host RM contribution at high redshift and our measurement for FRB 150215 if one accepts that there is a low foreground RM. In summary, given the RM of the FRB, and the foreground, any host contribution to the RM must be low: 25 rad m-2 in the rest-frame of the FRB.
4 Multi-wavelength follow-up
In addition to polarization capture, the real-time detection of FRB 150215 enabled the triggering of telescopes across the electromagnetic spectrum to search for longer-lived multi-wavelength counterparts to the FRB. A detection trigger was issued through the follow-up network developed as part of the SUrvey for Pulsars and Extragalactic Radio Bursts (SUPERB; Keane et al., 2016) two hours post-burst and in the subsequent weeks the location of the burst was observed with eleven telescopes. This effort included radio telescopes searching for repeating bursts, radio imaging campaigns to search for highly varying radio sources in the field, wide-field optical imaging in several wavebands, two epochs of infrared imaging in the field to penetrate the significant extinction encountered at optical wavelengths, X-ray imaging with space-based missions, high energy -ray imaging, and a search for associated neutrinos.
The searches and follow-up strategy in these different wavelength regimes are described in the following sections and a summary of all observations is provided in Table 2. Detailed information about the observing setup, sensitivity, and other specifications for each telescope are given in Appendix A.
4.1 Radio pulse search
Immediately after the detection of FRB 150215 the field was monitored for two hours with the Parkes telescope until the field set. These observations place the best limits on repeating pulses from the source assuming that the progenitor of the burst was in a phase of outburst or activity as has been seen for the progenitor of FRB 121102 Spitler et al. (2016). No additional pulses were seen in these early observations down to a S/N of 8, a peak flux density of 0.4 Jy.
In total, the field of FRB 150215 has been re-observed for 17.25 hours to search for repeating pulses either at the same DM or for other FRB-like events at a different DM up to 5000 pc cm-3 with the the Parkes radio telescope (10 hrs) and the Lovell radio telescope (7.25 hrs). No new bursts were detected with pulse width 32.7 ms at any DM above a peak flux density of 0.5 Jy, and no new pulses were detected within 10% of the DM of FRB 150215 above a peak flux density of 0.4 Jy. A non-detection in follow-up observations does not preclude a repeating source. Repeating pulses from the source may be clustered in time, similar to FRB 121102, and the source may have been active when the location was not observed or repeat pulses may be too weak to be detected with the current sensitivity of the Parkes or Lovell telescopes, as has been suggested by Scholz et al. (2016). The location of the burst continues to be monitored through on-going projects at the Parkes telescope.
4.2 Radio imaging
The first radio imaging of the field of FRB 150215 was done less than five hours after detection through a target of opportunity (ToO) campaign with the Australia Telescope Compact Array (ATCA). Images of the entire Parkes beam encompassing the full-width half-maximum (FWHM) of 14.4 were recorded at 5.5 GHz and 7.5 GHz. Sensitivity in the field was limited by an elongated beam shape due to the high declination of the field; the first radio images reached 3- limiting fluxes of 280 Jy at 5.5 GHz, and 300 Jy at 7.5 GHz.
Analysis of the first ATCA images in the days after they were recorded revealed ten radio sources, nine of which were associated with known sources from the NRAO VLA Sky Survey (NVSS; Condon et al., 1998). The tenth source (hereafter ATCA 181811045256), located at RA=18h:18m:114 Dec=:52:566, was the focus of additional initial follow-up with the Jansky Very Large Array (VLA) due to its lack of archival counterpart. The first observations with the VLA were performed on 2015 March 01, 14 days after FRB 150215, centered on the position of ATCA 181811045256. In total nine epochs of VLA data were taken over the course of 60 days from 2015 March 01 to 2015 April 29 under program code VLA/15A-461. All observations were taken in the B configuration of the array in X-band (8.332 – 12.024 GHz) and a synthesized beam size of at a position angle of –6.2∘.
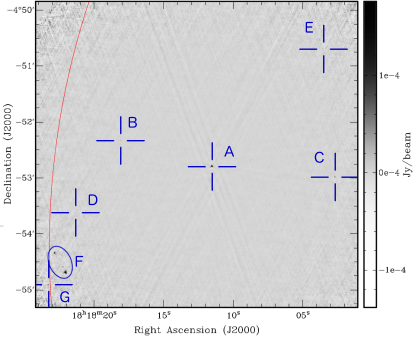
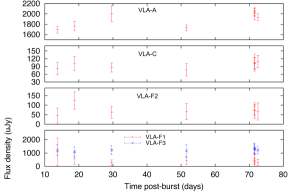
An integrated image was produced using all epochs of VLA observations which yielded an RMS sensitivity of 2.3 Jy at the center position of the observations and 16 Jy near the edge of the image, shown in Figure 5. In this integrated image seven sources were detected (labeled with letters A–G in the VLA analysis) including the primary target ATCA 181811045256. Three of the sources were detectable in individual epochs: ATCA 181811045256 (labeled as VLA-A), VLA-C, and VLA-F which appears to be an extended core-jet object. Due to the very limited field of view of the VLA images, the only ATCA source visible in the field is ATCA 181811045256. The three sources visible in all observations were monitored for intensity variations but were all seen to remain relatively stable in flux throughout the observing campaign, as shown in Figure 6.
Additionally, a ToO campaign began with the GMRT 9 hours after the detection of FRB 150215 centered on the position of the Parkes beam center. Subsequent images were taken 1.3 and 4.3 days post-burst, all with a center frequency of 610 MHz and an observing bandwidth of 64 MHz. All images achieved an RMS sensitivity of Jy and encompassed a 1 square degree field of view. In total 61 sources were detected in the GMRT images above the 7- level and 30 of these sources were found to have NVSS counterparts. All ATCA sources were detected with the exception of ATCA 181811045256. The large discrepancy between the number of GMRT sources and the number of NVSS sources may be due to the imaging resolution of the two systems, i.e. a double-lobed source feature identified as two sources in the GMRT image may be only seen as on in the NVSS source catalogue. The higher sensitivity and lower observing frequency of the GMRT relative to the NVSS may also contribute to this discrepancy.
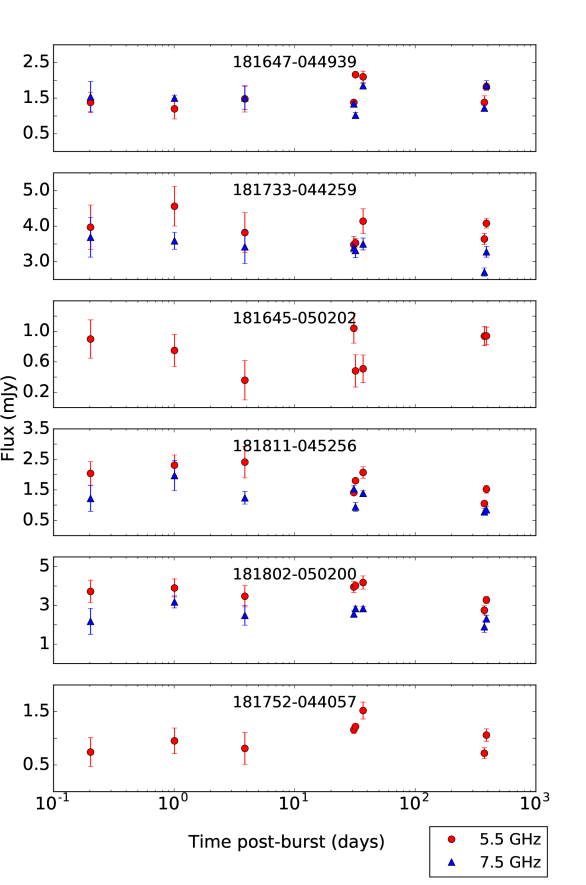
Longer-term studies of source variability in the field were conducted using the data from the ATCA. In total, 8 epochs of observations at 5.5 and 7.5 GHz were recorded with the ATCA with 6 observations between 2015 February 16 and 2015 March 24 and two additional epochs of data taken one year later in 2016 March. Where possible, the de-biased modulation index for each source was calculated using Equation 3 from (Bell et al., 2015) as
| (1) |
where is the mean flux density, is the flux density values for a source in epochs and is the inverse of the error in the individual flux measurement. This modulation index quantifies the strength of variability for a given source with significant variability defined as . Two sources in the field were unresolved due to differences in observing configurations between epochs, making analysis of their variability impossible. An additional two sources were badly affected by artifacts in most epochs similarly hampering analysis. For the remaining six sources, including ATCA 181811045256, was calculated and none were seen to vary significantly, i.e. . The light curves for these six sources are shown in Figure 7.
The presence of a radio source in the field not identified in the NVSS survey is not entirely surprising. The NVSS survey was designed to be 50% complete at the mJy level at 1.4 GHz (Condon et al., 1998). ATCA 181811045256 was first detected with a flux of mJy and mJy, implying a slightly negative spectral index although consistent within the 3- errors with a flat spectrum. Such a source may be below the sensitivity limit of the NVSS. Although the appearance of a new radio source in the field post-burst would be tantalizing, the detection of a variable radio source in the field would not necessarily imply a direct connection between the source and the FRB. This has since been shown by the unrelated highly variable source in the field of FRB 150418 (Williams & Berger, 2016; Johnston et al., 2017) and the detection of a fairly stable persistent radio source associated with FRB 121102 (Chatterjee et al., 2017; Marcote et al., 2017). However, if FRB 150215 is seen to repeat in the future and can be localized via single pulses, the reference images now available from ATCA, GMRT, and the VLA can quickly confirm or refute the presence of an associated radio source like the one seen for FRB 121102.
4.3 Optical and infrared imaging
An optical imaging campaign began within 24 hours of the detection of FRB 150215 to search for optical transients evolving on rapid timescales of a few days and continued for 71 days to search for transient sources on longer timescales. The first images were taken approximately 12 hours after the FRB detection at 2015 February 16 09:01:36 UTC with the Dark Energy Camera (DECam; Diehl & Dark Energy Survey Collaboration, 2012) instrument on the 4-m Blanco telescope at Cerro Tololo Inter-American Observatory (CTIO). Within two days of FRB 150215 additional observations were taken with the 2.4-m Thai National Telescope (TNT) located at Doi Inthanon National Park in Thailand and the 6.5-m Magellan Baade telescope at las Campanas Observatory in Chile.
The low Galactic latitude of the field resulted in significant extinction, with an average (Schlegel et al., 1998), which significantly reduces our limiting magnitudes in all images. To minimize extinction effects observations were primarily taken with longer wavelength filters: , , and (a custom-made broad filter with high transmission at 5000 – 7000 Å between the traditional = 5500 Å and = 6580 Å bands) on the DECam instrument, -band for observations with TNT, and -band in the near-infrared using the FourStar instrument on Magellan (Persson et al., 2013).
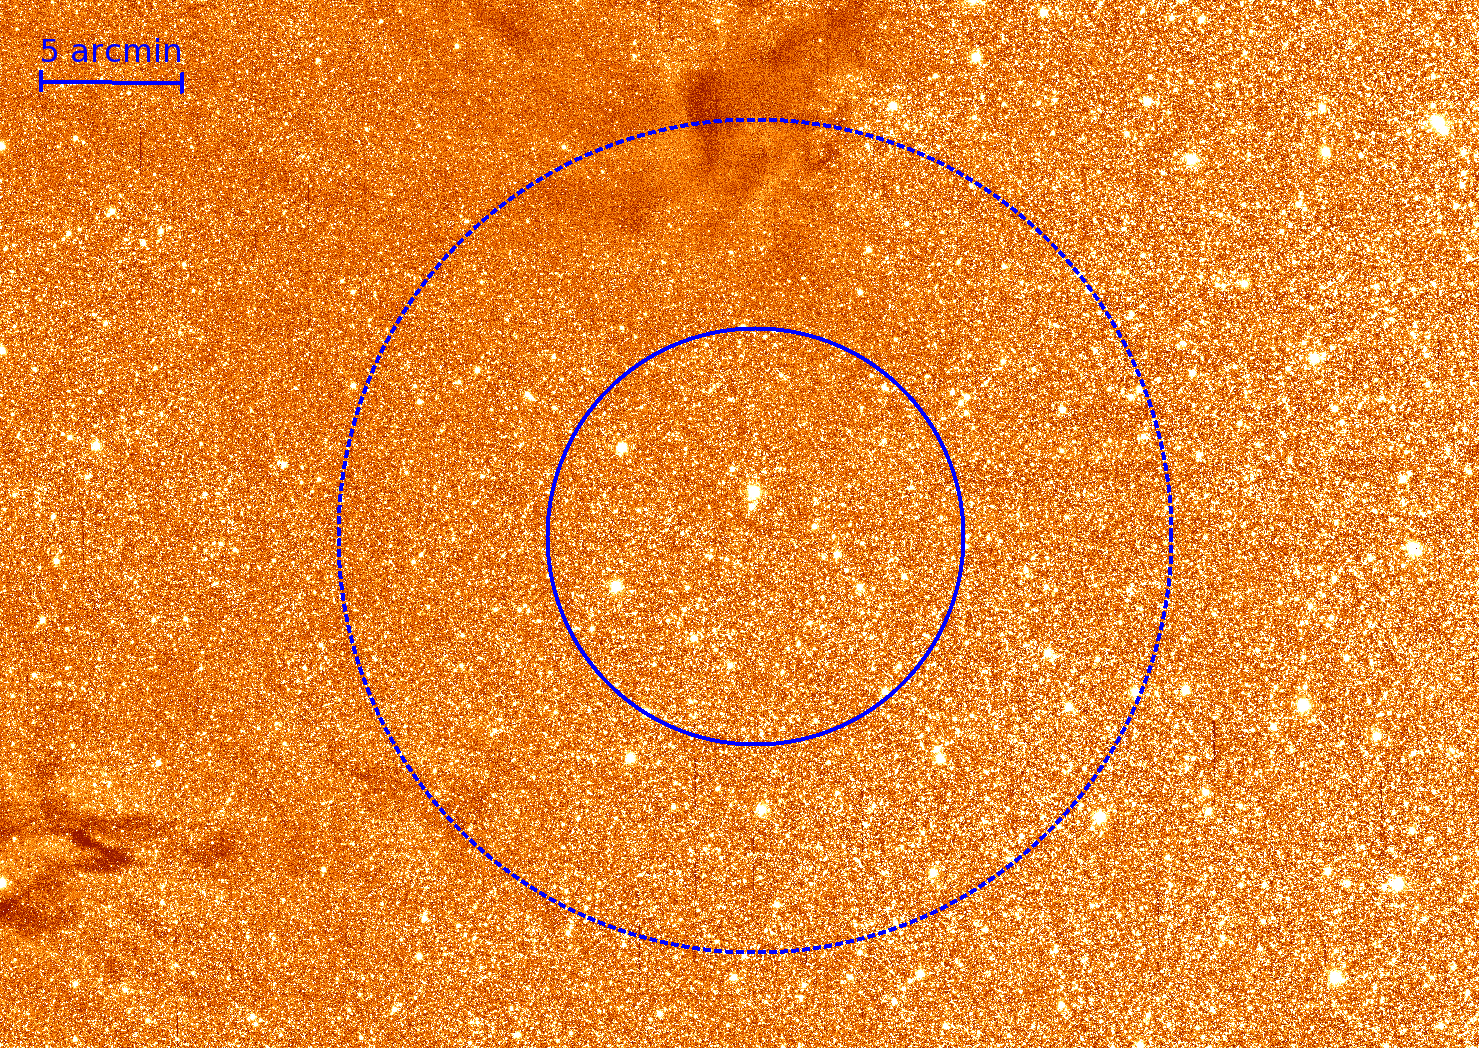
The most sensitive limit on optical transients comes from the five epochs of observations taken with the DECam instrument in the -band. For an exposure time of 750s and a seeing FWHM of 13 the 5- limiting magnitudes in each band were , , and ; however extinction significantly affects the sensitivity in the field and the extinction corrected limiting magnitudes were , , and , all in the AB system. Due to the crowdedness of the field and the limited resolution of the dust maps the variation in extinction is difficult to quantify and may be as great as several magnitudes in some regions. The nightly-stacked images were searched for transients using the SExtractor software and no transient sources were detected. However, calibration and background estimation in this field are extremely difficult due to the large number of sources (see Figure 8) and a verification of the SExtractor results was performed using an early version of the Mary pipeline (Andreoni et al., submitted). Many sources were seen to vary between epochs but no transients were detected in the region of the Parkes beam above a 5- significance threshold.
More limited transient searches were performed using the two available epochs each from Magellan in -band and from TNT in -band. Magellan observations were taken 1.5 and 2.5 days post-burst achieving 5- limiting magnitudes of 18.6 and 19.1, respectively. An analysis similar to that performed on the DECam observations returned no significant transients. Observations with the TNT were taken 25 hours and 58 days post-burst and achieved a limiting magnitude of (AB), this being the magnitude of the faintest source which could be reliably extracted. Again, no transient sources were detected in a SExtractor analysis of the images.
The shortest time baseline on which we are sensitive to optical transients is approximately 12 days, between the first two epochs of deep DECam images, and the longest time baseline is over 70 days. Based on these observations we can rule out some fairly common optical transients such as a Type Ia supernova out to (Wang et al., 2003), or Type IIp supernovae at (Sanders et al., 2015). We can also place limits on optical transients generated by proposed progenitors to FRBs such as kilonovae (Niino et al., 2014) and long GRBs associated with superluminous supernovae (SLSNe; Metzger et al., 2017). Due to their faint emission we can only place weak limits on a kilonova associated with FRB 150215 to or (for Metzger et al., 2015; Kasen et al., 2013, respectively). However, from the DM the estimated redshift of FRB 150215 of we can place strong limits on temporally associated emission from a traditional long GRB optical afterglow, which is highly disfavored.
Given the depth and cadence of the DECam images we are also able to place strong constraints on a temporally coincident SLSN. The DECam data are sensitive in depth and time to an event M 19.9 at (the estimated DM of FRB 150215). Although supernovae have a wide range of rise and fade times the spacing of the optical epochs provides detection limits for supernovae at these epochs in the observed frame. SLSNe evolve slowly with rise and fade times of 30-100 d and 100-500 d, respectively. As such, the DECam observations are well spaced to catch any type of SLSN near peak luminosity, assuming the SLSN outburst is associated with the FRB. Thus, the DECam data can rule out a coincident SLSN to using the most conservative definition of a SLSN (M 20.5; Quimby et al., 2013) and to using the canonical definition (M 21; Gal-Yam, 2012). However, these estimates neglect the variation in extinction across the field that could obscure closer events in regions of higher Galactic extinction. We note that a detection in only one epoch would not confirm the supernova nature of an event (superluminous or not). Thus, the practical sensitivity of the DECam data is roughly 0.5–-1.0 mags fainter, i.e., and, thus, sensitive to events brighter than M 20.4 to 20.9 to (or M 19.9 to ) in order to observe a sufficient magnitude change over multiple detections to discern its evolution and confirm the event.
However, limits on temporally associated optical transients may be of little use if the engine for the FRB is a repeating source embedded in a supernova remnant as has been suggested recently (Metzger et al., 2017; Beloborodov, 2017). In this case, the optical transient may have occurred decades prior to the detection of the FRB and any optical identification of the progenitor would require localization of the source from repeating FRBs.
4.4 X-ray observations
Six epochs of X-ray data were taken in the week after FRB 150215: five epochs from the Swift X-ray telescope and one from the Chandra X-ray Observatory. All observations with Swift used the X-Ray Telescope (XRT) in photon counting mode between between 0.3 10 keV. All observations were centered the location of the Parkes beam center at the time of the FRB detection. The 236 236 field of view covered the field beyond the FWHM of the Parkes beam. The first observation occurred 19 hours post-burst and subsequent observations occurred on 2015 February 16 21. Integration times with the XRT for these observations ranged from 800 3900 s resulting in a range of sensitivities given in Table 2. In our analysis of these observations no convincing transient sources were identified.
A single epoch of X-ray data was also collected with the Chandra X-ray Observatory using the High Resolution Camera (HRC, Murray et al., 2000), a 30 30 imager, between 0.08 10 keV. The observation with the HRC-I imaging mode was centered on the location of the Parkes detection beam. Two sources were detected in this image near the center of the field separated by 34. Both sources have observed fluxes in the 0.3 8 keV range of approximately 5 10-14 erg cm-2 s-1 if they have a soft thermal spectrum and their positions are consistent with the known nearby M-dwarfs PM J18174-0452 and PM J18174-0453. No variability analysis of these M dwarfs is possible with the single epoch of Chandra data, and these sources were not detected in any epochs taken with Swift.
It should also be mentioned that the Swift Burst Alert Telescope (BAT) was not looking in the direction of FRB 150215 at the time of the radio detection, therefore no limits can be place on the occurrence of a coincident -ray transient of the type reported in DeLaunay et al. (2016).
4.5 High energy -ray searches
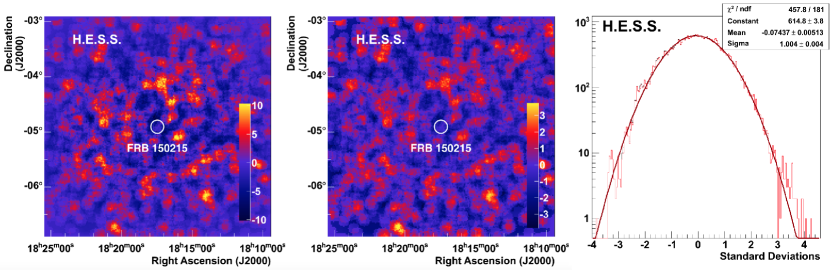
Follow-up observations of the field of FRB 150215 were performed with the H.E.S.S. Imaging Atmospheric Cherenkov Telescope array to search for associated high energy -ray photons. The first observations were taken several days after the FRB when the field became visible at the H.E.S.S. site in Namibia on 2015 February 22 at 02:53 UTC, 6.3 days post-burst, and lasted for 28 minutes. In total two observations were taken of the field, each using a hybrid observing setup with four 12-m telescopes and one 28-m telescope which combine to create a 3.5 3.5 square degree field of view. Observations from both epochs were combined to obtain 0.7 h of data under good conditions.
The Li & Ma significances were calculated for the data (Li & Ma, 1983) and the distributions of significances were compared for the full field and in the case where a circular region of diameter 14.4 around the position of the FRB is excluded. The two distributions were found to be fully compatible. Therefore, we conclude that no significant -ray flux was detected from the direction of FRB 150215. From these observations we derive an upper limit on the -ray flux assuming an energy spectrum as erg (99% confidence).
| Telescope | Date Start time | T+ | Limits |
|---|---|---|---|
| UTC | |||
| Parkes | Feb 15 20:41:42 | 1 s | 145 mJy at 1.4 GHz |
| ANTARES | Feb 15 20:41:42 | 1 s | 1.4 erg cm-2 (E-2) |
| 0.5 erg cm-2 (E-1) | |||
| ATCA | Feb 16 01:22:26 | 4.6 h | 280 Jy at 5.5 GHz |
| 300 Jy at 7.5 GHz | |||
| GMRT | Feb 16 06:36:00 | 8.9 h | 100 Jy at 610 MHz |
| DECam | Feb 16 09:01:36 | 12.3 h | = 24.3, = 24.8, |
| VR = 25.1 | |||
| Swift | Feb 16 15:30:23 | 18.8 h | 1.7e13 erg cm-2 s-1 |
| ATCA | Feb 16 20:41:44 | 24 h | 208 Jy at 5.5 GHz |
| 200 Jy at 7.5 GHz | |||
| ANTARES | Feb 16 20:41:42 | 1.0 d | 1.4 erg cm-2 (E-2) |
| 0.5 erg.cm-2 (E-1) | |||
| TNT | Feb 16 21:59:00 | 1.0 d | R = 21.3 |
| GMRT | Feb 17 05:08:00 | 1.3 d | 100 Jy at 610 MHz |
| Magellan | Feb 17 08:53:05 | 1.5 d | = 18.6 |
| Parkes | Feb 17 20:26:47 | 1.9 d | 145 mJy at 1.4 GHz |
| Chandra | Feb 18 03:56:00 | 2.3 d | 1e14 erg cm-2 s-1 |
| Swift | Feb 18 04:44:58 | 2.3 d | 2.4e13 erg cm-2 s-1 |
| Magellan | Feb 18 08:59:44 | 2.5 d | = 19.1 |
| Parkes | Feb 18 20:04:25 | 2.9 d | 145 mJy at 1.4 GHz |
| Swift | Feb 19 01:27:59 | 3.2 d | 9.7e13 erg cm-2 s-1 |
| ATCA | Feb 19 17:13:44 | 3.8 d | 192 Jy at 5.5 GHz |
| 228 Jy at 7.5 GHz | |||
| GMRT | Feb 20 05:51:00 | 4.3 h | 100 Jy at 610 MHz |
| Swift | Feb 20 12:36:58 | 4.6 d | 2.1e13 erg cm-2 s-1 |
| Swift | Feb 21 18:53:59 | 5.9 d | 6.8e13 erg cm-2 s-1 |
| H.E.S.S. | Feb 22 02:53:00 | 6.3 d | see text |
| Parkes | Feb 23 19:41:53 | 7.9 d | 145 mJy at 1.4 GHz |
| H.E.S.S. | Feb 25 02:49:00 | 9.3 d | see text |
| DECam | Feb 28 08:13:46 | 12.5 d | = 24.3, = 24.8, |
| VR = 25.1 | |||
| DECam | Mar 1 08:59:45 | 13.5 d | = 24.3, = 24.8, |
| VR = 25.1 | |||
| VLA | Mar 1 13:59:46 | 13.7 d | 7.92 Jy at 10.1 GHz |
| VLA | Mar 6 14:26:00 | 18.7 d | 7.83 Jy at 10.1 GHz |
| VLA | Mar 9 15:02:34 | 21.7 d | 164.5 Jy at 10.1 GHz |
| DECam | Mar 11 08:02:32 | 23.5 d | = 24.3 |
| VLA | Mar 17 12:34:56 | 29.6 d | 6.95 Jy at 10.1 GHz |
| ATCA | Mar 18 18:44:14 | 30.9 d | 240 Jy at 5.5 GHz |
| 200 Jy at 7.5 GHz | |||
| ATCA | Mar 19 18:44:14 | 31.9 d | 200 Jy at 5.5 GHz |
| 200 Jy at 7.5 GHz | |||
| ATCA | Mar 24 18:13:44 | 36.9 d | 220 Jy at 5.5 GHz |
| 220 Jy at 7.5 GHz | |||
| VLA | Apr 8 10:51:51 | 51.6 d | 7.05 Jy at 10.1 GHz |
| TNT | Apr 14 21:07:54 | 58.0 d | R = 21.3 |
| DECam | Apr 27 08:42:05 | 70.5 d | = 22.2, VR = 21.3 |
| VLA | Apr 28 10:53:20 | 71.6 d | 6.57 Jy at 10.1 GHz |
| VLA | Apr 28 11:38:11 | 71.6 d | 6.48 Jy at 10.1 GHz |
| VLA | Apr 28 12:23:04 | 71.6 d | 7.23 Jy at 10.1 GHz |
| VLA | Apr 29 10:17:15 | 72.5 d | 6.78 Jy at 10.1 GHz |
| Lovell | 2016 Feb 14 12:31:58 | 364 d | 168 mJy at 1.5 GHz |
| Lovell | 2016 Feb 15 12:47:17 | 365 d | 168 mJy at 1.5 GHz |
| Lovell | 2016 Feb 19 10:32:25 | 269 d | 168 mJy at 1.5 GHz |
| ATCA | 2016 Feb 24 18:41:45 | 374 d | 160 Jy at 5.5 GHz |
| 192 Jy at 7.5 GHz | |||
| Lovell | 2016 Mar 10 09:11:15 | 398 d | 168 mJy at 1.5 GHz |
| ATCA | 2016 Mar 10 15:58:15 | 398 d | 132 Jy at 5.5 GHz |
| 160 Jy at 7.5 GHz | |||
| Lovell | 2016 Mar 19 01:20:44 | 407 d | 168 mJy at 1.5 GHz |
| Lovell | 2016 Mar 27 01:34:12 | 415 d | 168 mJy at 1.5 GHz |
| Lovell | 2016 Apr 06 08:42:45 | 416 d | 168 mJy at 1.5 GHz |
| Lovell | 2016 Apr 16 06:48:43 | 416 d | 168 mJy at 1.5 GHz |
4.6 Neutrino searches
Searches for a possible neutrino counterpart signal to FRB 150215 were conducted with the ANTARES telescope in the Mediterranean Sea (Ageron et al., 2011). The discovery of a high-energy neutrino signal is of a great interest as it may help to pinpoint the origin, leptons and/or hadrons, of the accelerated particles emitting the radio burst. The datastream was searched for up-going track events from a point-like source in the following three time windows = [T0-500s ; T0+500s], = [T0-1h ; T0+1h], and = [T0-1day ; T0+1day], where T0 is the FRB trigger time. The searches were performed on a 2 region of interest (ROI) centered on the position of the Parkes beam center at the time of the FRB detection. The short time window search was optimized for the case of a short transient associated with the FRB such as a GRB (see Baret et al., 2011). The longer timescale searches were done to take into account unknown scenarios for neutrino production associated with the FRB. No neutrinos were detected coincident with the FRB in any of the time bins searched, a result which is consistent with the neutrino background expectation.
From this non-detection we compute limits on the neutrino fluence of FRB 150215 based on the instantaneous acceptance of ANTARES at the time of the FRB: . These upper limits are computed for two standard neutrino energy spectra defined by a power law function with spectral indices . The limits are computed in the energy range [Emin-Emax] = [-] GeV and [Emin-Emax] = [-] GeV for the soft and the hard spectrum, respectively. Each range has been derived from detailed Monte Carlo simulations and corresponds to the 5-95 range of the energy distribution of events passing the applied quality criteria for the corresponding spectrum. As a result for FRB 150215, () for the spectrum and () considering the spectrum.
Depending on the distance to FRB 150215, different constraints can be set on the isotropic energy released in neutrinos 555, and .. We consider three distance scenarios: a local galactic environment with , an extragalactic, non-cosmological distance at and a cosmological origin at . For a source model, the limits are erg, respectively. If the process which produced FRB 150215 also produces neutrinos ANTARES significantly constrains the galactic and near extragalactic distance scenarios. However, the cosmological scenario remains unconstrained according to the ANTARES sensitivity.
4.7 Follow-up summary
No transients were detected at any wavelength temporally associated with FRB 150215. Our follow-up places the strongest limits on long GRB and SLSN-type emission through optical follow-up with the DECam instrument described in Section 4.3. Follow-up was challenging due to the large diameter of the Parkes beam and the poor localization of the FRB. If the source of FRB 150215 is seen to repeat in the future the source may be localized through the FRB single pulses similar to FRB 121102 (Chatterjee et al., 2017). In such a scenario our observations across the electromagnetic spectrum provide valuable deep reference images which can be used immediately to say more about a potential host galaxy and the existence of a possible radio counterpart to compare this source with FRB 121102. Radio pulse searches are ongoing with the Parkes telescope; however, monitoring of the field of FRB 150215 with FRB search pipelines on new wide-field interferometers such as UTMOST (Caleb et al., 2016), CHIME (Ng et al., 2017) and Apertif (van Leeuwen, 2014) as part of all-sky surveys is highly recommended as these instruments will provide improved localization.
5 Discussion
5.1 Detectability of FRBs at low Galactic latitudes
In addition to adding a new burst to the current population, FRB 150215 also presents some interesting new information on the detectability of FRBs, particularly at low Galactic latitudes. Previous searches at low and intermediate Galactic latitudes have been unsuccessful at finding FRBs (Burke-Spolaor & Bannister, 2014; Petroff et al., 2014; Rane et al., 2016). No viable physical mechanism has yet been presented that explains how the Galaxy could effectively mask or hinder FRB detection in this region given that current searches are sensitive to FRBs out to extremely high DMs and even if a large amount of scattering is present (Bhandari et al., in prep.). FRB 150215 may have traveled through a small RM null in the Galactic foreground, potentially also representing a line of sight where the total Galactic electron column density is lower than its surroundings.
The P786 project spent a total of 518 hours surveying the regions of RRATs and candidates with the BPSR observing system. Over 460 of these hours were spent at Galactic latitudes below 20∘. From this survey and the single FRB detection an approximate FRB rate can be calculated as FRBs sky-1 day-1 (95% confidence level, Jy ms), consistent within large uncertainties with previous estimates from Champion et al. (2016) and Rane et al. (2016).
5.2 Galactic or extragalactic origin?
A preponderance of proposed progenitors place the origin of FRBs outside our own Galaxy. Many posit cosmological distances. No precise location was determined for FRB 150215; however, the observational evidence from the burst itself is consistent with an origin outside the Milky Way. The burst shows no obvious pulse broadening due to the effects of scattering despite the large overall DM and despite having traveled through the potentially significant scattering screen of the Galaxy, see Figure 2. The NE2001 model predicts pulse broadening by the Galaxy along this line of sight at 1.4 GHz of 0.01 ms; however, using the scattering-DM relation from Bhat et al. (2004) the expected pulse broadening is 5 ms at 1.4 GHz. The NE2001 value may be highly biased or inaccurate in this region due to the sparsity of pulsars but the true value likely lies somewhere between these two models. The lack of significant scattering may be consistent with the expected Galactic effects, but in the case of a sightline with strong scattering (where the Bhat et al. model is more applicable) FRB 150215 is out of place.
The lack of scattering for FRB 150215 is consistent with the larger population of FRBs which show scattering seemingly randomly without any correlation with total DM (Cordes et al., 2016). Such a distribution could be explained if the burst originates far outside the Galaxy such that the effect of the Galactic material is down-weighted compared to a scattering screen halfway between source and observer (the ‘lever arm effect’; Lorimer et al., 2013) and the scattering seen in some profiles is instead due to traveling through halos of intervening galaxies.
If the source of FRB 150215 was a Galactic pulsar this would require an extreme overdensity in the Galactic electron content along the line of sight, perhaps attributable to a dense Hii region. Such a scenario has been proposed for FRB 010621 Bannister & Madsen (2014) although the overdensity fraction was much smaller. In the case of FRB 150215, a Hii region capable of producing the fractional DM excess would require an enormous density, producing a substantial emission measure (EM pc cm-6), and a measurable fourth order effect on the DM. Such a high emission measure would be bright in Hα, but no such emission is seen in the images of the region from the WHAM survey (Haffner et al., 2003). A region of this density would also be inconsistent with the observed RM properties of the burst unless there was an implausibly low magnetic field strength within the region to cancel out the effects of such enormous density.
We find no compelling physical evidence of a Galactic origin for FRB 150215 and therefore propose an extragalactic origin as being the favorable explanation for the excess DM and other observed properties of the burst. The consistency between the FRB RM and the estimated foreground RM also indicates that the FRB is most likely located outside of the Milky Way.
5.3 Comparison with FRB 150418 and FRB 131104
The follow-up of FRB 150215 revealed no transient or variable source in the field at any wavelength. Of particular interest are the observations conducted with the ATCA following FRB 150215 as they were very similar in cadence to those conducted for FRB 150418 in which it was argued that a rapidly fading radio source was observed in the days after the burst (Keane et al., 2016; Johnston et al., 2017). The observations with the ATCA for FRB 150215 were, however, significantly less sensitive due to the high declination angle of the source field. The result was an elongated beam shape and a higher noise floor for these observations. The best RMS noise achieved in any ATCA observation during this follow-up campaign was 120 Jy at 5.5 GHz, 160 Jy at 7.5 GHz, as such a source like WISE J071634.59−190039.2 (the source which had been proposed to be related to FRB 150418) which varies below the 100 Jy level could not be detected.
Radio imaging follow-up was also conducted for FRB 131104 with the ATCA (Shannon & Ravi, 2017). A strongly variable radio source in the field, AT J0642.9–5118, was observed to brighten coincident with the burst, reaching a peak brightness of 1.2 mJy at 7.5 GHz in the week following the the FRB. Shannon & Ravi have identified the source as a radio-bright AGN at a redshift of , consistent with the redshift for the FRB inferred from its redshift. While AT J0642.9–5118 reached a peak brightness an order of magnitude higher than the AGN in the field of FRB 150418 it too would have been below the detection threshold for the follow-up conducted for FRB 150215 with the ATCA.
6 Conclusions
In this paper we present the new fast radio burst FRB 150215 discovered in real-time with the Parkes radio telescope in February 2015. Multi-wavelength and multi-messenger follow-up was triggered at 11 telescopes. Full Stokes information was preserved for this burst and the FRB was found to be 435% linearly polarized with a rotation measure rad m-2 (95% confidence level). We find this rotation measure to be consistent with the Galactic foreground as the burst sightline may coincide with a spatially compact null in the Galactic RM, perhaps also corresponding to a lower than average electron column density contribution to the total dispersion measure. This also implies that no rotation measure 25 rad m-2 in the rest-frame of the host is imparted by the progenitor or a host galaxy, in contrast to FRB 110523 (Masui et al., 2015) implying that not all FRBs are produced in dense, magnetised regions. The burst was found within 25 of the Galactic Center at low Galactic latitude ( = 5.28∘) with a dispersion measure DM = 1105.60.8 pc cm-3, more than 2.5 times the expected DM from the NE2001 model. This excess in the DM may be higher if the RM null value also corresponds to an underdensity in the ionized interstellar medium along this sightline.
Follow-up observations were conducted with telescopes at radio, optical, and X-ray wavelengths, as well as at TeV energies with the H.E.S.S. -ray telescope and with the ANTARES neutrino detector. Several steady sources were detected in the field of FRB 150215, but no transient or variable emission was observed coincident with the burst and it is unclear which, if any, of the steady sources may be related to the FRB. No repeating pulses from FRB 150215 were found at DMs up to 5000 pc cm-3 in 17.25 hours of radio follow-up, although monitoring of the FRB field is ongoing. The burst properties favour an extragalactic origin although the distance to the progenitor cannot be determined with available observations.
Data Access
Data associated with the radio detection of FRB 150215 will be publicly available on the gSTAR Data Sharing cluster upon publication of this work in the journal. Parkes data, as well as follow-up data taken by some of the telescopes mentioned in this paper will be accessible and downloadable for future use.
Acknowledgments
The Parkes radio telescope and the Australia Telescope Compact Array are part of the Australia Telescope National Facility which is funded by the Commonwealth of Australia for operation as a National Facility managed by CSIRO. Parts of this research were conducted by the Australian Research Council Centre of Excellence for All-sky Astrophysics (CAASTRO), through project number CE110001020 and the ARC Laureate Fellowship project FL150100148. This work was performed on the gSTAR national facility at Swinburne University of Technology. gSTAR is funded by Swinburne and the Australian Government’s Education Investment Fund. Funding from the European Research Council under the European Union’s Seventh Framework Programme (FP/2007-2013) / ERC Grant Agreement n. 617199 (EP). MAM and RM are supported by NSF award #1211701. Research support to IA is provided by the Australian Astronomical Observatory.
The support of the Namibian authorities and of the University of Namibia in facilitating the construction and operation of H.E.S.S. is gratefully acknowledged, as is the support by the German Ministry for Education and Research (BMBF), the Max Planck Society, the German Research Foundation (DFG), the French Ministry for Research, the CNRS-IN2P3 and the Astroparticle Interdisciplinary Programme of the CNRS, the U.K. Science and Technology Facilities Council (STFC), the IPNP of the Charles University, the Czech Science Foundation, the Polish Ministry of Science and Higher Education, the South African Department of Science and Technology and National Research Foundation, the University of Namibia, the Innsbruck University, the Austrian Science Fund (FWF), and the Austrian Federal Ministry for Science, Research and Economy, and by the University of Adelaide and the Australian Research Council. We appreciate the excellent work of the technical support staff in Berlin, Durham, Hamburg, Heidelberg, Palaiseau, Paris, Saclay, and in Namibia in the construction and operation of the equipment. This work benefited from services provided by the H.E.S.S. Virtual Organisation, supported by the national resource providers of the EGI Federation.
The ANTARES authors acknowledge the financial support of the funding agencies: Centre National de la Recherche Scientifique (CNRS), Commissariat à l’énergie atomique et aux énergies alternatives (CEA), Commission Européenne (FEDER fund and Marie Curie Program), Institut Universitaire de France (IUF), IdEx program and UnivEarthS Labex program at Sorbonne Paris Cité (ANR-10-LABX-0023 and ANR-11-IDEX-0005-02), Labex OCEVU (ANR-11-LABX-0060) and the A*MIDEX project (ANR-11-IDEX-0001-02), Région Île-de-France (DIM-ACAV), Région Alsace (contrat CPER), Région Provence-Alpes-Côte d’Azur, Département du Var and Ville de La Seyne-sur-Mer, France; Bundesministerium für Bildung und Forschung (BMBF), Germany; Istituto Nazionale di Fisica Nucleare (INFN), Italy; Stichting voor Fundamenteel Onderzoek der Materie (FOM), Nederlandse organisatie voor Wetenschappelijk Onderzoek (NWO), the Netherlands; Council of the President of the Russian Federation for young scientists and leading scientific schools supporting grants, Russia; National Authority for Scientific Research (ANCS), Romania; Ministerio de Economía y Competitividad (MINECO): Plan Estatal de Investigación (refs. FPA2015-65150-C3-1-P, -2-P and -3-P, (MINECO/FEDER)), Severo Ochoa Centre of Excellence and MultiDark Consolider (MINECO), and Prometeo and Grisolía programs (Generalitat Valenciana), Spain; Ministry of Higher Education, Scientific Research and Professional Training, Morocco. We also acknowledge the technical support of Ifremer, AIM and Foselev Marine for the sea operation and the CC-IN2P3 for the computing facilities.
This work made use of data supplied by the UK Swift Science Data Centre at the University of Leicester. This research has made use of data, software and/or web tools obtained from the High Energy Astrophysics Science Archive Research Center (HEASARC), a service of the Astrophysics Science Division at NASA/GSFC and of the Smithsonian Astrophysical Observatory’s High Energy Astrophysics Division.
EP would like to thank R. Soria for Chandra data reduction advice and thank J. Hessels, R. Soria, J. van Leeuwen, and L. Connor for useful discussion.
References
- Ageron et al. (2011) Ageron M. et al., 2011, Nuclear Instruments and Methods in Physics Research A, 656, 11
- Aharonian et al. (2006) Aharonian F. et al., 2006, A&A, 457, 899
- Akiyama & Johnson (2016) Akiyama K., Johnson M. D., 2016, ApJ, 824, L3
- Bannister & Madsen (2014) Bannister K. W., Madsen G. J., 2014, MNRAS, 440, 353
- Baret et al. (2011) Baret B. et al., 2011, Astroparticle Physics, 35, 1
- Bell et al. (2015) Bell M. E., Huynh M. T., Hancock P., Murphy T., Gaensler B. M., Burlon D., Trott C., Bannister K., 2015, MNRAS, 450, 4221
- Beloborodov (2017) Beloborodov A. M., 2017, arXiv:1702.08644
- Berge et al. (2007) Berge D., Funk S., Hinton J., 2007, A&A, 466, 1219
- Berger (2014) Berger E., 2014, ARA&A, 52, 43
- Bertin & Arnouts (1996) Bertin E., Arnouts S., 1996, Astronomy and Astrophysics Supplement, 117, 393
- Bhat et al. (2004) Bhat N. D. R., Cordes J. M., Camilo F., Nice D. J., Lorimer D. R., 2004, ApJ, 605, 759
- Brentjens & de Bruyn (2005) Brentjens M. A., de Bruyn A. G., 2005, A&A, 441, 1217
- Burke-Spolaor et al. (2011) Burke-Spolaor S., Bailes M., Ekers R., Macquart J.-P., Crawford F., III, 2011, ApJ, 727, 18
- Burke-Spolaor & Bannister (2014) Burke-Spolaor S., Bannister K. W., 2014, ApJ, 792, 19
- Calabretta et al. (2014) Calabretta M. R., Staveley-Smith L., Barnes D. G., 2014, PASA, 31, e007
- Caleb et al. (2017) Caleb M. et al., 2017, arXiv:1703.10173
- Caleb et al. (2016) Caleb M. et al., 2016, MNRAS, 458, 718
- Champion et al. (2016) Champion D. J. et al., 2016, MNRAS, 460, L30
- Chatterjee et al. (2017) Chatterjee S. et al., 2017, Nature, 541, 58
- Condon et al. (1998) Condon J. J., Cotton W. D., Greisen E. W., Yin Q. F., Perley R. A., Taylor G. B., Broderick J. J., 1998, AJ, 115, 1693
- Cordes & Lazio (2002) Cordes J. M., Lazio T. J. W., 2002, arXiv:0207156
- Cordes et al. (2016) Cordes J. M., Wharton R. S., Spitler L. G., Chatterjee S., Wasserman I., 2016, arXiv:1605.05890
- de Naurois & Rolland (2009) de Naurois M., Rolland L., 2009, Astroparticle Physics, 32, 231
- DeLaunay et al. (2016) DeLaunay J. J. et al., 2016, ApJ Letters, 832, L1
- Deller et al. (2009) Deller A. T., Tingay S. J., Bailes M., Reynolds J. E., 2009, ApJ, 701, 1243
- Deng & Zhang (2014) Deng W., Zhang B., 2014, ApJ, 783, L35
- Diehl & Dark Energy Survey Collaboration (2012) Diehl H. T., Dark Energy Survey Collaboration , 2012, in American Astronomical Society Meeting Abstracts, Vol. 219, American Astronomical Society Meeting Abstracts #219, p. #413.05
- Evans et al. (2009) Evans P. A. et al., 2009, MNRAS, 397, 1177
- Evans et al. (2007) Evans P. A. et al., 2007, A&A, 469, 379
- Gal-Yam (2012) Gal-Yam A., 2012, Science, 337, 927
- Gao et al. (2014) Gao H., Li Z., Zhang B., 2014, ApJ, 788, 189
- Haffner et al. (2003) Haffner L. M., Reynolds R. J., Tufte S. L., Madsen G. J., Jaehnig K. P., Percival J. W., 2003, ApJS, 149, 405
- Hamilton & Lyne (1987) Hamilton P. A., Lyne A. G., 1987, MNRAS, 224, 1073
- Han et al. (2006) Han J. L., Manchester R. N., Lyne A. G., Qiao G. J., van Straten W., 2006, ApJ, 642, 868
- Johnston et al. (2017) Johnston S. et al., 2017, MNRAS, 465, 2143
- Kasen et al. (2013) Kasen D., Badnell N. R., Barnes J., 2013, ApJ, 774, 25
- Katz (2016) Katz J. I., 2016, Modern Physics Letters A, 31, 1630013
- Keane et al. (2016) Keane E. F. et al., 2016, Nature, 530, 453
- Keane et al. (2011) Keane E. F., Kramer M., Lyne A. G., Stappers B. W., McLaughlin M. A., 2011, MNRAS, 415, 3065
- Keane et al. (2012) Keane E. F., Stappers B. W., Kramer M., Lyne A. G., 2012, MNRAS, 425, L71
- Keith et al. (2010) Keith M. J. et al., 2010, MNRAS, 409, 619
- Lang et al. (2010) Lang D., Hogg D. W., Mierle K., Blanton M., Roweis S., 2010, AJ, 139, 1782
- Li & Ma (1983) Li T.-P., Ma Y.-Q., 1983, ApJ, 272, 317
- Lorimer et al. (2013) Lorimer D. R., Karastergiou A., McLaughlin M. A., Johnston S., 2013, MNRAS, 436, L5
- Lyne & Graham-Smith (2012) Lyne A., Graham-Smith F., 2012, Pulsar Astronomy
- Macquart et al. (2012) Macquart J.-P., Ekers R. D., Feain I., Johnston-Hollitt M., 2012, ApJ, 750, 139
- Macquart et al. (2015) Macquart J. P. et al., 2015, Advancing Astrophysics with the Square Kilometre Array (AASKA14), 55
- Manchester et al. (2001) Manchester R. N. et al., 2001, MNRAS, 328, 17
- Marcote et al. (2017) Marcote B. et al., 2017, ApJ Letters, 834, L8
- Masui et al. (2015) Masui K. et al., 2015, Nature, 528, 523
- McLaughlin et al. (2006) McLaughlin M. A. et al., 2006, Nature, 439, 817
- Metzger et al. (2015) Metzger B. D., Bauswein A., Goriely S., Kasen D., 2015, MNRAS, 446, 1115
- Metzger et al. (2017) Metzger B. D., Berger E., Margalit B., 2017, arXiv:1701.02370
- Murray et al. (2000) Murray S. S. et al., 2000, in Proc. SPIE, Vol. 4012, Truemper J. E., Aschenbach B., ed, X-Ray Optics, Instruments, and Missions III, p. 68
- Ng et al. (2017) Ng C. et al., 2017, arXiv:1702.04728
- Niino et al. (2014) Niino Y., Totani T., Okumura J. E., 2014, PASJ, 66, L9
- Oppermann et al. (2015) Oppermann N. et al., 2015, A&A, 575, A118
- Persson et al. (2013) Persson S. E. et al., 2013, PASP, 125, 654
- Petroff et al. (2015a) Petroff E. et al., 2015a, MNRAS, 447, 246
- Petroff et al. (2016) Petroff E. et al., 2016, PASA, 33, e045
- Petroff et al. (2015b) Petroff E. et al., 2015b, MNRAS, 451, 3933
- Petroff et al. (2014) Petroff E. et al., 2014, ApJ, 789, L26
- Quimby et al. (2013) Quimby R. M., Yuan F., Akerlof C., Wheeler J. C., 2013, MNRAS, 431, 912
- Rane et al. (2016) Rane A., Lorimer D. R., Bates S. D., McMann N., McLaughlin M. A., Rajwade K., 2016, MNRAS, 455, 2207
- Ravi et al. (2016) Ravi V. et al., 2016, Science, 354, 1249
- Sanders et al. (2015) Sanders N. E. et al., 2015, ApJ, 799, 208
- Sault et al. (1995) Sault R. J., Teuben P. J., Wright M. C. H., 1995, in Astronomical Society of the Pacific Conference Series, Vol. 77, Shaw R. A., Payne H. E., Hayes J. J. E., ed, Astronomical Data Analysis Software and Systems IV, p. 433
- Schlegel et al. (1998) Schlegel D. J., Finkbeiner D. P., Davis M., 1998, ApJ, 500, 525
- Scholz et al. (2016) Scholz P. et al., 2016, ApJ, 833, 177
- Shannon & Ravi (2017) Shannon R. M., Ravi V., 2017, ApJ Letters, 837, L22
- Spitler et al. (2016) Spitler L. G. et al., 2016, Nature, 531, 202
- Staveley-Smith et al. (1996) Staveley-Smith L. et al., 1996, PASA, 13, 243
- Sun et al. (2015) Sun X. H. et al., 2015, ApJ, 811, 40
- Taylor et al. (2009) Taylor A. R., Stil J. M., Sunstrum C., 2009, ApJ, 702, 1230
- Tendulkar et al. (2017) Tendulkar S. P. et al., 2017, ApJ Letters, 834, L7
- van Leeuwen (2014) van Leeuwen J., 2014, in Wozniak P. R., Graham M. J., Mahabal A. A., Seaman R., ed, The Third Hot-wiring the Transient Universe Workshop, p. 79
- Wang et al. (2003) Wang L., Goldhaber G., Aldering G., Perlmutter S., 2003, ApJ, 590, 944
- Williams & Berger (2016) Williams P. K. G., Berger E., 2016, ApJ, 821, L22
- Wright (2006) Wright E. L., 2006, PASP, 118, 1711
- Yao et al. (2017) Yao J. M., Manchester R. N., Wang N., 2017, ApJ, 835, 29
Appendix A Multi-wavelength follow-up: Observing details
A.1 The Lovell Telescope
Observations to search for single pulses from FRB 150215 were taken with the Lovell telescope at a center frequency of 1532 MHz with 800 frequency channels over 400 MHz of bandwidth of which approximately 20% is masked due to RFI. The sampling time of the data was 256 s and the diameter of the Lovell beam is 12. In this configuration the 1- sensitivity limit for a pulse width of 1 ms is 35 mJy.
The data were initially cleaned by applying a channel mask to remove bad frequency channels, next a median absolute deviation (MAD) algorithm was applied to remove additional channels affected by RFI. The data were then dedispersed using SIGPROC dedisperse_all around the DM of the FRB, from 1050 – 1150 pc cm-3, after which we used SIGPROC seek with the single pulse option to detect single pulses at each DM trial. No significant candidates were found above a threshold of 10-. As a verification, the data were also searched for single pulses using PRESTO. We dedispersed the cleaned data using prepsubband (with the zero DM option) for the same DM range used in the SIGPROC search and the same DM step size calculated by dedisperse_all (4 pc cm-3). We then searched the resulting time series for single pulses using single_pulse_search.py (using the —nobadblocks flag to stop the code from removing strong bursts). Again, we found no significant candidates above 10-.
A.2 The Australia Telescope Compact Array
To cover the full field of view of the Parkes beam with the ATCA required 42 pointings in a mosaic mode at 5.5 GHz and 7.5 GHz. The data were reduced using the standard steps in miriad (Sault et al., 1995). At every observing epoch the 42 pointings were imaged and individually self-calibrated before being combined using linmos to form a mosaic. The miriad source finding task imsad was used to find sources above a threshold of 6- at both center frequencies and the task imfit was used to fit Gaussian components for flux estimation. The details of the ATCA observations are given in Table 3.
Of the ten sources detected in the images at 5.5 GHz, two (NVSS J181647–045659 and NVSS J181647–045213) were unresolved in all 8 epochs because of different resolutions for different configurations, and two (NVSS J181733-050830 and NVSS J181822-045439) are badly effected by artifacts, especially in Epochs 4, 5 and 6. These four source have been excluded from the variability analysis presented in Section 4.2 and Figure 7. Further details of the variability analysis for the remaining six sources are given in Table 4.
| Epoch | Date | Time | Array | Beam (5.5 GHz) | Beam (7.5 GHz) |
|---|---|---|---|---|---|
| (hrs) | Configuration | BmajBmin(arcsec), pa(deg) | BmajBmin(arcsec), pa(deg) | ||
| 1 | 2015-02-16 01:22:26.9 | 2.5 | 750A | 77.968.70, 3.3 | 60.56.70, 3.3 |
| 2 | 2015-02-16 20:41:44.9 | 4 | 750A | 172.16.0, 0.14 | 128.34.51, 0.2 |
| 3 | 2015-02-19 17:13:44.9 | 4 | 750D | 68.15.35, -1.04 | 51.34.1, -1.0 |
| 4 | 2015-03-18 18:44:14.9 | 3 | H214 | 31.122.3, 45.68 | 27.019.92, 24.6 |
| 5 | 2015-03-19 18:44:14.9 | 2.5 | H214 | 38.729.0, 32.0 | 27.320.10, 23.7 |
| 6 | 2015-03-24 18:13:44.9 | 3 | H214 | 31.728.2, 29.39 | 26.821.89, 40.4 |
| 7 | 2016-03-24 18:41:45.7 | 2 | 6B | 101.11.57, -3.3 | 76.7 1.18, -3.3 |
| 8 | 2016-03-10 15:58:15.7 | 4.5 | 6B | 58.01.625, -2.9 | 40.81.25, -3.2 |
| NVSS name | ATCA name | RA | DEC | ||||
|---|---|---|---|---|---|---|---|
| h:m:s | :: | mJy | mJy | (%) | (%) | ||
| J181646–044918 | 181647–044939 | 18:16:47.2(0.22) | 04:49:39.3(3.16) | 1.6(2) | 1.5(2) | 16.2 | 12.0 |
| J181734–044243 | 181733–044259 | 18:17:33.9(0.13) | 04:42:59.7(1.78) | 4.0(3) | 3.4(2) | 5.2 | 3.0 |
| J181645–050151 | 181645–050202 | 18:16:45.0(0.30) | 05:02:02.8(8.33) | 0.7(1) | - | 18 | - |
| — | 181811–045256 | 18:18:11.4(0.37) | 04:52:56.6(4.84) | 1.8(2) | 1.2(2) | 18.8 | 21.2 |
| J181802–050146 | 181802–050200 | 18:18:02.6(0.22) | 05:02:00.1(3.11) | 3.7(4) | 2.5(3) | 6.0 | 6.4 |
| J181752–044056 | 181752–044057 | 18:17:52.5(0.53) | 04:40:57.7(7.04) | 1.0(1) | - | 17.3 | - |
A.3 Jansky Very Large Array
The observations with the Jansky Very Large Array (VLA) were made in standard imaging mode, centered on the position of a single ATCA detection at RA 18h:18m:1151, Dec –04:52:4684 (J2000). The standard VLA calibrator 3C286 was used for flux and bandpass calibration for all observations and J1812–0648 was used for phase calibration. All epochs were observed with 2 MHz channels across the full frequency range (8.332 – 12.024 GHz), and 2 s sampling intervals. At each epoch, we spent an average net time of 20 minutes on-source. We performed standard VLA calibration and imaging procedures for each epoch. Concatenating the data over all epochs produced the image in Figure 5 in the main text. The synthesized beam for this image subtends at a position angle of –6.2, and provides a RMS sensitivity of 2.3 Jy at the observation center, and Jy near the edge of the VLA primary beam. The fluxes and positions of each source in the integrated image are detailed in Table 5.
| Source | J2000 RA | J2000 Dec | Size | Position | Peak flux | Integrated |
|---|---|---|---|---|---|---|
| Angle (deg) | (Jy/beam) | flux (Jy) | ||||
| VLA-A | 18:18:11.5129(3) | -04:52:46.847(8) | point | — | — | |
| VLA-B | 18:18:18.104(2) | -04:52:19.07(4) | point | — | — | |
| VLA-C | 18:18:02.6500(7) | -04:52:58.42(2) | point | — | — | |
| VLA-D | 18:18:21.328(2) | -04:53:37.04(4) | point | — | — | |
| VLA-E | 18:18:03.508(2) | -04:50:41.07(3) | point | — | — | |
| VLA-F1 | 18:18:22.838(4) | -04:54:19.98(8) | ||||
| VLA-F2 | 18:18:22.244(1) | -04:54:35.17(4) | point | — | — | |
| VLA-F3 | 18:18:22.040(2) | -04:54:41.20(4) | ||||
| VLA-G | 18:18:23.306(2) | -04:54:54.21(5) | point | — | — |
A.4 The Dark Energy Camera
For the follow-up observations of FRB 150215 the full DECam imager was used which covers 3 square degrees allowing for coverage of more than 4.5 times the uncertainty radius of the Parkes telescope beam, shown in the main text in Figure 8. Details about the observing dates, filters, and exposure times for the DECam observations are given in Table 6.
| Date (UTC) | Filter | Exp (s) | N exp |
|---|---|---|---|
| 2015-02-16 | 150 | 5 | |
| 50 | 4 | ||
| 150 | 5 | ||
| 2015-02-28 | 150 | 6 | |
| 20 | 60 | ||
| 100 | 5 | ||
| 2015-03-01 | 150 | 6 | |
| 50 | 5 | ||
| 150 | 10 | ||
| 2015-03-11 | 150 | 5 | |
| 2015-04-27 | 150 | 5 | |
| 150 | 5 |
A.5 Thai National Telescope
FRB 150215 was followed up with the ARC 4K camera mounted on the 2.4-m Thai National Telescope (TNT), located at Doi Inthanon National Park, Thailand. The field-of-view is 8.8 8.8, and six tilings were used to observe the field at each epoch. In total 40 minutes was spent observing the field in the first epoch on 2015 February 16 and each tile was observed several times in the -band, with individual exposure times of 60 seconds. The same six tiles were observed again 57 days later on 2015 April 14, enabling a comparative analysis of sources. The effective overlapping area observed on both occasions was 184 in RA by 124 in Dec centered on 18h:17m:40s –04:51:55.
The images were de-biassed and flat-fielded, aligned and stacked for each tile, calibrated astrometrically using astrometry.net (Lang et al., 2010), and finally source catalogues were extracted using SExtractor Catalogues (Bertin & Arnouts, 1996). All point-like sources detected for each epoch were compared to search for variability and for transient objects which appear in the first observations but not in the second. Unfortunately the observing conditions for the first epoch were poor, with seeing of 3, and in both epochs the fields were observed at high airmass (1.5). The faintest reliable sources we could extract were = 21.3 (AB), and we consider this the detection limit.
A.6 The Swift X-ray Telescope (XRT)
Observations were taken with the Swift X-ray Telescope (XRT) and the data (target ID: 00033640) and XRT products were built and analyzed using the data analysis tools on the Swift website (Evans et al., 2007, 2009). Using standard settings, these tools identified no convincing transient sources and we obtained a count rate upper limit for each observation epoch at the position of the FRB. These count rate limits were converted to flux limits using a Galactic HI column density estimate from HEAsoft tool “nH” at the position of FRB 150215 of 3.04 1021 cm-2, with a negligible intrinsic component, and assuming that the FRB has the spectral index of a gamma-ray burst-like event. The average GRB spectral index over the energy range of the XRT for all GRBs in the catalogue on the Swift website (Evans et al., 2009) was found to be 2.0 0.4; we use a value of 2.0 in our analysis as the spectrum of the FRB afterglow is not known but may be GRB-like. The 0.3 – 10 keV fluxes were then calculated using the HEAsoft tool WebPIMMS4 for each observation and are provided in Table 2.
A.7 H.E.S.S.
The H.E.S.S. Imaging Atmospheric Cherenkov Telescope array is situated on the Khomas Highland plateau of Namibia (23 South, East), at an elevation of 1800 m above sea level. The current telescope array, completed in 2012, is comprised of four 12-m telescopes and one 28-m telescope sensitive to cosmic rays and -rays in the 10 GeV to 100 TeV energy range. With its current sensitivity the telescope array is capable of detecting a Crab-like source close to zenith at the 5- level within minutes under good observational conditions Aharonian et al. (2006). The observatory has a field-of-view of .
Both observations of the field of FRB 150215 performed with the H.E.S.S. telescope were performed with a hybrid setup including all five telescopes in the array. Combining both observations and after correcting for acceptance effects, a total effective live time of was obtained under good conditions but with relatively high zenith angles ranging between 54 and 64. The data were analyzed using the Model Analysis de Naurois & Rolland (2009) with standard gamma-hadron separation and event selection cuts. The background has been determined using the standard “ring background” technique Berge et al. (2007) in combination with an acceptance estimation exploiting the radial uniformity of the acceptance across the field-of-view of the system.
No significant -ray flux has been detected from the direction of FRB 150215. The distribution of -ray events exceeding the background is shown for the full region of interest (ROI) in the left plot of Fig. 9. The middle plot of Fig. 9 shows the map of the Li & Ma significances Li & Ma (1983) and the right plot shows the corresponding distribution of significances (black histogram). The distribution obtained by excluding a circular region of diameter 144 around the FRB position is shown in red. They are fully compatible with the background expectation.
A.8 The ANTARES neutrino telescope
The ANTARES neutrino telescope is currently the most sensitive neutrino telescope operating in the Northern hemisphere. It aims to primarily detect up-going neutrino-induced muons (above 100 GeV) that produce Cherenkov light in the detector. By design, ANTARES mainly observes the Southern sky (2 steradian at any time) with a high duty cycle. As a consequence, ANTARES is perfectly suited to search for a neutrino signal from FRB candidates detected at the Parkes observatory.
The number of atmospheric background events, , was directly estimated from the data using a time window = [T0-12h ; T0+12h], where T0 is the time of FRB 150215. The detector stability has been checked by looking at the event rates detected in time slices of 2 hours within . We did not find any significant variability in the event rates which guarantees the stability of the detector. Within the three time windows, no neutrino event was found in correlation with FRB 150215. The expected numbers of background events, integrated over the three time windows in a ROI of 2∘, are , respectively. Thus, the Poisson probability of observing zero events knowing the different background noises is greater than 99. From these considerations, the null result is compatible with the neutrino background expectation.
Appendix B Authors and Affiliations
The ANTARES Collaboration
A. Albert,27 M. André,28 M. Anghinolfi,29 G. Anton,30 M. Ardid,31 J.-J. Aubert,32 T. Avgitas,33 B. Baret,33 J. Barrios-Martí,34 S. Basa,35 V. Bertin,32 S. Biagi,36 R. Bormuth,37,38 S. Bourret,33 M.C. Bouwhuis,37 R. Bruijn,37,23 J. Brunner,32 J. Busto,32 A. Capone,39,40 L. Caramete,41 J. Carr,32 S. Celli,39,40 T. Chiarusi,42 M. Circella,43 J.A.B. Coelho33 A. Coleiro,33 R. Coniglione,36 H. Costantini,32 P. Coyle,32 A. Creusot,33 A. Deschamps,44 G. De Bonis,39,40 C. Distefano,36 I. Di Palma,39,40 C. Donzaud,33,45 D. Dornic,32 D. Drouhin,27 T. Eberl,30 I. El Bojaddaini,46 D. Elsässer,47 A. Enzenhöfer,32 I. Felis,31 L.A. Fusco,42,48 S. Galatà,33 P. Gay,49,33 S. Geißelsöder,30 K. Geyer,30 V. Giordano,50 A. Gleixner,30 H. Glotin,51 T. Grégoire33 R. Gracia-Ruiz,33 K. Graf,30 S. Hallmann,30 H. van Haren,52 A.J. Heijboer,37 Y. Hello,44 J.J. Hernández-Rey,33 J. Hößl,30 J. Hofestädt,30 C. Hugon,29,53 G. Illuminati,39,40,34 C.W James,30 M. de Jong,37,38 M. Jongen,37 M. Kadler,47 O. Kalekin,30 U. Katz,30 D. Kießling,30 A. Kouchner,33 M. Kreter,47 I. Kreykenbohm,54 V. Kulikovskiy,32,55 C. Lachaud,33 R. Lahmann,30 D. Lefèvre,56 E. Leonora,50,57 M. Lotze,34 S. Loucatos,58,33 M. Marcelin,35 A. Margiotta,42,48 A. Marinelli,59,60 J.A. Martínez-Mora,31 A. Mathieu,32 R. Mele,61,62 K. Melis,37,23 T. Michael,37 P. Migliozzi,61 A. Moussa,46 C. Mueller,47 E. Nezri,35 G.E. Păvălaş,41 C. Pellegrino,42,48 C. Perrina,39,40 P. Piattelli,36 V. Popa,41 T. Pradier,63 L. Quinn,32 C. Racca,27 G. Riccobene,36 K. Roensch,30 A. Sánchez-Losa,43 M. Saldaña,31 I. Salvadori,32 D. F. E. Samtleben,37,38 M. Sanguineti,29,53 P. Sapienza,36 J. Schnabel,30 T. Seitz,30 C. Sieger,30 M. Spurio,42,48 Th. Stolarczyk,58 M. Taiuti,29,53 Y. Tayalati,64 A. Trovato,36 M. Tselengidou,30 D. Turpin,32 C. Tönnis,34 B. Vallage,58,33 C. Vallée,32 V. Van Elewyck,33 D. Vivolo,61,62 A. Vizzoca,39,40 S. Wagner,30 J. Wilms,54 J.D. Zornoza,34 J. Zúñiga,34
The H.E.S.S. Collaboration
H. Abdalla,65
A. Abramowski,66
F. Aharonian,67,68,69
F. Ait Benkhali,67
A.G. Akhperjanian70,69,∗,
T. Andersson,71
E.O. Angüner,72
M. Arrieta,73
P. Aubert,74
M. Backes,75
A. Balzer,76
M. Barnard,65
Y. Becherini,71
J. Becker Tjus,77
D. Berge,76
S. Bernhard,78
K. Bernlöhr,67
R. Blackwell,79
M. Böttcher,65
C. Boisson,73
J. Bolmont,80
P. Bordas,67
J. Bregeon,81
F. Brun,82
P. Brun,58
M. Bryan,76
T. Bulik,83
M. Capasso,84
S. Casanova,85,67
M. Cerruti,80
N. Chakraborty,67
R. Chalme-Calvet,80
R.C.G. Chaves,81,86
A. Chen,87
J. Chevalier,74
M. Chrétien,80
S. Colafrancesco,87
G. Cologna,88
B. Condon,82
J. Conrad,89,90
Y. Cui,84
I.D. Davids,65
J. Decock,58
B. Degrange,91
C. Deil,67
J. Devin,81
P. deWilt,79
L. Dirson,66
A. Djannati-Ataï,33
W. Domainko,67
A. Donath,67
L.O’C. Drury,68
G. Dubus,92
K. Dutson,93
J. Dyks,94
T. Edwards,67
K. Egberts,95
P. Eger,67
J.-P. Ernenwein,32
S. Eschbach,30
C. Farnier,89,71
S. Fegan,91
M.V. Fernandes,66
A. Fiasson,74
G. Fontaine,91
A. Förster,67
S. Funk,30
M. Füßling,96
S. Gabici,33
M. Gajdus,72
Y.A. Gallant,81
T. Garrigoux,65
G. Giavitto,96
B. Giebels,91
J.F. Glicenstein,58
D. Gottschall,84
A. Goyal,97
M.-H. Grondin,82
D. Hadasch,78
J. Hahn,67
M. Haupt,96
J. Hawkes,79
G. Heinzelmann,66
G. Henri,92
G. Hermann,67
O. Hervet,73,102
J.A. Hinton,67
W. Hofmann,67
C. Hoischen,95
M. Holler,91
D. Horns,66
A. Ivascenko,65
A. Jacholkowska,80
M. Jamrozy,97
M. Janiak,94
D. Jankowsky,30
F. Jankowsky,88
M. Jingo,87
T. Jogler,30
L. Jouvin,33
I. Jung-Richardt,30
M.A. Kastendieck,66
K. Katarzyński,98
D. Kerszberg,80
B. Khélifi,33
M. Kieffer,80
J. King,67
S. Klepser,96
D. Klochkov,84
W. Kluźniak,94
D. Kolitzus,78
Nu. Komin,87
K. Kosack,58
S. Krakau,77
M. Kraus,30
F. Krayzel,74
P.P. Krüger,65
H. Laffon,82
G. Lamanna,74
J. Lau,79
J.-P. Lees,74
J. Lefaucheur,73
V. Lefranc,58
A. Lemière,33
M. Lemoine-Goumard,82
J.-P. Lenain,80
E. Leser,95
T. Lohse,72
M. Lorentz,58
R. Liu,67
R. López-Coto,67
I. Lypova,96
V. Marandon,67
A. Marcowith,81
C. Mariaud,91
R. Marx,67
G. Maurin,74
N. Maxted,79
M. Mayer,72
P.J. Meintjes,99
M. Meyer,89
A.M.W. Mitchell,67
R. Moderski,94
M. Mohamed,88
L. Mohrmann,30
K. Morå,89
E. Moulin,58
T. Murach,72
M. de Naurois,91
F. Niederwanger,78
J. Niemiec,85
L. Oakes,72
P. O’Brien,93
H. Odaka,67
S. Öttl,78
S. Ohm,96
M. Ostrowski,97
I. Oya,96
M. Padovani,81
M. Panter,67
R.D. Parsons,67
N.W. Pekeur,65
G. Pelletier,92
C. Perennes,80
P.-O. Petrucci,92
B. Peyaud,58
Q. Piel,74
S. Pita,33
H. Poon,67
D. Prokhorov,71
H. Prokoph,71
G. Pühlhofer,84
M. Punch,33,71
A. Quirrenbach,88
S. Raab,30
A. Reimer,78
O. Reimer,78
M. Renaud,81
R. de los Reyes,67
F. Rieger,67,100
C. Romoli,68
S. Rosier-Lees,74
G. Rowell,79
B. Rudak,94
C.B. Rulten,73
V. Sahakian,70,69
D. Salek,76
D.A. Sanchez,74
A. Santangelo,84
M. Sasaki,84
R. Schlickeiser,77
A. Schulz,96
F. Schüssler,59
U. Schwanke,72
S. Schwemmer,88
M. Settimo,80
A.S. Seyffert,65
N. Shafi,87
I. Shilon,30
R. Simoni,76
H. Sol,73
F. Spanier,65
G. Spengler,89
F. Spies,66
Ł. Stawarz,97
R. Steenkamp,75
C. Stegmann,95,96
F. Stinzing,30,∗
K. Stycz,96
I. Sushch,65
J.-P. Tavernet,80
T. Tavernier,33
A.M. Taylor,68
R. Terrier,33
L. Tibaldo,67
D. Tiziani,30
M. Tluczykont,66
C. Trichard,32
R. Tuffs,67
Y. Uchiyama,101
D.J. van der Walt,65
C. van Eldik,30
C. van Rensburg,65
B. van Soelen,99
G. Vasileiadis,81
J. Veh,30
C. Venter,65
A. Viana,67
P. Vincent,80
J. Vink,76
F. Voisin,79
H.J. Völk,67
T. Vuillaume,74
Z. Wadiasingh,65
S.J. Wagner,88
P. Wagner,72
R.M. Wagner,89
R. White,67
A. Wierzcholska,85
P. Willmann,30
A. Wörnlein,30
D. Wouters,58
R. Yang,67
V. Zabalza,93
D. Zaborov,91
M. Zacharias,88
R. Zanin,67
A.A. Zdziarski,94
A. Zech,73
F. Zefi,91
A. Ziegler,30
N. Żywucka97
1ASTRON, The Netherlands Institute for Radio Astronomy, Postbus 2, 7990 AA Dwingeloo, The Netherlands666∗email: ebpetroff@gmail.com
2Centre for Astrophysics and Supercomputing, Swinburne University of Technology, Mail H30, PO Box 218, VIC 3122, Australia
3CSIRO Astronomy & Space Science, Australia Telescope National Facility, P.O. Box 76, Epping, NSW 1710, Australia
4ARC Centre of Excellence for All-sky Astrophysics (CAASTRO)
5National Radio Astronomy Observatory, 1003 Lopezville Rd., Socorro, NM 87801, USA
6Department of Physics and Astronomy, West Virginia University, P.O. Box 6315, Morgantown, WV 26506, USA; Center for Gravitational Waves and Cosmology, West Virginia University, Chestnut Ridge Research Building, Morgantown, WV 26505
7SKA Organisation, Jodrell Bank Observatory, Cheshire, SK11 9DL, UK
8Department of Physics and Astronomy, West Virginia University, Morgantown, WV 26506,USA
9Australian Astronomical Observatory, PO Box 915, North Ryde, NSW 1670, Australia.
10Max Planck Institut für Radioastronomie, Auf dem Hügel 69, D-53121 Bonn, Germany
11School of Physics, University of Melbourne, Parkville, VIC 3010, Australia
12International Centre for Radio Astronomy Research, Curtin University, Bentley, WA 6102, Australia
13INAF — Osservatorio Astronomico di Cagliari, Via della Scienza 5, I-09047 Selargius (CA), Italy.
14Research School of Astronomy and Astrophysics, Australian National University, ACT, 2611, Australia
15National Centre for Radio Astrophysics, Tata Institute of Fundamental Research, Pune University Campus, Ganeshkhind, Pune 411 007, India
16Department of Physics and Astronomy, University of Sheffield, Sheffield S3 7RH, UK
17Instituto de Astrofisica de Canarias, E38205 La Laguna, Tenerife, Spain
18Department of Astrophysics/IMAPP, Radboud University, PO Box 9010, NL-6500 GL Nijmegen, the Netherlands
19National Astronomical Research Institute of Thailand, 191 Siriphanich Building, Huay Kaew Road, Chiang Mai 50200, Thailand
20Cahill Center for Astronomy and Astrophysics, MC 249-17, California Institute of Technology, Pasadena, CA 91125, USA
21Jodrell Bank Centre for Astrophysics, University of Manchester, Alan Turing Building, Oxford Road, Manchester M13 9PL, United Kingdom
22Space Telescope Science Institute, 3700 San Martin Drive, Baltimore, MD 21218, USA
23Anton Pannekoek Institute, University of Amsterdam, Postbus 94249, 1090 GE, Amsterdam, The Netherlands
24Department of Physics and Astronomy, University of Southampton, Southampton, SO17 1BJ, UK
25Fakultät fur Physik, Universität Bielefeld, Postfach 100131, D-33501 Bielefeld, Germany
26Institute for Radio Astronomy and Space Research, Auckland University of Technology, Private Bag 92006, Auckland 1142, New Zealand
27GRPHE - Université de Haute Alsace - Institut universitaire de technologie de Colmar, 34 rue du Grillenbreit BP 50568 - 68008 Colmar, France
28Technical University of Catalonia, Laboratory of Applied Bioacoustics, Rambla Exposició,08800 Vilanova i la Geltrú,Barcelona, Spain
29INFN - Sezione di Genova, Via Dodecaneso 33, 16146 Genova, Italy
30Friedrich-Alexander-Universität Erlangen-Nürnberg, Erlangen Centre for Astroparticle Physics, Erwin-Rommel-Str. 1, 91058 Erlangen, Germany
31Institut d’Investigació per a la Gestió Integrada de les Zones Costaneres (IGIC) - Universitat Politècnica de València. C/ Paranimf 1 , 46730 Gandia, Spain
32Aix-Marseille Université, CNRS/IN2P3, CPPM UMR 7346, 13288 Marseille, France
33APC, Université Paris Diderot, CNRS/IN2P3, CEA/IRFU, Observatoire de Paris, Sorbonne Paris Cité, 75205 Paris, France
34IFIC - Instituto de Física Corpuscular (CSIC - Universitat de València) c/ Catedrático José Beltrán, 2 E-46980 Paterna, Valencia, Spain
35LAM - Laboratoire d’Astrophysique de Marseille, Pôle de l’Étoile Site de Château-Gombert, rue Frédéric Joliot-Curie 38, 13388 Marseille Cedex 13, France
36INFN - Laboratori Nazionali del Sud (LNS), Via S. Sofia 62, 95123 Catania, Italy
37Nikhef, Science Park, Amsterdam, The Netherlands
38Huygens-Kamerlingh Onnes Laboratorium, Universiteit Leiden, The Netherlands
39INFN -Sezione di Roma, P.le Aldo Moro 2, 00185 Roma, Italy
40Dipartimento di Fisica dell’Università La Sapienza, P.le Aldo Moro 2, 00185 Roma, Italy
41Institute for Space Science, RO-077125 Bucharest, Măgurele, Romania
42INFN - Sezione di Bologna, Viale Berti-Pichat 6/2, 40127 Bologna, Italy
43INFN - Sezione di Bari, Via E. Orabona 4, 70126 Bari, Italy
44Géoazur, UCA, CNRS, IRD, Observatoire de la Côte d’Azur, Sophia Antipolis, France
45Univ. Paris-Sud , 91405 Orsay Cedex, France
46University Mohammed I, Laboratory of Physics of Matter and Radiations, B.P.717, Oujda 6000, Morocco
47Institut für Theoretische Physik und Astrophysik, Universität Würzburg, Emil-Fischer Str. 31, 97074 Würzburg, Germany
48Dipartimento di Fisica e Astronomia dell’Università, Viale Berti Pichat 6/2, 40127 Bologna, Italy
49Laboratoire de Physique Corpusculaire, Clermont Univertsité, Université Blaise Pascal, CNRS/IN2P3, BP 10448, F-63000 Clermont-Ferrand, France
50INFN - Sezione di Catania, Viale Andrea Doria 6, 95125 Catania, Italy
51LSIS, Aix Marseille Université CNRS ENSAM LSIS UMR 7296 13397 Marseille, France ; Université de Toulon CNRS LSIS UMR 7296 83957 La Garde, France ; Institut universitaire de France, 75005 Paris, France
52Royal Netherlands Institute for Sea Research (NIOZ), Landsdiep 4,1797 SZ ’t Horntje (Texel), The Netherlands
53Dipartimento di Fisica dell’Università, Via Dodecaneso 33, 16146 Genova, Italy
54Dr. Remeis-Sternwarte and ECAP, Universität Erlangen-Nürnberg, Sternwartstr. 7, 96049 Bamberg, Germany
55Moscow State University,Skobeltsyn Institute of Nuclear Physics,Leninskie gory, 119991 Moscow, Russia
56Mediterranean Institute of Oceanography (MIO), Aix-Marseille University, 13288, Marseille, Cedex 9, France; Université du Sud Toulon-Var, 83957, La Garde Cedex, France CNRS-INSU/IRD UM 110
57Dipartimento di Fisica ed Astronomia dell’Università, Viale Andrea Doria 6, 95125 Catania, Italy
58Direction des Sciences de la Matière - Institut de recherche sur les lois fondamentales de l’Univers - Service de Physique des Particules, CEA Saclay, 91191 Gif-sur-Yvette Cedex, France
59INFN - Sezione di Pisa, Largo B. Pontecorvo 3, 56127 Pisa, Italy
60Dipartimento di Fisica dell’Università, Largo B. Pontecorvo 3, 56127 Pisa, Italy
61INFN -Sezione di Napoli, Via Cintia 80126 Napoli, Italy
62Dipartimento di Fisica dell’Università Federico II di Napoli, Via Cintia 80126, Napoli, Italy
63Université de Strasbourg, IPHC, 23 rue du Loess 67037 Strasbourg, France - CNRS, UMR7178, 67037 Strasbourg, France
64University Mohammed V in Rabat, Faculty of Sciences, 4 av. Ibn Battouta, B.P. 1014, R.P. 10000
Rabat, Morocco
65Centre for Space Research, North-West University, Potchefstroom 2520, South Africa
66Universität Hamburg, Institut für Experimentalphysik, Luruper Chaussee 149, D 22761 Hamburg, Germany
67Max-Planck-Institut für Kernphysik, P.O. Box 103980, D 69029 Heidelberg, Germany
68Dublin Institute for Advanced Studies, 31 Fitzwilliam Place, Dublin 2, Ireland
69National Academy of Sciences of the Republic of Armenia, Marshall Baghramian Avenue, 24, 0019 Yerevan, Republic of Armenia
70Yerevan Physics Institute, 2 Alikhanian Brothers St., 375036 Yerevan, Armenia
71Department of Physics and Electrical Engineering, Linnaeus University, 351 95 Växjö, Sweden
72Institut für Physik, Humboldt-Universität zu Berlin, Newtonstr. 15, D 12489 Berlin, Germany
73LUTH, Observatoire de Paris, PSL Research University, CNRS, Université Paris Diderot, 5 Place Jules Janssen, 92190 Meudon, France
74Laboratoire d’Annecy-le-Vieux de Physique des Particules, Université Savoie Mont-Blanc, CNRS/IN2P3, F-74941 Annecy-le-Vieux, France
75University of Namibia, Department of Physics, Private Bag 13301, Windhoek, Namibia
76GRAPPA, Anton Pannekoek Institute for Astronomy, University of Amsterdam, Science Park 904, 1098 XH Amsterdam, The Netherlands
77Institut für Theoretische Physik, Lehrstuhl IV: Weltraum und Astrophysik, Ruhr-Universität Bochum, D 44780 Bochum, Germany
78Institut für Astro- und Teilchenphysik, Leopold-Franzens-Universität Innsbruck, A-6020 Innsbruck, Austria
79School of Physical Sciences, University of Adelaide, Adelaide 5005, Australia
80Sorbonne Universités, UPMC Université Paris 06, Université Paris Diderot, Sorbonne Paris Cité, CNRS, Laboratoire de Physique Nucléaire et de Hautes Energies (LPNHE), 4 place Jussieu, F-75252, Paris Cedex 5, France
81Laboratoire Univers et Particules de Montpellier, Université Montpellier, CNRS/IN2P3, CC 72, Place Eugène Bataillon, F-34095 Montpellier, France
82Université Bordeaux, CNRS/IN2P3, Centre d’Études Nucléaires de Bordeaux Gradignan, 33175 Gradignan, France
83Astronomical Observatory, The University of Warsaw, Al. Ujazdowskie 4, 00-478 Warsaw, Poland
84Institut für Astronomie und Astrophysik, Universität Tübingen, Sand 1, D 72076 Tübingen, Germany
85Instytut Fizyki Ja̧drowej PAN, ul. Radzikowskiego 152, 31-342 Kraków, Poland
86Funded by EU FP7 Marie Curie, grant agreement No. PIEF-GA-2012-332350
87School of Physics, University of the Witwatersrand, 1 Jan Smuts Avenue, Braamfontein, Johannesburg, 2050 South Africa
88Landessternwarte, Universität Heidelberg, Königstuhl, D 69117 Heidelberg, Germany
89Oskar Klein Centre, Department of Physics, Stockholm University, Albanova University Center, SE-10691 Stockholm, Sweden
90Wallenberg Academy Fellow
91Laboratoire Leprince-Ringuet, Ecole Polytechnique, CNRS/IN2P3, F-91128 Palaiseau, France
92Univ. Grenoble Alpes, IPAG, F-38000 Grenoble, France
CNRS, IPAG, F-38000 Grenoble, France
93Department of Physics and Astronomy, The University of Leicester, University Road, Leicester, LE1 7RH, United Kingdom
94Nicolaus Copernicus Astronomical Center, ul. Bartycka 18, 00-716 Warsaw, Poland
95Institut für Physik und Astronomie, Universität Potsdam, Karl-Liebknecht-Strasse 24/25, D 14476 Potsdam, Germany
96DESY, D-15738 Zeuthen, Germany
97Obserwatorium Astronomiczne, Uniwersytet Jagielloński, ul. Orla 171, 30-244 Kraków, Poland
98Centre for Astronomy, Faculty of Physics, Astronomy and Informatics, Nicolaus Copernicus University, Grudziadzka 5, 87-100 Torun, Poland
99Department of Physics, University of the Free State, PO Box 339, Bloemfontein 9300, South Africa
100Heisenberg Fellow (DFG), ITA Universität Heidelberg, Germany
101Department of Physics, Rikkyo University, 3-34-1 Nishi-Ikebukuro, Toshima-ku, Tokyo 171-8501, Japan
∗Deceased