The Host Galaxies of AGN
Guinevere Kauffmann1, Timothy M. Heckman2, Christy Tremonti2,
Jarle Brinchmann1,
Stéphane Charlot1,3, Simon D.M. White1 ,
Susan E. Ridgway2,
Jon Brinkmann4, Masataka Fukugita5,
Patrick B. Hall6,7, Željko Ivezić7,
Gordon T. Richards7, Donald P. Schneider8
1Max-Planck Institut für Astrophysik, D-85748 Garching, Germany
2Department of Physics and Astronomy, Johns Hopkins University, Baltimore, MD 21218
3 Institut d’Astrophysique du CNRS, 98 bis Boulevard Arago, F-75014 Paris, France
4 Apache Point Observatory, P.O. Box 59, Sunspot, NM 88349
5 Institute for Cosmic Ray Research, University of Tokyo, Chiba
277-8582, Japan
6 Departamento de Astronomía y Astrofísica, Facultad
de Física, Pontificia Universidad Católica de Chile,
Casilla 306, Santiago 22, Chile
7 Princeton University Observatory, Peyton Hall, Princeton NJ 08544-1001
8 Department of Astronomy and Astrophysics, 525 Davey Laboratory, Pennsylvania
State University, University Park, PA 16802
We examine the properties of the host galaxies of 22,623 narrow-line AGN with selected from a complete sample of 122,808 galaxies from the Sloan Digital Sky Survey. We focus on the luminosity of the [OIII]5007 emission line as a tracer of the strength of activity in the nucleus. We study how AGN host properties compare to those of normal galaxies and how they depend on L[OIII]. We find that AGN of all luminosities reside almost exclusively in massive galaxies and have distributions of sizes, stellar surface mass densities and concentrations that are similar to those of ordinary early-type galaxies in our sample. The host galaxies of low-luminosity AGN have stellar populations similar to normal early-types. The hosts of high-luminosity AGN have much younger mean stellar ages. The young stars are not preferentially located near the nucleus of the galaxy, but are spread out over scales of at least several kiloparsecs. A significant fraction of high-luminosity AGN have strong H absorption-line equivalent widths, indicating that they experienced a burst of star formation in the recent past. We have also examined the stellar populations of the host galaxies of a sample of broad-line AGN. We conclude that there is no significant difference in stellar content between type 2 Seyfert hosts and QSOs with the same [OIII] luminosity and redshift. This establishes that a young stellar population is a general property of AGN with high [OIII] luminosities.
1 Introduction
The discovery of a tight correlation between black hole mass and bulge velocity dispersion (Ferrarese & Merritt 2000; Gebhardt et al 2000) gives credence to theoretical arguments that spheroid formation and the growth of supermassive black holes are closely linked (e.g. Richstone et al 1998; Haehnelt, Natarajan & Rees 1998; Kauffmann & Haehnelt 2000; Monaco, Salucci & Danese 2000). Active galactic nuclei (AGN) are believed to be powered by the accretion of gas onto black holes located at the centres of galaxies (Lynden-Bell 1969). AGN thus signpost galaxies in which black holes are forming and it is natural to hypothesize that at least some AGN should be found in young spheroids. Direct observational evidence in support of this hypothesis remains controversial, however.
Recent Hubble Space Telescope imaging studies of QSO host galaxies at low redshifts have found that the majority of the most luminous QSOs reside in early-type galaxies (e.g. McLure et al (1999); Bahcall et al (1997) find that around 15% of the quasars in their sample are found in spirals). Although a subset of quasar host galaxies exhibit disturbed morphologies (Percival et al 2001), the stellar populations of these hosts appear indistinguishable from those of normal elliptical galaxies (McLure, Dunlop & Kukula 2000; Nolan et al 2001).
The claim that luminous QSOs are located in old ellipticals sits uncomfortably with the results of several major spectroscopic investigations that have confirmed the presence of young stars in at least half of all powerful narrow-line or type 2 Seyfert nuclei (Schmitt, Storchi-Bergman & Cid Fernandes 1999; Gonzalez Delgado, Heckman & Leitherer 2001; Cid Fernandes et al. 2001; Joguet et al 2001). There is also considerable evidence that the properties of AGN hosts depend strongly on the luminosity of the central source. The lowest luminosity AGN, the LINERs, have [OIII]5007 and H narrow-line region (NLR) emission line luminosities in the range to . LINERs are found in galaxies of earlier Hubble type than Seyferts and their nuclear continua are usually dominated by old stars (Heckman 1980a,b; Ho, Filippenko & Sargent 2003).
Up to now, studies of AGN host galaxies have been limited by small sample size. In order to carry out detailed statistical analyses of host galaxy properties, one requires complete magnitude-limited samples of galaxies with spectra of high enough quality to identify AGN based on the characteristics of their emission lines. A catalog of 26 Seyfert 1, 23 Seyfert 2 and 33 LINERs identified in the CfA Redshift survey (Huchra & Burg 1992) has formed the basis of many follow-up studies. De Grijp et al (1992) identified Seyfert galaxies from a sample of 563 IRAS sources selected from the Point Source Catalog. Most recently, Ho, Filippenko & Sargent (1995) carried out a survey of 486 nearby bright galaxies from the Revised Shapley-Ames Catalog with . The proximity of the galaxies in this survey meant that very high spatial resolution of the nuclear regions of the galaxies could be achieved. In addition, the spectra were of high quality, enabling the detection of relatively weak emission lines. Ho et al. found that 43% of the objects in their sample could be classified as AGN, a significantly higher fraction than in previous surveys of galaxies selected at optical wavelengths.
This paper examines the properties of 22,623 narrow-line AGN selected from a complete sample of 122,808 galaxies from the Sloan Digital Sky Survey with r-band magnitudes in the range . The relations between stellar mass, star formation history, size and internal structure for the galaxies in the parent sample are described in a recent paper by Kauffmann et al (2003b, hereafter Paper II) where it was found that ordinary galaxies divide into two distinct families at a stellar mass of . Low mass galaxies have young stellar populations, low surface mass densities, and the low concentrations typical of disks. At stellar masses above , a rapidly increasing fraction of galaxies has old stellar populations, high surface mass densities and the high concentrations typical of bulges. The star formation histories of galaxies correlate most strongly with surface mass density, with a transition from “young” to “old” stellar populations occurring at kpc-2.
In this paper, we compare the properties of AGN hosts with those of normal galaxies. The properties that we study include stellar masses, sizes, and surface densities, as well as stellar ages and past star formation histories, as deduced from key spectral features such as 4000 Å break strengths and the equivalent widths of Balmer absorption lines. We also study how these properties vary as a function of AGN luminosity as measured by the strength of the [OIII]5007 emission line. Section 2 reviews the properties of the galaxy sample and the methods used to derive parameters such as stellar mass, dust attenuation strength and burst mass fraction. In section 3, we describe how type 2 AGN are identified and classified and we investigate whether “featureless” nonstellar continuum can affect our conclusions about stellar ages and star formation histories. In section 4, we present a step-by-step comparison of the properties of type 2 AGN hosts with those of normal galaxies. Section 5, compares the stellar populations of the most powerful type 2 AGN in our sample with those of type 1 AGN of the same [OIII] luminosity and redshift. Finally, in section 6, we show images of representative examples of our most powerful AGN and discuss the implications of our results.
Throughout this paper we assume a Friedman-Robertson-Walker cosmology with , and =70 km s-1 Mpc-1.
2 Review of the Spectroscopic Sample of Galaxies
The Sloan Digital Sky Survey (York et al. 2000; Stoughton et al. 2002) is using a dedicated 2.5-meter wide-field telescope at the Apache Point Observatory to conduct an imaging and spectroscopic survey of about a quarter of the extragalactic sky. The imaging is conducted in the , , , , and bands (Fukugita et al. 1996; Gunn et al. 1998; Hogg et al. 2001; Smith et. al. 2002), and spectra are obtained with a pair of multi-fiber spectrographs. When the current survey is complete, spectra will have been obtained for nearly 600,000 galaxies and 100,000 QSOs selected uniformly from the imaging data. Details on the spectroscopic target selection for the “main” galaxy sample and QSO sample can be found in Strauss et al. (2002) and Richards et al. (2002) respectively. Details about the tiling algorithm and the astrometry can be found in Blanton et al (2003) and Pier et al (2003), respectively. The results in this paper are based on spectra of 122,000 galaxies with contained in the the SDSS Data Release One (DR1). These data are to be made publicly available in 2003.
The spectra are obtained through 3 arcsec diameter fibers. At the median redshift of the main galaxy sample ( 0.1), the projected aperture diameter is 5.5 kpc and typically contains 20 to 40% of the total galaxy light. The SDSS spectra are thus closer to global than to nuclear spectra. At the median redshift the spectra cover the rest-frame wavelength range from 3500 to 8500 Å with a spectral resolution 2000 ( 65 km/s). They are spectrophotometrically calibrated through observations of F stars in each 3-degree field. By design, the spectra are well-suited to the determination of the principal properties of the stars and ionized gas in galaxies. The absorption line indicators (primarily the 4000 Å break strength and the H index) and the emission line fluxes analyzed in this paper are calculated using a special-purpose code described in detail in Tremonti et al (2003, in preparation). A detailed description of the galaxy sample and the methodology used to derive parameters such as stellar mass and dust attenuation strength can be found in Kauffmann et al (2003a, hereafter Paper I).
The rich stellar absorption-line spectrum of a typical SDSS galaxy provides unique information about its stellar content and dynamics. However, it makes the measurement of weak nebular emission-lines quite difficult. To deal with this, we have performed a careful subtraction of the stellar absorption-line spectrum before measuring the nebular emission-lines. This is accomplished by fitting the emission-line-free regions of the spectrum with a model galaxy spectrum computed using the new population synthesis code of Bruzual & Charlot (2003, hereafter BC2003), which incorporates a high resolution (3 Å FWHM) stellar library. A set of 39 model template spectra were used spanning a wide range in age and metallicity. After convolving the template spectra to the measured stellar velocity dispersion of an individual SDSS galaxy, the best fit to the galaxy spectrum is constructed from a non-negative linear combination of the template spectra.
We have used the amplitude of the 4000 Å break (the narrow version of the index defined in Balogh et al. 1999) and the strength of the H absorption line (the Lick index of Worthey & Ottaviani 1997) as diagnostics of the stellar populations of the host galaxies. Both indices are corrected for the observed contributions of the emission-lines in their bandpasses. Using a library of 32,000 model star formation histories, we have used the measured and indices to obtain a maximum likelihood estimate of the -band mass-to-light ratio for each galaxy. By comparing the colour predicted by the best-fit model to the observed colour of the galaxy, we also estimate the attenuation of the starlight due to dust.
The SDSS imaging data provide the basic structural parameters that are used in this analysis. We use the -band as our fiducial filter because it is the least sensitive to the effects of dust attenutaion. The -band absolute magnitude, combined with our estimated values of M/L and dust attenuation yield the stellar mass (). The half-light radius in the -band and the stellar mass yield the effective stellar surface mass-density (). As a proxy for Hubble type we use the SDSS “concentration” parameter , which is defined as the ratio of the radii enclosing 90% and 50% of the galaxy light in the band (see Stoughton et al. 2002). Strateva et al. (2001) find that galaxies with 2.6 are mostly early-type galaxies, whereas spirals and irregulars have 2.0 2.6.
3 Identification and Classification of AGN
According to the standard “unified” model (e.g. Antonucci 1993), AGN can be broadly classified into two categories depending on whether the central black hole and its associated continuum and broad emission-line region is viewed directly (a “type 1” AGN) or is obscured by a dusty circumnuclear medium (a “type 2” AGN). Since this obscuring medium does not fully cover the central source, some of the radiation escapes and photoionizes surrounding gas, leading to strong narrow permitted and forbidden emission lines from the ‘Narrow Line Region’ (NLR). In type 1 AGN the optical continuum is dominated by non-thermal emission, making it a challenge to study the host galaxy and its stellar population. This is especially true of QSOs, where the continuum radiation from the central source outshines the stellar light from the host galaxy.
We have therefore excluded the type 1 AGN from our initial sample (but will undertake a limited analysis of such objects in section 5). The rejection of type 1 AGN from our sample is accomplished automatically by the SDSS spectral classification algorithm, which is based on a Principal Component Analysis (PCA) approach (Schlegel et al, in preparation). We have verified the reliability of this procedure through the manual inspection of 1000 spectra of the most powerful AGN in our sample. In about 8% of the cases, weak broad wings are present on the H emission-line, but not on H. In the standard nomenclature (Osterbrock 1989) these would be classified as “type 1.9” AGN (objects in which the obscuration of the central continuum source is substantial, but not complete). We retain these objects in our sample, since the contribution to the observed continuum by the AGN is not significant (see section 3.2 below).
Baldwin, Phillips & Terlevich (1981, hereafter BPT) demonstrated that it was possible to distinguish type 2 AGNs from normal star-forming galaxies by considering the intensity ratios of two pairs of relatively strong emission lines, and this technique was refined by Veilleux & Osterbrock (1987). It has become standard practice to classify objects according to their position on the so-called BPT diagrams. Fig. 1 shows an example of such a diagram for all the emission-line galaxies in our sample. We have plotted the ratio [OIII]5007/H versus the ratio [NII]6583/H for all galaxies where all four lines were detected with . Note that these ratios are almost completely insensitive to reddening or to errors in the spectrophotometry. This sample includes 55,757 objects (45.4% of our total sample of 122,808 galaxies). The other BPT diagrams involving the ratios [SII]6717,6731/H and [OI]6300/H include a somewhat smaller fraction of objects at a similar cut in signal-to-noise.
The exact demarcation between star-forming galaxies and AGN is subject to considerable uncertainty. Recently, Kewley et al (2001) used a combination of photo-ionization and stellar population synthesis models to place a theoretical upper limit on the location of star-forming models in the BPT diagrams. Their models allow for a wide range in metallicity, ionization parameter and dust depletion and also make allowances for the effects of shock excitation by supernovae. The Kewley et al demarcation between starbursts and AGN (shown as a dotted line in Fig. 1) represents a very conservative lower limit on the true number of AGN in our sample. Galaxies with emission line ratios that place them above this line cannot be explained by any possible combination of parameters in a star-forming model.
In practice, star-forming galaxies exhibit strong correlations between properties such as ionization parameter and metallicity, which cause them to exhibit rather little scatter around a single relation in the BPT diagram. This is evident from Fig. 1, which shows that there are two well-separated sequences of emission line galaxies and that the AGN sequence separates from the sequence of star-forming galaxies well below the Kewley et al demarcation curve. Based on these data, we have chosen to revise the demarcation between starburst galaxies and AGN as follows: A galaxy is defined to be an AGN if
| (1) |
This curve is represented by a dashed line in Fig.1 and in what follows, we use this as our canonical division between star-forming galaxies and AGN in our sample.
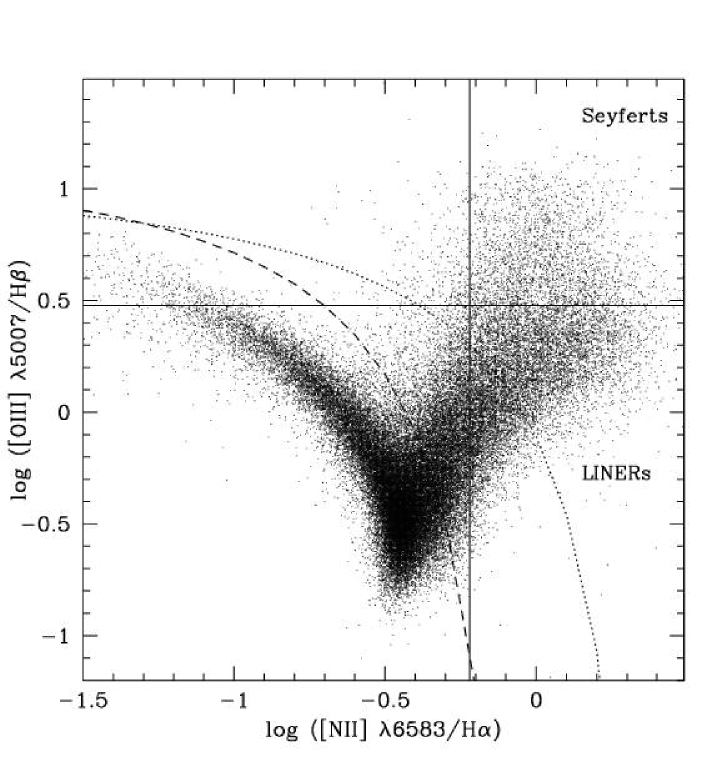
Narrow-line (type 2) AGN are traditionally divided into 3 general classes: type 2 Seyferts, LINERs, and the so-called “transition” objects. LINERs (Heckman 1980) typically have much lower nuclear luminosities than Seyferts. Spectroscopically, they resemble Seyferts except that low ionization lines such as [OI]6300 and [NII]6548,6583 are relatively strong. The relationship of LINERs to the more powerful Seyfert galaxies and QSOs has been a topic of substantial controversy. Like the Seyferts, the emission line properties of LINERs can be explained by ionization by a “hard” power-law spectrum. LINER-type spectra can, however, also be produced in cooling flows, starburst-driven winds and shock-heated gas (Heckman 1987; Filippenko 1992). This has led to some debate as to whether LINERs should be considered as a true low-luminosity extension of the AGN sequence. Finally, Ho et al (1993) introduced a class of “transition” objects with nuclear emission-line properties intermediate between those of normal star-forming galaxies and those of Seyferts and LINERs. Ho et al proposed that these objects are in fact ordinary LINER/Seyfert galaxies whose integrated spectra are diluted or contaminated by neighbouring HII regions.
In traditional classification schemes (see for example Ho, Filippenko & Sargent 1997), Seyfert galaxies are identified as those objects with high values of both [OIII]/H () and of other ratios involving lower ionization lines, such as [NII]/H, [SII]/H and [OI]/H. LINERs, on the other hand, have lower values of [OIII]/H (), but high values of ratios involving the lower ionization lines.
3.1 AGN as a sequence in [OIII] Line Luminosity
A contribution to the emission-line spectrum by both star-formation and an AGN is almost inevitable in many of the SDSS galaxies, given the relatively large projected aperture size of the fibers (5.5 kpc diameter at ). This is much larger than the 200 pc apertures used in the survey of nearby galaxy nuclei by Ho, Filippenko & Sargent (1997). It is therefore not surprising that the majority of AGN in our sample fall into the “transition” class, and have line ratios intermediate between those of star-forming galaxies and those of LINERs or Seyferts.
We therefore prefer an AGN classification system that is less sensitive to aperture, while still reflecting the difference in intrinsic nuclear luminosity between Seyfert galaxies and LINERs. Because we are studying type 2 systems, we seek an AGN component that emits radiation isotropically and that can be assumed to provide some indication of the total level of nuclear activity in the galaxy. In the optical, it is traditional to consider the luminosity of the narrow-line emission region (NLR), which, in principle, should not be strongly affected by the obscuring torus that surrounds the central source.
In this paper, we focus on the luminosity of the [OIII]5007 line as a tracer of AGN activity. Although this line can be excited by massive stars as well as an AGN, it is known to be relatively weak in metal-rich, star-forming galaxies. This can be seen in Fig. 1: star-forming galaxies define a sequence in which the ratio [OIII]/H decreases and the ratio [NII]/H increases towards higher gas-phase metallicities (e.g. Charlot & Longhetti 2001). The AGN sequence emerges as a plume from the bottom of the locus of star-forming galaxies. The morphology of the plume is strongly suggestive of a “mixing line”, in which the relative contribution of the AGN increases from lower left to upper right (see Kewley et al (2001) for a discussion). Fig. 1 also suggests that the “contaminating” emission is from metal-rich, star-forming regions, because the AGN sequence emerges from the bottom of the locus of star-forming galaxies. As we show later, this is expected because AGN are located in massive galaxies. Star-forming galaxies are known to exhibit a strong mass-metallicity relation (Tremonti et al. 2003). If AGN hosts lie on this relation, their metallicities will be solar or higher, and the contamination of the [OIII] line by star-formation will be small.
The [OIII] line also has the advantage of being strong and easy to detect in most galaxies. It should be noted that because the narrow-line emission arises outside the dust sublimation radius, it is affected by dust within the host galaxy. Thus it is important to correct our [OIII] luminosities for the effects of extinction. We can measure the extinction using the Balmer decrement. This procedure has clear physical meaning in the “pure” Seyfert 2’s and LINERs. In the case of the transition objects, the lines will arise both in the NLR and the surrounding HII regions, with a greater relative AGN contribution to [OIII] than to the Balmer lines. Thus, a dust correction to [OIII] based on the ratio H/H should be regarded as at best approximate.
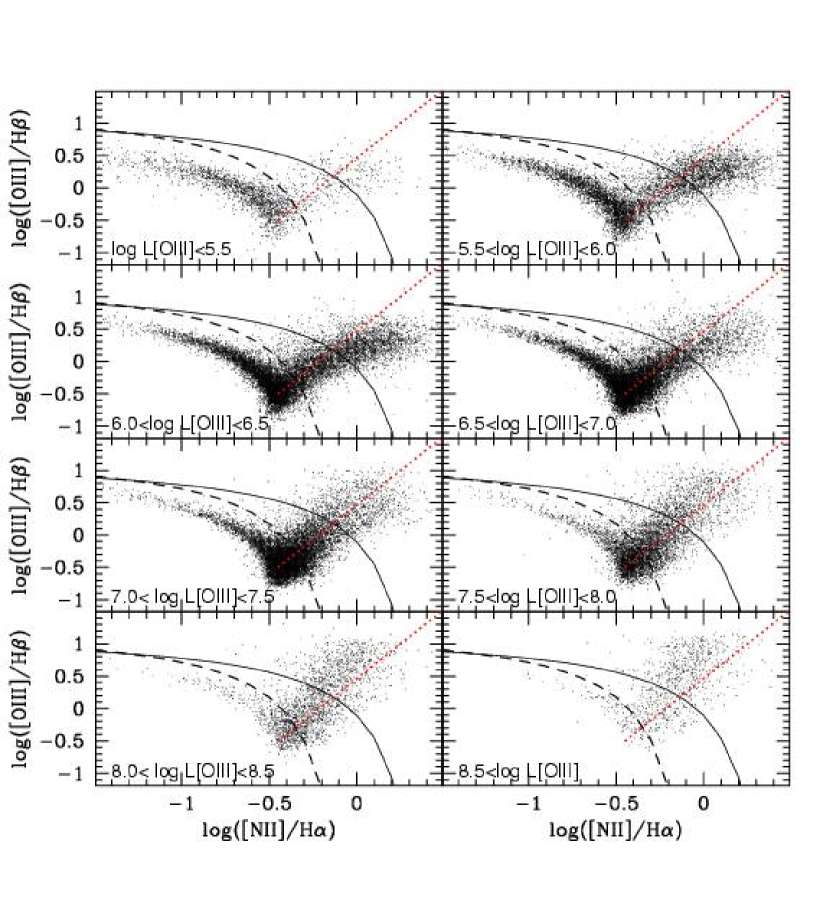
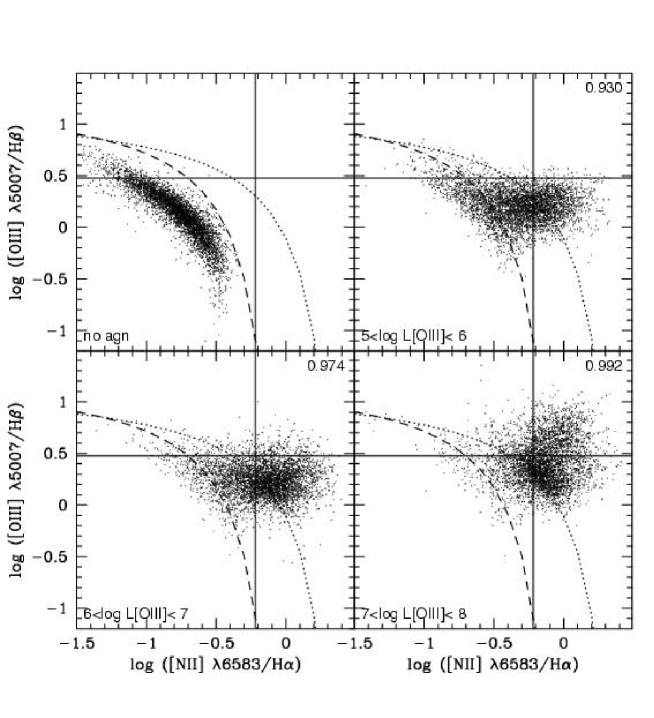
In Fig. 2 we plot the [OIII]/H versus [NII]/H BPT diagram in bins of extinction-corrected [OIII] line luminosity. Fig. 2 shows clearly that the region of the BPT diagram occupied by galaxies classified as LINERs is primarily populated by objects with low [OIII] line luminosities. Conversely, the region of the diagram with [OIII]/H and [NII]/H (i.e. the Seyfert region of the diagram) is mainly populated with galaxies that have high [OIII] luminosities. This demonstrates that classification by line ratio and classification by [OIII] luminosity are roughly equivalent for LINERs and Seyferts.
The virtue of classifying galaxies by [OIII] luminosity is that this then allows us to study the large number of transition galaxies with spectra intermediate between pure star-forming systems and pure LINERs/Seyferts. Fig. 2 shows that transition galaxies span a wide range in [OIII] luminosity, but have very similar line ratios. This means that one cannot distinguish between transition objects containing a Seyfert 2 nucleus and those containing a LINER on the basis of position in the BPT diagram alone. Adding the extra dimension of [OIII] luminosity, the separation is clear. We stress that any attempt to characterize the stellar population in AGN hosts must include the transition objects that comprise the majority of the AGN in Fig. 1. Excluding these would bias the sample against host galaxies with significant amounts of on-going star-formation.
We propose the following simple scheme for characterizing the position of an emission line galaxy on the BPT diagram of Fig. 1. We define an “origin” O located at [NII]/H=-0.45 and [OIII]/H=-0.5, i.e. near the bottom of the locus of star-forming galaxies where it intersects the lower end of the AGN sequence. We then parametrize the position of each galaxy by its distance from the origin O, and by an angle , which is defined to be zero in the direction parallel to the positive [OIII]/H axis, and which increases as the galaxy moves in a clockwise direction towards increasing values of [NII]/H and decreasing values of [OIII]/H. In this scheme, pure Seyferts are characterized by large values of and small values of (), whereas “pure” LINERs are characterized by large values of and values of in the range . Transition objects are characterized by small values of .
The left panel of Fig. 3 shows the correlation between [OIII] line luminosity and for the AGN in our sample. In this plot, we have excluded the transition objects by selecting only those AGN that lie above the Kewley et al (2001) demarcation curve. There is a strong transition in the median AGN luminosity at . In the right panel of Fig. 3, we plot L[OIII] as a function of . There is no strong trend in intrinsic AGN luminosity as a function of distance from the locus of star-forming galaxies. This supports the idea that AGN define two basic “mixing sequences”: a star-formation plus high-luminosity AGN (Seyfert 2 sequence) and star-formation plus low-luminosity AGN (LINER sequence).

3.2 The Effect of the AGN on the Derived Host Galaxy Properties
The traditional view of type 2 AGN is that their spectra are composed of an old, metal-rich stellar population plus an underlying “featureless continuum” produced by the central source (e.g. Koski 1978). This view has been challenged in recent years by a number of studies showing that the spectra are, in fact, better fit by stellar populations that span a wide range in age and metallicity.
Schmitt, Storchi-Bergmann & Cid Fernandes (1999) have carried out a detailed spectral synthesis analysis of spectra of the nuclear regions of 20 nearby Seyfert 2 galaxies. They fit each observed spectrum using a grid of equivalent widths and continuum ratios measured from star clusters of different ages and metallicities. In addition they include a power-law component to represent a canonical AGN continuum. The code considers all possible linear combinations of age, metallicity and featureless continuum, weighting each solution by in order to construct the likelihood function of parameters such as stellar age or fractional contribution of the AGN continuum. The main result of this analysis is that the continuum contribution of the AGN is extremely small, rarely exceeding 5 percent. The analysis in Schmitt et al (1999) focused on the nuclear stellar populations of type 2 Seyferts. As discussed in section 2, the SDSS spectra include much more galaxy light, so we expect the contribution from the featureless continuum to be even smaller.
It is important to establish that this is the case. Throughout this paper we will use the strength of the 4000 Å break as our primary indicator of the age of the stellar population. Any contribution of AGN light would decrease the strength of the 4000 Å break, causing us to underestimate the age of the stellar population. It should be noted, however, that stellar Balmer absorption-lines become weaker with age, and for “well-behaved” (continuous) past star-formation histories, the equivalent widths of the Balmer lines are inversely correlated with the 4000 Å break strength (see Paper I). Thus, the addition of AGN light to the Balmer lines would cause us to overestimate the stellar age. A clear test of the importance of AGN light is to compare the Balmer absorption lines in AGN hosts with the Balmer lines in normal galaxies that have the same 4000 Å break strength. If AGN light is significant, the Balmer lines will be weaker in the AGN hosts.
To perform this test, we have combined the spectra of our highest [OIII] luminosity AGN to create a high signal-to-noise composite spectrum. This is plotted in black in Fig. 4. For each AGN included in the composite, we picked out a random galaxy from the parent sample with the same stellar mass, 4000 Å break strength and redshift as the AGN host. We combined the spectra of these “matching” galaxies to create the spectrum shown in red. As can be seen, the AGN spectrum and the galaxy spectrum are identical except for the emission lines, which are stronger in the AGN (as expected). In particular, the high-order Balmer absorption-lines match extremely well. We have also experimented with fitting the AGN template spectrum with a combination of BC2003 model spectra and a canonical QSO spectrum (Vanden Berk et al 2001). We find that we cannot obtain an acceptable fit if the QSO contributes more than a few percent of the light in the -band.
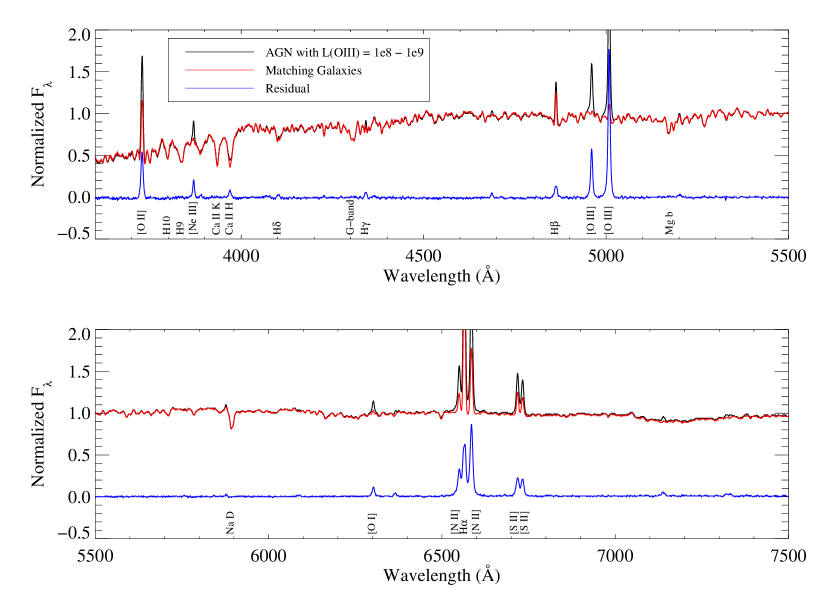
It is also important to consider the effect of the AGN emission on the basic galaxy structural properties derived from the SDSS imaging data. In particular, we have used the -band absolute magnitude to calculate the host galaxy stellar mass () and surface mass density (), and have used the -band images to measure the concentration parameter (). From Fig. 4, it is clear that the continuum in AGN hosts is dominated by starlight and that any AGN continuum emission will not affect our derived parameters. The effect of AGN emission-lines will likewise be small. The -band samples a spectral region in the rest-frame of a typical AGN host that is devoid of strong emission-lines. For 0.06 the [NII]6548,6584 and H emission-lines fall in the bandpass, while the [OIII]4959,5007 lines move in at 0.11. Fortunately, either set of lines has a combined equivalent width ranging from 10 Å in weak AGN to 100 Å in powerful AGN. Since the SDSS bandpass is 1400 Å wide, the flux contribution of the emission-lines to the -band flux will be at most a few percent in the inner 3 arcsec region of the galaxy.
In this section, we have argued that AGN light does not contribute significantly to the continuum emission in type 2 AGN. Regions of star-formation do, however, make a significant contribution to the emission-line spectra of the AGN in our sample, because of the large projected aperture size of the SDSS fibers. Because the two composite spectra plotted in Fig. 4 are matched in stellar mass and in mean stellar age, it is reasonable to assume that the galaxies included in the two samples have similar amounts of on-going star-formation. Comparison of the emission-line properties of the two spectra demonstrates that in the AGN composite spectrum, star-forming regions contribute 50% of the [OII]3727 flux, 70% of the H flux, 65% of the H flux, and 45% of the [NII]6584 and [SII]6717,6731 flux. In contrast, star-forming regions contribute only 7% of the [OIII]5007 flux. The [OIII]5007 line is clearly a far better measure of the AGN power than any of the other strong emission-lines. Croom et al. (2002) reach qualitatively similar conclusions for low-redshift QSOs.
4 The Host Galaxies of Type 2 AGN
In this section we study the properties of the host galaxies of the AGN in our sample, including their stellar masses, their surface mass densities and concentrations, and their mean stellar ages as measured by spectral indices such as the 4000 Å break strength.
Note that the AGN in our sample are drawn from an -band limited spectroscopic survey of galaxies. Galaxies of different luminosities can be seen to different distances before dropping out due to the selection limits of the survey. The volume within which a galaxy can be seen and will be included in the sample goes as the distance limit cubed, which results in the samples being dominated by intrinsically bright galaxies. Throughout this analysis, we will correct for this effect by giving each galaxy or AGN a weight equal to the inverse of its maximum visibility volume determined from the apparent magnitude limit of the survey (see Paper II for more details). All correlations we plot should then be appropriate for a volume-limited sample of galaxies and should no longer be affected by selection biases due to the criteria which define the main galaxy sample.
4.1 Stellar Mass and Aperture Effects
As discussed in section 3, our sample of emission-line galaxies includes 55,747 objects where the four emission lines, H, [NII], [OIII] and H, are all detected with . In total, forty percent of these galaxies are classified as AGN, but this number is strongly dependent on host mass and to a lesser extent, on morphological type. This is illustrated in Fig. 5. In the top panels, the blue histogram shows the fraction of all galaxies that have emission lines as a function of and . The red histogram shows the fraction of all galaxies that are classified as AGN. The black histogram shows the fraction of all emission line galaxies that are classified as AGN. As can be seen, AGN are preferentially found in more massive and more concentrated galaxies. The dependence of AGN fraction on mass is very striking. Even though 70-80% of galaxies with stellar masses less than have detectable emission lines, only a few percent are classified as AGN. In contrast, more than 80% of emission line galaxies with are AGN.
It should be noted that AGN detection rates are subject to strong selection effects. Ho et al (1997) find that 43% of the galaxies in their survey can be regarded as active and nearly all their galaxies have detectable emission lines. In our sample, the nuclear spectrum will be diluted by the light from surrounding host galaxy, so our derived AGN fractions are lower. In the middle left panel of Fig. 5 we plot the AGN fraction as a function of normalized distance , where is the maximum redshift out to which the galaxy would have been included in the SDSS main galaxy sample. The red line shows the AGN fraction for “massive” galaxies with stellar masses in the range . The blue line is for low mass galaxies in the range . The AGN fraction in massive galaxies is a very strong function of distance. At low values of , the AGN fraction reaches %, a value very similar to the fraction that Ho et al found for the galaxies in their sample. On the other hand, the AGN fraction in low mass galaxies does not rise above a few percent, even at low values of . There are 6586 galaxies in our sample with stellar masses in the range , so this result has high statistical significance.
We now ask whether it is possible to define an AGN fraction that does not depend on aperture. In the middle right panel of Fig. 5, we plot the fraction of AGN in galaxies with stellar masses in the mass range and with [OIII] line luminosities greater than (red), (green) and (blue) as a function of normalized distance. For [OIII] luminosities greater than , the AGN fraction no longer depends on . We will henceforth refer to AGN as “strong” or “weak” using L[OIII] = as a dividing line. Fig. 5 shows that our sample of strong AGN is complete. Figs 2 and 3 imply that the division very roughly corresponds to that between Seyferts and LINERs. Finally, in the bottom two panels of Fig. 5 we plot the fraction of “strong” AGN in galaxies as a function of and .
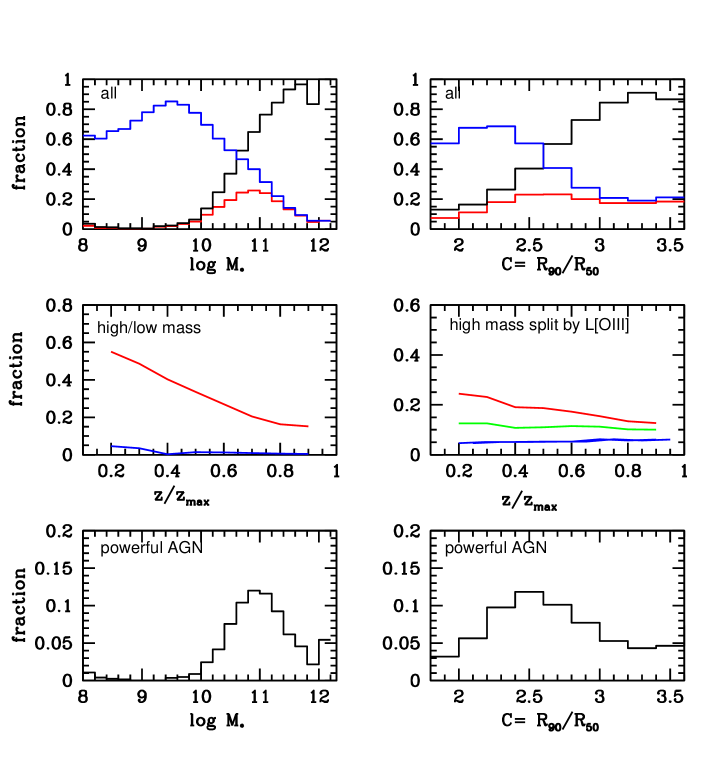
The most striking result in Fig. 5 is that very few AGN are found in galaxies with . As discussed in Paper II, the majority of low mass galaxies have young stellar populations and a significant fraction are experiencing “bursts” of star formation at the present day. Many low mass galaxies thus have strong emission lines due to star formation and one might therefore be concerned whether our BPT diagnostic method would be able to detect an AGN in such objects. In the top left panel of Fig. 6, we plot the [OIII]/H versus [NII]/H BPT diagram for emission-line galaxies that are not classified as AGN and that have stellar masses in the range . The next 3 panels in Fig. 6 illustrate the effect of adding successively more powerful AGN to these galaxies. We have extracted “pure” AGN lying above the Kewley et al demarcation curve in Fig. 1 and we have ranked these AGN according to their extinction-corrected [OIII] luminosities. For each low mass galaxy, we select a random AGN and add its observed emission-line luminosities to those of the original galaxy. Fig. 6 shows that the presence of even a low-luminosity AGN with log L[OIII] perturbs the emission line ratios enough to allow the AGN to be identified in 93% of the galaxies in the sample. The bottom right panel of Fig. 6 demonstrates that a powerful AGN with L[OIII] would be detected in more than 99% of the objects.
Although we cannot rule out the presence of extremely weak active nuclei in low mass galaxies, such as the AGN with L[OIII]= discussed by Kraemer et al (1999) in the Sdm galaxy NGC 4395, we conclude that more powerful AGN are confined almost exclusively to high mass galaxies. Ulvestad & Ho (2002) have recently reached similar conclusions using radio observations of a sample of 40 late-type galaxies.
There are many studies in the literature that indicate a positive correlation between AGN power and host galaxy luminosity or linewidth. Most of these studies have been restricted to specific classes of AGN, for example Seyferts (e.g. Nelson & Whittle 1996) QSOs (e.g. Kotilainen & Ward 1994; Croom et al. 2002), and radio galaxies (e.g. Ledlow & Owen 1996). In the left panel of Fig. 7 we plot as a solid line the median stellar mass of AGN host galaxies as a function of [OIII] luminosity. The dashed lines indicate the 16-84 percentiles of the distribution at a given value of L[OIII]. Fig. 7 shows that galaxies of given mass are able to host AGN that span a very wide (more than several orders of magnitude) range in [OIII] luminosity. Note that we are unable to detect AGN with [OIII] luminosities much below , so the actual range may be considerably larger. The median stellar mass of the host depends only weakly on [OIII] luminosity, but we do find that more powerful AGN are located preferentially in more massive host galaxies.
In the right panel of Fig. 7, we plot the maximum [OIII] luminosity that is attained by galaxies of a given stellar mass. In order to estimate L[OIII](max) in an unbiased way, we have ordered all 122,808 galaxies in our sample according to stellar mass. We then partition the sample into mass bins that contain an equal number of galaxies (2000 in this case). The dotted line shows the upper 99th percentile of the [OIII] luminosity distribution in each mass bin. (Note that the most [OIII]-luminous galaxies are indeed AGN for , but are mostly star-forming galaxies for .) The solid line shows the upper 97.5 percentiles of the distribution. As can be seen, L[OIII](max) scales roughly linearly with stellar mass at . At high stellar masses L[OIII](max) flattens and there is even evidence for a turnover at the highest masses ().

4.2 Surface Mass Density and Concentration
Most previous studies of the global morphologies of type 2 AGN hosts have concentrated on Hubble type. Early morphological studies of Seyfert galaxies by Adams (1977) and Heckman (1978) revealed that most Seyferts are in spiral galaxies, primarily early-type spirals (Sa-Sb). AGN in the survey of nearby galaxy nuclei by Ho, Filippenko & Sargent (1997) are found in ellipticals, in lenticulars and in bulge-dominated spirals, with LINERs occupying earlier-type hosts than Seyferts or transition systems.
Because it is impractical to classify hundreds of thousands of galaxies by eye, studies of galaxy morphology in the SDSS have focused on simple structural parameters that can be measured automatically for very large numbers of objects. In section 2, we defined two such parameters: the concentration index and the stellar surface mass density . As discussed in Strateva et al (2001) and in Paper II , early-type galaxies (Hubble type Sa,S0 and E) have in the range kpc-2 and . Late type galaxies have kpc-2 and .
In Fig. 8 we plot the weighted distributions of and as a function of [OIII] luminosity for the AGN in our sample. AGN of all luminosities are found in galaxies with high surface densities and intermediate concentrations.

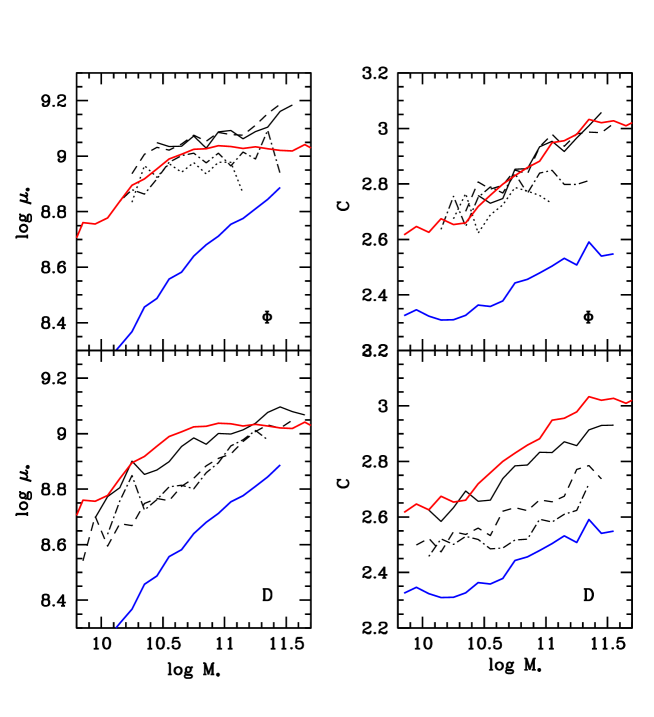
In Paper II, we showed that and correlate strongly with stellar mass in ordinary galaxies. A sharp transition in both and takes place at a characteristic stellar mass of . If the sample is split into early- and late-type subsamples at a index value of 2.6, the surface densities of late-type galaxies scale with stellar mass as . The surface densities of early-type galaxies, on the other hand, are independent of stellar mass, and have a median value of kpc-2.
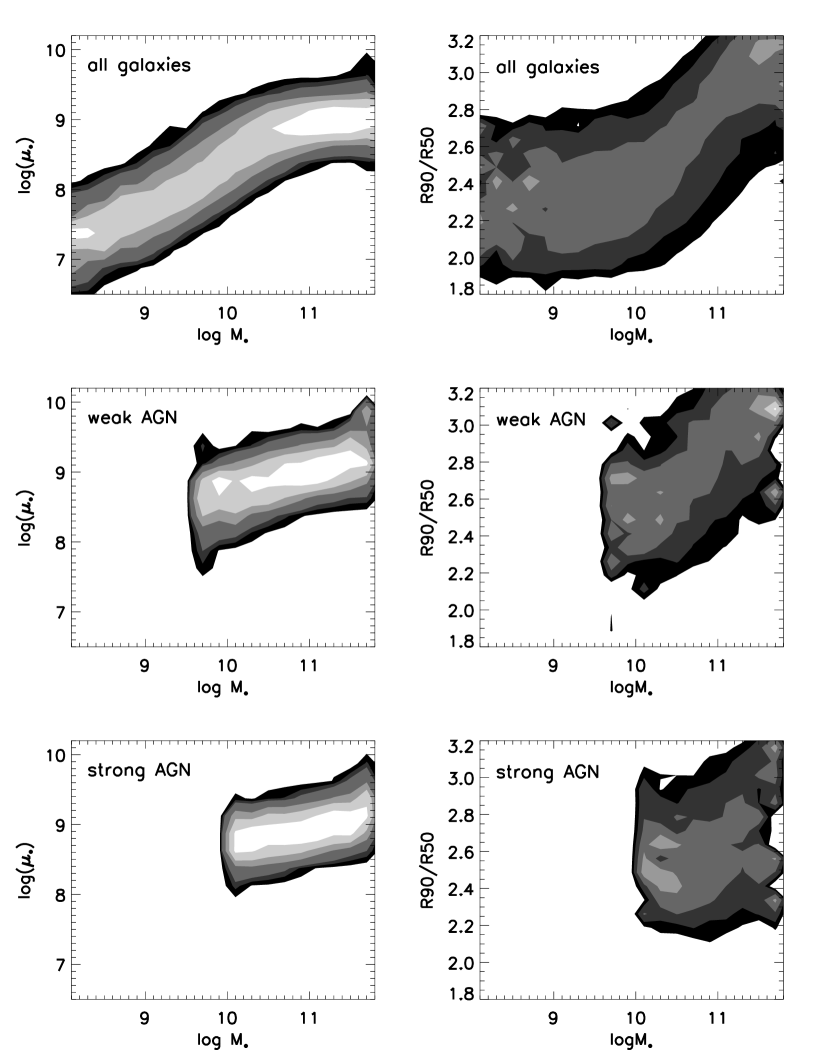
Fig. 9 compares the and relations for AGN with those of ordinary galaxies. The grey-scale indicates the fraction of galaxies in a given logarithmic mass bin that fall into each bin in surface density or concentration (see Paper II for more details on how these conditional density distributions are computed). Note that we only plot the relations in mass bins that contain more than 100 objects. This is why the relations cut off below for the strong (weak) AGN. Fig. 9 shows that strong AGN (defined to have log L[OIII]) show very little dependence of either concentration or surface mass density on stellar mass. At all masses, they have the high densities typical of early-type galaxies and concentrations that are intermediate between early and late-type galaxies. Both the concentrations and the surface densities of the weak AGN (log L[OIII]) are similar to those of ordinary galaxies of the same stellar mass.
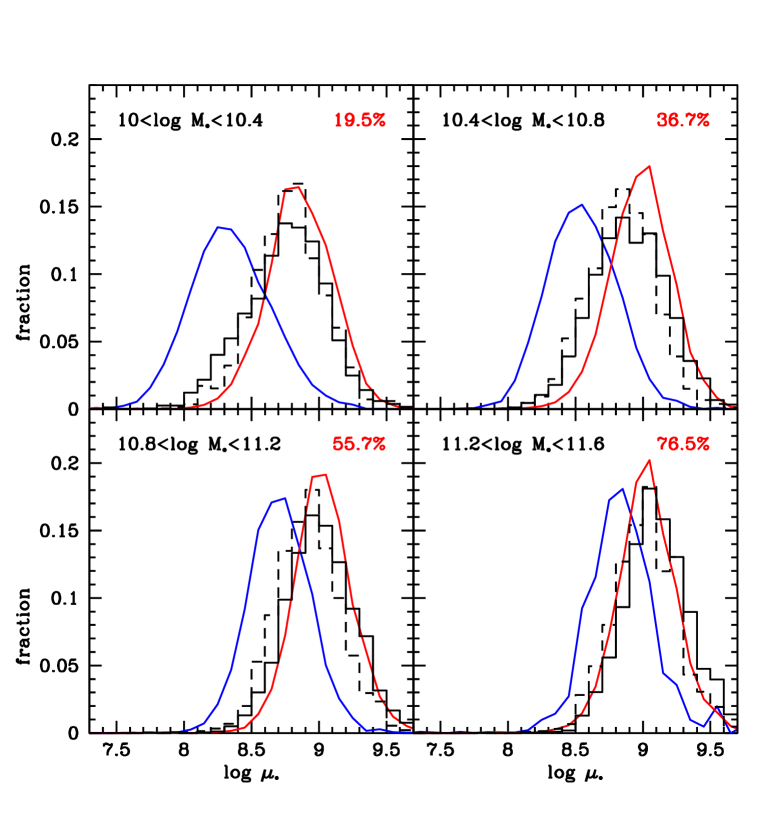
In Fig. 10, we compare the surface mass density distributions of AGN hosts to those of ordinary early-type and late-type galaxies. We have separated early-type galaxies from late-types at a index of 2.6, and we show results for four independent ranges in . Fig. 10 shows that the surface density distributions of AGN host galaxies strongly resemble those of early-type galaxies of the same stellar mass.
Finally, Fig. 11 shows how the surface densities and concentrations of AGN hosts vary as a function of position on the BPT diagram. AGN that lie close to the sequence of star-forming galaxies in the BPT diagram occur in lower-density, less concentrated hosts. This is consistent with the idea that the transition objects occur in galaxies of later type than “pure” Seyferts or LINERs. On the other hand, there appears to be rather little trend in the or relations as a function of the ionization-sensitive angle parameter (Note that in the plots we have restricted the sample to objects lying above the Kewley et al (2001) line, whereas in the plots we use all objects above our canonical AGN line). This result indicates that pure LINERs and pure Seyferts are structurally very similar.
4.3 Mean Stellar Age
In the previous subsection, we showed that AGN occupy host galaxies with structural properties similar to ordinary early-type galaxies (with the similarity being stronger for the weak AGN). The properties of the stellar populations of normal galaxies are known to correlate strongly with morphological type. Early-type galaxies have old stellar populations and very little gas and dust, whereas there is usually plenty of ongoing star formation in late-type galaxies. As discussed in Paper I, Dn(4000) is an excellent age indicator at mean stellar ages less than Gyr (corresponding to Dn(4000) values 1.4-1.5). At older ages, the Dn(4000) index is sensitive to metallicity as well as to age. We have shown that AGN are found in massive () host galaxies, so metallicity variations among hosts are likely to be small and it is appropriate to use the Dn(4000) index as a rough stellar age indicator.
In Fig. 12 we plot Dn(4000) and H as a function of [OIII] luminosity for all the AGN in our sample. There is a strong correlation of both age-sensitive parameters with AGN luminosity. Only the weakest AGN have stellar ages in the range that is normal for early-type galaxies (Dn(4000) and H 1).

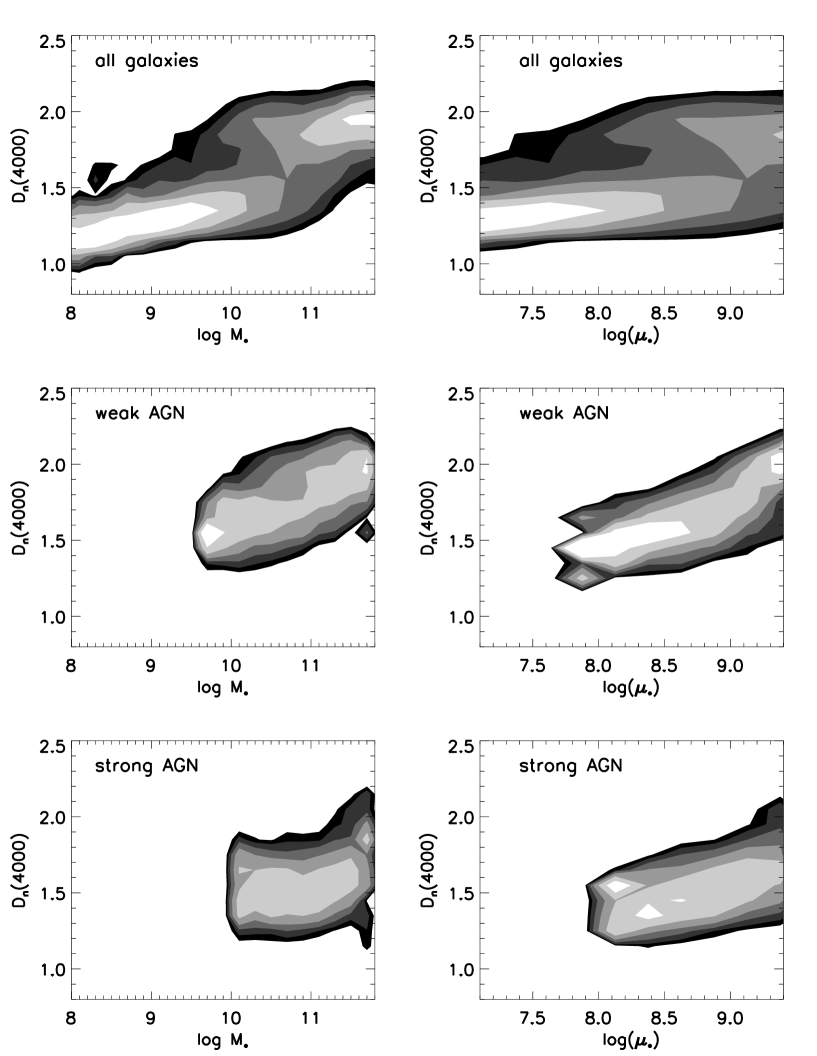
In Fig. 13, we compare the Dn(4000)– stellar mass and Dn(4000)– surface density relations for AGN hosts with those of normal galaxies. The normal galaxy relations exhibit a strong transition in Dn(4000) at and kpc-2. This reflects a switch from a population of young late-type galaxies with low masses and low surface densities to a population of old early-type galaxies with high masses and surface densities. Fig. 13 shows that strong AGN do not fit on the relations defined by normal galaxies. They have a much weaker dependence of age on stellar mass or surface mass density than normal galaxies. In particular, they occur at much lower values of Dn(4000) than the normal galaxies in the high-mass, high-density regime (, kpc-2). The weak AGN resemble normal galaxies more closely.
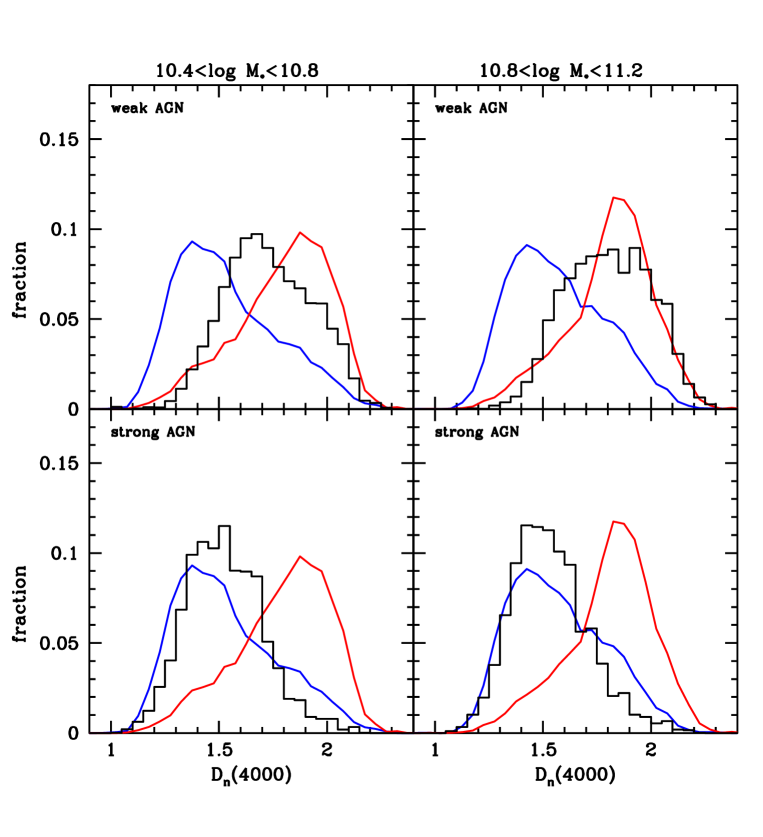
In Fig. 14, we compare the Dn(4000) distributions of AGN hosts with ‘normal’ early-type () and late-type () galaxies. This plot is very similar in spirit to Fig. 10, but reaches a rather different conclusion. In Fig. 10, we showed that both weak and strong AGN had surface density distributions very similar to early-type galaxies. Fig.13 shows that the Dn(4000) distributions of weak AGN resemble those of early-types, but that strong AGN have stellar ages similar to those of late-type galaxies.
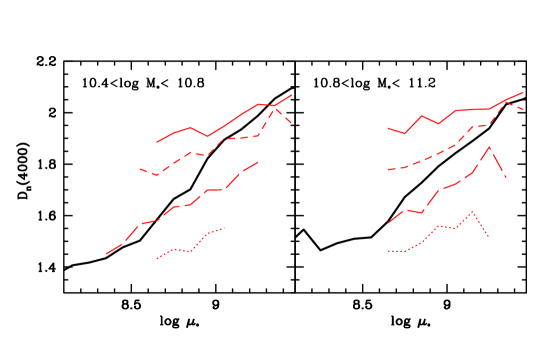
As discussed in Paper II, the star formation histories of normal galaxies appear to be more fundamentally linked to surface mass density than to mass. We demonstrated that there is a “universal” relation between Dn(4000) and that is independent of the stellar mass of the galaxy, except at the very highest values of . The results in Fig. 14 suggest that the Dn(4000)- relation for the hosts of strong AGN is significantly different. In Fig. 15, we plot the median value of Dn(4000) as a function of for AGN of different luminosities (red lines) and compare this with the relation obtained for ordinary galaxies (thick black line). At high surface mass densities, low-luminosity AGN follow the relation defined by ordinary galaxies, but high-luminosity AGN have substantially smaller Dn(4000) values (a younger age) at a given value of . At low surface mass densities, the hosts of weak AGN have older stellar populations than normal galaxies of the same surface density.
How can we reconcile the results of Fig. 15 with the fact that the majority of galaxies exhibit a very different relation between age and surface mass density? One interpretation is that powerful AGN reside in early-type galaxies that are undergoing or have recently undergone a transient star-forming event (starburst). The magnitude of this event might plausibly scale with AGN luminosity, so that its effects on the stellar population and structural parameters are most pronounced in the hosts of strong AGN. The duration of this event is short compared to the age of the Universe, so only a fraction of galaxies are caught in the act. As the AGN switches off and the stellar population ages, the galaxy eventually (re)joins the ranks of the normal early-type population. If this hypothesis is correct, then we ought to see evidence that the star formation timescales in high luminosity AGN are short.
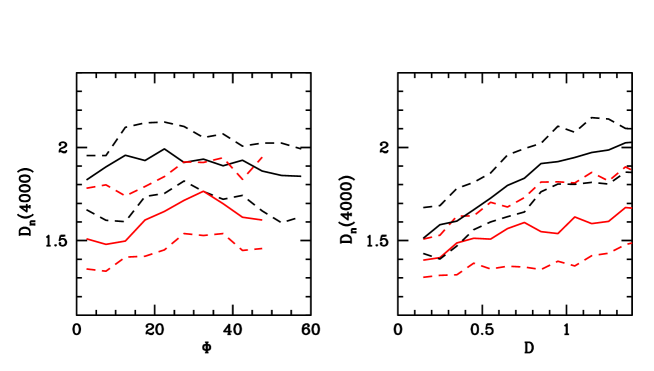
In Fig.16, we show the relation between Dn(4000) and the position of the galaxy in the BPT diagram. Because Dn(4000) is itself very strongly correlated with [OIII] luminosity (Fig. 12), we remove this effect by analyzing weak AGN and strong AGN separately. The left panel of Figure 16. shows that there is then no residual correlation of Dn(4000) with . The correlation of Dn(4000) with distance parameter is more interesting. The right panel of Fig. 16 shows that in weak AGN, Dn(4000) correlates strongly with , but in strong AGN, the dependence is much weaker. So far we have interpreted as a measure of the relative contribution of star formation to the observed emission lines. (Recall that we showed in Fig. 3 that AGN luminosity does not correlate with , implying that galaxies with lower values of have relatively more star formation). For weak AGN, the increase in Dn(4000) with distance from the locus of star-forming galaxies appears to support this hypothesis, but how can we explain the fact that there is a much weaker trend for strong AGN? The parameter is determined by the amount of on-going star-formation in the galaxy because the Balmer emission-lines are excited by O stars with lifetimes of several million years. Dn(4000), on the other hand, tracks the luminosity-weighted mean stellar age on much longer timescales ( years). Thus, the result in Fig. 16 can be understood if high-luminosity AGN with young stellar populations (small Dn(4000)) and large have recently stopped forming stars (i.e. they are post-starburst systems). In the next section, we demonstrate that this is indeed the case.
4.4 The Star Formation Histories of AGN
Strong H absorption arises in galaxies that experienced a burst of star formation that ended Gyr ago. As discussed in Papers I and II, the location of galaxies in the Dn(4000)/H plane is a powerful diagnostic of whether they have been forming stars continuously or in bursts over the past 1-2 Gyr. Galaxies with continuous star formation histories occupy a very narrow strip in this plane. A recent burst is required in order to obtain significant displacement away from this locus. In Paper II, we also showed that the probability for a galaxy to have experienced a recent burst is a strong function of stellar mass. A significant fraction (more than 10%) of low-mass galaxies with appear to have experienced recent bursts. The fraction of bursty galaxies drops by more than a factor of 10 for galaxies more massive than . In the previous section, we showed that the host galaxies of powerful AGN had mean stellar ages that were similar to those of ordinary late-type galaxies. In this section, we ask whether the star formation histories of AGN hosts are different from those of ordinary galaxies. In particular, we ask whether there is any evidence that powerful AGN are associated with bursty rather than continuous star formation histories.
In the SDSS sample, the typical error on the H index is 1.4 Å, which is large compared to the total range of values spanned by this index (-3 to +9 Å). In order to analyze the star formation histories of AGN in a more reliable way, we have extracted a subsample of objects with small ( Å) errors in H. This reduces our total sample of AGN to 1400 objects. Compared to the full sample of 22,000 AGN, our subsample is biased to lower mean redshift (0.05 rather than 0.1). Thus, the spectra sample systematically smaller regions of the host galaxies than in the full sample (typical projected fiber diameter 3 kpc vs. 6 kpc). However, so long as we impose the same selection criterion on the normal galaxies as we do on the AGN, the comparison between the two subsamples is a fair one.
In Fig. 17, we plot our subsamples of normal galaxies, strong AGN and weak AGN in the Dn(4000)/H plane. The locus occupied by galaxies with continuous star formation histories is indicated using red coloured symbols. The normal galaxies are selected to have stellar masses in the same range as the AGN hosts (). As can be seen, most normal galaxies fall close to the locus of continuous star formation histories. A significant fraction of the powerful AGN, on the other hand, are displaced to high values of H. This is shown quantitatively in Fig. 18 where we plot the fraction of AGN with H values that are displaced by more than 3 above the locus of continuous models. This fraction increases from several percent for the weakest AGN to nearly a quarter for the strongest. The corresponding value of for the sample of normal massive galaxies is only 0.07. For normal massive galaxies with ‘young’ stellar populations (Dn(4000)), .
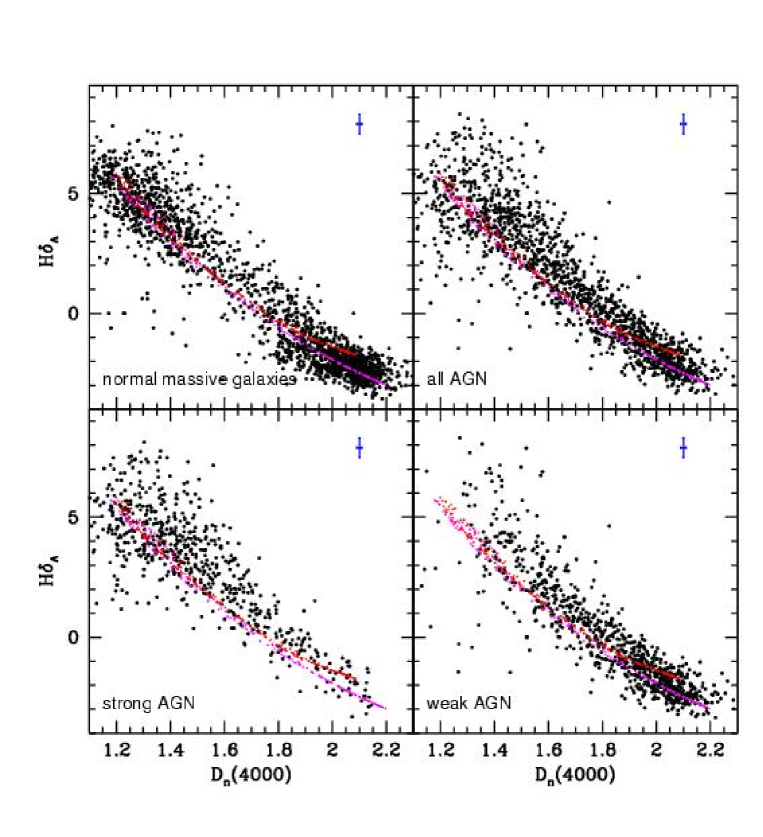

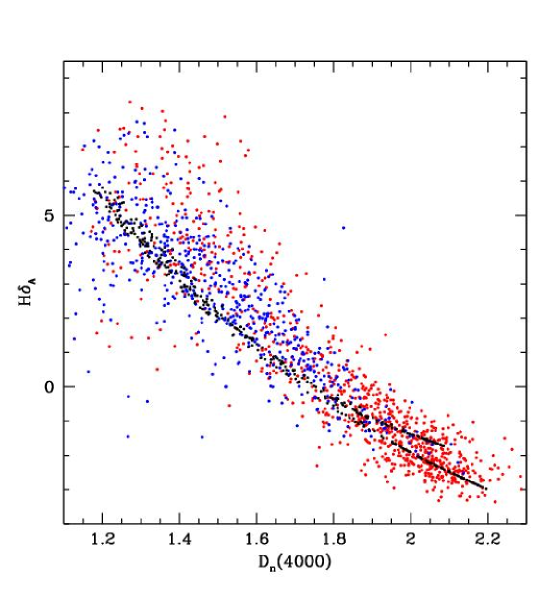
In Fig. 19, we colour-code the AGN according to , the distance from the locus of star-forming galaxies in the BPT diagram. AGN that lie close to the star-forming locus are coloured blue, while those that lie far away are coloured red. Nearly all the weak AGN with large values of have large values of Dn(4000). Most of the strong AGN with large values of have higher-than-normal values of H. This lends further credence to our hypothesis that the latter objects are post-starburst systems; they experienced a burst some time in the past and are now evolving towards the locus occupied by ordinary early-type galaxies.
4.5 Radial Distribution of the Star Formation
Most previous studies of the stellar populations of type 2 AGN hosts have focused on the nuclear regions of the host galaxies (see Heckman 2003 for a recent review). The stellar populations in the nuclei of weak AGN are predominantly old (e.g. Ho, Filippenko, & Sargent 2003), while a young stellar population is clearly present in about half of powerful type 2 Seyfert nuclei (e.g. Cid Fernandes et al. 2001; Joguet et al. 2001). We obtain qualitatively similar trends in mean stellar age as a function of AGN luminosity, but we find that there are young stars in most AGN with [OIII] luminosities greater than . One might thus speculate that there might be systematic radial gradients in the stellar populations of the host galaxies of these systems.
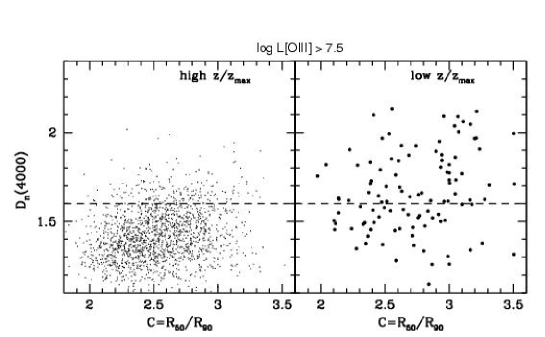
We can test this by splitting our sample into different bins in normalized distance . We then find that there are rather strong radial gradients in mean stellar age and that the youngest stars appear to be located well outside the nuclei of the host galaxies. This is illustrated in Fig. 20. We have selected AGN with [OIII] luminosities in excess of and we plot the locations of the host galaxies in the -Dn(4000) plane. The left panel shows objects with . These galaxies have redshifts in the range and the spectra sample between 40-60% of the total light. As can be seen, the vast majority of these objects have Dn(4000) values less than 1.6 and are hence younger than the typical early-type galaxy in our sample. The right panel shows objects with . These galaxies have typical redshifts of and the spectra sample the light from the inner 1-2 kpc of the host galaxy. As can be seen, more than half the galaxies now have Dn(4000). The shift in mean stellar age occurs both in late-type () and in early-type () AGN hosts. We conclude the star formation associated with AGN activity is not primarily confined to the nuclear regions of the host galaxy.
4.6 Dust
As discussed in section 3, we correct the [OIII] luminosities of the AGN in our sample for dust using the difference between the observed H/H emission line flux ratios and the case-B recombination value (2.86). We assumed an attenuation law of the form (Charlot & Fall 2000). In the top right panel of Fig. 21, we plot the average attenuation at [OIII]5007 as a function of normalized AGN luminosity. As can be seen, the correction is very small for weak AGN, but rises strongly with increasing L[OIII], and reaches 2.5-3 magnitudes for the most powerful AGN. This is as expected, since weak AGN have old stellar populations (thus, little dust), whereas strong AGN have young stellar populations (more dust). Is 3 magnitudes of extinction at [OIII] a reasonable value for the strong AGN? Dahari & De Robertis (1988) have tabulated the Balmer decrements of 64 type 2 Seyfert nuclei, and the implied mean [OIII] attenuation is 2.5 magnitudes. This is similar to what we measure through much larger physical apertures. In the left panel of Fig. 21, we plot the attenuation as a function of stellar mass for normal emission-line galaxies in our sample. The average value of the attenuation at 5007 Å for massive ( few ) star-forming galaxies is the same as that for the powerful AGN in our sample. These comparisons give us confidence that our average dust corrections are appropriate.
In the bottom panels of Fig. 21 , we plot the attenuation in AGN hosts as a function of and . There is a clear connection between star formation and extinction in AGN hosts, with younger (low Dn(4000)) and more strongly star-forming (low ) galaxies exhibiting more attenuation due to dust.

5 Comparison of Type 2 AGN and QSO Hosts
We have shown that powerful type 2 AGN reside in massive galaxies with young stellar populations. So far, we have not considered type 1 Seyfert nuclei and QSOs because their optical continuum is primarily produced by the AGN (rather than by stars).
In the simplest version of the “unified” model (Antonucci 1993), type 1 and type 2 AGN are drawn from the same parent population and differ only in our viewing angle with respect to a circumnuclear obscuring medium. In this case, the stellar contents of the two types should be the same. On the other hand, if the solid angle covered by the obscuring medium varies substantially from one system to another, then the type 2 AGN would be preferentially drawn from the more obscured systems. In this case, there could be systematic differences in stellar content between type 1 and type 2 AGN, since the covering factor of the dusty material might be related to the amount of star formation in the galaxy. There have been suggestions that this effect is present in Seyfert galaxies (e.g. Malkan, Gorjian, & Tam 1998; Maiolino et al. 1995; Oliva et al. 1999). Dunlop et al. (2001) have argued that powerful low-redshift QSOs are hosted by relatively normal old massive elliptical galaxies. This would make them fundamentally different from the hosts of powerful type 2 AGN.
In this section, we compare the stellar populations of the hosts of powerful type 1 and type 2 AGN using our present sample and a comparison sample drawn from the SDSS QSO spectroscopic survey ( Schneider et al, in preparation; see Richards et al. (2002) for details on how QSOs are selected). The stellar features in QSOs are diluted by the addition of the QSO continuum, and measurements of them are noisier. We therefore combined several hundred individual spectra in order to increase the signal-to-noise. Specifically, we selected all QSOs having 0.2 and erg s-1. These selection criteria are designed to maximize the overlap with the type 2 AGN population our sample. For each QSO, we find a type 2 AGN with a similar redshift and [OIII] luminosity. The sample comprises 449 QSOs and 449 type 2 AGN. The median [OIII] luminosity is erg s-1. 111 It is very difficult to correct the [OIII] luminosities of QSOs for extinction, because the Balmer lines are dominated by emission from the Broad Line Region. We have therefore chosen to match the type 2 AGN and QSOs in terms of their observed [OIII] line luminosities. We thus neglect any differences in extinction between the two kinds of objects. For reference, the median extinction-corrected [OIII] luminosity for the 449 type 2 AGN is erg s-1 = . These are among the most powerful AGN in our sample. The median absolute magnitude of the QSO sample is = -21.6, or about one magnitude fainter than the corresponding value for the radio-quiet QSOs studied by Dunlop et al. (2001).
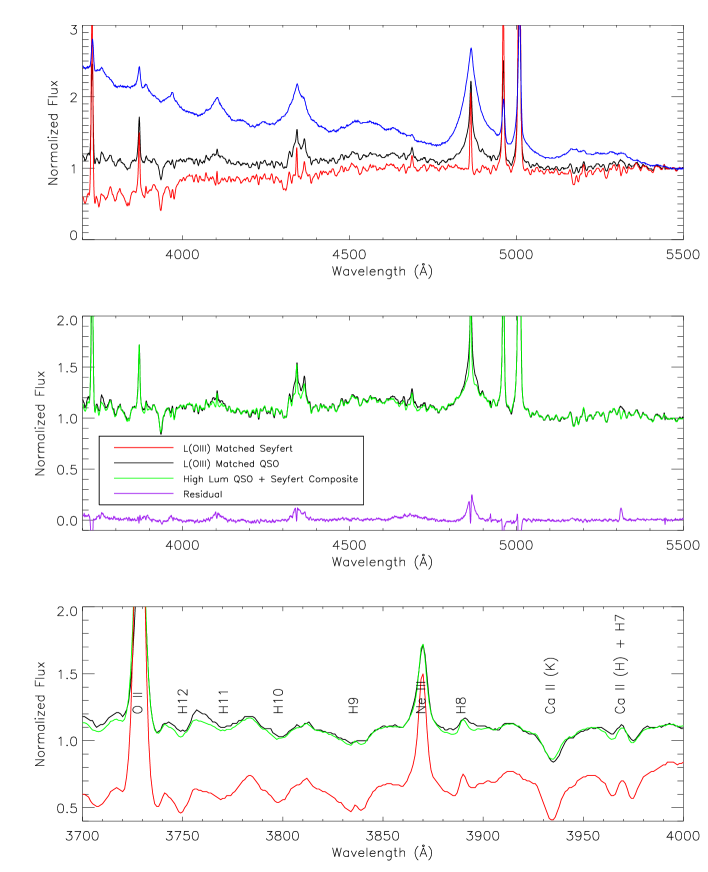
The individual flux-calibrated spectra were normalized at 5500 Å and combined with no additional weighting. The results are shown in black (QSOs) and in red (matched type 2 AGNs) in the top panel of Fig. 22. For comparison, we plot in blue the composite spectrum of 60 of the quasars in our sample with the highest continuum luminosities at 5007 Å and with . We will refer to this composite as the “pure QSO” spectrum.
As can be seen, the stellar absorption features in the matched QSO spectrum are weaker than in the type 2 AGN spectrum. This is expected, because a substantial fraction of the continuum in the matched QSO spectrum is coming from a central nuclear source rather than from stars. This is illustrated in detail in the central panel of Fig. 22, where we plot in green the linear combination of the type 2 AGN + pure QSO spectra that produces the best fit to the matched QSO spectrum. We find a very good overall fit if 30% of the continuum at 5500 Å comes from a pure QSO. The main residuals are located around the broad emission line features, which show substantial variations from one QSO to another. In the bottom panel of Fig. 22, we show a blow-up of the region of the spectrum between 3700 and 4000 Å. We have labelled the main stellar absorption line features (these include a series of high-order Balmer lines and the Calcium H+K feature). It is clear that the stellar absorption spectra are virtually identical in type 2 AGNs and in the matched QSOs.
We therefore conclude that there is no significant difference in stellar content between the host galaxies of type 2 AGNs and QSOs with the same [OIII] luminosity and redshift. This is consistent with the predictions of the unified model for AGN, and establishes that a young stellar population is associated with all types of AGN with strong [OIII] emission.
6 Discussion
Our main results on the properties of AGN host galaxies can be summarized as follows:
-
•
Stellar Masses. Type 2 AGN reside almost exclusively in massive galaxies. The fraction of galaxies with AGN declines very strongly at stellar masses below .
-
•
Structural Properties. Type 2 AGN occupy host galaxies with very similar sizes and stellar surface mass densities to normal “early-type” galaxies in our sample. The structural properties of AGN hosts depend very little on AGN power.
-
•
Mean Stellar Ages.The age distribution of type 2 AGN hosts is a strong function of [OIII] luminosity. Low luminosity AGN have old stellar populations similar to those of early-type galaxies. High luminosity AGN reside in significantly younger hosts and have Dn(4000) distributions similar to those of normal late-type () galaxies.
-
•
Starbursts. Although powerful type 2 AGN have stellar ages similar to massive late-type galaxies, a larger fraction appear to have experienced significant bursts of star formation in the past one or two Gyr.
-
•
Star Formation Outside the Nucleus The star formation in powerful AGN is not concentrated primarily in the nuclear regions of the galaxy, but is distributed over scales of at least several kpc.
-
•
Ongoing Star Formation. We interpret the parameter (defined as the distance from the locus of star-forming galaxies in the BPT diagram) as a qualitative measure of the relative amount of ongoing star formation in the galaxy. We find that type 2 AGN with small values of have lower stellar surface mass densities and concentrations. As expected, they also have more dust and younger mean stellar ages.
-
•
Ionization State. We use a position angle to characterize the ionization state of the AGN in our sample. We find that is strongly correlated with AGN luminosity. Low-luminosity AGN have low-ionization “LINER-type” emission line ratios. High-luminosity AGN have high-ionization “Seyfert-type” line ratios. There is a sharp discontinuity in the [OIII] luminosity distribution at , suggesting that AGN split into two distinct populations in the BPT diagram.
-
•
Young stars in type 1 AGN. There is no significant difference in stellar content between the host galaxies of strong type 2 AGN and QSOs with the same [OIII] luminosity and redshift.
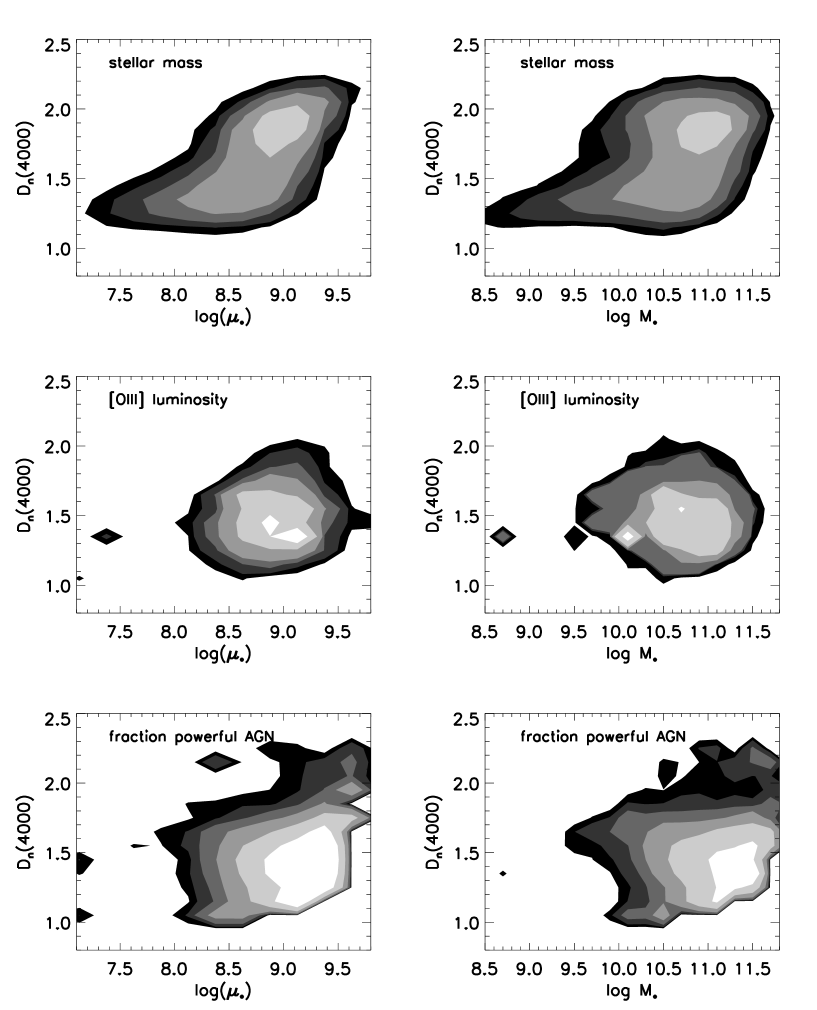
Our most striking result is that powerful AGN are found in “young bulges”, i.e. massive galaxies with stellar surface densities similar to early-type galaxies, but with young stellar populations. Ordinary galaxies with these characteristics are rare in the local Universe. We illustrate this graphically in Fig. 23. The top panels show how the the total stellar mass density in galaxies is partitioned among galaxies as a function of , and Dn(4000). The middle panels show how the total [OIII] luminosity density contributed by AGN is distributed. As can be seen, most of the [OIII] luminosity density comes from galaxies with in the range , kpc-2, and Dn(4000). However, there is rather little stellar mass located in this region of parameter space. At the current epoch, most of the stars located in massive, high surface density galaxies are old. The bottom panels show how the fraction of galaxies that host AGN with L[OIII] varies as a function of , and Dn(4000). In Fig. 5 we showed that defined in this way did not depend on redshift (and hence aperture). For galaxies with , . Fig. 23 shows that for galaxies in this mass range with a young stellar population (), the AGN fraction reaches values in excess of a third.
One interesting question is how our results fit in with other studies of active galaxies. It has often been speculated that nuclear activity and strong starbursts are both triggered by mergers or interactions between galaxies. Genzel et al (2001) and Tacconi et al (2002) have recently carried out a near-infrared spectroscopic study of a sample of ultraluminous infrared galaxies. They find that the ULIRG velocity dispersion distribution and their location on the fundamental plane closely resemble those of intermediate mass elliptical galaxies. The star formation rates in ULIRGS are typically around a hundred solar masses per year. A significant fraction of these objects host active nuclei and many are observed to be part of interacting or merging systems (e.g. Bushouse et al 2002).
Canalizo & Stockton (2001) have recently studied a sample of optically-selected QSOs that have far-infrared colours similar to those of ULIRGs. They propose that these objects are transition systems. The scenario they explore is one proposed by Sanders et al (1988), where ULIRGS and QSOs represent different phases of a single type of event. In the Sanders et al picture, the merging of two galaxies causes gas to flow towards the nuclear regions, triggering both starburst activity and the accretion of gas onto the black hole. Initially, the nuclear region of the merger remnant is shrouded in dust and the AGN is hidden from view. Later, as the galaxy sheds its dust cocoon, ionizing photons are able to escape, and extended [OIII] emission regions appear. The end-product of the merging event is a massive early-type system.
Most imaging studies of nearby type 2 AGN have shown that unlike the ULIRGs, only a minority of these objects exhibit obvious signs of an ongoing interaction or merger (e.g. de Robertis, Hayhoe & Yee 1998 and references therein). Instead, they are typically early-type galaxies with relatively normal morphologies. It is important to note that the space density of the AGN in our sample is a factor 100-1000 times greater than that of ULIRGs or of bright QSOs and it is therefore likely that only a restricted subset of these objects are analogues of bright QSOs or ULIRGs. A major merger is not the only process that could bring fuel to a central black hole. Minor mergers and bar-induced inflows are frequently cited mechanisms that might funnel some gas to the nucleus, thereby temporarily activating an otherwise normal galaxy, and at the same time triggering star formation that could contribute to building the bulge.
The connection between star formation and the AGN is clearest for the most powerful AGN in our sample (). We have found that the hosts of these strong AGN are either galaxies with considerable on-going star-formation or are post-starburst systems with ages of to years. We have extracted SDSS images of 100 nearby ( 0.1) AGN with L[OIII] and we find that the host galaxies fall into three broad categories:
-
1.
Single blue spheroidal/amorphous galaxies: These are symmetric with no close companions and no significant structure. They look like normal elliptical/S0 galaxies except that they have anomalously blue colours. In total they make up around 40% of the sample.
-
2.
Single disk galaxies: These differ from the above in that structure outside the bright core is visible (e.g. arms, bars, dust lanes). No close companions are visible. These systems make up 30% of the sample.
-
3.
Disturbed/interacting Galaxies: These have one or more close companions, and/or show obvious tidal debris. They make up % of the sample.
In Figs. 24 and 25 we present a montage of the basic types of system found in our sample of powerful AGN.
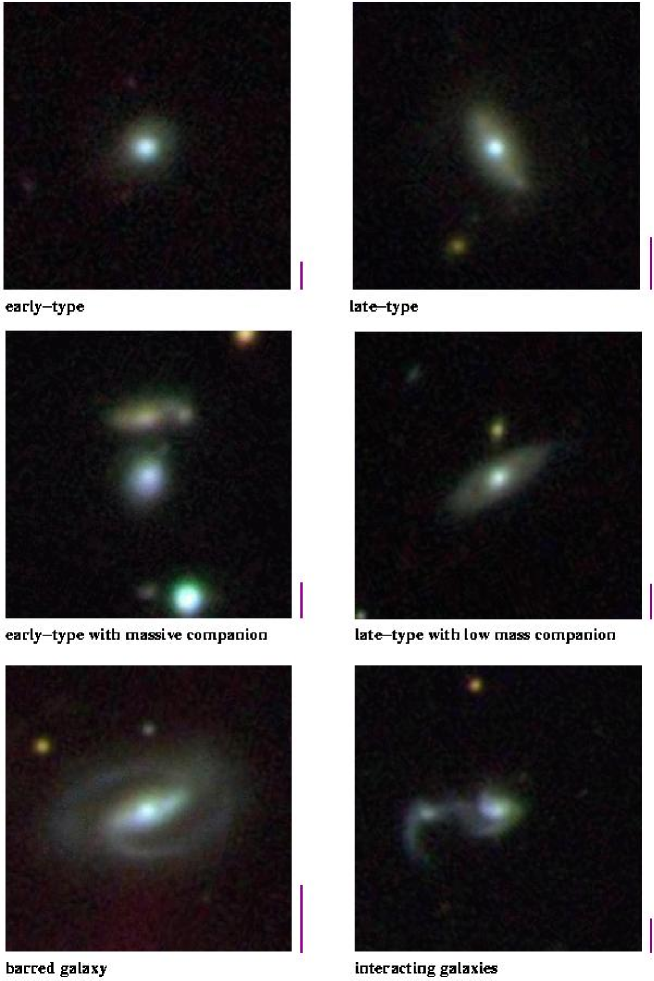
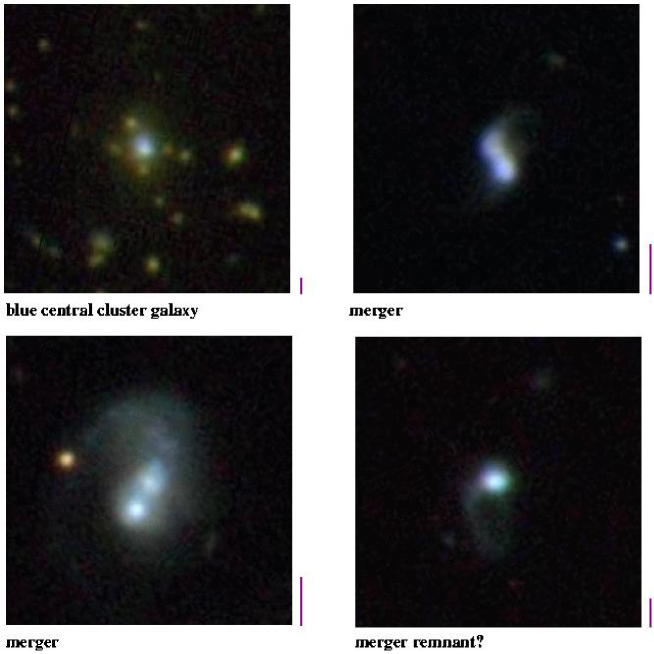
The images in Fig. 24 and 25 suggest that many different physical processes may be responsible for fuelling black holes and building bulges. If this is the case, it becomes even more of a challenge to understand why there is such a tight connection between black hole mass and bulge mass.
The presence in our sample of a substantial number of spheroidal galaxies with apparently normal structure but young stellar populations suggests that powerful Type 2 AGN, like quasars, may be a late stage of an merger/starburst. In section 4.5 we found that many powerful type 2 AGN have radial gradients in their stellar populations, with the stars near the nucleus exhibiting larger 4000 Å break strengths than the stars a few kiloparsecs away. This can be explained if the mass fraction of stars formed in the burst increases as a function of radius. It would then take substantially longer for the 4000 Å break to revert back to values characteristic of normal ellipticals in the main bodies of galaxies than in their nuclei. Begelman (1985) has proposed that x-rays from the active galactic nucleus can produce runaway heating of the ISM and result in central “holes” in the distribution of cold gas in active galaxies. The AGN itself could thus regulate the amount of star formation that occurs at the centres of galaxies.
Quite apart from any specific scenario, our principal result has an appealingly simple interpretation. The two necessary ingredients for a powerful AGN are a massive black hole and an abundant fuel supply. Only massive early-type galaxies contain massive black holes, and only galaxies with significant amounts of recent/on-going star-formation have the requisite fuel supply. This combination is rare today, but evidently was not so at high redshift.
Further clues to the connection between type 2 AGN, QSOs, ULIRGs and radio galaxies
will come from direct
cross-correlation of our sample with infrared and radio surveys such as IRAS and FIRST
(e.g. Ivezić et al. 2002). In addition, the SDSS offers
unprecedented opportunities for a detailed comparison of the environments of AGN with those
of normal galaxies. Our analysis has demonstrated a clear link between
type 2 AGN and the formation or evolution of
massive early-type galaxies. The challenge is now to understand this connection in more detail.
S.C. thanks the Alexander von Humboldt Foundation, the Federal Ministry of Education and Research, and the Programme for Investment in the Future (ZIP) of the German Government for their support.
Funding for the creation and distribution of the SDSS Archive has been provided by the Alfred P. Sloan Foundation, the Participating Institutions, the National Aeronautics and Space Administration, the National Science Foundation, the U.S. Department of Energy, the Japanese Monbukagakusho, and the Max Planck Society. The SDSS Web site is http://www.sdss.org/.
The SDSS is managed by the Astrophysical Research Consortium (ARC) for the
Participating Institutions. The Participating Institutions are The University
of Chicago, Fermilab, the Institute for Advanced Study, the Japan Participation
Group, The Johns Hopkins University, Los Alamos National Laboratory, the
Max-Planck-Institute for Astronomy (MPIA), the Max-Planck-Institute for
Astrophysics (MPA), New Mexico State University, University of Pittsburgh,
Princeton University, the United States Naval Observatory, and the University
of Washington.
References
Adams, T.F., 1977, ApJS, 33, 19
Antonucci, R. 1993, ARA&A, 31, 473
Bahcall, J.N., Kirhakos, S., Saxe, D.H., Schneider, D.P., 1997, ApJ, 479, 624
Balogh, M.L., Morris, S., Yee, H., Carlberg, R., & Ellingson, E. 1999, ApJ, 527, 54
Baldwin, J., Phillips, M., & Terlevich, R. 1981, PASP, 93, 5
Begelman, M., 1985, ApJ, 297, 492
Blanton, M.R., Lupton, R.H., Maley, F.M., Young, N., Zehavi, I., Loveday, J. 2003, AJ, in press (astro-ph/0105535)
Bruzual, G., & Charlot, S. 2003, MNRAS, submitted
Canalizo, G., Stockton, A., 2001, ApJ, 555, 719
Charlot, S., Fall, 2000, ApJ, 539, 718
Charlot, S., Longhetti, M., 2001, MNRAS,323,887
Cid Fernandes, R., Heckman, T., Schmitt, H., González Delgado, R., Storchi-Bergmann, T. 2001, ApJ, 558, 81
Croom, S.M., et al, 2002, MNRAS, 335, 459
Dahari, O., De Robertis, M.M., 1988, ApJ, 331, 727
De Grijp, M.H.K., Keel, W.C., Miley, G.K., Goudfrooij, P., Lub, J., 1992, A&AS, 96, 389
De Robertis, M.M., Hayhoe, K., Yee, H.K.C., 1998, ApJS, 115, 163
Dunlop, J., McLure, R., Kukula, M., Baum, S., O’Dea, C., & Hughes, D. 2001, astro-ph/0108397
Ferrarese, L., Merritt, D. 2000, ApJ, 539, L9
Fukugita, M., Ichikawa, T., Gunn, J.E., Doi, M., Shimasaku, K., Schneider, D.P. 1996, AJ, 111, 1748
Gebhardt, K., Bender, R., Bower, G., Dressler, A., Faber, S., Filippenko, A., Green, R., Grillmair, C., Ho, L., Kormendy, J., Lauer, T., Magorrian, J., Pinkney, J., Richstone, D., Tremaine, S. 2000, ApJ, 539, L13
Genzel, R., Tacconi, L.J., Rigopoulou, D., Lutz, D., Tecza, M., 2001, ApJ, 563, 527
González Delgado, R., Heckman, T., Leitherer, C. 2001, ApJ, 546, 845
Gunn, J., Carr, M., Rockosi, C., Sekiguchi, M., Berry, K., Elms, B., de Haas, E., Ivezić, Z. et al. 1998, ApJ, 116, 3040
Haehnelt, M.G., Natarajan, P., Rees, M.J., 1998, MNRAS, 300, 817
Heckman, T.M., 1978, PASP, 90, 241
Heckman, T.M. 1980a, A&A , 87, 142
Heckman, T.M. 1980b, A&A , 87, 152
Heckman, T.M., 2003, Proceedings of the Carnegie Symposium on the Co-Evolution of Black Holes and Galaxies, ed Ho, L.
Ho, L.C., Filippenko, A.V., Sargent, W.L.W., 1993, ApJ, 417, 63
Ho, L.C. Filippenko, A.V., Sargent, W.L.W., 1995, ApJS, 98, 477
Ho, L.C., Filippenko, A.V., Sargent, W.L.W., 1997, ApJS, 112, 315
Ho, L.C., Filippenko, A.V., Sargent, W.L.W., 2003, ApJ, 583, 159
Hogg, D., Finkbeiner, D., Schlegel, D., & Gunn, J. 2001, AJ, 122, 2129
Huchra, J., Burg, R., 1992, ApJ, 393, 90
Ivezić, Z., Menou, K., Knapp, G.R., Strauss, M.A., Lupton, R.H., Vandenberk, D.E., Richards, G.T., Tremonti, C. et al, 2002, AJ, 124, 2364
Joguet, B., Kunth, D., Melnick, J., Terlevich, R., & Terlevich, E. 2001, A&A, 380, 19
Kauffmann, G., Haehnelt, M.G., 2000, MNRAS, 311, 576
Kauffmann, G., Heckman, T., White, S., Charlot, S., Tremonti, C., Brinchmann, J., Bruzual, G., Peng, E., Seibert, M. et al. 2003a, MNRAS, in press (astro-ph/0204055, Paper I)
Kauffmann, G., Heckman, T., White, S., Charlot, S., Tremonti, C., Peng, E., Seibert, M., Brinkmann, J., et al. 2003b, MNRAS, in press (astro-ph/0205070, Paper II)
Kewley, L., Dopita, M., Sutherland, R., Heisler, C., Trevena, J. 2001, ApJ, 556, 121
Koski, A. 1978, ApJ, 223, 56
Kotilainen, J.K., Ward, M.J., 1994, MNRAS, 266, 953
Kraemer, S.B., Ho, L.C., Crenshaw, D., Shields, J.C., Filippenko, A.V., 1999, ApJ, 520,564
Ledlow, M.J., Owen, F.N., 1996, AJ, 112, 9
Lynden-Bell, D., 1969, Nature, 223, 690
Maiolino, R., Ruiz, M., Rieke, G., & Keller, L. 1995, ApJ, 446, 561
Malkan, M., Gorjian, V., Tam, R. 1998, ApJS, 117, 25
McLure, R.J., Kukula, M.J., Dunlop, J.S., Baum, S.A., O’Dea, C.P., Hughes, D.H., 1999, MNRAS, 308, 377
McLure, R.J., Dunlop, J.S., Kukula, M.J., 2000, MNRAS, 318, 693
Monaco, P., Salucci, P., Danese, L., 2000, MNRAS, 311, 279
Nelson, C.H., Whittle, M., 1996, ApJ, 465, 96
Nolan, L.A., Dunlop, J.S., Kukula, M.J., Hughes, D.H., Boroson, T., Jiminez, R., 2001, MNRAS, 323, 308
Oliva, E., Origlia, L. Maiolino, R., & Moorwood, A. 1999, A&A , 350, 9
Osterbrock, D.E., 1989, “Astrophysics of gaseous nebulae and active galactic nuclei”
Percival, W.J., Miller, L., McLure, R.J., Dunlop, J.S., 2001, MNRAS, 322, 843
Pier, J.R., Munn, J.A., Hindsley, R.B., Hennessy, G.S., Kent, S.M., Lupton, R.H., Ivezić, Z., 2003, AJ, 125, 1559
Richards, G., Fan, X., Newberg, H., Strauss, M., Vanden Berk, D., Schneider, D., Yanny, B. et al. 2002, AJ, 123, 2945
Richstone, D., Ajhar, E.A., Bender, R., Bower, G., Dressler, A., Faber, S.M., Filippenko, A.V., Gebhardt, K., Green, R., Ho, L.C., et al., 1998, Nature, 395, 14
Sanders, D.B., Soifer, B.T., Elias, J.H., Madore, B.F., Matthews, K., Neugebauer, G., Scoville, N.Z., 1988, ApJ, 325, 74
Schmitt, H.R., Storchi-Bermann, T., Fernandes, R.C., 1999, MNRAS, 303, 173
Smith, J.A., et al 2002, AJ, 123, 2121
Stoughton, C., Lupton, R., Bernardi, M., Blanton, M., Burles, S., Castander, F., Connolly, A., Eisenstein, D. et al. 2002, AJ, 123, 485
Strateva, I., Ivezić, Z., Knapp, G., Narayanan, V., Strauss, M., Gunn, J., Lupton, R., Schlegel, D. et al. 2001, AJ, 122, 1104
Strauss, M. Weinberg, D., Lupton, R., Narayanan, V., Annis, J.,Bernardi, M., Blanton, M., Burles, S. et al. 2002, AJ, 124, 1810
Tacconi, L.J., Genzel, R., Lutz, D., Rigopoulou, D., Baker, A.J., Iserlohe, C., Tecza, M., 2002, ApJ, 580, 73
Ulvestad, J.S., Ho, L.C., 2002, ApJ, 581, 925
Vanden Berk, D.E., Richards, G.Y., Bauer, A., Strauss, M.A., Schneider, D.P., Heckman, T.M., York, D.G., Hall, P.B. et al, 2001, AJ, 122, 549
Veilleux, S., Osterbrock, D. 1987, ApJS, 63, 295
Worthey, G., Ottaviani, D.L. 1997, ApJS, 111, 377
York, D.G. et al. 2000, AJ, 120, 1579