The mm-wave compact component of AGN
Abstract
mm-wave emission from Active Galactic Nuclei (AGN) may hold the key to understanding the physical origin of their radio cores. The correlation between radio/mm and X-ray luminosity may suggest a similar physical origin of the two sources. Since synchrotron self absorption decreases with frequency, mm-waves probe smaller length scales than cm-waves. We report on 100 GHz (3 mm) observations with CARMA of 26 AGNs selected from the hard X-ray Swift/BAT survey. 20/26 targets were detected at 100 GHz down to the 1 mJy (3) sensitivity, which corresponds to optically thick synchrotron source sizes of pc. Most sources show a 100 GHz flux excess with respect to the spectral slope extrapolated from low frequencies. This mm spectral component likely originates from smaller scales than the few-GHz emission. The measured mm sources lie roughly around the (100 GHz) (2–10 keV) relation, similar to a few previously published X-ray selected sources, and hinting perhaps at a common coronal origin.
keywords:
Galaxies: active – Galaxies: nuclei – galaxies: jets – radio continuum: galaxies – X-rays: galaxies1 Introduction
Radio loud (RL) active galactic nuclei (AGN) are known for their relativistic jets that often extend beyond the nucleus. Radio emission from Radio Quiet (RQ) AGN (as defined by Kellermann et al., 1989) is lower by several orders of magnitude than that of RL AGN. RQ AGN show, on average, smaller radio structures some of which are often unresolved down to parsec scales (Blundell et al., 1996; Blundell & Beasley, 1998; Ulvestad & Ho, 2001; Lal et al., 2004; Nagar et al., 1999, 2002; Anderson et al., 2004; Ulvestad et al., 2005; Singh et al., 2013; Kharb et al., 2015), and only sub-relativistic velocities (Middelberg et al., 2004; Ulvestad et al., 2005). The physical origin of the radio emission in RQ AGN, whether a downscaled version of the RL, collimated jets (Barvainis et al., 1996; Gallimore et al., 2006), or coronal emission from magnetic activity above the accretion disk (Field & Rogers, 1993), remains to be resolved. In some sources, a combination of several spectral components may be present around the nucleus (Barvainis et al., 1996; Gallimore et al., 2004; Giroletti & Panessa, 2009; Panessa & Giroletti, 2013; Smith et al., 2016). For the sake of clarity of discussion, we distinguish emission from a jet that is well-collimated (and likely relativistic), from coronal emission that arises from hot (K) gas, but could have an outflow that is not well-collimated (nor relativistic).
A connection between the radio and X-ray emission in RQ AGN is suggested by the correlation of the radio luminosity at 5 GHz and the X-ray luminosity (Brinkmann et al., 2000; Salvato et al., 2004; Wang et al., 2006; Panessa et al., 2007; Panessa & Giroletti, 2013). On scales of a few mas (sub-pc) in nearby Seyferts, the core radio to X-ray correlation is not obvious (Panessa & Giroletti, 2013), although the high-resolution studies still suffer from low-number statistics. Laor & Behar (2008) used the PG quasar sample (Schmidt & Green, 1983) to demonstrate that at 5 GHz) and (0.2–20 keV) are correlated over a large range of AGN luminosity, with a scatter of about an order of magnitude. More importantly, the correlation follows the well established relation for coronally active cool stars (Güdel & Benz, 1993). This suggests that radio emission from RQ AGN may be due to magnetic coronal activity, akin to that of stellar coronae. The relation in cool-stars is accepted as a manifestation of coronal heating by electrons energized by magnetic reconnection, which subsequently gives rise to X-ray emission. Thus, the correlation presented in Laor & Behar (2008) over 20 orders of magnitude in luminosity raises the possibility that radio emission in RQ AGN may also be related to coronal, magnetic activity. Theoretical study of the magnetic dynamos in these vastly different systems suggests a common mechanism could be at work (Blackman & Field, 2000).
There are, however, profound phenomenological differences between X-ray and radio emission of stellar coronae and those of AGN. X-ray spectra of stellar coronae are thermal with K (Catura et al., 1975), while the non-thermal (Comptonized) spectra of AGN imply K (Shapiro et al., 1976; Lightman et al., 1978). Moreover, while X-rays from AGN vary dramatically over short time scales (Tananbaum et al., 1978), the variability at 5 and at 8.5 GHz is much slower and smaller in amplitude (e.g., Anderson & Ulvestad, 2005). On the other hand, if radio emission from RQ AGN is due to self absorbed synchrotron, and since absorption decreases with frequency, higher frequencies would originate from smaller core regions and vary more. The decreasing size with frequency, of an optically thick self-absorbed synchrotron source, can be written as:
| (1) |
where is the size in pc, is the observed frequency in GHz, erg s-1, and is the magnetic field in Gauss (Laor & Behar, 2008).
As opposed to 5 and 8.5 GHz, higher frequency observations of RQ AGN are scarce. Barvainis et al. (1996) observed RQ AGN up to 15 GHz. About half of the RQ AGN in that sample appeared to have flat or inverted spectral components, and a hint of variability, suggesting opaque synchrotron emission from the nucleus. Park et al. (2013) reach similar conclusions based on observations at 22 and 45 GHz. Above 300 GHz (sub-mm, FIR) there is a steep rise of the spectrum due to the low frequency tail of thermal dust emission from the host galaxy (Barvainis et al., 1992; Hughes et al., 1993), whose tail around 100 GHz is typically negligible even in low-luminosity AGN (Doi et al., 2011; Wu et al., 2018), let alone in strong X-ray emitters (Doi & Inoue, 2016).
The waveband between 30–300 GHz, crudely referred to here as the mm waveband, has remained largely unexplored. Notable exceptions are Field & Rogers (1993) and Di Matteo et al. (1997), who addressed the inevitable cyclotron or synchrotron emission from the magnetically confined thermal and non-thermal electrons, but did not specifically ascribe the radio emission of RQ AGN to coronal activity. In the past few years, there have been increased efforts to study the mm-band of RQ AGNs. Doi et al. (2005, 2011) observed a sample of low luminosity AGN and early type galaxies, both RQ and RL, some of which showed a flat or even inverted spectrum at high frequencies, indicating genuine optically thick core emission. For studying the coronal conjecture, however, it is beneficial to select X-ray active (and highly variable) RQ AGN, where the X-ray emission is ascribed to a compact corona.
In an exploratory program with the CARMA and ATCA telescopes, 95 GHz continuum emission was detected from eight X-ray selected RQ AGN at the few mJy level (Behar et al., 2015). For the most part, the 95 GHz flux density exceeded that expected from interpolating the low-frequency steep slope by up to a factor of . This was called the high-frequency excess. It was interpreted as evidence for a compact, optically thick core that is superimposed on (at the few arcsecond resolution of CARMA and ATCA) the steep spectrum of more extended structures that dominate at lower frequencies. The size of the 95 GHz sources were estimated from Eq. 1 (assuming for simplicity G) to be of less than a light day, and between 10 and 1000 gravitational radii, which is comparable to the X-ray source. That work also found the sources to closely follow (95 GHz) (2–10 keV), reminiscent of the ratio at 5 GHz.
A high-frequency excess at 115 GHz was observed in the lenticular galaxy, likely hosting a low-luminosity AGN, NGC 1277 (Scharwächter et al., 2016). A high-frequency excess was also noted in the Seyfert galaxy NGC 985 by Doi & Inoue (2016), who found that the steep spectrum turns over and becomes inverted around 10 GHz. These authors discussed several physical models that could produce the observed excess, most of which were ruled out, e.g., dust emission, free-free emission from the corona or from the broad-line region, and thermal synchrotron from an accretion flow. They conclude that a jet would need to be free-free absorbed, and that self-absorbed synchrotron from the corona is also possible. An interesting emission excess at 500 m (600 GHz), which is correlated with hard X-ray luminosity, was reported by Shimizu et al. (2016) for Swift/BAT AGN with respect to normal star forming galaxies. This excess suggests that the AGN emission is still significant into the FIR. Theoretical works (Inoue & Doi, 2014; Raginski & Laor, 2016) further highlight the potential of mm observations for detecting coronal magnetic activity on AGN accretion disks.
Baldi et al. (2015) found that the nearby Seyfert NGC 7469 varies at 95 GHz (confidence level 99.98%) on a time scale of days, while being apparently steady for years at 5 GHz (Pérez-Torres et al., 2009). ALMA observations of NGC 7469 indicate that the high-frequency excess remains up to GHz, and that it originates from a bright core at sub-arcsec scales (Izumi et al., 2015). To date, the daily variability, which is also observed in X-rays, still provides the most stringent constraints on the unresolved core sizes.
In this work, we report on 100 GHz CARMA (the Combined Array for Research in Millimeter-wave Astronomy) observations of Swift/BAT AGN. Smith et al. (2016) observed 65 Swift/BAT AGN with the JVLA at 22 GHz and detected 62 of them. All sources were found there to have bright cores of less than 1″, and about half also had extended structures. The goal here is to measure 100 GHz continuum luminosities, to calculate the implied source sizes, and to study the relation to the well measured Swift/BAT hard X-ray luminosities. The remainder of the paper is organized as follows: In Sec. 2 we describe the sample and data reduction. In Sec. 3 we present the 100 GHz source fluxes and their relation to those at lower frequencies and to the X-rays. The conclusions and outlook are given in Sec. 4.
2 Sample and Observations
The Burst Alert Telescope (BAT) on board Swift observes all AGN (types 1 and 2), but the most Compton thick ones, between 14–195 keV. The current sample is drawn from the 70-month Swift/BAT AGN survey (Baumgartner et al., 2013). It therefore selects high hard-X-ray-flux AGN with moderately high black-hole masses () and accretion rates (), See Koss et al. (2011); Koss et al. (2017) for more details. These sources presumably all have an active accretion disk and an X-ray corona. The present sub-sample was selected to include the luminous X-ray sources ( in erg s-1), which were further selected to have a bright CO J = 3 – 2 line (Koss et al., in preparation), so that CARMA can measure their CO J = 1 – 0 line at 115.271 GHz (to be reported separately).
No further down-selection was applied based on radio loudness, but the vast majority of the sources are RQ. A complete survey of the radio loudness of Swift/BAT AGN, unfortunately, does not exist (but see Wong et al., 2016). Using the NED database111The NASA/IPAC Extragalactic Database (NED) operated by the Jet Propulsion Laboratory, California Institute of Technology., we find three sources that seem to be highly RL: 2MASX J0759+2323, MCG –01-40-001, and NGC 5106, and a few others that are moderately RL (e.g., NGC 2110). As shown below, this property is generally not borne out by their mm to X-ray luminosity ratios, which motivates us at this point to retain all sources, and to treat them on an equal footing regardless of radio loudness. The observation log is given in Table 1. Source names and Seyfert types are taken from the Swift/BAT 70-month survey.
| Object | Seyfert | CARMA | |
|---|---|---|---|
| (1) | type | obs. date | |
| 2MASX J0444+2813 | 0.0114 | 2 | 2013-10-16 |
| 2MASX J0759+2323 | 0.0292 | 2 | 2013-11-08 |
| 2MASX J1937-0613 | 0.0103 | 1.5 | 2013-10-16 |
| MCG –01-40-001 | 0.0227 | 2 | 2013-11-09 |
| MCG +04-48-002 | 0.0139 | 2 | 2013-10-14 |
| MCG +08-11-011 | 0.0205 | 1.5 | 2012-12-12 |
| Mrk 79 | 0.0223 | 1.2 | 2013-10-12 |
| Mrk 520 | 0.0266 | 1.9 | 2013-10-16 |
| Mrk 618 | 0.0355 | 1 | 2012-12-09 |
| Mrk 732 | 0.0292 | 1.5 | 2012-12-11 |
| Mrk 739 | 0.0299 | 1 | 2013-10-27 |
| Mrk 1210 | 0.0135 | 2 | 2013-11-09 |
| NGC 2110 | 0.0078 | 2 | 2013-10-12 |
| NGC 2992 | 0.0077 | 2 | 2013-11-13 |
| NGC 3516 | 0.0088 | 1.5 | 2013-01-05 |
| NGC 3786 | 0.0089 | 1.8 | 2013-11-16 |
| NGC 4388 | 0.0084 | 2 | 2013-01-06 |
| NGC 4593 | 0.0090 | 1 | 2013-11-18 |
| NGC 5106 | 0.0319 | LINER | 2013-01-06 |
| NGC 5290 | 0.0086 | 2 | 2013-10-21 |
| NGC 5506 | 0.0062 | 1 | 2013-01-02 |
| NGC 5610 | 0.0169 | 2 | 2013-10-26 |
| NGC 5728 | 0.0093 | 2 | 2014-04-20 |
| NGC 5995 | 0.0252 | 2 | 2012-12-30 |
| NGC 7679 | 0.0171 | 2 | 2013-10-18 |
| UGC 07064 | 0.0250 | 1 | 2012-12-23 |
NOTE - (1) Name, redshift, and Seyfert type as in the Swift/BAT 58-month survey https://swift.gsfc.nasa.gov/results/bs58mon/ .
CARMA, now decommissioned, was a 15 element interferometer consisting of nine 6.1 m antennas and six 10.4 m antennas, located in California (USA). The CARMA observations were performed in the C-array configuration, providing an angular resolution of at 100 GHz. This beam corresponds in the present low- (median 0.016) sample to a physical size of less than a kpc (median of 350 pc).
The MIRIAD software package (Sault et al., 1995) was used for reduction of the visibility data, including flagging data affected by shadowed antennas, poor weather or antenna malfunctions. After obtaining the phase and amplitude solution, we apply them to the target source using standard procedures. Eventually, we invert and clean with natural weight the visibility data to obtain the map. The MIRIAD imstat task is used to measure the source point-source peak flux density, and its uncertainty.
Owing to the broad band observed, we are able to produce separate maps at GHz and at GHz. We use here mostly the lower sideband, which has slightly better signal to noise ratio (S/N). For a few sources, we are able to obtain the spectral slope between the two sidebands.
3 RESULTS
The sources are generally unresolved. The average (and median) synthesized beam FWHM (Full Width Half Maximum) is with a standard deviation (std) of . We convolve the maps to 2″and 6″resolution to compensate for varying atmospheric seeing, and to get an idea of extended AGN emission, but find that the flux increases by only 9% and 32%, respectively, by median. Gaussian fits with the imfit task also produce very similar results. The median peak Gaussian flux is 2.2 mJy compared to 2.1 mJy for a point source (imstat), and the median de-convolved Gaussian FWHM is , also consistent with the aforementioned synthesized beams. All evidence points to mostly unresolved cores, although there is a hint to some extended emission, as the total integrated Gaussian fits yield on average 50% higher flux density than their peaks. NGC 2110, which is known to have an extended radio jet (Ulvestad & Wilson, 1989) has a Gaussian integrated flux of 17.8 mJy, as compared to 10.8 mJy peak flux, and 13 mJy in the 2″extraction, but it is the RL exception in this sample, rather than the rule.
3.1 100 GHz flux densities
Out of the 26 AGNs observed, 18 were detected at 100 GHz, and upper limits of about 1 mJy (3) were obtained for the remaining 8. Most of the sources have flux densities below 10 mJy, with the median being 2.1 mJy. The highest flux of 24.1 mJy is measured for NGC 5106, which is the (only) LINER in the sample (Table 1), and will be discussed in more detail in Sec. 3.
Since we are seeking emission from regions much smaller than the 1″resolution, we list the point-source peak flux densities in Table 2, but note that those are very similar to the convolved 2″and Gaussian fitted peak values, as described above. We also include the 1 rms (root mean square) uncertainty that was measured away from the source in each map. The average (and median) rms is 0.3 mJy with a std of 0.1 mJy. We further estimate a systematic flux uncertainty that needs to be added to the statistical rms.
| Object | Spectral slope | Excess | ) | |||||
|---|---|---|---|---|---|---|---|---|
| (mJy) | (erg s-1) | (pc) | (mJy) | (erg s-1) | ||||
| (1) | (2) | (3) | (4) | (5) | (6) | (7) | (8) | |
| 2MASX J0444+2813 | 2.12 0.37 | 38.770.10 | 0.132 | 3.0 | 3.5 | 43.18 | –3.92 | |
| 2MASX J0759+2323 | — | — | — | 43.83 | ||||
| 2MASX J1937-0613 | 1.52 0.36 | 38.550.13 | 0.102 | 5.16 | 0.90 | 42.74 | –3.67 | |
| MCG –01-40-001 | 3.98 0.49 | 39.630.09 | 0.361 | — | 0.42 | 43.58 | –3.48 | |
| MCG +04-48-002 | 0.44 | 43.53 | ||||||
| MCG +08-11-011 | 7.53 0.19 | 39.820.07 | 0.448 | — | 13 (22) | 44.16 | –3.91 | |
| Mrk 79 | 1.54 0.21 | 39.220.09 | 0.221 | 1.45 | 2.7 (4.2) | 43.72 | –4.04 | |
| Mrk 520 | 1.36 0.26 | 39.320.11 | 0.255 | — | 38 (12) | 43.69 | –3.91 | |
| Mrk 618 | — | 43.72 | ||||||
| Mrk 732 | 1.99 0.22 | 39.540.08 | 0.329 | — | 0.51 | 43.39 | –3.37 | |
| Mrk 739 | 0.31 | 43.43 | ||||||
| Mrk 1210 | 3.85 0.28 | 39.190.07 | 0.216 | — | 0.50 | 43.35 | –3.68 | |
| NGC 2110 | 9.97 0.35 | 39.120.07 | 0.196 | 42.17 | 0.4 (0.6) | 43.63 | –4.05 | |
| NGC 2992 | 5.14 0.41 | 38.830.07 | 0.139 | 12.49 | 1.6 | 42.55 | –3.19 | |
| NGC 3516 | 1.84 0.29 | 38.500.10 | 0.095 | 3.70 | 1.1 | 43.31 | –4.33 | |
| NGC 3786 | 0.72 | 42.50 | ||||||
| NGC 4388 | 3.58 0.34 | 38.740.08 | 0.127 | 3.26 | 2.5 | 43.64 | –4.43 | |
| NGC 4593 | — | 43.20 | ||||||
| NGC 5106 | 24.1 0.39 | 40.700.07 | 1.253 | — | 1.5 | 43.54 | –2.37 | |
| NGC 5290 | 1.42 0.35 | 38.370.13 | 0.082 | 6.66 | 0.6 (0.1) | 42.50 | –3.60 | |
| NGC 5506 | 14.2 0.33 | 39.080.07 | 0.185 | 48.5 | 1.9 | 43.31 | –3.75 | |
| NGC 5610 | 1.05 0.32 | 38.820.15 | 0.141 | — | 1.24 | 43.09 | –3.77 | |
| NGC 5728 | 1.61 0.50 | 38.500.16 | 0.096 | 4.08 | 0.85 | 43.23 | –4.25 | |
| NGC 5995 | 1.06 0.20 | 39.150.11 | 0.207 | — | 14 | 43.80 | –4.20 | |
| NGC 7679 | 0.46 | 43.00 | ||||||
| UGC 07064 | 0.61 | 43.28 |
NOTE - (1) Present CARMA measurement, with 1 rms uncertainties. Upper limits are 3. (2) at 100 GHz; uncertainties include 15% systematics. (3) from Eq. 1 (with G) in mpc. (4) Core 22 GHz flux density, mostly from Smith et al. (2016). (5) Spectral index () based on archival data up to 22 GHz, as available, slope in parenthesis refers to measurements with large beams. (6) Ratio of observed 100 GHz flux density to that expected from extrapolating the low-frequency slope; parentheses refer to corresponding slope for larger beam size. (7) Swift/BAT X-ray luminosity in 14–195 keV band. (8) as obtained from Eq. 2.
The consequent mm-wave luminosities at 100 GHz, are listed in the table, using the luminosity distances of the sources. In the table we also list from Eq. 1 in units of pc (mpc). These values can be associated with uncertainty, and they represent the actual physical source size if it is truly an optically thick synchrotron source. For this estimate we use G. In equipartition of the magnetic field with the AGN photon field, the magnetic fields will be 1 –2 orders of magnitude larger (See Eq. 21 in Laor & Behar, 2008). However, the dependence (Eq. 1) makes fairly insensitive to ,f and adopting equipartition values would only slightly increase its estimates. It can be seen in Table 2 that all sources are of the order of mpc or less, implying light crossing times (and perhaps variability) of less than 1 day. These size estimates, which totally depend on the assumption of synchrotron self-absorption, indicate cores that are six orders of magnitude smaller than the CARMA beam size ( pc).
In the fifth column of Table 2 we list the 22 GHz core flux density for 15 sources, out of the present sample, although 4 of those were undetected at 100 GHz. Most of the 22 GHz fluxes were measured with the JVLA in the B- () or C- () array configuration by Smith et al. (2016), and a few will be published soon. The beam size of these observations is not much smaller than the present one at 100 GHz, which makes the comparison between the two meaningful. The flux density of most sources declines between 22 GHz and 100 GHz, but three sources feature a rather flat or even inverted () spectrum between 22 and 100 GHz (2MASX J0444+2813, NGC 4388, and Mrk 79). NGC 5506 was observed in 2003 at 22 GHz at a high resolution of by Tarchi et al. (2011), who measured a core flux of 22 mJy, about half the current value. We suspect this is due to the 10 times smaller beam, but variability over 13 years can not be ruled out.
3.2 Emergence of a new spectral component
Assuming a power-law flux density spectrum , and using all available archival JVLA measurements up to 22 GHz, we were able to measure the spectral slope for all of the sources, except 2MASX J0759+2323 that has only one frequency measured. The resulting slopes are listed in column (5) of Table 2. We use preferably A-array fluxes, but when larger beams are available we list the resulting slopes in parenthesis. The two slopes are always consistent with each other within the (quoted) uncertainties. The following column (6) in Table 2 lists the high-frequency excess of the current CARMA measured 100 GHz flux density, with respect to the extrapolation of the low-frequency power-law slope. Excess values in parenthesis correspond to the slopes in parenthesis.
We find that out of the 25 measured slopes, 12 detected sources (out of 18) show a high-frequency excess at 100 GHz, and 6 (out of the 7) upper limits are consistent with such an excess. Most sources have a 100 GHz excess of a factor few over the extrapolated slope, similar to the results in Behar et al. (2015), and indicating a strong mm spectral component. The illuminating example of NGC 2992 is shown in Fig. 1. Its steep slope up to 16 GHz turns over around the 22 GHz measurement and the 100 GHz flux density is above the extrapolated low-frequency slope by a factor of 6, and still by 1.6 if the 22 GHz data point is included in the slope fitting. Mrk 520 and NGC 5995 stand out with excess values of 38 and 14, respectively. These two sources are Seyfert 2’s, and their high excess values are a result of their steep slopes of (see Table 2).
Mrk 739 needs to be treated carefully, as it includes a binary AGN, separated by (Koss et al., 2011). Both west (W) and east (E) nuclei are resolved with the JVLA and have steep spectral slopes of ; Mrk 739W has a bright radio nucleus, and is slightly extended, which led Koss et al. (2011) to associate it with starburst. On the other hand, both nuclei are X-ray sources; Mrk 739W has a hard obscured X-ray spectrum and varies within hours. Both AGNs are faint at higher frequencies. At 22 GHz, Mrk 739E is detected at 0.31 mJy while Mrk 739W is not, the JVLA 3 limit being 0.15 mJy (Smith et al., 2016). At 100 GHz, there is a weak signal at Mrk 739W, but it does not constitute a significant detection (see Table 2), which based on the steep slope is not expected (see the high excess value in the Table).
It should be noted that the lower frequencies below 22 GHz are often observed with different beam sizes, and over several decades, which can make the notion of a spectral slope, and a high-frequency excess somewhat misleading. A more conservative measure of the mm-wave component could be the 22 GHz to 100 GHz flux density ratio , since these measurements were carried out within 1 - 2 years, and with similar beam sizes. As seen in Table 2, three sources have a flat or inverted spectrum in this range. In fact, in the group of the ten sources that are detected at both frequencies has a median of 1.8, while spectral slopes of , and 0.5 would imply , and 2.1, respectively.
For four sources, we were able to measure the spectral slope around 22 GHz by exploiting the 8 GHz JVLA observed band, namely between 18-26 GHz. We find for 2MASX J0444+2813, Mrk 79, NGC 2110, and NGC 3516 slopes of , and +0.27, respectively. No meaningful uncertainties could be obtained for these slopes. NGC 2110 is an extended radio loud source. Indeed, its steep slope of –2.4 around 22 GHz that continues to drop towards 100 GHz (no excess in Table 2) is consistent with its radio/mm emission originating from an optically thin source (the jet). The spectra of 2MASX J0444+2813 and NGC 3516 have flattened out by 22 GHz compared to the broad-band slopes (Table 2), while Mrk 79 is still rather steep, but must turn over before 100 GHz, where it has a significant excess (Table 2).
For eight sources, we are able to estimate the spectral slope () between the sidebands of the CARMA data from 100 to 116 GHz. All slopes are consistent with being approximately flat or even inverted, though some with great uncertainty. The three best measured slopes with are MCG +08-11-011 (), NGC 5106 (), and NGC 5506 (, i.e. clearly inverted). In summary, there is a general flattening of the spectrum at high frequencies. Where exactly does the slope turn over remains to be seen, and may very well vary from one source to the other. 45 GHz flux measurements with the JVLA are essential to better characterize this emerging new mm-band spectral component, and frequencies above 100 GHz are crucial for differentiating the AGN core emission from that of the dust in the FIR. In the mean time, the bright mm-wave cores of RQ AGNs that are spectrally distinguished from their low-frequency radio emission provide tentative evidence for a prevalent, compact, optically thick nucleus, which could be the manifestation of the accretion disk corona in mm waves, and a potential source of short-time variability.

3.3 X-ray luminosities
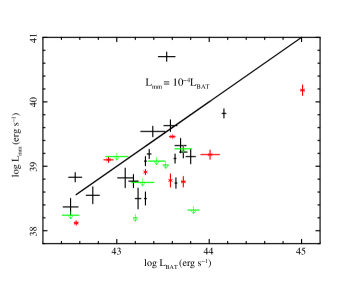
In this section, we compare the 100 GHz luminosities to the X-ray ones, which are indicated in the last two columns of Table 2; uncertainties are not listed, but they are mostly small ( dex). A scatter plot of vs. is presented in Fig. 2, which includes also seven AGNs that were measured previously at 95 GHz (Behar et al., 2015), adding up to a total sample of 27 detections and 6 upper limits. Upper limits are plotted as 3-sigma limits. The previous paper includes eight AGNs (NGC 5506 overlapping with the present sample) that were selected for their soft X-ray brightness and rapid variability, and are listed separately in Table 3 below. That selection naturally resulted in most of these being type 1 or type 1.5 Seyferts. NGC 5506 is classified in the Swift/BAT survey as a Seyfert 1.9, but is actually an optically obscured NLSy1 (Nagar et al., 2002). It is measured here at mJy, and previously at mJy. Ark 564 from the previous sample is not in the Swift/BAT survey, but its hard X-ray luminosity can be estimated to be (erg s-1) from its soft X-ray 2 - 10 keV measured luminosity , using the empirical conversion formula of Winter et al. (2009):
| (2) |
| Object | Seyfert | (95 GHz) | ) | |||
|---|---|---|---|---|---|---|
| type | (mJy) | (pc) | (erg s-1) | (erg s-1) | ||
| MR 2251-178 | 1 | 1.60.3 | 0.70 | 40.18 | 45.01 | –4.45 |
| NGC 3783 | 1 | 3.10.7 | 0.15 | 38.78 | 43.58 | –4.33 |
| NGC 5506 | 1.9 | 101.0 | 0.17 | 38.91 | 43.31 | –3.92 |
| NGC 7469 | 1.2 | 4.950.16 | 0.32 | 39.46 | 43.60 | 3.68 |
| ARK 564 | 1 | 1.140.19 | 0.23 | 39.18 | 44.01* | –4.39 |
| NGC 3227 | 1.5 | 4.10.24 | 0.07 | 38.12 | 42.56 | –3.91 |
| MRK 766 | 1.5 | 1.980.17 | 0.16 | 39.10 | 43.91 | –3.30 |
| NGC 5548 | 1.5 | 1.60.3 | 0.19 | 38.76 | 43.72 | –4.50 |
* based on Eq. 2.
The correlation between and is interesting. The values of the present work are listed in the last column of Table 2. Using the hard X-ray band of Swift/BAT has the advantage of reducing the concern of absorption skewing an intrinsic correlation. On the other hand, the luminosity range of the present sample is small, and it is far from being complete. Hence, in Fig. 2 we plot the line just to guide the eye. The line appears to lie somewhat high with respect to the data, but there is much scatter. In fact, a formal fit to the normalization (upper limits excluded) yields a somewhat weaker mean mm luminosity (90% confidence uncertainties). A fit of both the slope and the displacement in Fig. 2, yields a slope of . A similar correlation, but between the 1.4 GHz (on kpc scales) and 20–100 keV luminosities of a different hard X-ray selected AGN sample, yielded a slope of (Panessa et al., 2015, Fig. 3 therein), which is not very different from the present one. Wong et al. (2016) find a correlation between and , but do not report a direct slope.
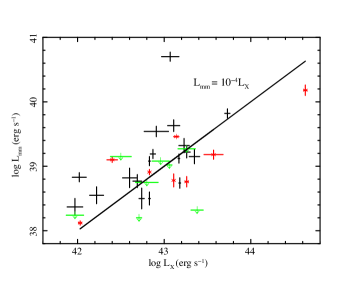
In order to compare directly with the 2–10 keV band, we converted all luminosities to using Eq. 2. The vs. values are plotted in Fig. 3. Here too, we plotted the line to guide the eye. As expected, also approximately correlates with . As opposed to and Fig. 2, the data points lie somewhat above the line. Indeed, fitting the normalization in Fig. 3 yields , but the small sample and the scatter impede a strong conclusion. One of the possible reasons for the scatter in mm vs X-ray luminosities may be the lack of broad spectral coverage, without which is only a poor estimate of the true mm luminosity.
A fit to the slope in Fig. 3 yields , to be compared with for 1.4 GHz in Panessa et al. (2015). The different slopes of the 1.4 GHz and the 100 GHz luminosities, with respect to the X-ray luminosity could suggest that the cm- and mm- wave sources represent different components, from different size scales of the AGN. This is supported by the high-frequency excess that suggests a separate mm-wave AGN component.
Interestingly, the presumably RL sources in the present sample (see Sec. 1), do not show evidence of radio loudness in their values (Fig. 3). We suspect this is a result of a compact radio/mm core that is independent of more extended radio emission from a jet. The one outlier is the suspected LINER NGC 5106 at the very top of Figs. 2, 3. NGC 5106 is radio loud in terms of its 5 GHz to B-band flux density ratio, and its value of is high compared to the present X-ray selected sample, though not unusual for low-luminosity AGN (c.f., Doi et al., 2011; Wu et al., 2018). Parisi et al. (2014) point to contradicting indicators regarding the classification of NGC 5106 (PBC J1321.1+0858 there). Its optical line ratios put it in the region between Seyferts, LINERs, and star forming galaxies. Its [O I] optical line is relatively weak for a Seyfert. Indeed, NGC 5106 has a 20″extended UV nucleus, and its FIR emission indicates an unusually high star formation rate of above 20 solar masses per year, one of the three highest of the Swift/BAT AGN sample (Meléndez et al., 2014). We did not find any high-resolution radio images of NGC 5106, but its high ratio could be explained if it has a compact radio jet.
4 Discussion & prospects
We observed 26 hard X-ray bright AGN at 100 GHz with CARMA and detected 18 mostly unresolved cores. This sample increases the number of RQ AGNs observed in mm waves by a factor of a few. Most of the sources feature a 100 GHz excess with respect to the extrapolation of the low-frequency steep spectral slope. This spectral turnover adds to previous evidence of an optically thick mm-wave AGN component that is superimposed on the steep-slope, optically thin, likely more extended component at lower radio frequencies.
If the mm-wave emission mechanism is synchrotron self-absorption, the deduced sizes of an optically thick 100 GHz synchrotron source at the observed luminosities, are in the range of pc. This size estimate is of the order of the typical X-ray variability time scale of approximately a light day, which suggests perhaps that the mm-wave component is associated with the X-ray source.
Furthermore, the 100 GHz luminosity appears to be roughly correlated with the X-ray luminosity, both in the Swift/BAT band of 14–195 keV, and with the implied 2–10 keV luminosity. The measured luminosities follow what is an relation, which is not yet statistically significant. At 22 GHz, Smith et al. (2016) found , which seems like an extension of the correlation found for the 5 GHz luminosity. One may wonder if also correlates with at 5 GHz directly. For this we plot the two luminosities in Fig. 4, for those sources that have a JVLA measurement at 5 GHz with the A-array. An overall correspondence between the two bands can be seen. A broad-band spectral slope of is implied. This is expected given the generally steep spectra of the sample (see Table 2), including many even steeper slopes, hence the mm-wave excess. The correlation with X-rays is interestingly similar to the correlation found for coronally active stars, and suggests that the X-ray and radio sources may be both associated with stochastic magnetic activity.

Other interpretations of the mm-wave excess are also possible, and more spectral and temporal information is still needed to discern between the various scenarios. A superposition of many compact galactic sources, e.g. supernova remnants (SNRs), is unlikely, because the 1.4 GHz luminosity of an SNR is erg s-1 (Pannuti et al., 2007; Lee & Lee, 2014), and less at 100 GHz, requiring millions of them to account for the observed radio and mm-wave luminosity. We note also that the ratio of SNRs implied from these papers is closer to 10-6, so different from AGN. X-ray binaries have even lower ratios. The most extreme lowest luminosity AGNs do start approaching luminosities of SNRs and X-ray binaries (Wu et al., 2018), but not the luminous Swift/BAT AGNs considered here. Furthermore, if the spectrum from radio to mm is flat (c.f. Wu et al., 2018) it could be due to free-free emission () from the AGN, e.g., the BLR. A free-free absorbed weak jet, analogous to RL AGN, would then also be possible to account for the mm-wave emission (Doi & Inoue, 2016), but the correlation with the X-ray luminosity would require a different explanation. In the present sample, except for NGC 2110, which is radio loud and has extended radio emission, strong jet scenarios are ruled out. Due to the lack of sufficient spectral information, another intriguing source of mm-wave emission might be charged spinning dust grains whose rotational dipole emission peaks at GHz, and is much weaker at few GHz (Draine & Lazarian, 1998). These have been invoked to explain anomalous microwave emission in our galaxy (Leitch et al., 1997), a weak excess over the cosmic microwave background. A survey of the 10 - 100 GHz spectra would be needed to assess their contribution, but here too, the relation to X-rays would require a separate explanation.
Despite the mounting circumstantial evidence, direct measurements of 100 GHz variability, and its relation to the X-ray variability, are still required if one is to test the AGN connection between the mm band and the X-ray sources, namely the accretion disk coronae. In order to decisively test the conjecture of radio/mm emission from the accretion disk corona, simultaneous mm (not few-GHz radio that hardly varies) and X-ray monitoring is needed. Temporal correlation between the mm and X-ray light curves would be the smoking gun of coronal radio/mm emission. An example of such a correlation in stellar coronae is the Neupert effect (Neupert, 1968; Güdel et al., 2002), by which the time derivative of the X-ray light curve correlates with the radio light curve. This effect is explained by non-thermal, radio electrons spiraling down the stellar (would be accretion disk in AGN) corona, and their time-integrated energy heating the stellar chromosphere (accretion disk) to produce X-rays.
Finally, a systematic study of broadband radio and mm spectra of a full sample of RQ AGNs between 1–100 GHz is desired, in order to better characterize the high-frequency excess and its various manifestations in different AGN. The present work as well as those of Smith et al. (2016), Doi & Inoue (2016), and an ongoing 45 GHz campaign on the PG quasars (Baldi et al. in preparation), should all contribute to the large picture of the physical processes behind radio and mm-wave emission in RQ AGNs.
Acknowledgments
The research at the Technion is supported by the I-CORE program of the Planning and Budgeting Committee (grant number 1937/12) and by a grant from the Asher Space Research Institute. EB is grateful for the warm hospitality and support during a sabbatical visit to the University of Maryland, College Park, and for funding from the European Union’s Horizon 2020 research and innovation programme under the Marie Sklodowska-Curie grant agreement no. 655324. EB thanks Francesca Panessa for important comments on the manuscript. This work was performed in part at the Aspen Center for Physics, which is supported by National Science Foundation grant PHY-1607611 and by a grant from the Simons Foundation.
References
- Anderson & Ulvestad (2005) Anderson J. M., Ulvestad J. S., 2005, ApJ, 627, 674
- Anderson et al. (2004) Anderson J. M., Ulvestad J. S., Ho L. C., 2004, ApJ, 603, 42
- Baldi et al. (2015) Baldi R. D., Behar E., Laor A., Horesh A., 2015, MNRAS, 454, 4277
- Barvainis et al. (1992) Barvainis R., Antonucci R., Coleman P., 1992, ApJ, 399, L19
- Barvainis et al. (1996) Barvainis R., Lonsdale C., Antonucci R., 1996, AJ, 111, 1431
- Baumgartner et al. (2013) Baumgartner W. H., Tueller J., Markwardt C. B., Skinner G. K., Barthelmy S., Mushotzky R. F., Evans P. A., Gehrels N., 2013, ApJS, 207, 19
- Behar et al. (2015) Behar E., Baldi R. D., Laor A., Horesh A., Stevens J., Tzioumis T., 2015, MNRAS, 451, 517
- Blackman & Field (2000) Blackman E. G., Field G. B., 2000, MNRAS, 318, 724
- Blundell & Beasley (1998) Blundell K. M., Beasley A. J., 1998, MNRAS, 299, 165
- Blundell et al. (1996) Blundell K. M., Beasley A. J., Lacy M., Garrington S. T., 1996, ApJ, 468, L91
- Brinkmann et al. (2000) Brinkmann W., Laurent-Muehleisen S. A., Voges W., Siebert J., Becker R. H., Brotherton M. S., White R. L., Gregg M. D., 2000, A&A, 356, 445
- Carral et al. (1990) Carral P., Turner J. L., Ho P. T. P., 1990, ApJ, 362, 434
- Catura et al. (1975) Catura R. C., Acton L. W., Johnson H. M., 1975, ApJ, 196, L47
- Di Matteo et al. (1997) Di Matteo T., Celotti A., Fabian A. C., 1997, MNRAS, 291, 805
- Doi & Inoue (2016) Doi A., Inoue Y., 2016, PASJ, 68, 56
- Doi et al. (2005) Doi A., Kameno S., Kohno K., Nakanishi K., Inoue M., 2005, MNRAS, 363, 692
- Doi et al. (2011) Doi A., Nakanishi K., Nagai H., Kohno K., Kameno S., 2011, AJ, 142, 167
- Draine & Lazarian (1998) Draine B. T., Lazarian A., 1998, ApJ, 494, L19
- Field & Rogers (1993) Field G. B., Rogers R. D., 1993, ApJ, 403, 94
- Gallimore et al. (2006) Gallimore J. F., Axon D. J., O’Dea C. P., Baum S. A., Pedlar A., 2006, AJ, 132, 546
- Gallimore et al. (2004) Gallimore J. F., Baum S. A., O’Dea C. P., 2004, ApJ, 613, 794
- Giroletti & Panessa (2009) Giroletti M., Panessa F., 2009, ApJ, 706, L260
- Güdel et al. (2002) Güdel M., Audard M., Smith K. W., Behar E., Beasley A. J., Mewe R., 2002, ApJ, 577, 371
- Güdel & Benz (1993) Güdel M., Benz A. O., 1993, ApJ, 405, L63
- Hughes et al. (1993) Hughes D. H., Robson E. I., Dunlop J. S., Gear W. K., 1993, MNRAS, 263, 607
- Inoue & Doi (2014) Inoue Y., Doi A., 2014, PASJ
- Izumi et al. (2015) Izumi T., Kohno K., Aalto S., et al. 2015, ApJ, 811, 39
- Kellermann et al. (1989) Kellermann K. I., Sramek R., Schmidt M., Shaffer D. B., Green R., 1989, AJ, 98, 1195
- Kharb et al. (2015) Kharb P., Das M., Paragi Z., Subramanian S., Chitta L. P., 2015, ApJ, 799, 161
- Koss et al. (2011) Koss M., Mushotzky R., Treister E., Veilleux S., Vasudevan R., Miller N., Sanders D. B., Schawinski K., Trippe M., 2011, ApJ, 735, L42
- Koss et al. (2011) Koss M., Mushotzky R., Veilleux S., Winter L. M., Baumgartner W., Tueller J., Gehrels N., Valencic L., 2011, ApJ, 739, 57
- Koss et al. (2017) Koss M., Trakhtenbrot B., Ricci C., et al. 2017, ApJ, 850, 74
- Lal et al. (2004) Lal D. V., Shastri P., Gabuzda D. C., 2004, A&A, 425, 99
- Laor & Behar (2008) Laor A., Behar E., 2008, MNRAS, 390, 847
- Lee & Lee (2014) Lee J. H., Lee M. G., 2014, ApJ, 793, 134
- Leitch et al. (1997) Leitch E. M., Readhead A. C. S., Pearson T. J., Myers S. T., 1997, ApJ, 486, L23
- Lightman et al. (1978) Lightman A. P., Giacconi R., Tananbaum H., 1978, ApJ, 224, 375
- Meléndez et al. (2014) Meléndez M., Mushotzky R. F., Shimizu T. T., Barger A. J., Cowie L. L., 2014, ApJ, 794, 152
- Middelberg et al. (2004) Middelberg E., Roy A. L., Nagar N. M., Krichbaum T. P., Norris R. P., Wilson A. S., Falcke H., Colbert E. J. M., Witzel A., Fricke K. J., 2004, A&A, 417, 925
- Nagar et al. (2002) Nagar N. M., Falcke H., Wilson A. S., Ulvestad J. S., 2002, A&A, 392, 53
- Nagar et al. (2002) Nagar N. M., Oliva E., Marconi A., Maiolino R., 2002, A&A, 391, L21
- Nagar et al. (1999) Nagar N. M., Wilson A. S., Mulchaey J. S., Gallimore J. F., 1999, ApJS, 120, 209
- Neupert (1968) Neupert W. M., 1968, ApJ, 153, L59
- Panessa et al. (2007) Panessa F., Barcons X., Bassani L., Cappi M., Carrera F. J., Ho L. C., Pellegrini S., 2007, A&A, 467, 519
- Panessa & Giroletti (2013) Panessa F., Giroletti M., 2013, MNRAS, 432, 1138
- Panessa et al. (2015) Panessa F., Tarchi A., Castangia P., Maiorano E., Bassani L., Bicknell G., Bazzano A., Bird A. J., Malizia A., Ubertini P., 2015, MNRAS, 447, 1289
- Pannuti et al. (2007) Pannuti T. G., Schlegel E. M., Lacey C. K., 2007, AJ, 133, 1361
- Parisi et al. (2014) Parisi M. C., Geisler D., Carraro G., Clariá J. J., Costa E., Grocholski A. J., Sarajedini A., Leiton R., Piatti A. E., 2014, AJ, 147, 71
- Park et al. (2013) Park S., Sohn B. W., Yi S. K., 2013, A&A, 560, A80
- Raginski & Laor (2016) Raginski I., Laor A., 2016, MNRAS, 459, 2082
- Salvato et al. (2004) Salvato M., Greiner J., Kuhlbrodt B., 2004, ApJ, 600, L31
- Sault et al. (1995) Sault R. J., Teuben P. J., Wright M. C. H., 1995, in Shaw R. A., Payne H. E., Hayes J. J. E., eds, Astronomical Data Analysis Software and Systems IV Vol. 77 of Astronomical Society of the Pacific Conference Series, A Retrospective View of MIRIAD. p. 433
- Scharwächter et al. (2016) Scharwächter J., Combes F., Salomé P., Sun M., Krips M., 2016, MNRAS, 457, 4272
- Schmidt & Green (1983) Schmidt M., Green R. F., 1983, ApJ, 269, 352
- Shapiro et al. (1976) Shapiro S. L., Lightman A. P., Eardley D. M., 1976, ApJ, 204, 187
- Shimizu et al. (2016) Shimizu T. T., Meléndez M., Mushotzky R. F., Koss M. J., Barger A. J., Cowie L. L., 2016, MNRAS, 456, 3335
- Singh et al. (2013) Singh V., Shastri P., Ishwara-Chandra C. H., Athreya R., 2013, A&A, 554, A85
- Smith et al. (2016) Smith K. L., Mushotzky R. F., Vogel S., Shimizu T. T., Miller N., 2016, ApJ, 832, 163
- Tananbaum et al. (1978) Tananbaum H., Peters G., Forman W., Giacconi R., Jones C., Avni Y., 1978, ApJ, 223, 74
- Tarchi et al. (2011) Tarchi A., Castangia P., Columbano A., Panessa F., Braatz J. A., 2011, A&A, 532, A125
- Thean et al. (2000) Thean A., Pedlar A., Kukula M. J., Baum S. A., O’Dea C. P., 2000, MNRAS, 314, 573
- Ulvestad et al. (2005) Ulvestad J. S., Antonucci R. R. J., Barvainis R., 2005, ApJ, 621, 123
- Ulvestad & Ho (2001) Ulvestad J. S., Ho L. C., 2001, ApJ, 562, L133
- Ulvestad & Wilson (1984) Ulvestad J. S., Wilson A. S., 1984, ApJ, 278, 544
- Ulvestad & Wilson (1989) Ulvestad J. S., Wilson A. S., 1989, ApJ, 343, 659
- Ulvestad et al. (2005) Ulvestad J. S., Wong D. S., Taylor G. B., Gallimore J. F., Mundell C. G., 2005, AJ, 130, 936
- Wang et al. (2006) Wang R., Wu X.-B., Kong M.-Z., 2006, ApJ, 645, 890
- Winter et al. (2009) Winter L. M., Mushotzky R. F., Reynolds C. S., Tueller J., 2009, ApJ, 690, 1322
- Wong et al. (2016) Wong O. I., Koss M. J., Schawinski K., Kapińska A. D., Lamperti I., Oh K., Ricci C., Berney S., Trakhtenbrot B., 2016, MNRAS, 460, 1588
- Wu et al. (2018) Wu Q., Feng J., Fan X., 2018, ApJ, 855, 46