Science
Title: A single fast radio burst localized to a massive galaxy at cosmological distance
Authors: K. W. Bannister1,∗, A. T. Deller2, C. Phillips1, J.-P. Macquart3, J. X. Prochaska4,5, N. Tejos6, S. D. Ryder7, E. M. Sadler1,8, R. M. Shannon2,∗, S. Simha4, C. K. Day2, M. McQuinn9, F. O. North-Hickey3 S. Bhandari1 W. R. Arcus3, V. N. Bennert10, J. Burchett6, M. Bouwhuis1,11, R. Dodson12, R. D. Ekers1,3, W. Farah2, C. Flynn2, C. W. James3, M. Kerr13, E. Lenc1, E. K. Mahony1, J. O’Meara14, S. Osłowski2, H. Qiu1,8, T. Treu15, V. U16, T. J. Bateman8, D. C.-J. Bock1, R. J. Bolton1, A. Brown1, J. D. Bunton1, A. P. Chippendale1, F. R. Cooray1, T. Cornwell17, N. Gupta18, D. B. Hayman1, M. Kesteven1, B. S. Koribalski1, A. MacLeod1, N. M. McClure-Griffiths19, S. Neuhold1, R. P. Norris1,20, M. A. Pilawa1, R.-Y. Qiao1, J. Reynolds1, D. N. Roxby1, T. W. Shimwell21, M. A. Voronkov1, C. D. Wilson1
∗ To whom correspondence should be addressed. E-mail: keith.bannister@csiro.au (K.W.B.), rshannon@swin.edu.au (R.M.S.). Affiliations are listed at the end of the main text.
Accepted: 19 June 2019
Fast Radio Bursts (FRBs) are brief radio emissions from distant astronomical sources. Some are known to repeat, but most are single bursts. Non-repeating FRB observations have had insufficient positional accuracy to localize them to an individual host galaxy. We report the interferometric localization of the single pulse FRB 180924 to a position 4 kpc from the center of a luminous galaxy at redshift . The burst has not been observed to repeat. The properties of the burst and its host are markedly different from the only other accurately localized FRB source. The integrated electron column density along the line of sight closely matches models of the intergalactic medium, indicating that some FRBs are clean probes of the baryonic component of the cosmic web.
Cosmological observations have shown that baryons comprise of the energy density of the Universe, of which only about 10% is in cold gas and stars (?), with the remainder residing in a diffuse plasma surrounding and in between galaxies and galaxy clusters. The location and density of this material has been challenging to characterize, and up to 50% of it remains unaccounted (?).
Fast radio bursts (FRBs; ref. (?)) are bright bursts of radio waves with millisecond duration. They can potentially be used to detect, study, and map this medium, as bursts of emission are dispersed and scattered by their passage through any ionized material, including the intergalactic medium. If the emission is linearly polarized and any of the media are magnetized, the burst is also subject to Faraday rotation, i.e., the frequency dependent rotation of the plane of linear polarization due to its passage through a magnetized plasma (?).
Detailed studies of the medium, and the bursts themselves, require localization of bursts to host galaxies, so that burst redshifts and their propagation distances can be determined.
To date, only one source (FRB 121102) has been localized (?) to sufficient accuracy to identify a host. Is is also one of only two FRBs known to repeat (?). The burst localization was made through radio-interferometric detections of repeated bursts. The burst source lies in a luminous radio nebula (?) within a dwarf galaxy with high star formation rate per unit stellar mass, at redshift (?). This has led to the hypothesis that bursts are produced by young magnetars embedded in pulsar wind nebulae (?), with the host galaxy properties suggesting an indirect connection between FRBs and other transient events which are common in this type of galaxy, such as superluminous supernovae and long-duration gamma-ray bursts.
The relationship between the source of FRB 121102 and the larger FRB population is unclear (?, ?, ?). Many sources have not been observed to repeat despite extensive campaigns spanning hundreds to thousands of hours (?, ?). The progenitors and mechanism by which burst emission is generated remain uncertain. Localizing examples of further bursts, including those from a population that have not repeated, is required to determine their nature and establish if they can be used as cosmological probes.
Localizing fast radio bursts with ASKAP
The Australian Square Kilometre Array Pathfinder (ASKAP, Ref. (?)), a -antenna radio interferometer, has a specially designed mode capable of directly localizing dispersed pulses, such as fast radio bursts (?). Each of the -m antennas has been placed in a quasi-random configuration with baselines extending to -km lengths, resulting in a maximum angular resolution of arcsec at a frequency of MHz, enabling positions to be measured to a statistical precision of arcsec/(2S/N), where S/N is the source signal to noise ratio.
The antennas are equipped with phased-array feed receivers (?), each of which can form simultaneous dual-polarization beams on the sky using digital beamforming, producing a total field-of-view of deg2. For burst detection, the beamformers produces channelized autocorrelation spectra for both linear polarizations of all beams, with an integration time of s and channel bandwidth of MHz in these observations. We used channels centered at MHz. A real-time detection pipeline incoherently adds the spectra from all available antennas ( antennas in these observations) and polarization channels, then searches (?) the result for dispersed pulses (?).
Burst localization is completed with a second data product that utilizes both the amplitude and phase information of the burst radiation. The beamformers store samples of the complex electric field for all beams and both polarizations in a ring buffer of s duration, with the oldest data being continuously overwritten by new data. The data are saved for offline interferometric analysis only when the pipeline identifies a candidate. For the searches reported here the triggering required pulses with widths less than ms and .
Previous searches with ASKAP used antennas pointed in different directions to maximize sky coverage (?, ?). In contrast, our observations used antennas all pointed in the same direction, enabling the array to act as an interferometer capable of sub-arcsecond localization with a deg2 field of view. We targeted high Galactic latitude fields (Galactic latitude ), that had been observed previously (?, ?), and Southern circumpolar fields. The high-latitude fields were observed regularly through 2017 and early 2018 for a total duration of hr (?) enabling us to put constraints on burst repetition. For daytime observations, circumpolar fields were observed to enable prompt follow-up from Southern-hemisphere optical telescopes.
The detection of FRB 180924
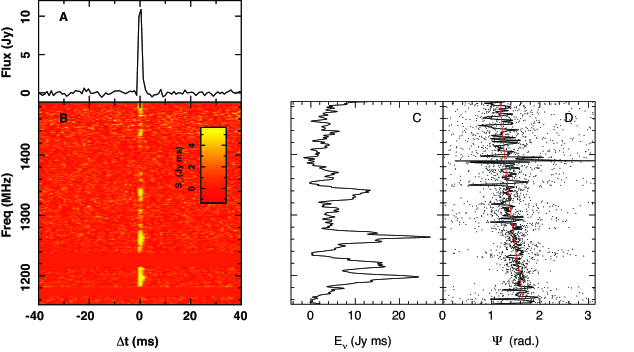
We detected a burst (FRB 180924, see Fig. 1), with a signal to noise ratio of in one of the high Galactic latitude fields. The search pipeline identified the burst ms after the dispersed pulse swept across the lowest frequency channel, and triggered the download of the buffer containing the burst.
The properties of the burst, listed in Table 1, and the strong spectral modulation (see Fig. 1B), are similar to the previous examples detected with ASKAP in lower-sensitivity searches (?, ?), suggesting that they belong to the same population. The dispersion measure (DM) of the burst, which is the integrated free electron content along the line of sight, weighted by the rest frame frequency while passing through the dispersing medium, is pc cm-3 and the burst fluence is Jy ms (1 Jy = W Hz-1 m-2). The burst is linearly polarized and shows evidence for only modest Faraday rotation. The measured strength of the Faraday rotation (the rotation measure - RM) is RM= rad m-2 (?). The Galactic foreground contribution to the Faraday rotation along high latitude lines of sight is low; the Milky Way Faraday rotation along this line of sight is predicted (?) to be . The pulse shows evidence for scatter broadening with a scattering time scale s at a frequency of GHz (?).
A sub-arcsecond localization
We localized the burst using an image made from the s of voltage data, produced using techniques developed for long-baseline radio interferometry. Two teams blindly analyzed the data using different pipelines and codes, and derived the same initial source positions (?). In a refined, coherently formed, optimally weighted image, the burst was detected with a signal to noise ratio of , from which the position was measured with a statistical uncertainty (from thermal noise alone) of arcsec.
To identify a host galaxy it is necessary to tie the radio image to an optical reference frame. We register the position of the burst on a deep Dark Energy Survey (DES, Ref. (?)) optical image of the region by bootstrapping the radio-interferometric image of the burst to a deeper radio observation of the field that can subsequently be referenced to a standard sky coordinate system (?). In addition to the burst, three constant (non-transient) radio sources were also detected in our -s ASKAP image. We compared their measured positions with those obtained from phase-referenced observations with the Australia Telescope Compact Array (ATCA), observing in the same frequency band as ASKAP. One source has both a precise radio position (uncertainty 0.004 arcsec) measured with very long baseline interferometry and an optical position from DES. We corrected a small residual offset in the DES image relative to the optical reference frame by cross matching stars in the DES images that had been cataloged by the Gaia mission (?, ?). The positions agree with each other within their uncertainties, confirming that the radio and optical frames are well aligned. We estimate the combination of statistical and systematic uncertainty in the burst’s position to be arcsec in both right ascension and declination (?). The position of the burst is right ascension 21h44m25.255s 0.008s, declination 40∘54’00.1” (equinox J2000).
The burst host galaxy
The sub-arcsecond localization for FRB 180924 allows us to uniquely identify the host by combining public observations from the Dark Energy Survey (?) with deeper images of the field we obtained with the Very Large Telescope (VLT), long-slit spectra with the Gemini South Telescope, and integral-field spectra with the Keck-II telescope and the VLT (see (?) for details of instrumental setups).
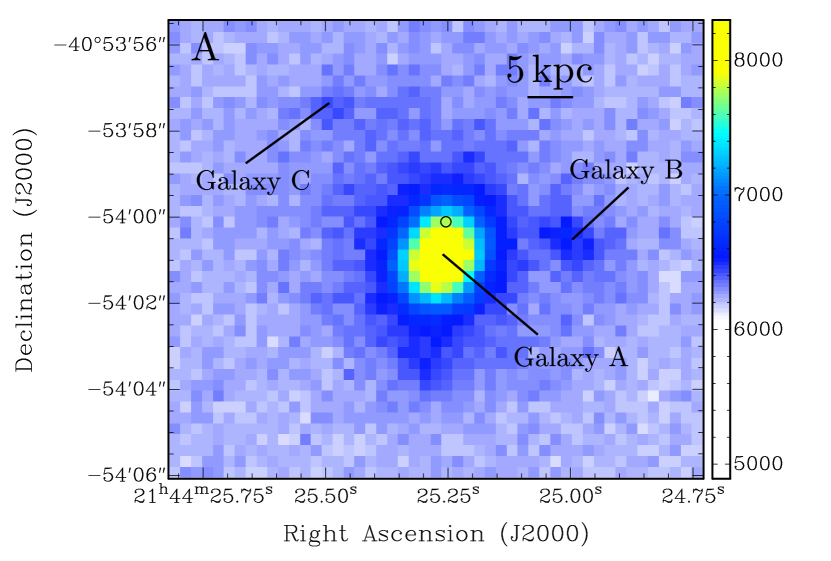
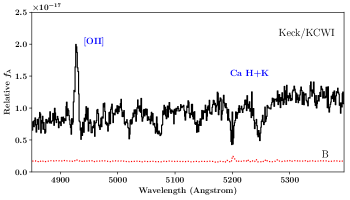
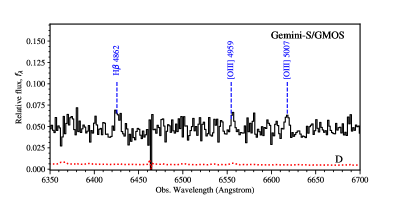
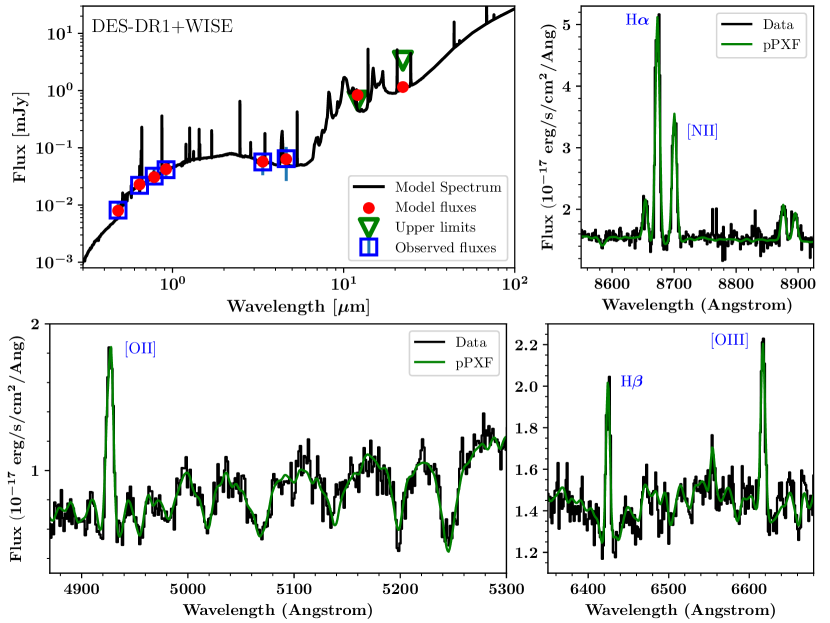
Figure 2 shows a deep VLT image of the field around the burst position. The burst source is located arcsec from the center of galaxy DES J214425.25405400.81 (galaxy A in Fig. 2A) cataloged by the DES (?). Keck observations establish the spectroscopic redshift of this galaxy to be , based on the ionized-Oxygen emission from diffuse gas in the galaxy and Calcium-absorption lines from its stellar component (Figure 2B). The redshift was confirmed with spectroscopic observations of the galaxy with Gemini-South (Figure 2C-D), which showed line emission from additional species at the same redshift, including the first two (Hydrogen) Balmer transitions (H and H) and ionized Nitrogen (?). The deeper images obtained with the VLT show two other nearby objects which were also both detected in the integral-field spectra. There is faint ionized-Oxygen emission from a dwarf galaxy, labeled galaxy B in Fig 2, at approximately 3 arcsec to the north west of the host and arcsec from the position of FRB 180924. This corresponds to a projected distance of 19 kpc at the redshift of this galaxy. A third galaxy with a redshift (galaxy C in Fig. 2) is located arcsec northeast of the FRB position, at a projected distance of 21 kpc. We rule out association of the burst with these galaxies with high confidence (?).
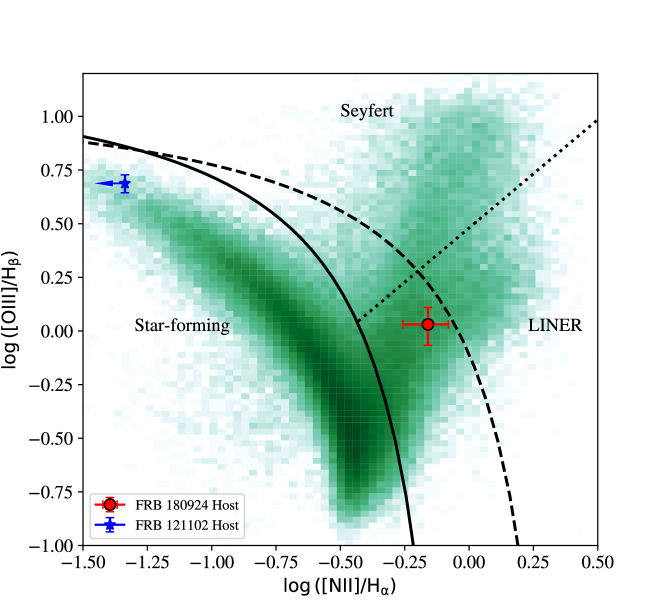
We derive the properties of the host galaxy A by combining photometry from public surveys in optical (?) and near-infrared wavelengths (from Wide-field Infrared Survey Explorer (WISE) m and m images) (?) with our optical imaging and spectroscopy (Figs. 2 and 3), using standard techniques (?). The host properties are consistent with a massive lenticular or early-type spiral galaxy. The stellar population has a total mass of ( is one solar mass), and is dominated by an old stellar population with an age Gyr. The galaxy shows nebular emission lines with ratios consistent with gas excited by a harder spectrum than the ionizing flux of a star-forming population, characteristic of low-ionization narrow emission-line region (LINER) galaxies (?). We demonstrate this by measuring the strength of forbidden transitions of singly ionized nitrogen ([N ii]) and doubly ionized Oxygen ([O iii]), relative to, respectively, H and H, and comparing to a well-studied sample of galaxies (?), (Fig. 4). The host galaxy resides in the region of phase space occupied by LINER galaxies (?). The galaxy also shows the presence of interstellar dust, which is attenuating the optical-wavelength emission. The ratio of strength of H to H, combined with multi-band photometry suggest that there is internal extinction by dust within the galaxy (extinction magnitudes, i.e., the optical band is attenuated by a factor of ). In principle, the measured Hydrogen emission lines can be used to constrain star formation in the galaxy. While the data allow for a non-zero star formation rate, we report an upper limit of per year, because we attribute a large fraction of the dust-corrected H luminosity (?) to the LINER component. The galaxy has a compact morphology described by a Sérsic profile (?) with index and an effective radius of kpc. The burst is located exterior to 90% of the galaxy’s stellar light (?).
We detect no radio-continuum emission from the burst location or anywhere within its host. We searched the host galaxy for radio emission with ATCA in a continuous band from GHz, at and days post-burst, and with ASKAP in a band from to GHz days post burst. We set flux-density limits on the emission of 20 Jy at a central frequency of 6.5 GHz and 450 Jy at 1.3 GHz (?).
No repeated bursts were observed from this direction, before or after the burst was detected. We conducted sensitive searches with the Parkes radio telescope for a duration of 9 hr starting days post-burst and a further 2 hours, days post-burst (?). No pulses were found above a limit of Jy ms for widths of ms. Likewise, no pulses were found in hr of observations of the field as part of previous, less sensitive, single-antenna observations with ASKAP (?) conducted between March and February . These searches place limits on fluence of Jy ms, for pulses of width ms (?). The burst was detected in a campaign in which the field was observed with a fluence limit of Jy ms in a total observing time of hr.
Comparison to FRB 121102 and its host
The properties of the burst and its host differ markedly to those of the repeating burst source FRB 121102 and its host galaxy. The host galaxy of FRB 180924 is a lenticular or early-type spiral with negligible or low rates of star formation. In contrast, the host of the FRB 121102 is a factor of less luminous, and is a low-mass, low-metallicity (low abundance of heavy elements), dwarf galaxy, with high star formation rate (?). Such dwarf galaxies are sites of high mass star formation, and frequent hosts of superluminous supernova and gamma-ray bursts (?). The two galaxies reside in completely different regions of the galaxy-type phase-space defined by their emission lines (Fig. 4).
The burst source environments are also very different. FRB 121102 resides in a radio nebula containing highly magnetized plasma; its bursts have high rotation measures (RM rad m-2, Ref. (?)), with the bursts showing a decrease over about a year (?). A large dispersion measure contribution is inferred from FRB 121102’s host and local environment ( to (?, ?)), indicating that it propagates through (and is likely embedded in) a dense, highly magnetized and dynamic plasma. The source of the repeating FRB 121102 is also co-located with a compact radio source with luminosity W Hz-1 (?) at 6 GHz, while FRB 180924 shows no evidence for persistent associated radio emission at a limit times less luminous than the luminosity of the FRB 121102 compact source.
FRB 180924 has not been observed to repeat, despite extensive observations at low sensitivity with ASKAP and sensitive contemporaneous observations with the Parkes radio telescope. It is difficult to assess the statistical significance of the non repetitions from a single burst source. While the repetition rate of FRB 121102 is poorly characterized, the activity appears to be clustered into week-month time scales (?, ?) followed by long periods of inactivity. Sensitive searches with the Parkes radio telescope shortly after FRB 180924 was discovered did not detect any further bursts on week-month timescales.
The differences between FRB 180924 and FRB 121102 – the only other well localized burst source – suggest that either there could be two different populations of burst progenitors, or that progenitors occur in diverse environments. Models assuming a single progenitor class for bursts must reproduce the diversity in phenomenology and environments observed for burst sources.
Using the burst as an intergalactic and cosmological probe
The dispersion and redshift of FRB 180924 can be used to test models of the free electron column density of the intergalactic medium (IGM). We model the dispersion to be the sum of components from the Milky Way’s disk and halo, the intergalactic medium, and the burst’s host galaxy. Using models of the Milky Way, we infer a dispersion contribution from the disk (?) to be and the halo (?) to be . A simple model of the intergalactic medium, based on the average baryon density and ionization fraction of the Universe (?) predicts the intergalactic component of the dispersion to be 307 out to the redshift of the host. The sum of these components exceeds the dispersion of FRB 180924 by 46 without including any contribution from the host galaxy interstellar medium and its halo. The errors in the Milky Way and halo components are expected to be small ( ) relative to the total dispersion budget (?), so the main source of uncertainties in estimating the host dispersion contribution is the intergalactic medium component. The latter depends on the distribution of foreground circumgalactic gas with respect to the associated dark matter halos (a process strongly influenced by galactic feedback) and sample variance along a given sight line.
We use an IGM model that takes these uncertainties into account (?) to derive posterior probability distributions on the host electron densities under a range of assumed halo shapes (?). The mean host contribution to the dispersion inferred from these models, corrected for host redshift is in the range , with the 95% upper limits ranging from . This indicates that dispersion of FRB 180924 is consistent with models of the IGM, provided the host contribution is much smaller than that found for FRB 121102.
There are two plausible locations for the burst temporal broadening: in the host galaxy or an intervening galaxy halo. It is unlikely that the burst is scattered by the diffuse extragalactic medium (?). Similarly the temporal broadening in the Milky Way at high latitudes is predicted to be small at these frequencies ( s, Ref. (?)). If the burst is scattered by the host galaxy, the medium has increased turbulence compared to the Milky Way (?). Substantially lower levels of turbulence would be required in an intervening galaxy halo to produce the measured scatter broadening, because turbulence near the midpoint between the source and observer produces relatively more broadening than if the same level of turbulence were at either end. For a fixed turbulence strength, relative to an ISM line of sight a distance kpc in the host galaxy’s ISM, the extragalactic line of sight has an enhancement in temporal broadening by a factor , for lines of sight of at a distance of kpc in the IGM (?).
The burst can be used to quantify the mean magnetization of the dispersing plasma along the line of sight. Assuming both uniform magnetic field and electron densities along the line of sight, and using the excess Faraday rotation and dispersion of this burst, we set an upper limit on the magnetic field strength in the IGM parallel to the line of sight of nG, where is the mean redshift of the magnetized plasma. These constraints are similar to those found for previous bright bursts (?), and consistent with models of magnetization in extragalactic plasma (?).
Based on our sub-arcsecond localization of FRB 180924 to a galaxy at , we expect single-pulse fast radio bursts to be potential probes of the intergalactic medium at cosmological distances. Firstly, the rate of detection of single event bursts is a factor greater than those that have been found to repeat, so we expect them to provide a larger statistical sample. Secondly, if the environment of FRB 180924 is representative, this population of bursts have relatively small uncertainties in estimating the density and magnetization of the IGM out to large distances. Finally, if the hosts of other bursts are similarly luminous as the host of FRB 180924, identifying hosts at high redshift will be easier than if bursts are exclusively hosted in dwarf galaxies (?), like the host galaxy of FRB 121102.
 |
 |
 |
 |
 |
| FRB properties | |
|---|---|
| Dispersion Measure (DM) | pc cm-3 |
| Arrival time at 1152 MHz | 2018-09-24 16:23:12.6265 UT |
| Fluence | Jy ms |
| Pulse width | ms |
| Right Ascension (J2000) | 21h44m25.255s 0.008s |
| Declination (J2000) | 40∘54’00.1” |
| Galactic Longitude | 0.742467 deg |
| Galactic Latitude | 49.414787 deg |
| Incoherent Detection S/N | 21 |
| Image frequency-weighted S/N | 194 |
| Fractional linear polarization | % |
| Spectral modulation index | 0.80 |
| Decorrelation bandwidth | 8.5 MHz |
| Rotation Measure | rad m-2 |
| Host-galaxy properties | |
| Redshift | |
| Right Ascension (J2000) | 21h44m25.25s |
| Declination (J2000) | 40d54m00.81s |
| -band mag | |
| -band mag | |
| -band mag | |
| () mag | |
| () mag | |
| WISE m mag | |
| WISE m mag | |
| Radio continuum ( GHz, ) | Jy |
| Radio continuum ( GHz), ) | Jy |
| Inferred properties | |
| Implied FRB isotropic energy density | erg Hz-1 |
| Redshift inferred from DM (?) | 0.34 |
| DM Milky-Way Disk | 40.5 |
| DM Milky-Way Halo | 30 |
References
- 1. M. Fukugita, P. J. E. Peebles. The Cosmic Energy Inventory. Astrophys. J. 616, 643 (2004).
- 2. J. M. Shull, B. D. Smith, C. W. Danforth. The Baryon Census in a Multiphase Intergalactic Medium: 30% of the Baryons May Still be Missing. Astrophys. J. 759, 23 (2012).
- 3. D. Thornton, et al.. A Population of Fast Radio Bursts at Cosmological Distances. Science 341, 53 (2013).
- 4. K. Masui, et al.. Dense magnetized plasma associated with a fast radio burst. Nature 528, 523 (2015).
- 5. S. Chatterjee, et al.. A direct localization of a fast radio burst and its host. Nature 541, 58 (2017).
- 6. M. Amiri, et al.. A second source of repeating fast radio bursts. Nature 566, 235 (2019).
- 7. S. P. Tendulkar, et al.. The Host Galaxy and Redshift of the Repeating Fast Radio Burst FRB 121102. Astrophys. J. 834, L7 (2017).
- 8. B. Margalit, B. D. Metzger. A Concordance Picture of FRB 121102 as a Flaring Magnetar Embedded in a Magnetized Ion-Electron Wind Nebula. Astrophys. J. 868, L4 (2018).
- 9. M. Nicholl, et al.. Empirical Constraints on the Origin of Fast Radio Bursts: Volumetric Rates and Host Galaxy Demographics as a Test of Millisecond Magnetar Connection. Astrophys. J. 843, 84 (2017).
- 10. R. M. Shannon, et al.. The dispersion-brightness relation for fast radio bursts from a wide-field survey. Nature 562, 386 (2018).
- 11. V. Ravi. Measuring the Circumgalactic and Intergalactic Baryon Contents with Fast Radio Bursts. Astrophys. J. 872, 88 (2019).
- 12. V. Ravi, et al.. The magnetic field and turbulence of the cosmic web measured using a brilliant fast radio burst. Science 354, 1249 (2016).
- 13. S. Johnston, et al.. Science with ASKAP. The Australian square-kilometre-array pathfinder. Experimental Astronomy 22, 151 (2008).
- 14. N. Clarke, L. D’Addario, R. Navarro, J. Trinh. a Multi-Beam Radio Transient Detector with Real-Time De-Dispersion Over a Wide DM Range. Journal of Astronomical Instrumentation 3, 1450004 (2014).
- 15. S. G. Hay, J. D. O’Sullivan. Analysis of common-mode effects in a dual-polarized planar connected-array antenna. Radio Science 43, RS6S04 (2008).
- 16. K. W. Bannister, et al.. The Detection of an Extremely Bright Fast Radio Burst in a Phased Array Feed Survey. Astrophys. J. 841, L12 (2017).
- 17. Materials and methods are available as supplementary materials .
- 18. J.-P. Macquart, et al.. The Spectral Properties of the Bright Fast Radio Burst Population. Astrophys. J. 872, L19 (2019).
- 19. N. Oppermann, et al.. An improved map of the Galactic Faraday sky. Astron. & Astrophys. 542, A93 (2012).
- 20. T. M. C. Abbott, et al.. The Dark Energy Survey: Data Release 1. Astrophys. J. 239, 18 (2018).
- 21. Gaia Collaboration, et al.. Gaia Data Release 2. Summary of the contents and survey properties. Astron. & Astrophys. 616, A1 (2018).
- 22. E. L. Wright, et al.. The Wide-field Infrared Survey Explorer (WISE): Mission Description and Initial On-orbit Performance. Astron. J. 140, 1868 (2010).
- 23. R. Yan, M. R. Blanton. The Nature of LINER-like Emission in Red Galaxies. Astrophys. J. 747, 61 (2012).
- 24. J. A. Baldwin, M. M. Phillips, R. Terlevich. Classification parameters for the emission-line spectra of extragalactic objects. Pub. Astron. Soc. Pacific 93, 5 (1981).
- 25. L. J. Kewley, M. A. Dopita, R. S. Sutherland, C. A. Heisler, J. Trevena. Theoretical Modeling of Starburst Galaxies. Astrophys. J. 556, 121 (2001).
- 26. R. C. Kennicutt, N. J. Evans. Star Formation in the Milky Way and Nearby Galaxies. Annu. Rev. Astron. Astrophys. 50, 531 (2012).
- 27. J. L. Sérsic. Influence of the atmospheric and instrumental dispersion on the brightness distribution in a galaxy. Boletin de la Asociacion Argentina de Astronomia La Plata Argentina 6, 41 (1963).
- 28. C. G. Bassa, et al.. FRB 121102 Is Coincident with a Star-forming Region in Its Host Galaxy. Astrophys. J. 843, L8 (2017).
- 29. D. A. Perley, et al.. Host-galaxy Properties of 32 Low-redshift Superluminous Supernovae from the Palomar Transient Factory. Astrophys. J. 830, 13 (2016).
- 30. D. Michilli, et al.. An extreme magneto-ionic environment associated with the fast radio burst source FRB 121102. Nature 553, 182 (2018).
- 31. K. Gourdji, et al.. A Sample of Low-energy Bursts from FRB 121102. Astrophys. J. 877, L19 (2019).
- 32. N. Oppermann, H.-R. Yu, U.-L. Pen. On the non-Poissonian repetition pattern of FRB121102. Mon. Not. R. Astro. Soc. 475, 5109 (2018).
- 33. J. M. Cordes, T. J. W. Lazio. NE2001.I. A New Model for the Galactic Distribution of Free Electrons and its Fluctuations. arXiv:astro-ph/0207156 (2002).
- 34. J. X. Prochaska, Y. Zheng. Probing Galactic haloes with fast radio bursts. Mon. Not. R. Astro. Soc. 485, 648 (2019).
- 35. M. McQuinn. Locating the “Missing” Baryons with Extragalactic Dispersion Measure Estimates. Astrophys. J. 780, L33 (2014).
- 36. J.-P. Macquart, J. Y. Koay. Temporal Smearing of Transient Radio Sources by the Intergalactic Medium. Astrophys. J. 776, 125 (2013).
- 37. T. Akahori, D. Ryu, B. M. Gaensler. Fast Radio Bursts as Probes of Magnetic Fields in the Intergalactic Medium. Astrophys. J. 824, 105 (2016).
- 38. T. Eftekhari, E. Berger. Associating Fast Radio Bursts with Their Host Galaxies. Astrophys. J. 849, 162 (2017).
- 39. G. Kauffmann, et al.. The host galaxies of active galactic nuclei. Mon. Not. R. Astro. Soc. 346, 1055 (2003).
- 40. R. Cid Fernandes, et al.. Alternative diagnostic diagrams and the ‘forgotten’ population of weak line galaxies in the SDSS. Mon. Not. R. Astro. Soc. 403, 1036 (2010).
- 41. S. Inoue. Probing the cosmic reionization history and local environment of gamma-ray bursts through radio dispersion. Mon. Not. R. Astro. Soc. 348, 999 (2004).
- 42. K. Bannister, et al. FREDDA - A fast, real-time engine for de-dispersing amplitudes Astrophysics Source Code Library https://ascl.net/code/v/2273
- 43. B. Zackay, E. O. Ofek. An Accurate and Efficient Algorithm for Detection of Radio Bursts with an Unknown Dispersion Measure, for Single-dish Telescopes and Interferometers. Astrophys. J. 835, 11 (2017).
- 44. R. J. Sault, P. J. Teuben, M. C. H. Wright, Astronomical Data Analysis Software and Systems IV, R. A. Shaw, H. E. Payne, J. J. E. Hayes, eds. (1995), vol. 77 of Astronomical Society of the Pacific Conference Series, p. 433.
- 45. A. T. Deller, et al.. DiFX-2: A More Flexible, Efficient, Robust, and Powerful Software Correlator. Pub. Astron. Soc. Pacific 123, 275 (2011).
- 46. E. W. Greisen, Information Handling in Astronomy - Historical Vistas, A. Heck, ed. (2003), vol. 285 of Astrophysics and Space Science Library, p. 109.
- 47. J. P. McMullin, B. Waters, D. Schiebel, W. Young, K. Golap, Astronomical Data Analysis Software and Systems XVI, R. A. Shaw, F. Hill, D. J. Bell, eds. (2007), vol. 376 of Astronomical Society of the Pacific Conference Series, p. 127.
- 48. A. T. Deller, et al.. Microarcsecond VLBI Pulsar Astrometry with PSR II. Parallax Distances for 57 Pulsars. Astrophys. J. 875, 100 (2019).
- 49. M. Kettenis, H. J. van Langevelde, C. Reynolds, B. Cotton, Astronomical Data Analysis Software and Systems XV, C. Gabriel, C. Arviset, D. Ponz, S. Enrique, eds. (2006), vol. 351 of Astronomical Society of the Pacific Conference Series, p. 497.
- 50. L. Petrov, A. de Witt, E. M. Sadler, C. Phillips, S. Horiuchi. The Second LBA Calibrator Survey of southern compact extragalactic radio sources - LCS2. Mon. Not. R. Astro. Soc. 485, 88 (2019).
- 51. S. Johnston, M. Kerr. Polarimetry of 600 pulsars from observations at 1.4 GHz with the Parkes radio telescope. Mon. Not. R. Astro. Soc. 474, 4629 (2018).
- 52. R. N. Manchester, et al.. The Parkes Pulsar Timing Array Project. Publ. Astron. Soc. Australia 30, e017 (2013).
- 53. P. A. Hamilton, P. M. McCulloch, R. N. Manchester, J. G. Ables, M. M. Komesaroff. Detection of change in rotation measure of the VELA pulsar. Nature 265, 224 (1977).
- 54. F. Feroz, M. P. Hobson, M. Bridges. MULTINEST: an efficient and robust Bayesian inference tool for cosmology and particle physics. Mon. Not. R. Astro. Soc. 398, 1601 (2009).
- 55. G. M. Bernstein, et al.. Astrometric Calibration and Performance of the Dark Energy Camera. Pub. Astron. Soc. Pacific 129, 074503 (2017).
- 56. I. Appenzeller, et al.. Successful commissioning of FORS1 - the first optical instrument on the VLT. The Messenger 94, 1 (1998).
- 57. W. Freudling, et al.. Automated data reduction workflows for astronomy. The ESO Reflex environment. Astron. & Astrophys. 559, A96 (2013).
- 58. M. R. Blanton, S. Roweis. K-Corrections and Filter Transformations in the Ultraviolet, Optical, and Near-Infrared. Astron. J. 133, 734 (2007).
- 59. D. Lang, D. W. Hogg, K. Mierle, M. Blanton, S. Roweis. Astrometry.net: Blind Astrometric Calibration of Arbitrary Astronomical Images. Astron. J. 139, 1782 (2010).
- 60. D. G. Monet, et al.. The USNO-B Catalog. Astron. J. 125, 984 (2003).
- 61. P. Morrissey, et al.. The Keck Cosmic Web Imager Integral Field Spectrograph. Astrophys. J. 864, 93 (2018).
- 62. KCWI Data Extraction and Reduction Pipeline. https://github.com/Keck-DataReductionPipelines/KcwiDRP/
- 63. G. B. Berriman, J. C. Good. The Application of the Montage Image Mosaic Engine To The Visualization Of Astronomical Images. Publications of the Astronomical Society of the Pacific 129, 058006 (2017).
- 64. I. M. Hook, et al.. The Gemini-North Multi-Object Spectrograph: Performance in Imaging, Long-Slit, and Multi-Object Spectroscopic Modes. Pub. Astron. Soc. Pacific 116, 425 (2004).
- 65. G. Gimeno, et al., Ground-based and Airborne Instrumentation for Astronomy VI (2016), vol. 9908 of Proc. SPIE., p. 99082S.
- 66. PypeIt, The Python Spectroscopic Data Reduction Pipeline. https://pypeit.readthedocs.io
- 67. R. Bacon, et al., Ground-based and Airborne Instrumentation for Astronomy III (2010), vol. 7735 of Society of Photo-Optical Instrumentation Engineers (SPIE) Conference Series, p. 773508.
- 68. P. M. Weilbacher, et al., Astronomical Data Analysis Software and Systems XXIII, N. Manset, P. Forshay, eds. (2014), vol. 485 of Astronomical Society of the Pacific Conference Series, p. 451.
- 69. K. T. Soto, S. J. Lilly, R. Bacon, J. Richard, S. Conseil. ZAP - enhanced PCA sky subtraction for integral field spectroscopy. Mon. Not. R. Astro. Soc. 458, 3210 (2016).
- 70. L. Staveley-Smith, et al.. The Parkes 21 CM multibeam receiver. Publ. Astron. Soc. Australia 13, 243 (1996).
- 71. M. J. Keith, et al.. The High Time Resolution Universe Pulsar Survey - I. System configuration and initial discoveries. Mon. Not. R. Astro. Soc. 409, 619 (2010).
- 72. B. R. Barsdell, M. Bailes, D. G. Barnes, C. J. Fluke. Accelerating incoherent dedispersion. Mon. Not. R. Astro. Soc. 422, 379 (2012).
- 73. C. Y. Peng, L. C. Ho, C. D. Impey, H.-W. Rix. Detailed Decomposition of Galaxy Images. II. Beyond Axisymmetric Models. Astron. J. 139, 2097 (2010).
- 74. S. Noll, et al.. Analysis of galaxy spectral energy distributions from far-UV to far-IR with CIGALE: studying a SINGS test sample. A&A 507, 1793 (2009).
- 75. D. A. Dale, et al.. A Two-parameter Model for the Infrared/Submillimeter/Radio Spectral Energy Distributions of Galaxies and Active Galactic Nuclei. ApJ 784, 83 (2014).
- 76. G. Bruzual, S. Charlot. Stellar population synthesis at the resolution of 2003. MNRAS 344, 1000 (2003).
- 77. G. Chabrier. Galactic Stellar and Substellar Initial Mass Function. PASP 115, 763 (2003).
- 78. D. Calzetti, et al.. The dust content and opacity of actively star-forming galaxies. ApJ 533, 682 (2000).
- 79. C. Leitherer, I.-H. Li, D. Calzetti, T. M. Heckman. Global Far-Ultraviolet (912-1800 Å) Properties of Star-forming Galaxies. Astrophys. J. 140, 303 (2002).
- 80. I. Pessa, N. Tejos, C. Moya. PyMUSE: a Python package for VLT/MUSE data. arXiv:1803.05005 (2018).
- 81. M. Cappellari, E. Emsellem. Parametric Recovery of Line-of-Sight Velocity Distributions from Absorption-Line Spectra of Galaxies via Penalized Likelihood. PASP 116, 138 (2004).
- 82. M. Cappellari. Improving the full spectrum fitting method: accurate convolution with Gauss-Hermite functions. MNRAS 466, 798 (2017).
- 83. A. Vazdekis, et al.. Evolutionary stellar population synthesis with MILES - I. The base models and a new line index system. MNRAS 404, 1639 (2010).
- 84. J. A. Cardelli, G. C. Clayton, J. S. Mathis. The relationship between infrared, optical, and ultraviolet extinction. ApJ 345, 245 (1989).
- 85. D. E. Osterbrock, G. J. Ferland, Astrophysics of gaseous nebulae and active galactic nuclei (University Science Books, Sausalito, CA, 2006).
- 86. Planck Collaboration, et al.. Planck 2015 results. XIII. Cosmological parameters. Astron. & Astrophys. 594, A13 (2016).
- 87. B. P. Moster, et al.. Constraints on the Relationship between Stellar Mass and Halo Mass at Low and High Redshift. Astrophys. J. 710, 903 (2010).
- 88. K. Ioka. The Cosmic Dispersion Measure from Gamma-Ray Burst Afterglows: Probing the Reionization History and the Burst Environment. Astrophys. J. 598, L79 (2003).
- 89. W. Deng, B. Zhang. Cosmological Implications of Fast Radio Burst/Gamma-Ray Burst Associations. Astrophys. J. 783, L35 (2014).
- 90. D. Fielding, E. Quataert, M. McCourt, T. A. Thompson. The impact of star formation feedback on the circumgalactic medium. Mon. Not. R. Astro. Soc. 466, 3810 (2017).
- 91. Z. Hafen, et al.. The Origins of the Circumgalactic Medium in the FIRE Simulations. arXiv e-prints p. arXiv:1811.11753 (2018).
- 92. I. K. Baldry, et al.. Galaxy And Mass Assembly (GAMA): the galaxy stellar mass function at z 0.06. Mon. Not. R. Astro. Soc. 421, 621 (2012).
- 93. J. F. Navarro, C. S. Frenk, S. D. M. White. A Universal Density Profile from Hierarchical Clustering. Astrophys. J. 490, 493 (1997).
- 94. H. C. Lambert, B. J. Rickett. On the Theory of Pulse Propagation and Two-Frequency Field Statistics in Irregular Interstellar Plasmas. Astrophys. J. 517, 299 (1999).
- 95. D. C.-J. Bock, M. I. Large, E. M. Sadler. SUMSS: A Wide-Field Radio Imaging Survey of the Southern Sky. I. Science Goals, Survey Design, and Instrumentation. Astron. J. 117, 1578 (1999).
- 96. J. M. Cordes, T. J. W. Lazio. NE2001. II. Using Radio Propagation Data to Construct a Model for the Galactic Distribution of Free Electrons. astro-ph/0301598 (2003).
- 97. M. A. Krishnakumar, B. C. Joshi, P. K. Manoharan. Multi-frequency Scatter Broadening Evolution of Pulsars. I. Astrophys. J. 846, 104 (2017).
Affiliations
1 Commonwealth Science and Industrial Research Organisation, Australia Telescope National Facility, P.O. Box 76, Epping, NSW, 1710 Australia
2 Centre for Astrophysics and Supercomputing, Swinburne University of Technology, Hawthorn, VIC, 3122 Australia
3 International Centre for Radio Astronomy Research, Curtin University, Bentley WA 6102, Australia
4 University of California Observatories-Lick Observatory, University of California, 1156 High Street, Santa Cruz, CA 95064, USA
5Kavli Institute for the Physics and Mathematics of the Universe,
5-1-5 Kashiwanoha, Kashiwa, 277-8583, Japan
6 Instituto de Física, Pontificia Universidad Católica de Valparaíso, Casilla 4059, Valparaíso, Chile
7Department of Physics and Astronomy, Macquarie University, NSW 2109, Australia
8 Sydney Institute for Astronomy, School of Physics, University of Sydney, Sydney, NSW 2006, Australia
9 Astronomy Department, University of Washington, Seattle, WA 98195, USA
10 Physics Department, California Polytechnic State University, 1 Grand Avenue, San Luis Obispo, CA 93407, USA
11 Nikhef, Science Park, Amsterdam, the Netherlands
12 International Centre for Radio Astronomy Research, The University of Western Australia, M468, 35 Stirling Highway, Crawley, Perth, WA 6009, Australia
13 Space Science Division, Naval Research Laboratory, Washington, DC 20375-5352, USA
14 W. M. Keck Observatory 65-1120 Mamalahoa Hwy, Waimea, HI 96743, USA
15 Department of Physics and Astronomy, University of California at Los Angeles, Los Angeles, CA 90095-1547, USA
16 Department of Physics and Astronomy, 4129 Frederick Reines Hall, University of California, Irvine, CA, 92697, USA
17 Tim Cornwell Consulting, 17 Elgan Crescent, Sandbach CW11 1LD, United Kingdom
18 Inter-University Centre for Astronomy and Astrophysics, Post Bag 4, Ganeshkhind, Pune 411 007, India
19 Australian National University, Research School of Astronomy & Astrophysics, Canberra ACT 2611 Australia
20 Western Sydney University, Locked Bag 1797, Penrith South, NSW 2751, Australia
21 ASTRON, The Netherlands Institute for Radio Astronomy, Postbus 2, 7990 AA, Dwingeloo, The Netherlands
Acknowledgments
We are grateful to the Australia Telescope National Facilities (ATNF) operations team and the Murchison Radio-astronomy observatory staff for supporting these ASKAP searches, and the ATNF steering committee for allocating time for these observations. We thank Luca Rizzi for his support with the Keck Cosmic Web Imager instrument. K.W.B. thanks Y. Shalem for discussions. We acknowledge the Wajarri Yamatji as the traditional owners of the Murchison Radio-astronomy Observatory site. The authors recognize and acknowledge the very significant cultural role and reverence that the summit of Mauna Kea has always had within the indigenous Hawaiian community. We are most fortunate to have the opportunity to conduct observations from this mountain.
Full facility acknowledgements are provided in the supplementary materials.
Funding
K.W.B., J.P.M., and R.M.S. acknowledge Australian Research Council (ARC) grant DP180100857. A.T.D. is the recipient of an ARC Future Fellowship (FT150100415). S.O. and R.M.S. acknowledge support through ARC grant FL150100148. R.M.S. also acknowledges support through ARC grant CE170100004. N.T. acknowledges support from PUCV research funding 039.333/2018. Work at the Naval Research Laboratory is supported by NASA.
Author contributions
K.W.B. built the search and voltage capture software. A.T.D., C.P., C.K.D., S.B., W.R.A., and M.B., designed, built and conducted the correlation, calibration and imaging software to localize FRB 180924. R.M.S. drafted the manuscript, led the observing, and interpreted radio band polarization data. J.P.M., J.X.P., N.T., S.D.R. E.M.S., S.S., M.M., F.O.N-H., V.N.B., J.B, J.O’M. T.T., V.U. obtained, reduced and interpreted optical observations. M.K., E.L., E.K.M., S.O., H.Q., W.F, C.F., C.W.J., R.D., obtained, reduced, and interpreted radio data. R.D.E, T.J.B., D.C.-J.B, R.J.B, A.B., J.D.B., A.P.C. F.R.C., T.C., N.G., D.B.H., M.K., B.S.K., A.M., N.M.-G. S.N., R.P.N., M.P.,R.-Y. Q., J.R., D.N.R., T.W.S., M.A.V., C.D.W. designed, built, and commissioned ASKAP.
Competing Interests
The authors declare no competing interests.
Data and materials availability:
Based on observations collected at the European Southern Observatory under ESO programs 0102.A-0450(A) and 2102.A-5005(A) (PI: Macquart), available from http://archive.eso.org/. Observations obtained at Gemini Observatory under program GS-2018B-Q-133 (PI: Tejos) can be retrieved from https://archive.gemini.edu/. Observations from the Australia Telescope Compact Array under program C3211 (PI: Shannon), and the Parkes radio telescope under program P958 (PI: Shannon) can be retrieved from https://atoa.atnf.csiro.au/. Keck observations were obtained under project ID U176 2018B and can be retrieved from https://www2.keck.hawaii.edu/koa/
Further datasets used in this paper are available from the CSIRO Data Access Portal at https://doi.org/10.25919/5d09d22f2c004 : seven visibility data sets used to calibrate and determine the localisation of FRB 180924, the ATCA image used for astrometry, calibrated optical images and spectra, and radio images.
Data reduction scripts and code written by the co-authors for this project are available from the craft git repository https://bitbucket.csiro.au/scm/craf/craft.git and the psrvlbireduce repository https://github.com/dingswin/psrvlbireduce.
Supplementary Materials:
Materials and Methods
Supplementary Text
Figures S1 to S7
Tables S1 to S9
References (42-97)
Supplementary Materials for
A single fast radio burst localized to a massive galaxy at cosmological distance
K. W. Bannister, A. T. Deller, C. Phillips, J.-P. Macquart, J. X. Prochaska, N. Tejos, S. D. Ryder, E. M. Sadler, R. M. Shannon, S. Simha, C. K. Day, M. McQuinn, F. O. North-Hickey S. Bhandari W. R. Arcus, V. N. Bennert, J. Burchett, M. Bouwhuis, R. Dodson, R. D. Ekers, W. Farah, C. Flynn, C. W. James, M. Kerr, E. Lenc, E. K. Mahony, J. O’Meara, S. Osłowski, H. Qiu, T. Treu, V. U, T. J. Bateman, D. C.-J. Bock, R. J. Bolton, A. Brown, J. D. Bunton, A. P. Chippendale, F. R. Cooray, T. Cornwell, N. Gupta, D. B. Hayman, M. Kesteven, B. S. Koribalski, A. MacLeod, N. M. McClure-Griffiths, S. Neuhold, R. P. Norris, M. A. Pilawa, R.-Y. Qiao, J. Reynolds, D. N. Roxby, T. W. Shimwell, M. A. Voronkov, C. D. Wilson
This PDF file includes
Materials and Methods
Supplementary Text
Figures S1-S7
Tables S1-S9
S1 Materials and Methods
S1.1 Follow-up observations
A summary of the observations used in this analysis is displayed in Table S1.
S1.2 ASKAP description and configuration for FRB searching
The basic components of the ASKAP, and its FRB detection pipeline are described previously (?). We have used a similar setup. Briefly, ASKAP comprises , -m antennas, each of which has a phased-array feed (PAF) at its focus. For this work, antennas were used. Each PAF has 94 dual linear polarization receivers sensitive to the frequency range 700 to 1800 MHz. The sampled electric field from each element is digitized and channelized to 1 MHz resolution and sent to digital beamformers. For this work, the system was configured to a center frequency of MHz and bandwidth of MHz. The beamformers produce configurable dual-polarization beams by applying independent complex-valued weights to each of the ports, at MHz intervals. We used a hexagonal closed packed beam configuration (see (?), their figure S1). The beamformers produce fast-dump autocorrelation spectra by squaring and averaging the beamformed voltages over a 864 microsecond window (?). These spectra are streamed over Ethernet to a dedicated fast transient searching node and processed on a single graphics processing unit (GPU). Simultaneously, the beamformers store the beamformed voltages in a configurable circular buffer. The buffers were configured to save all 36 dual polarization beams, with the voltages quantized to 4-bit complex-valued integers with a 3.1-second buffer length. The buffer can be stopped and downloaded to disk, either manually, or under control of the detection pipeline.
S1.3 Search Pipeline
We search the data using a custom GPU-based detection pipeline termed FREDDA (Fast Real-time Engine for DeDispersing Amplitudes (?)) which is optimized for ASKAP processing and capable of detecting bursts with low latency. Firstly, the pipeline normalizes the incoming spectra to have zero mean and unit variance in blocks of 1024 time samples, by measuring the mean and variance over the previous block and subtracting the mean and dividing by the variance independently for each channel, polarization and antenna. The pipeline zero-weights channels where the mean or variance change by more than in adjacent blocks, or with excess kurtosis greater than 30. These steps effectively flag strong radio-frequency interference (RFI) from satellite transmitters. The pipeline also flags individual integrations that are a factor of ten greater than the standard deviation. This flagging could excise exceptionally bright bursts, and would flag broad band bursts with S/N above . This effectively flags RFI from aircraft transponders. After rescaling and flagging, the pipeline sums across both polarizations and antennas to produce a single dynamic spectrum for all available antennas. This incoherent sum results in an improvement in sensitivity by a factor of than a single polarization from an antenna (if the signal is unpolarized). The pipeline then performs a Fast Dispersion Measure Transform (?) - searching DM trials - equivalent to a DM range of 0-1285 with a DM resolution of 0.63 . Finally, the pipeline performs a boxcar convolution of all of the dedispersed time series with widths of 1 to 32 samples. Candidates with are transmitted as UDP packets to a second computer program that triggers the voltage buffers. This second program declares a trigger when a candidate with is detected with a width integrations. This width was chosen to reduce the number of false triggers. When these criteria are met, it stops the circular buffer and downloads the beamformer voltage buffers for the desired beam; once a download is completed, data flow into the circular buffer is restored and the system is available for a new trigger.
S1.4 Interferometry of ASKAP Voltage Data
To robustly confirm the location of the FRB, two teams independently correlated, calibrated, and imaged the burst using entirely separate software pipelines, without sharing results before each had obtained a position.
One team used a custom correlator that was originally created for commissioning purposes, which read the antenna voltage data in raw format, correlated it, and processed the resulting data in Miriad (?). The second team converted the stored antenna voltage data into a format readable by the DiFX software correlator (?) and correlated the data using this package, using incoherent dedispersion to align the FRB emission in frequency. The resulting files (in FITS-IDI format) were calibrated with standard techniques using AIPS (?); the calibrated data was then imaged using CASA version 5.3.0-143 (?) .
Both teams obtained nearly identical results, with the FRB position agreeing to within . The dataset produced by the DiFX correlator (which has been verified to sub-milliarcsecond levels of accuracy when correlating very long baseline radio interferometers (?), and hence is expected to introduce negligible systematic position offsets) was adopted as our fiducial result. Both processing pipelines were tested with a long (10-hr) observation of a strong continuum source to show a stable phase and amplitude response with time.
In order to calibrate the FRB visibility datasets, 5 hr after the detection, we observed a bright compact ( mas) radio galaxy PKS 0407658, which was placed at the center of the beam in which the burst was detected. The voltages obtained were processed identically as those for the FRB. The Vela pulsar (PSR J08344510) was observed 12 hr after the FRB was detected and a voltage download similarly triggered and correlated.
A total of seven visibility datasets were produced using DiFX and the three sets of voltage data, listed below. Each included full-polarization products and a frequency resolution of kHz, averaged post-correlation to kHz resolution.
-
•
PKS 0407658 data, correlation centered at PKS 0407658 (R.A. 04h08m20.38s, Decl. 65d45’09.08”), time resolution 1.3824 s, total integration time 3.1 s (the calibrator dataset).
-
•
FRB 180924 data, correlation centered at the ASKAP PAF beam center position (R.A. 21h45m17.83s, Decl. 41d03’34.67”), time resolution 1.3824 s, total integration time 3.1 s (the field dataset).
-
•
FRB 180924 data, correlation centered at approximate FRB position (R.A. 21h44m25.2943s, Decl. 40d53’59.9959”), time resolution 1 ms, total integration time 1ms, dedispersed with DM 361.53 (the FRB position dataset).
-
•
FRB 180924 data, correlation centered on approximate FRB position (R.A. 21h44m25.2943s, Decl. 40d53’59.9959”), time resolution ms, total integration time 3 ms, de-dispersed with DM 361.53 (the FRB structure dataset). The small offset (0.2 arcsec) between the correlated phase center and the burst position does not affect astrometric precision or accuracy.
-
•
FRB 180924 data, correlation centered at approximate FRB position (R.A. 21h44m25.2943s, Decl. 40d53’59.9959”), time resolution 33 ms, total integration time 30 ms (centered on the FRB time, but excluding 3 ms centered on the FRB itself), de-dispersed with DM 361.53 (the FRB RFI subtraction dataset).
-
•
Vela data, correlation centered at the location of the Vela pulsar (R.A. 08h35m20.61149s, Decl. 45d10’34.8751”), time resolution s, total integration time 3.1 s, de-dispersed with DM 67.99 , using pulsar gating to select only 0.9 ms from every rotation of the pulsar when the emission is brightest (the Vela dataset).
-
•
Vela data, correlation centered at the location of the Vela pulsar (R.A. 08h35m20.61149s, Decl. 45d10’34.8751”), time resolution 1.3824 s, integration time 3.1 s, de-dispersed with DM 67.99 , using pulsar gating to select 30 ms of data per Vela rotation from times adjacent to but not on the Vela pulse (the Vela RFI subtraction dataset)
By inspecting the PKS 0407658 data in the calibrator dataset, we identified and solved for residual, unmodeled antenna-based delays. Once identified, these delays were removed from the visibility datasets by re-correlating all datasets while applying the necessary delay corrections in the correlator-delay model.
Calibration solutions were derived from the calibrator data set as follows. Due to strong radio frequency interference, approximately 100 MHz of bandwidth concentrated towards the lowest frequencies of the observed band was flagged prior to the derivation of any solutions. Residual antenna-based delay and phase errors were derived using the AIPS task FRING. The flux density scale was set using the tasks SETJY and CALIB, assuming PKS 0407658 to be a 9.5 Jy, flat spectrum, unpolarized source. Finally, frequency-dependent amplitude and phase corrections accounting for the instrumental bandpass were derived using the task CPASS to interpolate over the flagged regions of spectrum. The resulting corrections were transferred from the calibrator dataset to all 6 other datasets and applied.
First, we imaged the FRB to obtain its position. To mitigate the effects of radio frequency interference, we subtracted a scaled version of the FRB RFI subtraction dataset from the FRB position dataset. Since the effect of the RFI on the visibilities is approximately constant on millisecond timescales, this effectively removes the RFI (and constant background celestial sources) from the FRB position dataset, leaving only signals that vary on millisecond timescales - i.e. the FRB itself. A custom ParselTongue script (?) was used to manipulate the visibilities directly in AIPS to perform this subtraction (the uvsubScaled.py task in the psrvlbireduce repository). We imaged this RFI subtracted dataset in CASA, initially using the task clean in widefield multifrequency synthesis mode with natural weighting, producing a pixel image with 3 arcsec pixels. Once the source location was identified, we re-imaged the data producing a smaller pixel image with a 1 arcsec pixel centered on the FRB. We estimated the position and flux density of the FRB, and the corresponding uncertainties, using the AIPS task JMFIT.
Since the FRB is observed to be highly polarized and predominantly detected in only one linearly polarized receptor (Y), we extracted positions using only the YY polarization image, which has the highest signal to noise ratio. A simple combination of the entire 336 MHz bandwidth yielded a detection significance of . However, this is not an optimum approach for a source whose amplitude varies substantially across the observing band such as FRB 180924. To account for this and produce the highest possible S/N on the FRB, we first produced an image cube with 4 MHz resolution and used this to estimate the FRB flux density ratio (the ratio of instantaneous flux density to frequency-averaged flux density) as a function of frequency. We then used this estimate to re-weight and re-scale the FRB data with the uvfrbwt task (see the CRAFT repository), dividing the visibility amplitudes by the FRB flux density ratio and multiplying the visibility weights by the FRB flux density ratio squared. This has the effect of normalizing the FRB amplitude to a constant value across the band while up-weighting the regions where the FRB is bright and down-weighting regions where it is faint.
Using this rescaled and reweighted dataset, we obtained a detection of significance 184, with position (J2000) of R.A. 21h44m25.255s 0.003s and Decl. 40d54’00.10” 0.04”, where the uncertainties are the statistical values reported by JMFIT only. We find that the position of the source changes by a root-mean-square value of 70 mas in both R.A. and Decl. when we change the weighting used in the imaging, which exceeds the statistical uncertainty from JMFIT. We therefore use the larger 70 mas value as an estimate of the astrometric uncertainty for the burst position.
As a cross-check, we imaged only the upper regions of the frequency spectrum using the non-RFI subtracted FRB position dataset and obtained a consistent position with a larger uncertainty due to the lower signal-to-noise ratio. We also extracted the positions from each plane of the 4 MHz resolution image cube, confirming that they gave results consistent with the best-fitting position as a function of frequency.
To analyze the polarization properties of the burst, we produced a full Stokes image cube using the RFI-subtracted FRB position dataset, with a frequency resolution of MHz. We used the casaviewer tool to extract the mean pixel value within a small window centered on the best fit FRB position in each image slice, thereby obtaining the FRB spectrum in each Stokes parameter at MHz spectral resolution. We repeated the polarization analysis and positional analysis described above with the Vela datasets, performing RFI subtraction and imaging in an analogous manner. To determine if there is an offset between the YY and I frames, we compared the positions of continuum sources in the field derived from the YY and Stokes- images. We found the positions were consistent to within measurement uncertainty.
Finally, we imaged the FRB field dataset using CASA to determine the location of radio continuum sources that could be used to register the FRB position derived above in the International Celestial Reference Frame (ICRF3).
Since no RFI subtraction could be performed with this dataset, regions of strong RFI (as noted above, concentrated in the lower half of the band, and predominantly due to satellite transmitters) were identified and flagged prior to imaging, leaving 205 MHz of usable bandwidth. We made use of the CASA task TCLEAN task using multi-scale multi-frequency synthesis and two Taylor terms to account for real or instrumental spectral index effects. Initially, a Stokes- image was made using natural weighting. Six continuum sources were detected above a S/N of 10, with 3 being sufficiently compact and bright to be useful for astrometry. The positions of each ASKAP source were extracted using the AIPS task JMFIT (see Table S2).
In addition to the multi-frequency synthesis image spanning the full ASKAP bandwidth, we produced a Stokes-I image cube with 4-MHz resolution, yielding 58 (out of 83) 4 MHz frequency channels that could be used for fitting, and which were unaffected by RFI. Extracting positions for the brightest source, PKS 2144418 from each channel of the cube showed no significant deviations as a function of frequency across the band. Stokes , , and image cubes were also produced along with multi-frequency synthesis Stokes , , and images to determine the level of polarization leakage, yielding no significant detections in the polarized Stokes parameters and a typical detection upper limit leakage range for each of 10-15%.
After imaging the FRB field, we used the GAINCAL task in CASA to derive phase-only self-calibration solutions, using the ASKAP model of the field sources. A single solution was derived per antenna, spanning the entire integration time and bandwidth. The phase corrections derived in this manner were small (averaging a few degrees) and consistent with the noise expected given the ASKAP sensitivity and the brightness of the sources in the field. Application of these self-calibration solutions did not substantially improve the dynamic range of the image, and so the self-calibration solutions were not applied to either this dataset or any of the FRB datasets.
S1.5 Radio Astrometry
To tie the ASKAP positions to the International Celestial Reference Frame (ICRF3) we observed the three bright continuum sources detected with ASKAP (PKS 2144418,SUMSS J214421412640 and SUMSS J214438411835, see Table S2) with the Australia Telescope Compact Array (ATCA) on 2018 October 5. The observations were carried out from 1.1-3.1 GHz in the 6A configuration (which has baselines as long as 6 km) to maximise overlap with the ASKAP frequency band and angular resolution. Four ATCA phase calibrators (PKS 2106413, PKS 2211388, PKS 2052474 and PKS 2054377) were interspersed throughout the observations, spending 2 mins integration time on each of the calibrators and 4 mins on the ASKAP-detected sources.
This process was repeated for a total of 11 hrs to maximize coverage of the u-v plane. The four phase calibrators used were selected to have very small phase closure defects on 6-km baselines and small position uncertainties.
A significant amount of the band between 1.1-2.1 GHz was affected by RFI so only the 2.1-3.1 GHz band was used in the data reduction. The data was flagged, calibrated and imaged using standard Miriad tasks. We used robust= (close to uniform) resulting in beam sizes ranging from arcsec. Positions and associated errors were extracted using IMFIT and fitting a point source.
We investigated the ATCA astrometric uncertainties by calibrating using each phase calibrator separately, and applying the calibration solution to the remaining three calibrators and imaging and extracting the positions as described above. We found large errors in PKS 2211388 which we suspect is due to structure in the source. The position extracted from the images agreed with the cataloged position within 100 mas in all other cases, with the measurement uncertainties typically 10 mas. We calibrated the target sources based on the phase calibrator PKS 2052474 only, which is a Defining source for the ICRF3 frame.
Of the three ASKAP-detected sources, only PKS 2144418 was detected in the ASKAP data with sufficient S/N to enable a useful measure of the astrometric uncertainties. The measured positions for this source from ATCA, ASKAP, VLBI and DES are shown in Figure S1. For this source, the offset between the ATCA and ASKAP positions is mas in R.A. and mas in Decl., where the 1 errors are the measurement errors for ASKAP and ATCA positions (dominated by the ASKAP positions), added in quadrature. We find no evidence for a systematic offset larger than the measurement errors when comparing the ASKAP and ATCA astrometry. Any systematic error is likely smaller than the measurement uncertainties quoted in Table 1. We therefore adopt a conservative estimate of systematic errors in ASKAP positions of 90 mas.
For FRB 180924, we add this systematic error in quadrature to the 70 mas measurement error and obtain 120 mas uncertainties in the position of FRB 180924.
We also compared the ASKAP and ATCA positions of PKS 2144418 with a VLBI-measured position from the radio fundamental catalog (RFC version 2018c, (?)). Asymmetric morphology can cause shifts in the radio positions measured with different angular resolutions, but in this case both the ATCA and ASKAP positions agree with the VLBI position within 50 mas, providing a further confirmation that our estimate of 90 mas for the systematic uncertainty is robust, and that our final position for the FRB is firmly anchored in the ICRF.
Finally, the position of the optical counterpart for PKS 2144418, from the DES catalog, is also shown in Figure S1. While the uncertainty in the DES position is much larger than that for the radio sources, we obtain agreement between the optical and radio positions after applying the required shift to the DES frame (see below).
S1.5.1 Comparison between incoherent and interferometric localization methods
The interferometric detection enabled the test of a previous incoherent detection algorithm used to localize bursts. ASKAP FRBs are typically detected in multiple beams as the PAF beams oversample the focal plane. By using the detected signal to noise ratios and the beam positions, it is possible to get a localization precision arcmin (90%), where is the beam width at half power ( for the observations here) and S/N is the burst signal to noise ratio in the strongest detection. This algorithm was employed on previous ASKAP detections and has been described in detail (?). FRB 180924 was detected strongly (S/N7) in two beams and had moderate detections (S/N4) in two additional beams. In all beams adjacent to the primary detection the burst had a measured S/N2 (The algorithm for measuring S/N is two sided. Beams distant from the burst position on the sky would have 50% probability of being negative). The burst position derived from this algorithm is consistent with the arcsecond localization (see Figure S2). The maximum likelihood position derived using the incoherent technique is only arcsec distant from the interferometric position, so is much smaller than the quoted arcmin uncertainty on the incoherent position. This could be the result of good fortune, or of conservative assumptions applied in the incoherent algorithm. In particular, the algorithm incorporates uncertainties in beam sensitivities, shapes and positions that may be overestimated.
S1.6 FRB Polarimetry: Calibration
Full-Stokes data products were produced by DiFX as described above. This provided datasets that had been calibrated in Stokes . However the bandpass calibration does not calibrate the other Stokes parameters. The largest polarization defect in the observations is an unknown phase and delay between the two linearly polarized beams. The delay will cause a frequency dependent conversion of linear to circular polarization (in particular from stokes into ), and vice versa. The measured values of U and V in the case of a phase offset and a delay at a frequency are
| (S1) |
and
| (S2) |
We calibrated the data products by comparing observations of the Vela pulsar taken with ASKAP and those taken with Parkes. The pulsar has well defined polarization properties (?), with the pulse showing strong (%) linear polarization with modest Faraday rotation (RM rad m-2), and approximately 5% circular polarization.
We formed a spectrum of the Vela pulsar from data taken with ASKAP 10 h after the FRB was detected: this is the Vela data set described above. We produced a model for the frequency dependence of the pulse profile in this band using publicly available observations from the 64-m Parkes radio telescope, which can largely cover the ASKAP band. The Parkes data were calibrated for differential gain and phase, as well as feed ellipticity, and followed techniques described previously (?). We produced models for the expected relative values for , , and , relative to .
The model for the polarization for the Vela pulsar is:
| (S3) | |||
| (S4) | |||
| (S5) | |||
| (S6) |
The polarization position angle is modeled to be
| (S8) |
and is the polarization position angle at a reference frequency of 1.4 GHz. We fit this to the Parkes data to find RM = rad m-2 and rad. While higher than the cataloged value, the rotation measure of the Vela pulsar is known to vary (?).
While in principle we know the orientation of the ASKAP beams on the sky, we use the polarization model to solve for this (which causes the leakage of Stokes into and vice versa). Thus the measured values of the Stokes parameters (, , and ) relative to the model are:
| (S9) | |||
| (S10) | |||
| (S11) |
In practice, we solve these equations by first solving for using . We then calculate and and using . We then apply this calibration solution to the FRB data to determine the FRB rotation measure.
Bayesian methodology is used to calculate the rotation measure for the FRB using the calibrated data. We measured the rotation measure by fitting the fractional polarization in the calibrated and for each channel.
The model values for and are then:
| (S12) |
and
| (S13) |
where the position angle is
| (S14) |
We assume the noise is identical in and , and is Gaussian distributed with no frequency dependence.
The likelihood in this case is:
| (S15) |
We calculate the posterior probabilities for the parameters (, , and ). is a nuisance parameter so we analytically marginalize over it, assuming uniform priors. The final likelihood is then
| (S16) |
We assume uniform priors on , , and Gaussian priors on and , with the means of and set to their maximum-likelihood values from the Vela-pulsar fit and the standard deviations set to the fit uncertainties. We sample the posterior distribution using a nested-sampling algorithm (?). The method was tested by measuring the rotation measure of well known pulsars using observations from the -m Parkes radio telescope. The frequency-averaged Stokes parameters (after correcting for Faraday rotation) can be found in Table S3.
S1.7 Optical Astrometry
We referenced positions of the host dark energy survey (DES, (?)) galaxy to the optical reference frame using Gaia (?). The Gaia reference frame is known to be well aligned with ICRF3 used for radio astrometry (?). We use the DES image and catalog to conduct astrometry, rather than the deeper VLT image (discussed below), because the imaging camera used for DES has been well characterized (?). The wide field of view ensures that many stars are within a single image, enabling a robust comparison of the DES astrometry from that of Gaia.
From the DES Data Release 1 (DR1) catalog, we selected sources in a 0.2 deg square around the FRB position that had a g-band magnitude less than 21 and were stellar or quasi stellar as determined using the cataloged SPREAD parameter. We selected sources as being quasi stellar using SPREAD 0.003. In total, 111 sources in the DES catalog satisfied these criteria. We cross-matched the DES sources with the Gaia catalog and found unique identifications for all of them.
The DES DR1 comprises data from the first 3 seasons of DES (starting in 2013.63 and ending at 2016.14, Ref. (?)). To account for proper motion, we referenced the Gaia sources (which have measured proper motions and positions defined at epoch 2015.5) to DES, which we assumed to be observed at epoch 2014.9, which is the mean of the start of the first season and the end of the last season. We found that accounting for source proper motion did not substantially affect the astrometric offset between DES and Gaia positions, but did reduce the root-mean-square scatter in the positions (Table S4).
We plot the R.A. offset and Decl. offset in Figure S3 and find no evidence for any correlation between the offsets in axes. Similarly, plotting R.A. offset vs R.A. and Decl. offset vs Decl. in Figure S4 we find no evidence for large systematic errors in the position, other than a shift, between DES and Gaia positions in the 0.2 degree field we investigated.
S1.8 FORS2 Optical imaging
Observations of the host galaxy of FRB 180924 were carried out in service mode (i.e., queued observing) with the FORS2 instrument (?) mounted on Unit Telescope 1 (Antu) of the European Southern Observatory’s Very Large Telescope (VLT) on 2018 Nov 9 UT. Five exposures of 500 s in the g_HIGH filter with incremental offsets of 10′′ between each were followed by s exposures in the I_BESS filter with similar offsets. The Standard Resolution collimator was used with binning of the CCD array to yield a pixel scale of 0.25′′ per pixel. Skies were photometric, and the seeing varied between 0.7 and 1.3′′.
Standard image processing was performed using version 2.9.1 of the ESO Reflex (?) pipeline. The dithered images in each filter were registered and co-added using a custom script and tasks in v2.16 of iraf. The zero-point for -band was taken from ESO’s nightly monitoring program, while DES -band imaging of the surroundings to FRB 180924 was used to calibrate the g_HIGH imaging. Summing up the flux from the FRB host galaxy, and using transformations between the and filters (?) we find and . For comparison, the integrated magnitudes from the DES Catalog (?) are and .
Astrometry for the FORS2 mosaics in g- and I-band was refined using astrometry.net (?) and the United States Naval Observatory (USNO) B1.0 catalog (?).
S1.9 Keck-KCWI Integral-field spectroscopy
On UT 04 October 2018, we executed a Target of Opportunity observation of the field surrounding FRB 180924 with the Keck Cosmic Web Imager (KCWI; Ref. (?)) instrument on the W.M. Keck II telescope. This integral field unit (IFU) spectrometer was configured with its medium slicer giving an approximately arcsec arcsec field-of-view and the instrument was rotated to deg. west of the parallactic angle. We employed the BL grating tilted to a central wavelength of approximately Angstrom given a resolving power of 1,800 and wavelength coverage spanning Angstrom. Beginning at 06:47 UTC, we obtained a series of four, -s exposures with small ( 1 arcsec) offset dithers in-between. The data were taken under good conditions but at a high airmass (). A series of calibration images were taken during the preceding afternoon.
The spectral images were processed with the KCWI data reduction pipeline v1.1.0 (?) which solves for the wavelength and geometric solutions to generate a sky-subtracted IFU data cube. Using a sensitivity function derived from an observation of the flux standard star BD+284211, the data cubes were then flux calibrated. Each spaxel in this cube has a rectangular dimension of approximately 0.7 arcsec 0.29 arcsec. Using the Montage software package (?), we then combined the image frames, and produced a final cube with square 0.29 arcsec 0.29 arcsec pixels aligned with the parallactic. Lastly, we extracted the galaxy spectrum using the 5 5 spaxels surrounding its center, summed without weighting (i.e. boxcar). The wavelengths of this spectrum were corrected to vacuum and into the heliocentric reference frame. From the observed [O ii] emission and Ca H+K absorption, we estimate the galaxy redshift to be = 0.3214 and estimate an uncertainty of approximately 30 km s-1 due to asymmetries in the spectral features and systematics in the wavelength calibration.
S1.10 Gemini-GMOS long-slit spectroscopy
On 2018 Oct 5 UT we triggered Target of Opportunity (ToO) observations of two galaxies (B and C in Figure 2 of the main text) located near the localization of FRB 180924 with the GMOS spectrograph (?, ?) mounted on the Gemini South telescope. Specifically, we centered a long slit (1 arcsec width) on galaxy A, oriented with a position angle of PA= degrees to cover the neighboring galaxy B. Observations were carried out in dark time, airmass below 1.08, seeing between arcsec, and thin cirrus. Four individual exposures of s were taken using the R400 grating centered at Å with the blocking filter GG455 and a CCD binning. This configuration gives a spectral coverage of Å at a resolving power of at Å, respectively, and with a dispersion of Å per pixel. Calibration images for flat fielding, bias subtraction, and wavelength calibration were also acquired. These spectral images were reduced using the PypeIt package (?) using standard techniques for image processing, extraction, calibration, and coadding.
From the GMOS data (Figure 2C-D ) we confirmed the redshift of each galaxy as first estimated from the Keck observations. These data also demonstrated the relatively weak H emission for galaxy A (suggesting internal extinction) and an unusually high [NII]/H flux ratio (suggesting an AGN or LINER emission).
S1.10.1 VLT-MUSE integral-field spectroscopy
We obtained data from the Multi Unit Spectroscopic Explorer (MUSE) (?) mounted on UT4 (Yepun) of the VLT on 2018 Nov 5 UT, in gray time, airmasses between and DIMM seeing between arcsec. Four individual exposures of 628 s were taken in the MUSE Wide Field Mode - Adaptive Optics (WFM-AO) mode, roughly centered on galaxy A. Each exposure was taken with a small spatial dithering offset of 1 arcsec and at a position angle (PA) offset of 90 degrees with respect to the previous one starting with a PA deg, to reduce the effects of bad pixels and difference in illumination between the individual image slicers in a given spaxel.
The individual exposures were reduced and combined with the standard European Southern Observatory (ESO) MUSE pipeline version 2.4 (?), to produce a combined datacube of total exposure time of 2512 s. The wavelength coverage of the datacube is Å at a resolving power of , respectively, and with a dispersion of Å per pixel. The spectral range between Å has been blocked out to avoid contamination from the NaD laser emission used in the AO mode. The final field of view is about arcmin2 with a spatial pixel scale of arcsec per pixel. Given the WFM-AO mode, the effective seeing of the combined datacube is arcsec. In order to improve the sky subtraction we run the Zurich Atmospheric Purge (ZAP) pipeline (?) version 2.0, masking out bright objects before defining the overall sky level.
The MUSE astrometric solution from the standard pipeline showed a systematic offset of about arcsec, which we corrected as follows. First, we created a mock -band image from the MUSE datacube, and then imposed the astrometric centroid of galaxy A from this image to match that of the DES -band image. In this manner, we made the MUSE astrometry to match that of DES. Then, we applied an extra smaller offset to pass from the DES astrometry to that of Gaia-based (?) astrometry described above ( mas in R.A. and mas in Declination).
The MUSE data allowed for a more complete spectroscopic search for sources at the position of FRB 180924. We confirmed the redshifts of galaxies A and B, as well as a third source about arcsec to the North East of galaxy A, referred to as galaxy C, having (see Figure 2). A fourth source about arcsec to the West of galaxy A has a larger redshift of and is not considered further. In summary, MUSE observations confirmed that galaxies A, B and C are the only sources within a radius of arcsec from the FRB position to a conservative limit of , also corroborated by the deep deep imaging (Figure 2).
S1.11 Searches for repeated pulses
Observations of the field were taken with the 64-meter Parkes radio telescope, on 2018-10-02 for hr and on 2018-10-16 for hr. The telescope was pointed at the position derived using the fly’s-eye localization method presented previously (?) as the sub-arcsecond position had not been determined at the time of the observations. As discussed in Section S1.5.1, this position (and hence the telescope pointing) was offset from the true FRB position by approximately 30 arcsec, much smaller than the nominal arcmin uncertainty quoted for the fly’s-eye method, and much smaller than the Parkes beam.
Observations were conducted with the 20-cm multibeam receiving system (?). Data were recorded with the Berkeley-Parkes Swinburne Recorder (?), with s time resolution and kHz spectral resolution, over a MHz use-able bandwidth The data were searched in real-time for radio pulses using Heimdall (?). No pulses were detected above a S/N of at the dispersion measure of the burst nor at any other dispersion measure between 10 and . The system system equivalent flux density of the central beam of the multibeam system is approximately Jy, so the limiting fluence for a pulse of with is Jy ms.
S1.12 ATCA 4-cm observations
Observations of the field were taken with the ATCA at 5.5 and 7.5 GHz to search for compact, continuum emission associated with the FRB. Initial observations were carried out 24 hr after the detection of the FRB. Since these observations were taken prior the sub-arcsec determination of the burst position, three pointings were observed to cover the localization region determined by the incoherent array detection method applied to previous fly’s-eye detections with ASKAP (?, ?). The array was in the 750C configuration (5 of the 6 antennas within -m of one another, with the remaining antenna approximately -km distant) leading to a resolution of of 7.8 1.1 arcsec at GHz and 5.7 0.8 arcsec at GHz using Briggs weighting with robust. The total observation duration (including calibration and overhead) was hr. No continuum source was found at the location of the FRB or anywhere in the host galaxy.
Follow-up observations in the more extended 6A configuration (maximum baseline length of 6 km) were carried out at the same frequencies on 2018 October 4, 10 days post-burst. A single pointing was observed at the known position of the FRB for 5 hrs reaching rms of , Jy at and GHz. The radio galaxy, PKS 1934638 was used as the bandpass and primary calibrator for both observations, while PKS 2106413 and PKS 2211388 were used for phase calibration for each observation respectively. Again, no continuum source was detected at the location of the FRB or in the host galaxy.
The calibrated visibilities from these two observations were combined and re-imaged using natural weighting to achieve a spatial resolution of 8.02.2 arcsec and an rms of 6.8 Jy beam-1 at the position of the FRB. Using a redshift of and assuming a flat spectral index this results in a upper limit on the radio spectral luminosity of W Hz-1 at 6.5 GHz, a factor of times smaller than luminosity of the persistent source associated with FRB 121102 (?).
S1.13 ASKAP radio-continuum observations
We observed the field in the vicinity of FRB 180924 during commissioning of ASKAP on 2018 September 26 10:01 (UTC). The duration of the observation was 10 h with a total of 13 ASKAP antennas at a central frequency of 1344 MHz and a bandwidth of 288 MHz. As FRB 180924 was situated within 12 arcmin of the center of beam 18 of the ASKAP closepack36 footprint, only that beam was processed. The bandpass and flux scale was calibrated using observations of the primary calibrator PKS B1934638 with CASA (?). Deconvolution was performed with the CASA task clean using the Briggs weighting scheme (robust). The resulting image was restored with a arcsec arcsec beam (position angle 34∘ ) and achieved a root-mean-square sensitivity of 150 Jy beam-1.
S1.14 Host-galaxy analysis
S1.14.1 Morphology
We have assessed the stellar morphology of the host galaxy, using the VLT/FORS2 data, with the GALFIT software package (?). We used the image of a nearby star as an estimate of the point spread function (PSF). It has a DES -band magnitude of and was chosen because it was the closest star that was not saturated in the DES imaging. The same star was also used for analysis of our MUSE and FORS2 data. We fitted the galaxy with a Sérsic profile and the sky background with a constant value. The sky background fit was of the peak value of the galaxy surface brightness. Analysis of the DES -band image yields an effective radius kpc which is within the uncertainty of the Nyquist sampling (2 pixels), i.e., the galaxy is not well-resolved. The analysis further yields an estimated Sérsic index with preferred. These span the range from an exponential disk to a more bulge-dominated system. We also measure an axis-ratio indicative of a disk-like profile and a position angle of PA deg. Adopting this model, the FRB event occurred at a radius that encompasses of the stellar light.
We have repeated the GALFIT analysis with a pseudo-narrow band (NB) image at H generated from the MUSE data cube and recover similar results but with a lower central Sérsic index ( is preferred). Based on the GALFIT residuals, we can also conclude that the the galaxy does not show any obvious excess or absence of H flux at the position of the FRB 180924 with respect to the overall smooth distribution modeled.
The same exercise was also performed for the FORS2 I band data and this gave us tighter bounds on the index, . The estimated light fraction within the radius corresponding to the FRB is . We caution again, that the galaxy is not well-resolved by these ground-based images with typical seeing of arcsec.
S1.14.2 Photometry
The host galaxy of FRB 180924 is detected in all five bands of the DES DR1 survey (?). The galaxy is also detected in the W1 and W2 bands of the WISE all-sky survey. Table S5 summarizes this set of photometric measurements, all of which were taken from the DES DR1 release and its cross-matched WISE catalog (?). The galaxy has a color (roughly corresponding to rest-frame at ), which is indicative of a galaxy with limited recent star formation.
We performed an SED analysis of the galaxy photometry with the CIGALE software package (?). The grid of SEDs that defined the model search space includes allowances for an AGN contribution (?) and nebular emission. The stellar population models (?), use a ‘periodic’ star-formation history (SFH) model characterized by a number of exponentially decaying starburst episodes assuming a standard (?) initial mass function (IMF). Both the stars and gas are attenuated by model composted of standard extinction curves ( (?), (?)) with a 2175 Å bump feature.
Figure 3 compares the best-fitting model from CIGALE with the observed fluxes, demonstrating agreement with the data. This model is dominated by stellar emission from the population of older stars, both by mass and luminosity (at optical and near-IR wavelengths). The SFH-weighted age is 5.5 Gyr and the model Star Formation Rate (SFR) exhibits a monotonic, decreasing rate over the past 10 Gyr.
The stellar mass is estimated at for the assumed IMF. The fitting results in a non-negligible selective extinction, mag, for the dominant, old stellar component. Table S7 summarizes the best-fitting parameters and estimated uncertainties from the Bayesian methods used in CIGALE. There are potentially substantial degeneracies in the results, e.g., between dust extinction and estimated star-formation rate. Furthermore, the results have modest dependence on the allowed parameterization of the SFH. For example, a model which combines an old-and-dead stellar component with a younger, recently formed component yields an lower stellar mass. Nevertheless, the preferred model is an old galaxy with a declining SFH and low current SFR (consistent with zero; see below for an upper limit derived from H line-emission). The best-fitting model includes a small AGN component, but its estimated contribution is consistent with zero.
S1.14.3 Spectroscopy
Our spectroscopy includes long-slit observations with the Gemini-S/GMOS spectrograph and IFU datacubes with the Keck/KCWI and VLT/MUSE. Of these, the VLT/MUSE dataset has the highest S/N over the widest wavelength coverage and we focus on that dataset; results are consistent between spectrometers. From the MUSE datacube, we constructed a 1D spectrum of the host galaxy by optimally coadding its spaxels weighting by the total flux in the white-light image and renormalizing to conserve total flux within an aperture. For this we used the PyMUSE software (?), defining an elliptical aperture comprising the full spatial extent of the galaxy A but avoiding flux from galaxies B and C. This optimal extraction is robust to changes in the edge limits of the aperture, because spaxels with total flux consistent with the sky level have effectively zero weight. We then employed the pPXf software package (?, ?) on the extracted 1D spectrum. The software fits a set of stellar population models and nebular emission lines to an input spectrum to assess the kinematics and stellar composition of the galaxy. For the stellar spectra, which vary in age and metallicity, we employ models from a database (?) that assume the Chabrier initial mass function. The model also allowed for a 3rd order, additive polynomial to adjust the continuum to account for minor fluxing errors and extinction of the stellar light by a foreground screen of dust.
Consistent with the CIGALE analysis describe above, the best-fitting pPXf model is dominated by old stars with a light-weighted age of Gyr. The model also results in a selective extinction mag (from the stellar continuum), and the light-weighted mass-to-light ratio implies a total stellar mass of .
The pPXf package also estimates line fluxes for a series of standard nebular emission lines after correcting for any coincident stellar absorption. These are listed in Table S6 with their estimated uncertainties. From the observed Balmer decrement, , where is the flux of the line, we infer a modest internal extinction (the Galactic extinction along this sightline is estimated to be less than 0.1 mag (?)). Adopting a standard Galactic extinction law (?) and the Case B recombination intrinsic ratio of (?), we estimate and . The extinction-corrected line-luminosities are listed in Table S6 using our adopted cosmology.
From these line luminosities, we estimate additional properties of the host galaxy. First, we note the [NII]/H line-ratio exceeds the values observed for normal, star-forming galaxies. This is emphasized in Figure 4 which presents a canonical Baldwin-Phillips-Terlevich (BPT) diagram frequently used to assess the ionizing sources within a galaxy. We find that the host galaxy of FRB 180924 is offset from the locus of , star-forming galaxies. Instead, its position in Figure 4 is near the locus of galaxies known to host active galactic nuclei (AGN) and those that exhibit LINER emission (?).
We conclude that the line emission in this galaxy is produced in part by the ionizing mechanisms invoked for LINER galaxies. For galaxies dominated by old stellar populations, the currently favored scenario is starlight from post-AGB stars. Such stars might also provide the dust responsible for the observed extinction.
If the observed H flux were dominated by the line-emission of star-forming regions, the luminosity would yield an estimate of the current SFR. Applying the standard conversion factor (?), this would imply with uncertainty dominated by the applied extinction correction (). Given the LINER excitation, the derived value yields only an upper limit for the galaxy. We therefore report an upper limit of SFR .
S2 Supplementary Text
Throughout the analysis we use cosmological parameters from the Planck 2015 results (?).
S2.1 Arguments against an association with the background galaxies
Given the association of FRB 121102 with a dwarf galaxy, it is necessary to consider whether the burst source can be associated instead with two other galaxies, which are in the background to DES J214425.255400.81. These galaxies are labeled label B ( and C () in Figure 2. DES J214425.255400.81 is labeled A. Two separate arguments suggest that FRB 180924 does not reside in the halo of either of these galaxies.
Firstly, if we assume that the burst originated in the halo of galaxy B or C, then the probability of a chance coincidence is at most 7% for galaxy B and 4% for galaxy C under the unlikely assumption that the burst could originate anywhere within the halo of the background galaxy with uniform probability to the observed separation from the galaxy center. If the probability was (for instance) weighted by the stellar light of galaxy B or C, the likelihood of chance coincidence becomes negligibly small for either galaxy. Secondly, the burst properties are inconsistent with it having propagated from a background galaxy through the foreground. Integral field spectroscopy shows that ionized gas is present in the foreground galaxy at the position of FRB 180924. Any burst emitted from either other galaxy would incur sufficient excess dispersion from its passage through the ionized gas in the lower-redshift galaxy to make it inconsistent with that expected from the intergalactic medium. In this scenario, the burst would also be expected to be severely broadened due to diffractive scattering, if the gas in the lower-redshift galaxy has turbulence comparable to that in the Milky Way. We therefore conclude that the burst is associated with the closest galaxy, DES J214424.97405400.2 (galaxy A).
S2.1.1 The dispersion measure contribution of galaxy A
At an offset of kpc from the center of a relatively massive galaxy, the dispersion measure contributed by the host galaxy of FRB 180924 and its halo are likely to be substantial. Consider first a fiducial estimate for gas within the dark matter halo surrounding the galaxy. Adopting a stellar mass of , we may roughly estimate the halo mass using the halo abundance matching technique (?). This methodology yields a halo mass with an dex uncertainty. In the following, we also assume a concentration which is characteristic of halos of this mass at low redshift. We make the following assumptions on the baryons within the halo: (i) the density profile of halo gas follows a modified Navarro-Frenk-White (NFW) profile:
| (S17) |
as discussed in (?) where is a normalizing density, is dimensionless radial coordinate, with a steepness index set to and (dimensionless) scale length ”; (ii) the halo contains a cosmic fraction of baryons, i.e. where is the baryon mass, is the halo mass, is the cosmic average baryon density, is the cosmic average matter density, and is the fraction of baryons in halos, and that 75% of these baryons are in a diffuse, ionized plasma within the halo. This sets the normalization in the above equation. We emphasize that neither nor the gas-density profile are well determined for galaxy halos (?, ?, ?, ?, ?).
Adopting this fiducial model and an impact parameter kpc, the integrated electron column density through the halo defined by its virial radius ( kpc) is . This gives a halo-integrated dispersion measure . Of course, if FRB 180924 is hosted in the stellar disk of galaxy A it will be near the mid plane of the halo and the expected halo contribution would be half of this quantity. We caution that this estimate is subject to large uncertainties related to both and the adopted density profile. Numerical simulations of galactic halo gas predict values that range from unity to much less than one, often with a steep halo mass dependence (?, ?). This implies at least a 50% uncertainty in our adopted value. This treatment ignores any gas local to the burst source. Given the low flux of H emission at the FRB location, however, we infer this to be a small contribution.
S2.1.2 The dispersion-measure contributions to galaxies B and C
We consider whether the observed DM of 362 of FRB 180924 is sufficiently large to be compatible with passage through all of the Milky Way (estimated as as described above, the halo of galaxy A (), and through the intergalactic medium out to the redshifts of galaxies B or C, at and respectively. We use models (?) to quantify the minimum likely contribution from the IGM. These models account for variation in the IGM dispersion measure caused by variations in the distribution of cosmic baryons between different sight lines, for which much of the variance is due to the number of galaxy baryonic halos intersected. We use as a representative model, one in which each galaxy halo baryon profile follows an NFW distribution that extends out to the virial radius of each galaxy. The NFW halo models here are conservative because most models find the profile is more diffuse than NFW (where NFW traces the dark matter), which would lead to the distribution being narrower.
Figure S5 shows the expected DM distribution parameterized according to the minimum halo mass for which a galaxy will retain its baryonic halo; we consider halo masses in the range -M⊙. The lowest minimum DM is obtained for models in which the minimum halo mass is M⊙. The physical motivation for parameterizing the models in terms of a mass cutoff at some minimum mass is that below this minimum mass feedback is able to blow out all the halo gas; this is thought to occur around (?), but this does depend on the specific feedback implementation.
A useful constraint is set by considering the location of the fifth percentile of the DM distribution (i.e. the point above which 95% of the probability is contained). For this minimum IGM DM contribution is 227, while for it is 325. Folding in additional contributions from the Milky Way and galaxy A, the minimum expected DM from a burst associated with galaxy B is 380, while it is 480 for one associated with galaxy C. Both lower limit estimates are inconsistent with the measured burst DM.
S2.2 Stars and their host galaxies
The stellar mass function for nearby galaxies (?) implies that most stars in the nearby Universe lie in moderately massive galaxies with stellar masses above about 1010 M⊙. Table S8 shows a rough breakdown of the fraction of stars in the local Universe that lie in galaxies of different masses - the distribution is strongly influenced by the ’knee’ of the galaxy stellar mass function (?), which lies near M⊙. Above this mass the volume density of galaxies starts to decrease rapidly, while below this mass the volume density of galaxies rises too slowly to offset the smaller number of stars in each galaxy. Unlike FRB 121102, FRB 180924 is located in the kind of moderately massive galaxy in which the bulk of stars in the local Universe are found. If this is a common property of FRB host galaxies, it would suggest that the progenitors of FRBs are drawn from the overall stellar population (including the endpoints of stellar evolution, like neutron stars and white dwarfs), rather than from an exotic sub-population found mainly in dwarf galaxies.
S2.3 Models of burst dispersion measure: IGM and host residual
Models of the baryon distribution of the IGM generically show there is a minimum non-zero dispersion measure contribution from the IGM for any object at . This can be used to place an upper limit on the host galaxy dispersion measure contribution in the present case. We derived the probability distribution of for a variety of IGM models previously considered (?).
Specifically, we examined models in which the baryonic halos of galaxies that intersect the FRB sightline have gas profiles whose densities possess an NFW distribution (?) around their galaxy centers. The baryonic profiles were taken to extend out to the virial radius and were parameterized in terms of the minimum halo mass that retain its gas: we considered minimum halo masses over the range to solar masses, ranging between dwarf galaxies and galaxy cluster masses. This parameterization is motivated by galactic feedback, which simulations find evacuates the halo gas below some halo mass threshold (with this threshold affected dependent on how stellar and AGN feedback is implemented).
If we posit that must lie within the of its allowed range, we obtain a corresponding upper limit on , after removing the additional contribution from the Milky Way. The Milky Way contribution lies in the range , taking into account from the Galactic disk, and a further due to the (highly) uncertain contribution from the Galactic halo. Table S9 shows the corresponding confidence upper limits on , for the variety of models considered, assuming a dispersion-measure contribution from the Milky Way (i.e., from the IGM and host combined). We choose to assume for the the Milky Way (disk and halo) contribution; because it provides conservative (maximal) constraints on the possible host galaxy dispersion contribution. The 95% confidence limit range from 77 to 133 . We also list the mean expected value of for each of these models. The full probability distribution of , derived from the probability distributions of , is shown in Figure S6.
S2.4 Interpreting the scatter broadening of FRB 180924
Inhomogeneities in electron density refract and diffract propagating radio waves. Diffraction is manifested as either scintillation, pulse broadening, and sometimes both. FRB 180924 shows evidence for spectral modulation like other ASKAP bursts (?). It also shows evidence for pulse broadening.
The power spectrum of the density fluctuations is modeled to be a power law between an inner and outer scale of the turbulence:
| (S18) |
where is the spectral wavenumber and represents the amplitude of the turbulence at a distace along the line of sight . If the turbulence follows a Kolmogorov spectrum, then the power law index is . The scattering measure (SM) is the integrated value of along the line of sight:
| (S19) |
Observable quantities (e.g. the pulse broadening time (), scintillation bandwidths, or angular broadening) can be related to the scattering measure assuming a model for the turbulence in the ISM.
In the Milky Way, for a geometrically thick medium, with density fluctuations following a Kolmogorov spectrum, the scattering measure (SM) can be calculated from the scatter broadening (?) using
| (S20) |
where the pulse broadening time () is measured in seconds, the extent of the line of sight () is measured in kpc, and the observing frequency () is measured in GHz. In the Milky Way, other media (such as geometrically thin cases) will result in a relation that changes the coefficient of proportionality by a factor that is close to unity (?).
In the case of scattering in the host galaxy, the relationships need to be adjusted to account for the different geometry, and to correct for the redshift of the host. Scattering in the host will be half as effective as would be expected from Equation S20. Additionally, the line of sight length is measured through the host galaxy (i.e., not the entire path length from the burst source to Earth).
We then need to convert the scattering measure to the rest frame of the host galaxy:
| (S21) |
and the average scattering strength along the line of sight is
| (S22) |
where is the length of the line of sight in kpc.
Thus for the host of FRB 180924, we find SM=, and . In Figure S7, we show how the scattering strength of FRB 180924 compares to measurements along lines of sight to pulsars in the Milky Way, assuming a path length through the host ranging from to kpc, and a host dispersion measure of (in the rest frame) which is the most conservative (largest) 95% limit from the models considered above. The plot shows that if the scattering originates in the host, the strength is marginally higher than that measured along Milky Way lines of sight.
S2.5 Acknowledgments
The Australian Square Kilometre Array Pathfinder, Australia Telescope Compact Array, and Parkes Radio Telescope are part of the Australia Telescope National Facility which is managed by CSIRO. Operation of ASKAP is funded by the Australian Government with support from the National Collaborative Research Infrastructure Strategy. ASKAP uses the resources of the Pawsey Supercomputing Centre. Establishment of ASKAP, the Murchison Radio-astronomy Observatory and the Pawsey Supercomputing Centre are initiatives of the Australian Government, with support from the Government of Western Australia and the Science and Industry Endowment Fund. Spectra were obtained at the W. M. Keck Observatory, which is operated as a scientific partnership among Caltech, the University of California, and the National Aeronautics and Space Administration (NASA). The Keck Observatory was made possible by the generous financial support of the W. M. Keck Foundation. We acknowledge the Wajarri Yamatji as the traditional owners of the Murchison Radio-astronomy Observatory site. The authors recognize and acknowledge the very significant cultural role and reverence that the summit of Mauna Kea has always had within the indigenous Hawaiian community. We are most fortunate to have the opportunity to conduct observations from this mountain.
The Gemini Observatory is operated by the Association of Universities for Research in Astronomy, Inc., under a cooperative agreement with the NSF on behalf of the Gemini partnership: the National Science Foundation (United States), the National Research Council (Canada), CONICYT (Chile), Ministerio de Ciencia, Tecnología e Innovación Productiva (Argentina), and Ministério da Ciência, Tecnologia e Inovação (Brazil). This publication makes use of data products from the Wide-field Infrared Survey Explorer, which is a joint project of the University of California, Los Angeles, and the Jet Propulsion Laboratory/California Institute of Technology, funded by the National Aeronautics and Space Administration. This project used public archival data from the Dark Energy Survey (DES). Funding for the DES Projects has been provided by the U.S. Department of Energy, the U.S. National Science Foundation, the Ministry of Science and Education of Spain, the Science and Technology Facilities Council of the United Kingdom, the Higher Education Funding Council for England, the National Center for Supercomputing Applications at the University of Illinois at Urbana-Champaign, the Kavli Institute of Cosmological Physics at the University of Chicago, the Center for Cosmology and Astro-Particle Physics at the Ohio State University, the Mitchell Institute for Fundamental Physics and Astronomy at Texas A&M University, Financiadora de Estudos e Projetos, Fundação Carlos Chagas Filho de Amparo à Pesquisa do Estado do Rio de Janeiro, Conselho Nacional de Desenvolvimento Científico e Tecnológico and the Ministério da Ciência, Tecnologia e Inovação, the Deutsche Forschungsgemeinschaft, and the Collaborating Institutions in the Dark Energy Survey. The Collaborating Institutions are Argonne National Laboratory, the University of California at Santa Cruz, the University of Cambridge, Centro de Investigaciones Energéticas, Medioambientales y Tecnológicas-Madrid, the University of Chicago, University College London, the DES-Brazil Consortium, the University of Edinburgh, the Eidgenössische Technische Hochschule (ETH) Zürich, Fermi National Accelerator Laboratory, the University of Illinois at Urbana-Champaign, the Institut de Ciències de l’Espai (IEEC/CSIC), the Institut de Física d’Altes Energies, Lawrence Berkeley National Laboratory, the Ludwig-Maximilians Universität München and the associated Excellence Cluster Universe, the University of Michigan, the National Optical Astronomy Observatory, the University of Nottingham, The Ohio State University, the OzDES Membership Consortium, the University of Pennsylvania, the University of Portsmouth, SLAC National Accelerator Laboratory, Stanford University, the University of Sussex, and Texas A&M University. Based in part on observations at Cerro Tololo Inter-American Observatory, National Optical Astronomy Observatory, which is operated by the Association of Universities for Research in Astronomy (AURA) under a cooperative agreement with the National Science Foundation.
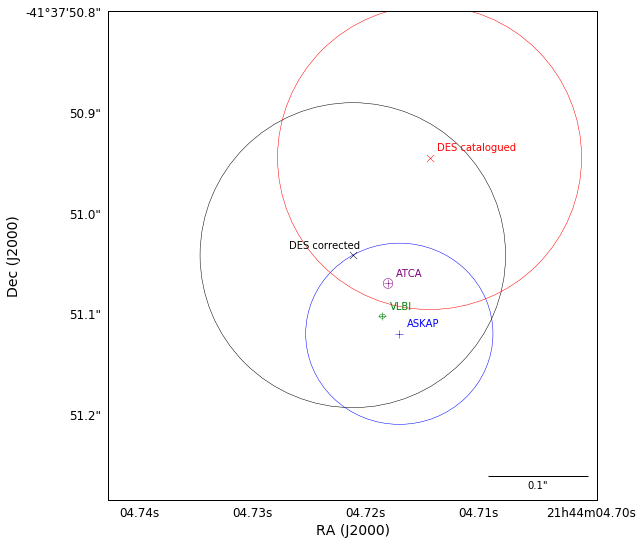
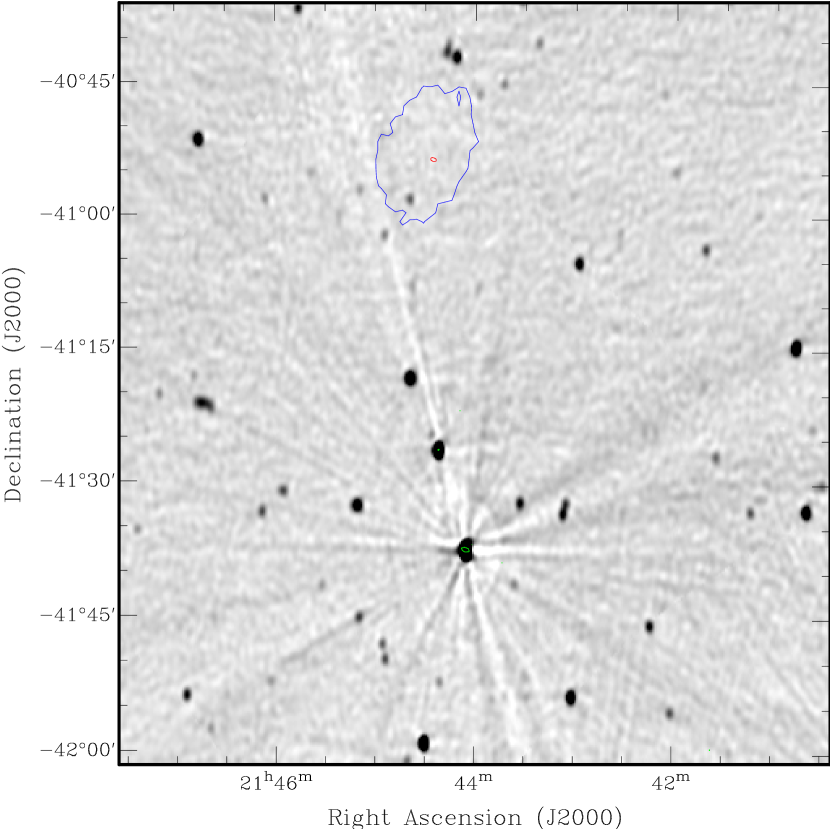
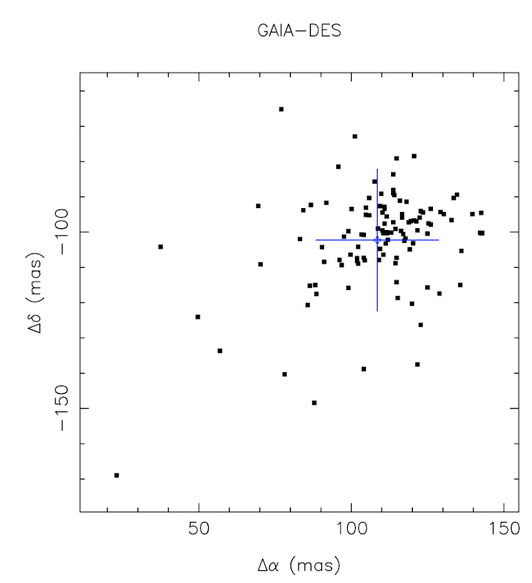
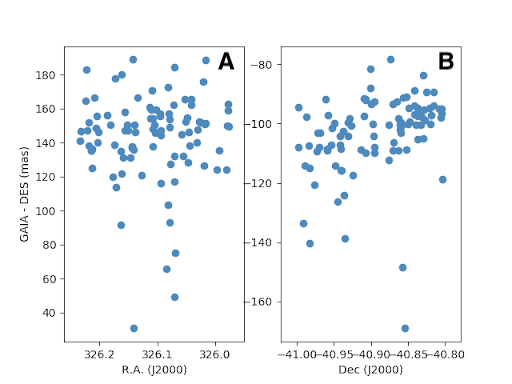
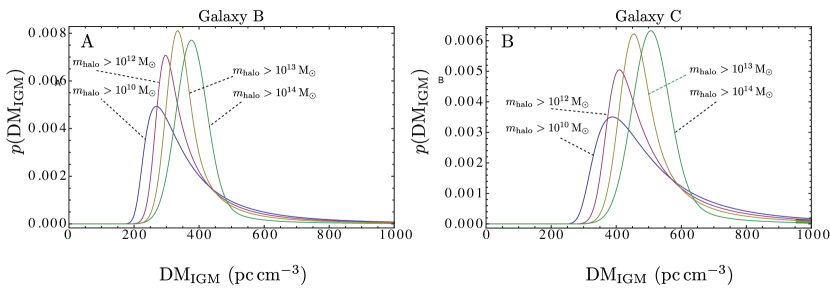
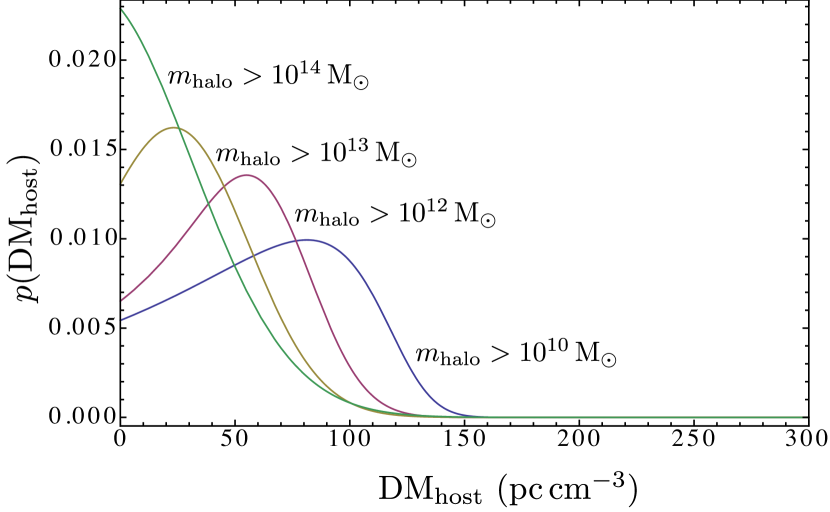
Supplementary Tables
| Telescope | Instrument | UT Date | Days | Remarks |
|---|---|---|---|---|
| ASKAP | 1.1-1.4 GHz | 2018 Sep 26 | 2 | continuum emission search |
| ATCA | 4.5-8.5 GHz | 2018 Sep 25 & Oct 4 | 1 & 10 | continuum emission search |
| Parkes | 1.4 GHz | 2018 Oct 2 & 17 | 8 & 23 | search for repeat bursts |
| Keck | KCWI | 2018 Oct 4 | 10 | integral field unit Å. |
| Gemini-S | GMOS | 2018 Oct 5 | 11 | long-slit spectroscopy Å |
| VLT | MUSE | 2018 Nov 5 | 41 | integral field unit Å |
| VLT | FORS2 | 2018 Nov 9 | 45 | -band imaging |
| Source | R.A. | Decl. | R.A. error | Decl. error | error | |
|---|---|---|---|---|---|---|
| (J2000) | (J2000) | (mas) | (mas) | mJy | mJy beam-1 . | |
| PKS 2144418 | 21h44m04.717s | 41d37’51.12” | 90 | 90 | 259 | 3 |
| SUMSS J214421412640 | 21h44m21.302s | 41d26’40.90” | 280 | 260 | 88 | 3 |
| SUMSS J214438411835 | 21h44m38.828s | 41d18’33.54” | 943 | 740 | 31 | 3.09 |
| I (Jy) | Q (Jy) | U (Jy) | V (Jy) | (rad) |
| 11.8(1) | 1.4(1) | -10.5(1) | 1.0 (1) | 2.4(1) |
| Without Proper Motion (mas) | 109(20) | 108(17) |
| With Proper Motion (mas) | 102(15) | 97(12) |
| Survey | Filter | Value | Uncertainty |
| DES-DR1 | g | 21.62 | 0.03 |
| DES-DR1 | r | 20.54 | 0.02 |
| DES-DR1 | i | 20.14 | 0.02 |
| DES-DR1 | z | 19.85 | 0.02 |
| DES-DR1 | Y | 19.81 | 0.06 |
| WISE | W1 | 16.85 | 0.10 |
| WISE | W2 | 16.06 | 0.18 |
| WISE | W3 | ||
| WISE | W4 |
| Line | Flux | Flux Uncertainty | Luminositya | Lum. Uncertainty |
|---|---|---|---|---|
| ( erg/s/cm2) | ( erg/s/cm2) | ( erg/s) | ( erg/s) | |
| [OII] 3726 | 4.0 | 0.2 | 5.6 | 0.3 |
| [OII] 3729 | 7.0 | 0.3 | 9.7 | 0.4 |
| H | 7.3 | 0.2 | 7.4 | 0.2 |
| [OIII] 5007 | 7.9 | 0.2 | 7.6 | 0.2 |
| H | 28.1 | 0.3 | 20.8 | 0.2 |
| [NII] 6583 | 19.5 | 0.3 | 14.4 | 0.2 |
| [SII] 6716 | 4.5 | 0.2 | 3.2 | 0.1 |
| [SII] 6731 | 3.2 | 0.2 | 2.3 | 0.1 |
a
| Parameter | Value | Error |
|---|---|---|
| Total Mass () | 2.25 | 0.71 |
| Old Stellar Mass () | 2.24 | 0.71 |
| AGN Fraction | 0.2 | 0.2 |
| (rest frame) | 1.7 | 0.2 |
| (rest frame) | -20.77 | 0.05 |
| SFR | 2.9 | 3.9 |
| 0.27 | 0.11 | |
| (Gyr) | 5.55 | 3.17 |
| Galaxy stellar mass (M⊙) | Fraction of local stars |
|---|---|
| 107 to 108 | 1% |
| 108 to 109 | 4% |
| 109 to 10 10 | 16% |
| 1010 to 1011 | 68% |
| 1011 to 1012 | 11% |
| Halo Radius | Mean | Standard deviation | DM | |
| ( ) | () | () | () | |
| Top-hat model | 0.5 | 81 | 39 | 133 |
| 0.75 | 62 | 36 | 122 | |
| 1 | 51 | 32 | 108 | |
| 2 | 32 | 24 | 79 | |
| NFW model | 1 | 66 | 34 | 119 |
| 2 | 43 | 29 | 95 | |
| Minimum halo mass | Mean | Standard Deviation | DM | |
| () | () | () | () | |
| NFW Model | 66 | 34 | 119 | |
| extended to | 50 | 27 | 94 | |
| 36 | 23 | 79 | ||
| 30 | 24 | 77 |