Significant cocoon emission and photosphere duration stretching in GRB 211211A: a burst from a neutron star - black hole merger
Abstract
The radiation mechanism (thermal photosphere or magnetic synchrotron)[1, 2, 3, 4] and the progenitor[5, 6, 7, 8, 9] of gamma-ray burst (GRB) are under hot debate. Recently discovered[10, 11, 12, 13], the prompt long-duration ( 10 s, normally from the collapse of massive stars[5, 6, 7]) property of GRB 211211A strongly conflicts with its association with a kilonova (normally from the merger of two compact objects[8, 9, 14, 15, 16, 17, 18], NS-NS, NS-BH, or NS-WD, duration 2 s). In this paper, we find the probability photosphere model with a structured jet[19, 20, 21, 22, 23, 24, 25] can satisfactorily explain this peculiar long duration, through the duration stretching effect ( 3 times) on the intrinsic longer ( 3 s) duration of NS-BH (neutron star and black hole) merger[26, 27], the observed empirical 2SBPL spectrum (with soft low-energy index of -1) and its evolution[13]. Also, much evidence of the NS-BH merger origin is found, especially the well fit of the afterglow-subtracted optical-NIR light curves[10] by the significant thermal cocoon emission[28, 29] and the sole thermal “red” kilonova component[30]. Finally, a convincing new explanation for the X-ray afterglow plateau[31] is revealed.
School of Astronomy and Space Science, Nanjing University, Nanjing 210023, China
Key Laboratory of Modern Astronomy and Astrophysics (Nanjing University), Ministry of Education, China
0.1 The probability photosphere emission from the structured jet.
Many previous theoretical studies[20, 21, 32] show that, in the relativistic condition, a probability density function should be introduced to describe the photosphere emission (see Methods). This function describes the probability for a photon to be last scattered at any place of the outflow.
The probability density function can be calculated by (see Ref.[33])
| (1) |
where means the jet velocity, means the Doppler factor, and is the photospheric radius and depends on the angular coordinate .
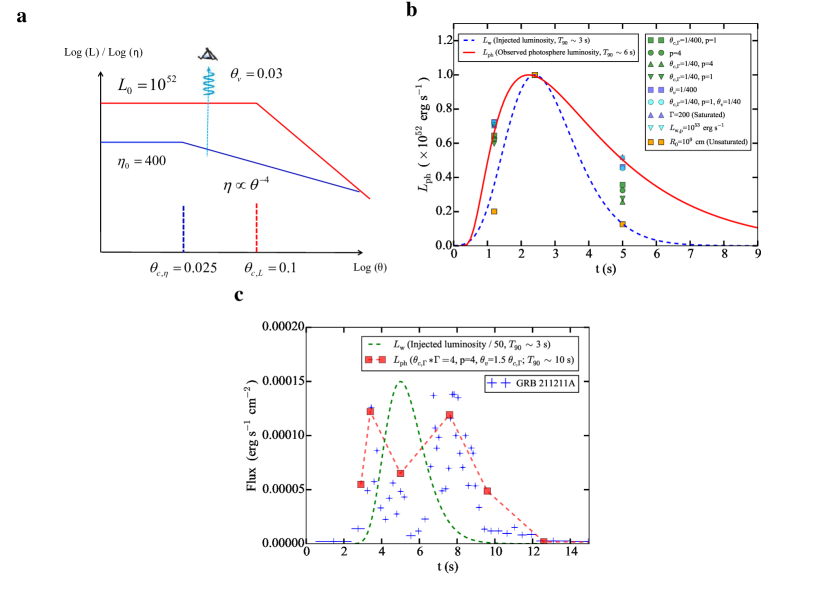
Furthermore, the GRB relativistic jet launched by the center engine will be collimated by the surrounding material[34]. Then, the break-out jet should have angular profiles outside the isotropic core , for both the luminosity and Lorentz factor . This is called the structured jet (see Methods). Previously, is typically assumed. Here, means the isotropic angular width for the Lorentz factor, and means the isotropic angular width for luminosity.
Based on the simulation results of GRB jet[34, 35, 36, 37, 38], we now propose that the structured jet with is likely to be commonly obtained. (see Figure 1a). This is due to the enhanced material in the outside part, with decreasing velocity and almost constant energy (achieving the pressure equilibrium) within (see Extended Data Figure 1 and further discussions in Methods). In our previous photosphere spectrum calculations for structured jet, the constant luminosity case[23] and the case[24] are both explored. Here, we further study the case.
We find the luminosity structure has a negligible effect to the spectrum calculation when the viewing angle satisfies , since relativistic emission is within . Also, should be common due to the large and the decreasing luminosity outwards. In the following calculations and fitting, we adopt , the typical constrained value of the jet opening angle . On the contrary, the Lorentz factor structure could have significant influence, since may be quite small ( a few) or larger (, our considered case for GRB 211211A) is obtained.
The adopted Lorentz factor (or the baryon loading , normally ) structure is as following:
| (2) |
where is the angle from the jet axis, is the constant baryon loading parameter in the core with the width of , describes how the baryon loading decreases outside the core. The constant of 1.2 donates the minimum Lorentz factor of the relativistic jet (velocity 0.6 , where is the speed of the light; corresponding to the highest velocity of the outside non-relativistic cocoon, see Extended Data Figure 1).
0.2 The duration stretching effect for the saturated-acceleration photosphere.
For the photosphere emission, the saturated-acceleration regime is defined when is larger than the radius , where the maximum acceleration is achieved (, , is the initial acceleration radius; see further discussions in Methods). The adiabatic cooling happens during , thus decreasing the observed temperature (or frequency) and luminosity.
For the injected luminosity history of the center engine ( is the injection time), we use the exponential model[23, 39] to approximate it, with following form:
| (3) |
where means the start time, and are the characteristic quantities indicating the rise and decay timescale, respectively. is the peak luminosity at , and .
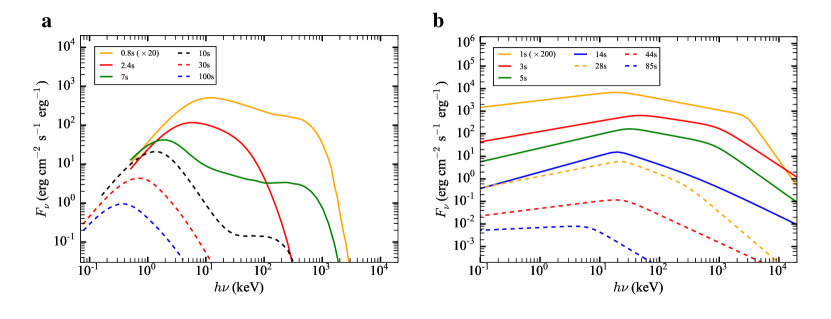
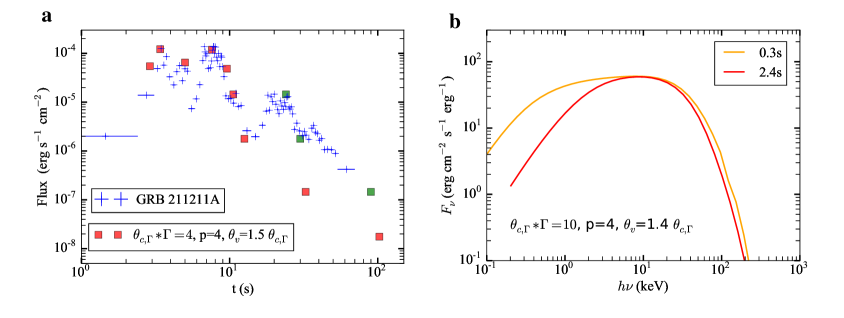
In Figure 1b, with the injected duration of 3 s (, , and are adopted; s), we show the observed photosphere luminosity profiles for different Lorentz factor structures (see also Figure 16 in Ref.[23]). Obviously, for the strongly saturated-acceleration cases ( is larger, corresponding to the luminosity around the peak time), whether (smaller), erg s-1 (higher) or larger ( ), the observed duration can be stretched to 6 s (two times larger). While for the strongly unsaturated case, cm, the observed luminosity profile is almost the same as the injected profile, thus obtaining a similar duration.
The reason for the above results is that, for saturated cases (actually for the higher luminosity around the peak time), the observed luminosity around the peak time will be significantly decreased (due to the adiabatic cooling), while the observed luminosity for earlier and later times will not suffer from this drop (with lower luminosity, is smaller and the unsaturated condition is obtained). In total, we discover the duration stretching effect for photosphere emission, which means that the injected luminosity duration of the center engine can be stretched to an observed duration of 2-3 , when (saturated acceleration) is satisfied around .
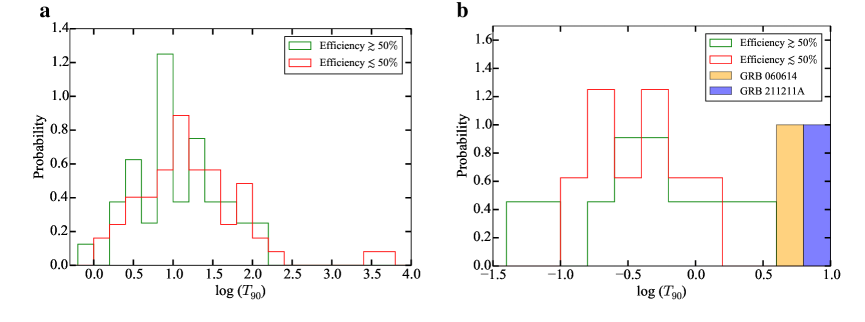
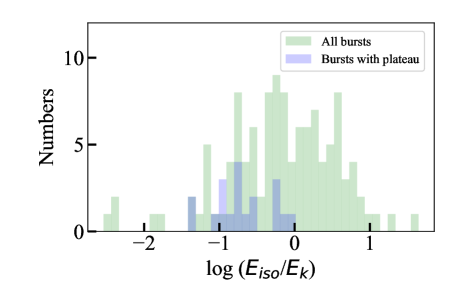
Note that, for the long GRBs, this photosphere duration stretching effect takes part for the saturated case is confirmed by comparing the duration distributions of the and samples (see Extended Data Figure 2a, data is taken from Ref.[25]). Here, , standing for the prompt efficiency. means the isotropic energy for prompt emission, and means the energy for afterglow. Theoretically, should correspond to the saturated acceleration (smaller due to the adiabatic cooling, see Methods), and its duration is indeed found 1.6 times longer than that for the sample (with similar distribution profile).
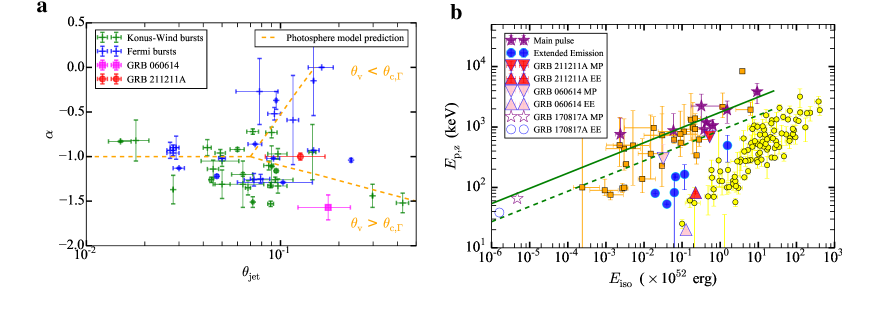
This duration stretching effect for the saturated photosphere may also contribute greatly to the peculiar long duration of GRB 211211A ( 10 s) and GRB 060614 ( 6 s). Since, according to their observed - distribution (see Extended Data Figure 3a and discussions in Methods), the larger ( ; thus is smaller, see Figure 4) is likely to be satisfied.
In Extended Data Figure 3b, we compare the peak energy and distributions of the main pulse (MP) and extended emission (EE) of GRB 211211A and GRB 060614, with other short GRBs with EE. For these two special bursts, the is smaller of 2-3 times for both the MP and EE. This further supports the above saturated scenario (due to the adiabatic cooling). The larger is preferred, since in Ref.[25] we find the normal short GRB sample with EE almost has (thus intrinsically unsaturated; with large , see discussions below and Extended Data Figure 1).
Indeed, in Figure 1c, with and , and injected duration 3 s, we find the light curve of GRB 211211A can be well explained by the photosphere emission, including the 10 s and the double pulses (stronger decrease around ).
0.3 The photosphere explanation for the empirical 2SBPL spectrum and the spectral evolution.
In Extended Data Figure 4a, we show the theoretical photosphere spectral evolution, for larger and (, ) considered in Figure 1c. The photosphere spectra could reproduce the observed soft -1 of GRB 211211A.
In Extended Data Figure 4b, we show the spectral evolution of GRB 211211A for the empirical 2SBPL (two smoothly broken power-law) model fitting, taking the best-fit parameters in Ref.[13] (accounting for the X-ray data, the 2SBPL is likely to be the better empirical model, see Methods). This evolution is quite similar to the photosphere spectral evolution in Extended Data Figure 4a, transferring from the early 2SBPL spectrum (with high-energy exponential cutoff, which may be better, see Methods) to the late-time SBPL spectrum (due to the high-altitude effect, see Methods).
0.4 The spectral fitting using the physical photosphere model.
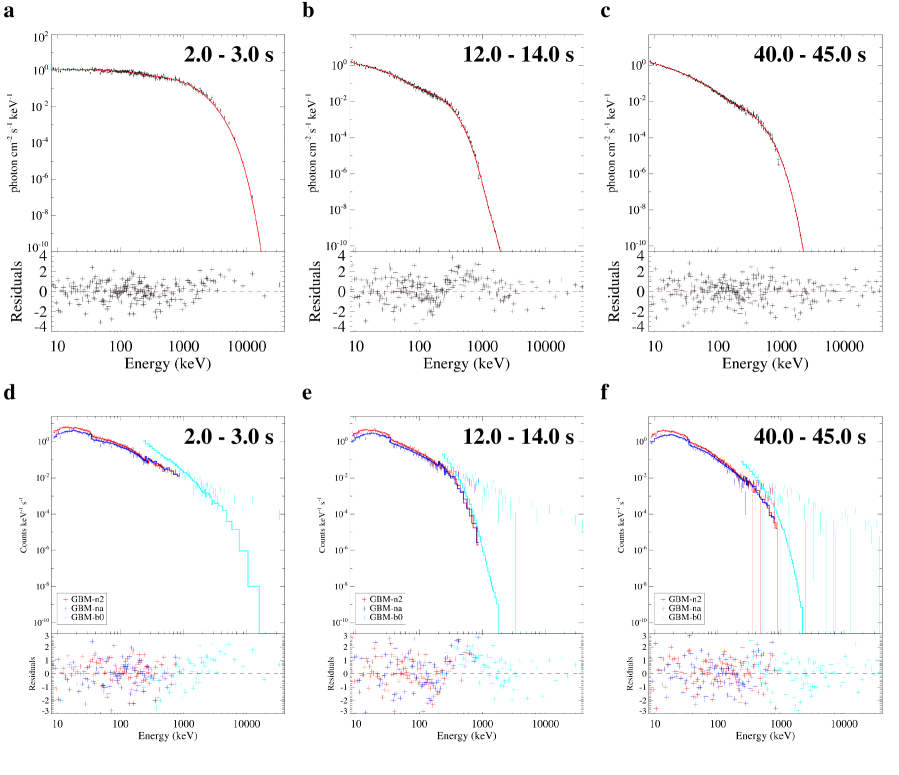
Generally, we need to convolve the model spectra with the instrumental response, the Detector Response Matrix (DRM), to compare the model spectra with the observational spectra (adopting the statistical value of BIC, Bayesian information criterion). We use the McSpecFit package which accepts flexible user-defined spectral model[40] to perform this. The comparisons of the observed and model-convolved count spectra are shown in the bottom panels of Figure 2, and the de-convolved observed and modeled photon number spectra are in the top panels.
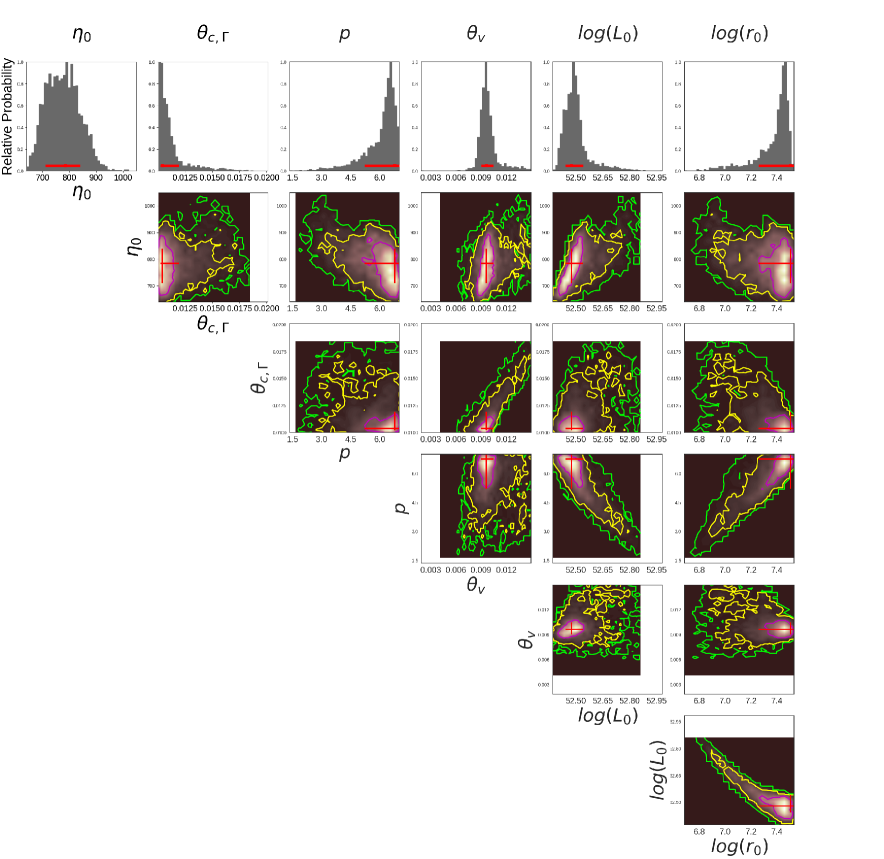
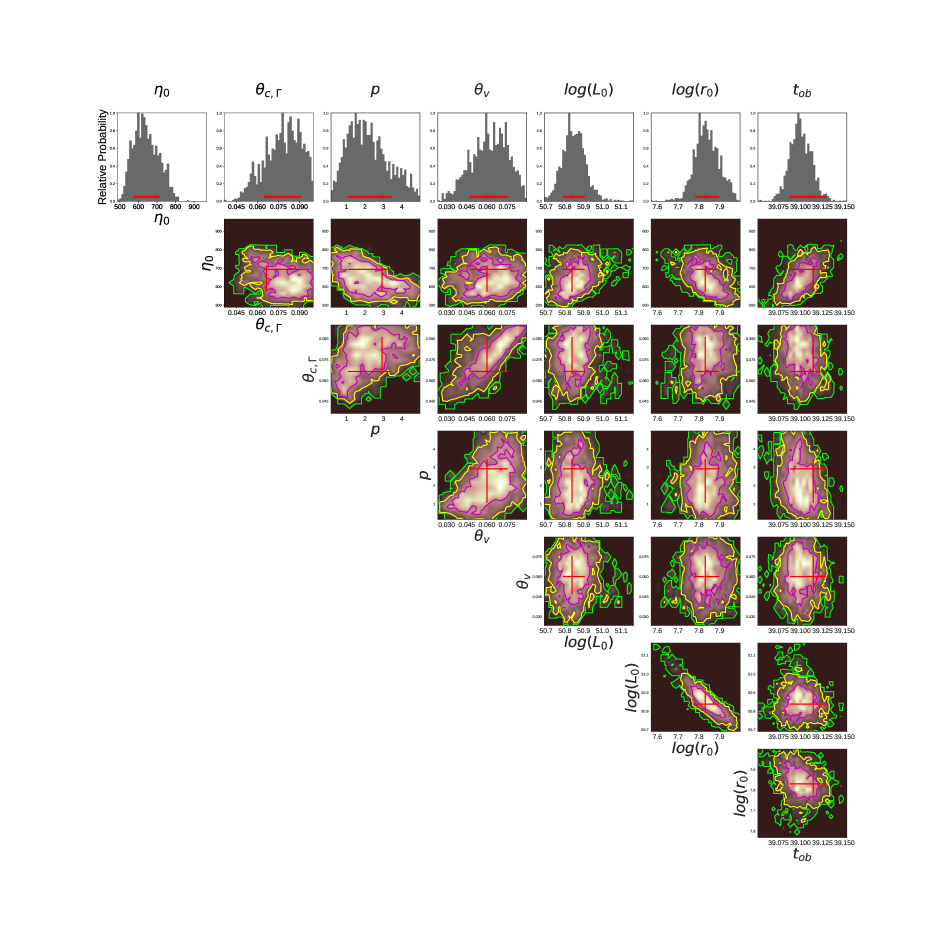
The spectral fitting results of 2.0 - 3.0 s (around the peak), using the above photosphere model with structured jet (constant injected luminosity is assumed), are shown in Figure 2, Extended Data Figure 11 (parameter constraints) and Extended Data Table 2 (best-fit parameters). Obviously, the photosphere model can give a rather well fit (see the residuals distribution, BIC/dof = 354/359), showing the exponential high-energy cutoff ( 2000 keV, low-energy power-law index - 1) combined with a smoothly broken power law in the low-energy end (the break energy 30 keV, low-energy power-law index 0).
The best-fit 700 (or ) is consistent with the larger of short GRB inferred from the optical afterglow (see Ref.[41]). The is large and , just as expected above. The observed peak luminosity of 2 erg s-1 (see Ref.[11]) is 15 times smaller than the best-fit ( erg s-1), due to the large (see Figure 1).
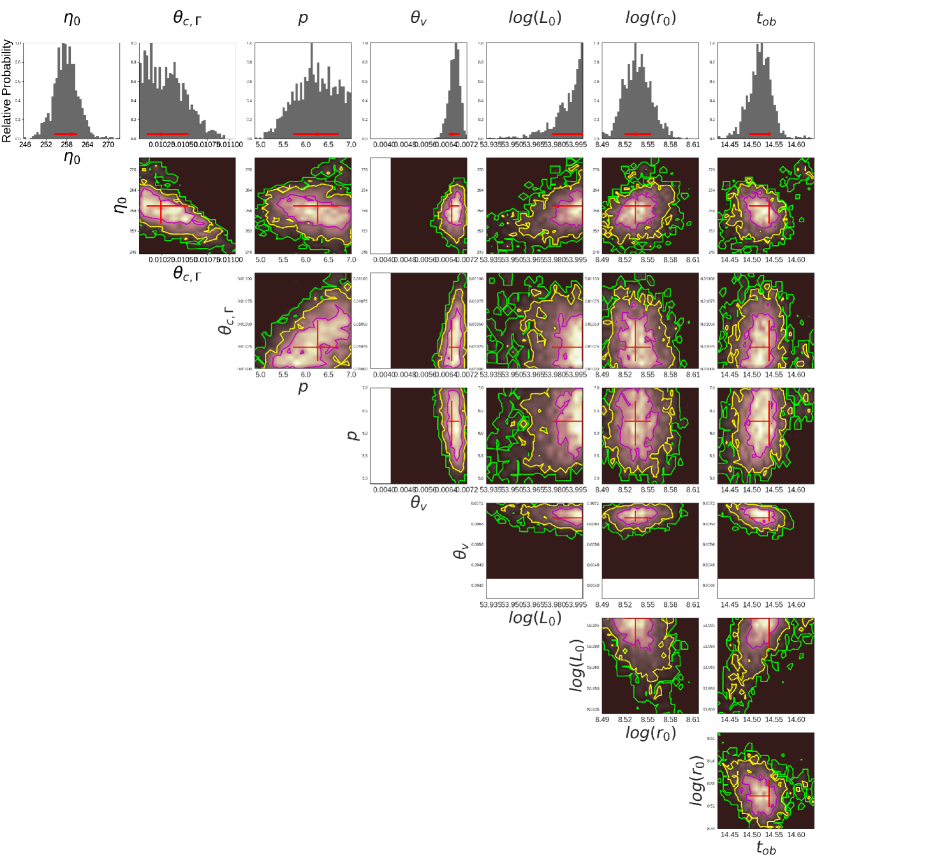
In addition, as shown in Figure 2, Extended Data Figures 12 and 13, and Extended Data Table 2, we give acceptable fit for the late-time spectra (12.0 - 14.0 s and 40.0 - 45.0 s) after considering reasonable injected luminosity profile. The BIC/dof = 475/358 is obtained for 12.0 - 14.0 s, and BIC/dof = 423/358 for 40.0 - 45.0 s. The best-fit structure parameters for different times are almost consistent, with large and (1.0 - 1.5 times).
0.5 NS-BH-merger evidence and significant cocoon emission in GRB 211211A.
According to Extended Data Figure 2b (see discussions in Methods), for the short GRBs, we propose that the sample (without EE) is likely to come from the NS-NS merger, with shorter intrinsic duration of 0.1 - 0.2 s[42]. The sample (with EE) comes from the NS-BH merger, with longer intrinsic duration of 0.8 s and wider duration distribution of 0.05 s - 3 s[43].
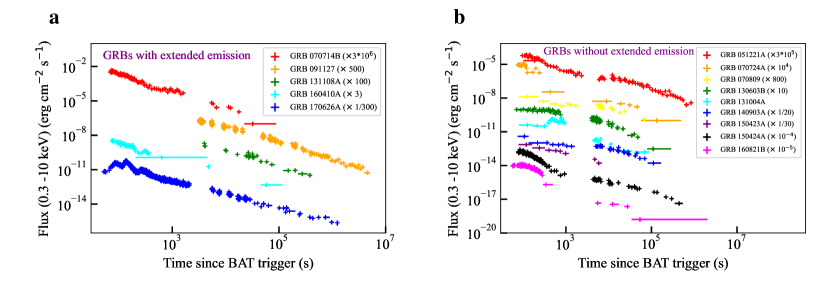
Besides, there are several other supports for this point. First, the low-energy extended emission is likely to originate from the fallback accretion of the BH, considering the comparable energy for MP and EE (especially after correcting the efficiency of EE, see Figure 5(d) in Ref.[25]), and the existence of the time gap between them (disfavoring the magnetar spin-down scenario). Moreover, the luminosity of the fallback accretion from the NS-BH merger is theoretically an order of magnitude larger than that from the NS-NS merger[44, 30]. Second, the short GRBs with EE typically have a small offset from their host galaxies ( a few kpc; including GRB 211211A and GRB 060614, see Ref.[11]), quite compatible with the low kick velocity for NS-BH merger[45]. Third, in Extended Data Figure 8, we find that all the X-ray afterglow light curves for the short GRB sample with EE show a power-law shape, while the significant plateau appears in the light curves for the sample without EE. Also, the evidence that the X-ray plateaus result from is revealed below (see Extended Data Figures 7 and 9, and Figure 4). Then, the power-law shape and plateau well correspond to the jet structures for the NS-BH merger (larger ) and NS-NS merger (smaller ; due to much dynamical ejecta in jet propagating direction[30] and thus stronger jet-ejecta interaction) (see Extended Data Figure 1). The outliers of GRB 211211A and GRB 060614, which have EE but show plateau, can be well explained by the rare regime of (with relatively large , see Extended Data Figure 1) for NS-BH merger.
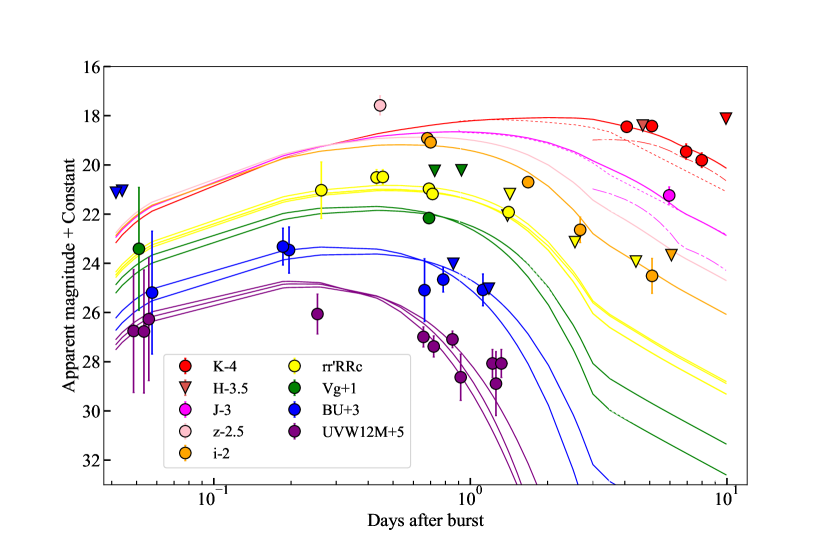
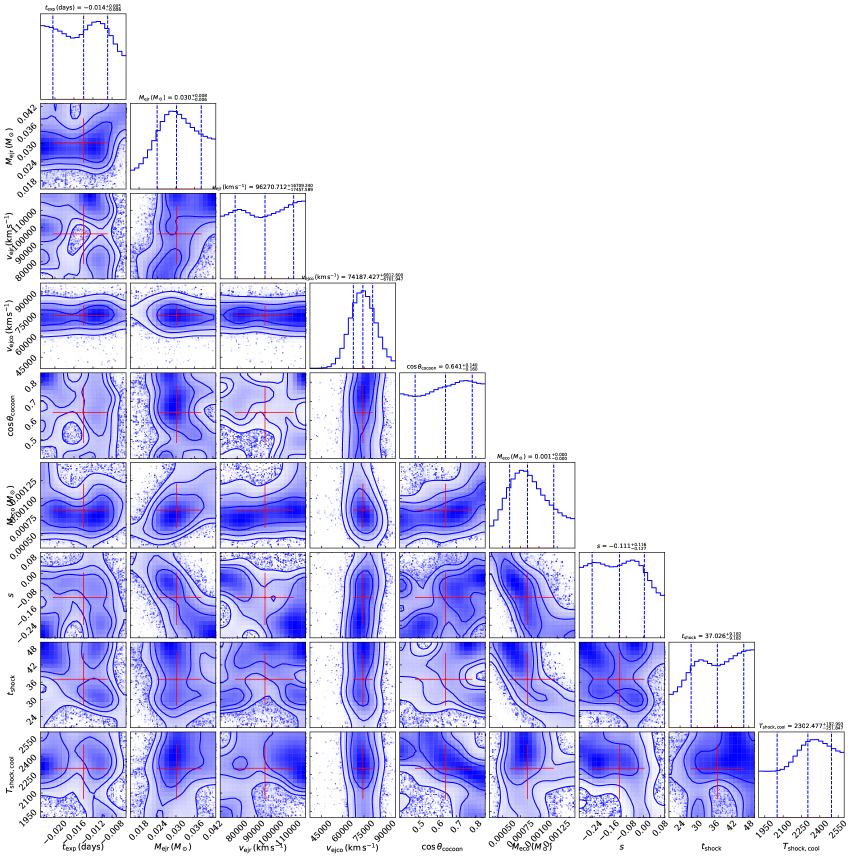
In addition, in Figure 3, we find that the afterglow-subtracted optical-NIR light curves of GRB 211211A (data is taken from Tables 1 and 2 in Ref.[10]) are well fitted by the combination of the dominated early cocoon emission and the late “red” kilonova component (with a mass of ), after treating more cocoon parameters than Ref.[10]. The lack of significant “blue” (may have similar mass to the cocoon mass ) or “purple” kilonova components strongly supports the NS-BH merger origin of GRB 211211A (see Extended Data Figure 1 and Methods).
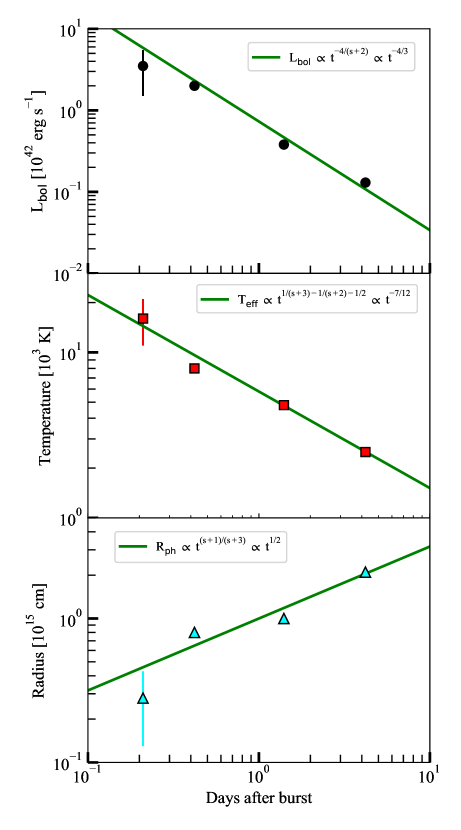
Note that we better explain the late-time i-band data, which is obviously over-estimated in Ref.[10]. The parameter constraints from the fitting (see details in Methods) are shown in Extended Data Figure 10. Also, with an energy distribution for different velocity ln ln , the typical value from cocoon numerical simulation[28], the observed evolutions of bolometric luminosity , effective temperature , and photospheric radius (data is taken from Figure 2 in Ref.[12]) can be well explained by the cocoon emission (see Extended Data Figure 6), without the need of peculiar higher and velocity ( 0.6 ) in the early time (for the kilonova explanation)[12].
Previously, the optical cocoon signature in long GRBs was discovered[29] by analyzing the early spectra of the supernova. For short GRBs, only weak evidence (or signature) was found in the optical counterpart of GRB 170817A (Swope Supernova Survey 2017a, SSS17a; Refs[46, 47]). This is due to the intense “blue” and “purple” kilonova emissions in GRB 170817A, produced by the NS-NS merger. Here, for GRB 211211A, which is likely to originate from the NS-BH merger, we discover the significant cocoon emission in short GRBs for the first time.
According to the above results, we consider that GRB 211211A and GRB 060614 (with EE) come from the NS-BH merger with intrinsic long duration ( 3 s). In addition, the larger (, rare event; see Extended Data Figure 1) makes them saturated (smaller , see Figure 4; , see Extended Data Figure 9), resulting in the photosphere duration stretching (reaching 6 - 10 s duration, see Figure 1), softer (see Figure 2 and Extended Data Figure 3a), and more minor (see Extended Data Figure 3b).
0.6 The new explanation for the X-ray afterglow plateau: the structured jet with and .
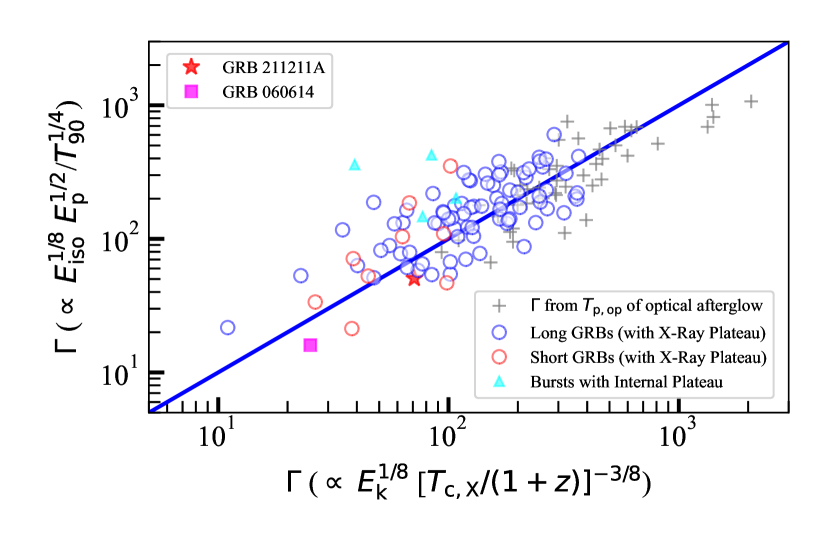
In Ref.[25] (see Figure 7(c) there), we find , derived from the photosphere model, is an excellent estimate for the bursts with the peak time of the early optical afterglow (also shown by the gray plus in Figure 4). In this work, as shown in Extended Data Figure 7 (the theoretical calculation, see Methods), we find the X-ray afterglow plateau can be explained by the structured jet with and . This condition means that the in the light of sight (LOS) is much smaller, and the large cutoff time of the plateau should correspond to this smaller (, here is the redshift, see Ref.[41]).
In Figure 4, for the large sample with plateau and (taken from Ref.[48]), we do find consistent results from the photosphere estimate () and the afterglow estimate (), regardless of long and short GRBs (see Methods). Furthermore, the obtained is indeed much smaller (the circles; , with selection for significant plateau) than that for the bursts with early peak (the gray plus; without plateau). In Extended Data Figure 9, for this sample with significant plateau, is found, indicating a small prompt efficiency (resulting from the smaller and the photosphere model, ). These consistent estimates, the smaller , and the lower efficiency strongly support the above explanation for the X-ray afterglow plateau.
Both the X-ray afterglow plateau exists in GRB 211211A and GRB 060614 (see Ref.[11]). As shown in Figure 4, above two estimates obtain consistently smaller for these two bursts ( for GRB 211211A; quite close to the constrained from afterglow modeling in Ref.[10], see Table 3 there). This further supports the and consideration above (the off-core case may be named), from the light curve (Figure 1), the spectral fitting (Figure 2) and the NS-BH merger origin (Figure 3 and Extended Data Figure 1; larger and rare rate for ).
In physics research, a pure blackbody is generally expected for thermal emission. But, recent studies (especially this work) for the GRB spectrum reveal that, in the relativistic condition, a pure spherical shell photosphere should change to a probability photosphere, obtaining a multi-color blackbody (). This relativistic probability photosphere should be treated in many other astrophysics and physics regions. Also, the GRB photosphere emission is normally powered by the cooling of the high-temperature accretion disk, through the neutrino annihilation (for neutrino-dominated accretion flow, namely NDAF[49]). Thus, our study (achieving the parameters from the fitting) provides a new and vital path to studying the accretion disk.
The relativistic jet widely exists in astrophysics objects (AGN, TDE, high-mass X-ray binaries), whose structure contains rich physics information and is crucial to the observed characteristics. Recent studies (especially this work) indicate that is likely to exist commonly, with which the typical GRB prompt emission () and afterglow properties (the X-ray plateau, see Extended Data Figure 7 and Methods) can both be reproduced. Our findings should provide an important base for the X-ray and gamma-ray polarization studies since the polarization degree strongly depends on the jet structure. In addition, the structured jet should be accompanied by the outward non-relativistic cocoon. In GRB 211211A, we reveal the significant optical cocoon emission, for the first time in short GRBs.
The gravitational wave from the NS-BH coalescence has been detected (see Methods). And it is long believed that, the short GRBs should consist of two subsamples, originating respectively from the NS-NS merger and NS-BH merger. Here, based on the duration distribution (wider range of 0.05 s - 3 s, and a longer typical value of 0.4 s), the sore “red” kilonova component and other arguments, we consider that the short GRB sample with extended emission (along with GRB 211211A and GRB 060614) originates from the NS-BH merger. Our claimed distinguished duration distributions and kilonova property could be further tested for a larger sample in the future. Meanwhile, future gravitational wave observation can also check our opinion.
0.7 Data Availability
The Fermi/GBM data are publicly available at https://heasarc.gsfc.nasa.gov/W3Browse/fermi/fermigbrst.html. The Konus-Wind data are publicly available at https://vizier.cds.unistra.fr/viz-bin/VizieR?-source=J/ApJ/850/161. The Swift data are publicly available at https://www.swift.ac.uk/archive/ql.php.
0.8 Code Availability
Upon reasonable request, the codes (mostly in Mathematical and Python) used to produce the results and figures will be provided.
References
- [1] Uhm, Z. L. & Zhang, B. Fast-cooling synchrotron radiation in a decaying magnetic field and -ray burst emission mechanism. Nature Physics 10, 351–356 (2014). 1303.2704.
- [2] Zhang, B. B. et al. Transition from fireball to Poynting-flux-dominated outflow in the three-episode GRB 160625B. Nature Astronomy 2, 69–75 (2018). 1612.03089.
- [3] Burgess, J. M. et al. Gamma-ray bursts as cool synchrotron sources. Nature Astronomy 4, 174–179 (2020). 1810.06965.
- [4] Zhang, B. Synchrotron radiation in -ray bursts prompt emission. Nature Astronomy 4, 210–211 (2020). 2002.09638.
- [5] Galama, T. J. et al. An unusual supernova in the error box of the -ray burst of 25 April 1998. Nature 395, 670–672 (1998). astro-ph/9806175.
- [6] Reeves, J. N. et al. The signature of supernova ejecta in the X-ray afterglow of the -ray burst 011211. Nature 416, 512–515 (2002). astro-ph/0204075.
- [7] Hjorth, J. et al. A very energetic supernova associated with the -ray burst of 29 March 2003. Nature 423, 847–850 (2003). astro-ph/0306347.
- [8] Eichler, D., Livio, M., Piran, T. & Schramm, D. N. Nucleosynthesis, neutrino bursts and -rays from coalescing neutron stars. Nature 340, 126–128 (1989).
- [9] Narayan, R., Paczynski, B. & Piran, T. Gamma-Ray Bursts as the Death Throes of Massive Binary Stars. ApJ 395, L83 (1992). astro-ph/9204001.
- [10] Rastinejad, J. C. et al. A kilonova following a long-duration gamma-ray burst at 350 Mpc. Nature 612, 223–227 (2022). 2204.10864.
- [11] Yang, J. et al. A long-duration gamma-ray burst with a peculiar origin. Nature 612, 232–235 (2022). 2204.12771.
- [12] Troja, E. et al. A nearby long gamma-ray burst from a merger of compact objects. Nature 612, 228–231 (2022). 2209.03363.
- [13] Gompertz, B. P. et al. The case for a minute-long merger-driven gamma-ray burst from fast-cooling synchrotron emission. Nature Astronomy 7, 67–79 (2023). 2205.05008.
- [14] Li, L.-X. & Paczyński, B. Transient Events from Neutron Star Mergers. ApJ 507, L59–L62 (1998). astro-ph/9807272.
- [15] Abbott, B. P. et al. Multi-messenger Observations of a Binary Neutron Star Merger. ApJ 848, L12 (2017). 1710.05833.
- [16] Zhang, B. B. et al. A peculiar low-luminosity short gamma-ray burst from a double neutron star merger progenitor. Nature Communications 9, 447 (2018). 1710.05851.
- [17] Pian, E. et al. Spectroscopic identification of r-process nucleosynthesis in a double neutron-star merger. Nature 551, 67–70 (2017). 1710.05858.
- [18] Coulter, D. A. et al. Swope Supernova Survey 2017a (SSS17a), the optical counterpart to a gravitational wave source. Science 358, 1556–1558 (2017). 1710.05452.
- [19] Mészáros, P. & Rees, M. J. Steep Slopes and Preferred Breaks in Gamma-Ray Burst Spectra: The Role of Photospheres and Comptonization. ApJ 530, 292–298 (2000). astro-ph/9908126.
- [20] Pe’er, A. Temporal Evolution of Thermal Emission from Relativistically Expanding Plasma. ApJ 682, 463–473 (2008). 0802.0725.
- [21] Pe’er, A. & Ryde, F. A Theory of Multicolor Blackbody Emission from Relativistically Expanding Plasmas. ApJ 732, 49 (2011). 1008.4590.
- [22] Meng, Y.-Z. et al. The Origin of the Prompt Emission for Short GRB 170817A: Photosphere Emission or Synchrotron Emission? ApJ 860, 72 (2018). 1801.01410.
- [23] Meng, Y.-Z., Liu, L.-D., Wei, J.-J., Wu, X.-F. & Zhang, B.-B. The Time-resolved Spectra of Photospheric Emission from a Structured Jet for Gamma-Ray Bursts. ApJ 882, 26 (2019). 1904.08526.
- [24] Meng, Y.-Z., Geng, J.-J. & Wu, X.-F. The photosphere emission spectrum of hybrid relativistic outflow for gamma-ray bursts. MNRAS 509, 6047–6058 (2022). 2107.04532.
- [25] Meng, Y.-Z. Evidence of Photosphere Emission Origin for Gamma-Ray Burst Prompt Emission. ApJS 263, 39 (2022). 2204.01381.
- [26] Ruiz, M., Shapiro, S. L. & Tsokaros, A. Multimessenger Binary Mergers Containing Neutron Stars: Gravitational Waves, Jets, and -Ray Bursts. Frontiers in Astronomy and Space Sciences 8, 39 (2021). 2102.03366.
- [27] Kyutoku, K., Shibata, M. & Taniguchi, K. Coalescence of black hole-neutron star binaries. Living Reviews in Relativity 24, 5 (2021). 2110.06218.
- [28] Nakar, E. & Piran, T. The Observable Signatures of GRB Cocoons. ApJ 834, 28 (2017). 1610.05362.
- [29] Izzo, L. et al. Signatures of a jet cocoon in early spectra of a supernova associated with a -ray burst. Nature 565, 324–327 (2019). 1901.05500.
- [30] Metzger, B. D. Kilonovae. Living Reviews in Relativity 20, 3 (2017). 1610.09381.
- [31] Zhang, B. et al. Physical Processes Shaping Gamma-Ray Burst X-Ray Afterglow Light Curves: Theoretical Implications from the Swift X-Ray Telescope Observations. ApJ 642, 354–370 (2006). astro-ph/0508321.
- [32] Beloborodov, A. M. Radiative Transfer in Ultrarelativistic Outflows. ApJ 737, 68 (2011). 1011.6005.
- [33] Lundman, C., Pe’er, A. & Ryde, F. A theory of photospheric emission from relativistic, collimated outflows. MNRAS 428, 2430–2442 (2013). 1208.2965.
- [34] Aloy, M. A., Müller, E., Ibáñez, J. M., Martí, J. M. & MacFadyen, A. Relativistic Jets from Collapsars. ApJ 531, L119–L122 (2000). astro-ph/9911098.
- [35] Lazzati, D., Morsony, B. J. & Begelman, M. C. Gamma-ray burst jet dynamics and their interaction with the progenitor star. Philosophical Transactions of the Royal Society of London Series A 365, 1141–1149 (2007). astro-ph/0611192.
- [36] Tchekhovskoy, A., McKinney, J. C. & Narayan, R. Simulations of ultrarelativistic magnetodynamic jets from gamma-ray burst engines. MNRAS 388, 551–572 (2008). 0803.3807.
- [37] Geng, J.-J., Zhang, B., Kölligan, A., Kuiper, R. & Huang, Y.-F. Propagation of a Short GRB Jet in the Ejecta: Jet Launching Delay Time, Jet Structure, and GW170817/GRB 170817A. ApJ 877, L40 (2019). 1904.02326.
- [38] Ito, H., Just, O., Takei, Y. & Nagataki, S. A Global Numerical Model of the Prompt Emission in Short Gamma-ray Bursts. ApJ 918, 59 (2021). 2105.09323.
- [39] Norris, J. P. et al. Long-Lag, Wide-Pulse Gamma-Ray Bursts. ApJ 627, 324–345 (2005). astro-ph/0503383.
- [40] Zhang, B.-B., Uhm, Z. L., Connaughton, V., Briggs, M. S. & Zhang, B. Synchrotron Origin of the Typical GRB Band Function—A Case Study of GRB 130606B. ApJ 816, 72 (2016). 1505.05858.
- [41] Ghirlanda, G. et al. Bulk Lorentz factors of gamma-ray bursts. A&A 609, A112 (2018). 1711.06257.
- [42] Ruiz, M., Lang, R. N., Paschalidis, V. & Shapiro, S. L. Binary Neutron Star Mergers: A Jet Engine for Short Gamma-Ray Bursts. ApJ 824, L6 (2016). 1604.02455.
- [43] Ruiz, M., Paschalidis, V., Tsokaros, A. & Shapiro, S. L. Black hole-neutron star coalescence: Effects of the neutron star spin on jet launching and dynamical ejecta mass. Phys. Rev. D 102, 124077 (2020). 2011.08863.
- [44] Rosswog, S. Fallback accretion in the aftermath of a compact binary merger. MNRAS 376, L48–L51 (2007). astro-ph/0611440.
- [45] Troja, E., King, A. R., O’Brien, P. T., Lyons, N. & Cusumano, G. Different progenitors of short hard gamma-ray bursts. MNRAS 385, L10–L14 (2008). 0711.3034.
- [46] Piro, A. L. & Kollmeier, J. A. Evidence for Cocoon Emission from the Early Light Curve of SSS17a. ApJ 855, 103 (2018). 1710.05822.
- [47] Nicholl, M. et al. Tight multimessenger constraints on the neutron star equation of state from GW170817 and a forward model for kilonova light-curve synthesis. MNRAS 505, 3016–3032 (2021). 2102.02229.
- [48] Tang, C.-H., Huang, Y.-F., Geng, J.-J. & Zhang, Z.-B. Statistical Study of Gamma-Ray Bursts with a Plateau Phase in the X-Ray Afterglow. ApJS 245, 1 (2019). 1905.07929.
- [49] Popham, R., Woosley, S. E. & Fryer, C. Hyperaccreting Black Holes and Gamma-Ray Bursts. ApJ 518, 356–374 (1999). astro-ph/9807028. {methods}
0.9 The gravitational wave observation for the NS-BH coalescence.
The NS-BH coalescence has been confirmed recently by gravitational wave observation (GW200105 and GW200115), in LIGO’s and Virgo’s third observing runs[54]. For GW200105, the masses of the BH and NS are 8.9 and 1.9 , respectively. While for GW200115, the masses are 5.7 and 1.5 , respectively. Unfortunately, no electromagnetic counterpart (GRB or kilonova) has been identified. The reason may be the low projected-aligned spin for the BH, based on GW observations. Namely, these two mergers are plunging events[55, 56]. However, the BHs in some observed high-mass X-ray binaries, which could be the progenitors of the NS-BH system, are claimed to have a high spin[57]. So far, whether the GRB can be produced by NS-BH coalescence is still uncertain. More detected NS-BH coalescences in the future will surely settle down this. In this work, for GRB 211211A, we find convincing evidence that it (and other short GRBs with EE) comes from the NS-BH merger.
0.10 The kilonova thermal emissions from the NS-NS merger and NS-BH merger.
The neutron-rich ejecta, from the NS-NS merger or NS-BH merger, will undergo rapid neutron capture (r-process[58]) nucleosynthesis, producing the heaviest elements like platinum and Lanthanide. Then, the radioactive decay of these unstable nuclei will power a rapidly evolving ( days), supernova-like transient in NIR or optical band, known as “kilonova”[14, 30].
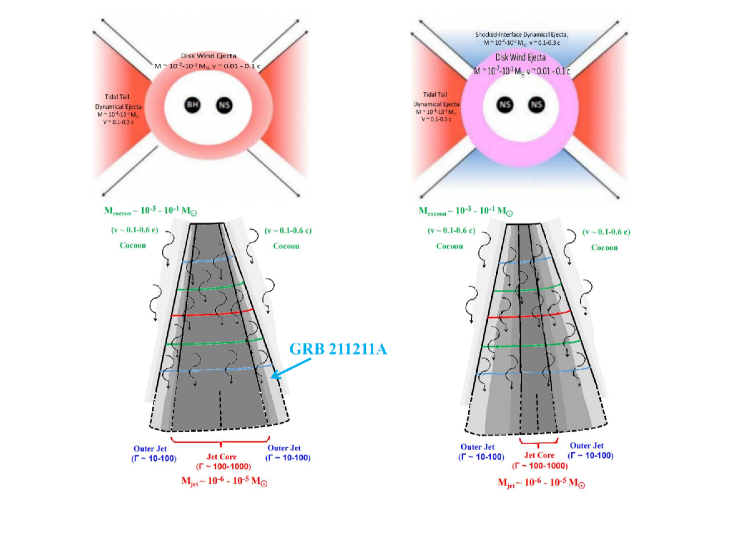
For the NS-NS merger, the kilonova emission consists of the “red” component (the opacity cm2 g-1, from lanthanide-rich dynamical ejecta in the equatorial plane), the “blue” component ( cm2 g-1, from lanthanide-free dynamical ejecta in the polar directions, produced by shock heating in the contact interface between the merging stars; the dynamical shock enriches the electron fraction and thus lowers the neutron fraction), and the “purple” component ( cm2 g-1, from intermediate-opacity isotropic disk wind ejecta; moderate neutrino irradiation from the longer-lived NS remnant lowers the lanthanide fraction) (see Ref.[30] and Extended Data Figure 1).
For the NS-BH merger, the kilonova emission only contains the “red” components from the dynamical ejecta (in the equatorial plane, by tidal forces that disrupt the NS) and the disk wind ejecta.
0.11 The cocoon thermal emission.
When the jet propagates crosses the stellar envelope (for long GRBs) or the dynamical ejecta (for short GRBs), the dense material in the envelope or ejecta will be spilled sideways, forming a cocoon[28] that engulfs the jet and collimates it to make the structured jet. The GRB jet dissipates significant (may comparable) energy of itself to the cocoon through the shock. The adiabatic cooling of shock-heated material (outside the structured jet, see Extended Data Figure 1) produces a transient quite similar to the blue kilonova (at optical band, peaks at 1 day or much earlier).
0.12 Cocoon plus “red” kilonova model fitting for the afterglow-subtracted optical-NIR data[10].
We fit the afterglow-subtracted photometry with the modified model (cocoon plus “red” kilonova) using the MOSFiT (Modular Open Source Fitter for Transients[59]) platform. The fitting goodness for EMCEE sampling is given by the WAIC (“Watanabe-Akaike information criterion”[60]). Here, WAIC 21 is obtained for 49 data points. For the nested sampling with DYNESTY, the total model evidence is ln(Z) 21, almost the same as that obtained in Ref.[10] (ln(Z) 20-25). The shown results are for the EMCEE sampling.
The mass of the “red” kilonova component, , is consistent with that in Ref.[10] (). For DYNESTY sampling, higher is preferred (), may also be higher. A significant improvement for our fitting, using the cocoon component instead of the “blue” and “purple” kilonova components[10], is the better explanation of the late-time (1.68 days, 2.68 days and 5.11 days) i-band data.
0.13 The photosphere thermal model for -ray prompt emission.
The existence of the photospheric emission is the basic prediction of the classical fireball model[61, 62] for GRB, because the optical depth at the jet base is much larger than unity[63]. As the fireball expands and the optical depth drops down, the internally trapped thermal photons finally escape at the photosphere (). Indeed, based on the spectral analysis, a quasi-thermal component has been found in several Fermi GRBs (especially in GRB 090902B[64]). But whether the typical observed Band function[65] (smoothly joint broken power law) or cutoff power law (CPL) can be explained by the photosphere emission, namely the photosphere emission model, remains unknown. If this scenario is true, the quasi-thermal spectrum should be broadened. Theoretically, two different broadening mechanisms have been proposed: subphotospheric dissipation (namely the dissipative photosphere model[66, 67, 68]) or geometric broadening (namely the probability photosphere model[20, 21, 33, 69, 22, 23, 24]).
0.14 Previous observed supports for the photosphere emission model.
First, a quasi-thermal component has been found in a great amount of BATSE GRBs[70] and several Fermi GRBs (especially in GRB 090902B and GRB 170817A)[64, 2, 16]. Second, lots of bursts have a low-energy spectral index harder than the death line (or the maximum value, = 2/3) of the basic synchrotron model, especially for the short GRBs and the peak-flux spectrum[71, 72]. Third, the spectral width is found to be quite narrow for a significant fraction of GRBs[73]. Fourth, for a half or more of the GRBs, the cutoff power law is the best-fit empirical model, indicating that the photosphere emission model can naturally interpret their high-energy spectrum. Fifth, recently in Ref.[25], by dividing the GRB sample into three sub-samples based on the prompt efficiency , the observed - distribution[74] of each sub-sample can be perfectly explained by the photosphere emission model. Also, for each subsample, the characteristics of the X-ray afterglow and optical afterglow are well consistent with the predictions of the photosphere emission model.
0.15 The probability photosphere model.
For the traditional photosphere model, the photosphere emission is all emitted at the photospheric radius , where the optical depth for a photon propagating towards the observer is equal to unity (). But, if only there is an electron at any position, the photon should have a probability to be scattered there. For an expanding fireball, the photons can be last scattered at any place in the fireball with a certain probability. Thus, the traditional spherical shell photosphere is changed to a probability photosphere, namely the probability photosphere model[20].
For the probability photosphere model, the observed photosphere spectrum is the overlapping of a series of blackbodies with different temperatures, thus its low-energy spectrum is broadened. After considering the jet with angular structure, the observed typical low-energy photon index [71, 72], spectral evolution and evolutions (hard-to-soft evolution or -intensity tracking[75]) can be reproduced[33, 23, 24], from the theoretical perspective.
0.16 The structured jet with .
For GRBs, the jet launched by the center engine will be collimated, by the gas envelope of the progenitor star for long GRBs [34], and the dynamical ejecta for short GRBs[76, 77]. Thus, the structured jet[78, 79] should both exist. Noteworthily, based on the unusual performance of the prompt emission and the afterglow of GRB 170817A (the first joint detection of short GRB and gravitational wave), a structured jet in it is strongly favored[80, 81].
Normally, for a structured jet, is assumed for simplicity. But whether this is the real situation is quite uncertain and without proper reasons. Considering that is true, the material density within (or beyond) the core should be rather isotropic. This may conflict with the collimation condition. Theoretically, the progenitor envelope (or dynamical ejecta) is matter-dominated and should make the shocked jet have an enhanced material density at larger angle when collimation happens. Then, because , the Lorentz factor should start to decrease even when the remains constant (see Figure 3 in Ref.[35] and similar discussion in Ref.[24]). Besides, is supported in many simulations, including both hydrodynamical ones[34, 35, 38] and magnetohydrodynamical ones (MHD, Refs.[36, 37]).
On the other hand, as shown in Extended Data Figure 1, the jet energy (mainly for the inner isotropic core, [41], and ) is comparable to the outside cocoon energy (, and ; Ref.[28]). Thus, the large , may extending to the non-relativistic cocoon region, is reasonable (may available for most bursts, and at least for a part). Besides, numerical simulations for the jet-cocoon interaction[28] suggest roughly constant energy within the cocoon (including the jet region, especially the mildly relativistic region; see Figure 2 therein), namely .
0.17 Saturated and unsaturated acceleration, and [25] respectively.
For the photosphere emission model, should correspond to the saturated acceleration (; ) case, since . Here, . The adiabatic cooling exists at .
While, should correspond to the unsaturated acceleration (; ) case, since . The adiabatic cooling does not exist.
0.18 The duration distribution test for long and short GRBs.
As mentioned above, the photosphere duration stretching expects that the bursts with (saturated) should have a longer duration than that with . In Extended Data Figure 2a, we compare the duration distributions of the and samples (see Ref.[25]) for the long GRBs. As expected, the sample has a much longer ( 0.2 dex, namely 1.6 times) duration. Also, apart from the mean values, these distributions are similar.
Surprisingly, for the short GRBs (see Extended Data Figure 2b), the sample has a much shorter ( 0.1 dex, namely 1.3 times) duration. Furthermore, the distribution of the sample is less extended. Considering these two properties, we think these two distinguished samples may originate from different sources. According to the simulations of NS-NS[42] and NS-BH mergers[27, 43, 26], the short GRBs from NS-NS merger typically have a smaller duration of 0.1 - 0.2 s[42], entirely consistent with the result of the sample (Note that the mean value 10-0.5 should be decreased by 1.6 - 2 times due to the photosphere duration stretching effect). While, the short GRBs from the NS-BH merger typically have a larger duration of 0.8 s[43], more consistent with the result of the sample (for the MP).
Besides, for the NS-BH merger, since the disk mass (crucial to the duration) depends on many parameters of the NS and BH, as follows (see Ref.[26]):
| (4) |
Here, and are the mass and radius of the NS, means the NS compactions. and is the mass of the BH. And, is the radius of the innermost stable circular orbit, which strongly depends on the BH spin . The duration distribution for the NS-BH merger is expected to be more extended, just similar to the distribution of the sample (could be smaller to 0.05 s, and larger to 3 s).
0.19 The theoretically predicted - distribution and observed - distribution.
As mentioned above, the observed overlapped photosphere spectrum should be broadened. Previous studies[33, 23, 24] show that, for a uniform jet can be softened to 0. Whereas, for the structured jet considered here, could be much softer, reproducing the observed typical -1. Because that, according to Equation , the extra low-energy contribution within angle of is proportional to ( is the angle aparted from the line of sight). When smaller is obtained for , the extra low-energy component will be greatly enhanced.
In Extended Data Figure 3a, we show the schematically theoretically-predicted - distribution (the dashed lines)[33, 23]. Two categories are obviously seen: smaller and larger . Notice that, acturally is likely expected for structured jet. But, we think these three quantities are likely to change with the same trend. Namely, with larger , and are both larger. For smaller ( 1), regardless of the , the decreasing- component always exists within . Thus, the is quite soft, clustered around - 1. For larger , has great effect. Normally, is expected. Then, within , the isotropic- component dominates and the decreasing- component contributes less. Thus, the should be quite hard, ranging from 0 to - 0.7. However, when is obtained with lower chance, the decreasing- component dominates, can range from - 1 to - 2.
Interestingly, the above theoretically predicted - distribution seems to be consistent with the observed - distribution ( is taken from Ref.[82]), shown also in Extended Data Figure 3a. For smaller (may also), the is clustered around - 1. When is larger, the becomes much harder (reaching 0), except for a few bursts (including GRB 211211A and GRB 060614). These outliers are likely to be due to the larger ( ).
0.20 The photosphere explanation for the -flux-tracking evolution[83, 11].
As shown in Extended Data Figure 5b, the softer can be obtained in the earlier time (0.3 s). Unlike the origin of the softer in the later time (due to the delayed low-energy high-altitude emission emitted around the peak time, see discussions in Refs.[23, 83]), it is due to the comparability of the peak energies for the isotropic- component and the decreasing- component. These two peak energies both strongly depend on the luminosity and have distinguished dependences (since and are different) if any one is in the saturated-acceleration regime. For the strongly saturated (at the peak time) case, such as our adopted parameters and GRB 211211A, in the earlier time (0.3 s) the peak energy of the decreasing- component is smaller (but not extremely, 10 times) than that of the isotropic- component, thus contributing a great part to the low-energy spectrum and making the softer. So, combined with the softer after the peak time, the special -flux-tracking evolution[83, 11] in a few bursts (including GRB 211211A) is explained.
0.21 The 2SBPL spectra in GRB 211211A.
For the spectra of GRB 211211A, just as stated in Ref.[13] (with low-energy BAT data), the 2SBPL model is likely to be the better empirical model (statistic/dof = 480/353 for 2SBPL model, statistic/dof = 642/355 for Band function, of 3.0 1.0 s). In Ref.[11], similar conclusion is drawn. For the fit with the CPL model, the residuals show obvious rising trend in the low-energy ( 8 - 30 keV) end, indicating a much harder ( - 0.5 to 0) component there (pgstat/dof = 440.78/362, of 3.4 - 3.5 s). The low-energy hard component may exist in all the bursts (with almost fixed energy break 20 keV, as discussed in the following for the photosphere model). But considering the high redshift (z 1 - 2) for most bursts, the energy break will decrease to 8 keV (beyond the Fermi energy range, thus not obvious). For GRB 211211A, with z = 0.076, the low-energy hard component is significant.
0.22 The drawbacks for the synchrotron origin[13] of the 2SBPL spectrum.
First, as shown in Figure 3 and Table 1 of Ref.[13], is all harder than the synchrotron death line = 2/3. Second, the high-energy index is almost close to - 3, indicating a cutoff in the high-energy end. Third, - 1 according to Ref.[11], while - 3/2 is obtained in Ref.[13]. This conflict is likely to come from the inaccurate power-law formular in the high-energy end for the 2SBPL model (thus the statistic of the CPL model is comparable to that of the 2SBPL model, even though its low-energy fitting is bad). Since for the CPL spectrum, towards the higher energy, the will gradually change from -1 to - Inf, mimicking a much softer - 3/2 when the power-law formular is taken. In total, the best-fit empirical model for GRB 211211A is likely to be the CPL high-energy spectrum combined with a smoothly broken power law in the low-energy end, which resembles the photosphere spectrum in Extended Data Figure 4a.
0.23 The low-energy break explanation by the photosphere model.
Notice that, for the photosphere model, the low-energy break is naturally expected. Since the low-energy blackbody component comes from much earlier injection (with larger , then arriving later and obtaining lower energy due to the Doppler effect). In real GRB and our calculation, limited injection duration ( a few seconds) is expected. So, the lowest blackbody energy (mainly depends on the injection duration) should correspond to the injection of seconds earlier, and regardless of the prompt injection. Then, an almost fixed low-energy break is predicted (for 1 second, 10 keV, see the red and green lines of Figure 2 in Ref.[23]). The photosphere low-energy break ( 10 keV) has been shown in Figures 6 - 9 of Ref.[23] (especially the red lines). For GRB 211211A, as shown in Figure 3 and Table 1 of Ref.[13], the almost fixed low-energy break ( 20 - 30 keV) indeed exists, strongly favoring the photosphere origin.
0.24 The possible photosphere explanation for the extended emission lasting 100 s.
As mentioned above, the observed late-time (a few tenths seconds) low-energy ( keV) SBPL spectrum could be produced by the photosphere high-altitude effect (see Extended Data Figure 4a). But, whether the theoretical flux decay can match the flux decay of observed EE is very crucial. In Extended Data Figure 5a, we compare the theoretical flux decay with that of GRB 211211A. Obviously, the observed decay could be reproduced. Notice that, an extra injection at 20 - 30 s is considered, which may come from the fallback accretion of the black hole, for the NS-BH merger. The photosphere high-altitude effect extends this 10 s duration to 100 s.
0.25 The smoother decay of the X-ray afterglow for the structure jet with .
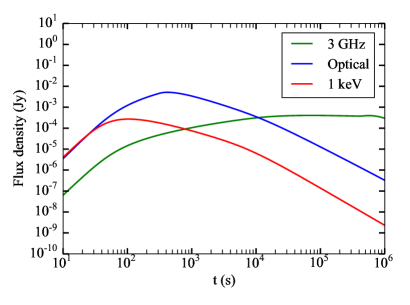
As shown in Refs.[78, 79], for the structured jet with off-axis (, and ), the observed smoother component (close to a plateau, flux ) before normal decay ( ) in most X-ray afterglows[31] can be explained. However, the off-axis condition should be unusual, which conflicts with the usual appearance of the smoother decay.
In this work, as shown in Extended Data Figure 7, we find the usual on-axis condition (, see Figure 1a) can also reproduce the observed smoother decay, when is adopted. This is quite reasonable, since the peak time of the afterglow strongly depends on the ()[41]. The significant structure within will surely result in the overlapping of the afterglow components with different arriving times.
For considered here, the in the light of sight is smaller ( is larger), contributing to the normal decay at the later time. The inner jet (with larger , larger ) will contribute to the earlier component. The flux will be suppressed due to the larger , causing the observed smoother decay (or the plateau of GRB 211211A and GRB 060614, see Ref.[11]).
0.26 Consistent estimates from and .
For the estimate from in Figure 4, a basic constant of is adopted, as for the in Ref.[25] (the gray plus; homogeneous medium with density cm-3 and are still assumed). But another factor of 2.0 is needed for the long GRBs to match these two equations completely. We think it is due to the slight difference between the defined and the real peak time for the observed smaller ( may be 4.0 times larger), since the turning after the plateau is quite smooth. The real peak time may be the earliest turning time ( donates the middle), and the smooth turning component may originate from the weak emission of the most outside jet region (with the smallest , arriving later). Other scenarios, such as smaller density, wind medium or different constant of the photosphere equation, for this off-core (large ) case may also be possible.
For the short GRBs (the constant of the photosphere equation should be 17/1.8), adopting the above factor of 2.0, an extra constant of 2.5 is needed. We think it is due to the smaller density cm-3 (indeed found for the short GRBs[84, 85]) or the smaller photosphere constant than 17/1.8.
Obviously, the bursts with internal plateau (all are long GRBs, considering the factor of 2.0) significantly deviate from the other samples. This indicates that they do have a different origin, likely from the late-time injection of the magnetar[86, 87].
| Parameters | Value |
|---|---|
| “red” kilonova: | |
| () | |
| (km s-1) | |
| Cocoon: | |
| () | |
| (km s-1) | |
| (s) | |
| (K) | |
| (days) |
| Parameters | 2.0 - 3.0 s | 12.0 - 14.0 s | 40.0 - 45.0 s | |
|---|---|---|---|---|
| (rad) | ||||
| (rad) | ||||
| log (erg s | ||||
| log (cm) | ||||
| (s) |