2022
[1]\fnmBenjamin P. \surGompertz
1]\orgdivInstitute for Gravitational Wave Astronomy and School of Physics and Astronomy, \orgnameUniversity of Birmingham, \orgaddress\streetB15 2TT, \countryUK
2]\orgdivDepartment of Astrophysics/IMAPP, \orgnameRadboud University, \orgaddress\street6525 AJ Nijmegen, \countryThe Netherlands
3]\orgdivINAF, \orgnameAstronomical Observatory of Brera, \orgaddress\streetvia E. Bianchi 46, \postcode23807, \cityMerate (LC), \countryItaly
4]\orgdivCenter for Computational Astrophysics, \orgnameFlatiron Institute, \orgaddress\street162 W. 5th Avenue, \cityNew York, \postcode10011, \stateNY, \countryUSA
5]\orgdivDepartment of Physics and Columbia Astrophysics Laboratory, \orgnameColumbia University, \orgaddress\cityNew York, \postcode10027, \stateNY, \countryUSA
6]\orgdivSchool of Physics and Astronomy, \orgnameUniversity of Leicester, \orgaddress\streetUniversity Road, \cityLeicester, \postcodeLE1 7RH, \countryUK
7]\orgdivCenter for Interdisciplinary Exploration and Research in Astrophysics and Department of Physics and Astronomy, \orgnameNorthwestern University, \orgaddress\street2145 Sheridan Road, \cityEvanston, \postcode60208-3112, \stateIL, \countryUSA
8]\orgdivNiels Bohr Institute, \orgnameUniversity of Copenhagen, \orgaddress\streetJagtvej 128, \postcode2200, \cityCopenhagen N, \countryDenmark
9]\orgdivSRON, \orgnameNetherlands Institute for Space Research, \orgaddress\streetNiels Bohrweg 4, \postcodeNL-2333 CA, \cityLeiden, \countrythe Netherlands
10]\orgnameBar Ilan University, \orgaddress\cityRamat Gan, \countryIsrael
The case for a minute-long merger-driven gamma-ray burst from fast-cooling synchrotron emission
Abstract
For decades, gamma-ray bursts (GRBs) have been broadly divided into ‘long’- and ‘short’-duration bursts, lasting more or less than 2 s, respectively. However, this dichotomy does not map perfectly to the two progenitor channels that are known to produce GRBs – the merger of compact objects (merger-GRBs) or the collapse of massive stars (collapsar-GRBs). In particular, the merger-GRBs population may also include bursts with a short, hard 2 s spike and subsequent longer, softer extended emission (EE). The recent discovery of a kilonova – the radioactive glow of heavy elements made in neutron star mergers – in the 50 s-duration GRB 211211A further demonstrates that mergers can drive long, complex GRBs that mimic the collapsar population. Here we present a detailed temporal and spectral analysis of the high-energy emission of GRB 211211A. We demonstrate that the emission has a purely synchrotron origin, with both the peak and cooling frequencies moving through the -ray band down to the X-rays, and that the rapidly-evolving spectrum drives the EE signature at late times. The identification of such spectral evolution in a merger-GRB opens avenues for diagnostics of the progenitor type.
GRB 211211A was detected by Fermi-GBM and Swift-BAT at :09:59 UT on 2021 December 11. It was initially classified as a long burst due to its measured duration of s (10 keV – 10 MeV; Fermi Mangan21 ) and s (15 – 150 keV; Swift Stamatikos21 ), in excess of the s divide Kouveliotou93 . Swift promptly slewed to point its X-ray Telescope (XRT; Burrows05 ), which began settled observations of the field s after the BAT trigger D'ai21 . X-ray observations showed bright emission ( – keV flux erg s-1 cm-2) with an exponential decay lasting until s after trigger, consistent with previous examples of EE (e.g. Norris02 ; Norris06 ; Norris10 ; Gompertz13 ). The Ultra-Violet/Optical Telescope (UVOT; Roming05 ) began pointed observations of GRB 211211A 92 s after the BAT trigger Belles21 , and detected the optical counterpart. Late monitoring Rastinejad22 identified a significant near-IR excess which cannot be explained by radioactive Nickel decay but is remarkably similar to AT2017gfo, the kilonova discovered alongside GRB 170817, confirmed to be a binary neutron star (BNS) merger by gravitational-wave (GW) observations Abbott17_BNS . The detection of a kilonova establishes that GRB 211211A originated from a compact merger (see Methods). Its association with a host galaxy at (Malesani21, ; Rastinejad22, ) makes it the closest confirmed compact object merger discovered without GWs, at a luminosity distance of just 350 Mpc. Due to its proximity, GRB 211211A has the best-sampled high energy emission of any merger-driven GRB, and its surprisingly long duration affords us a remarkable opportunity to investigate the underpinning processes that enable compact object mergers to create long-duration GRBs. The burst was also detected at GeV frequencies Mei22 ; Zhang22 .
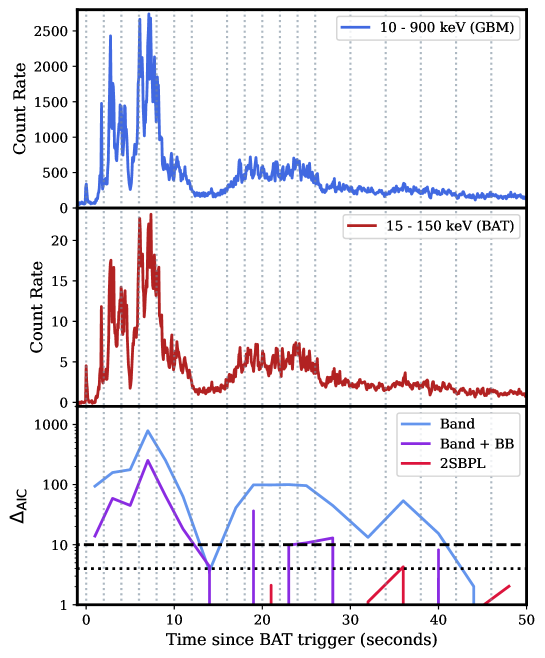
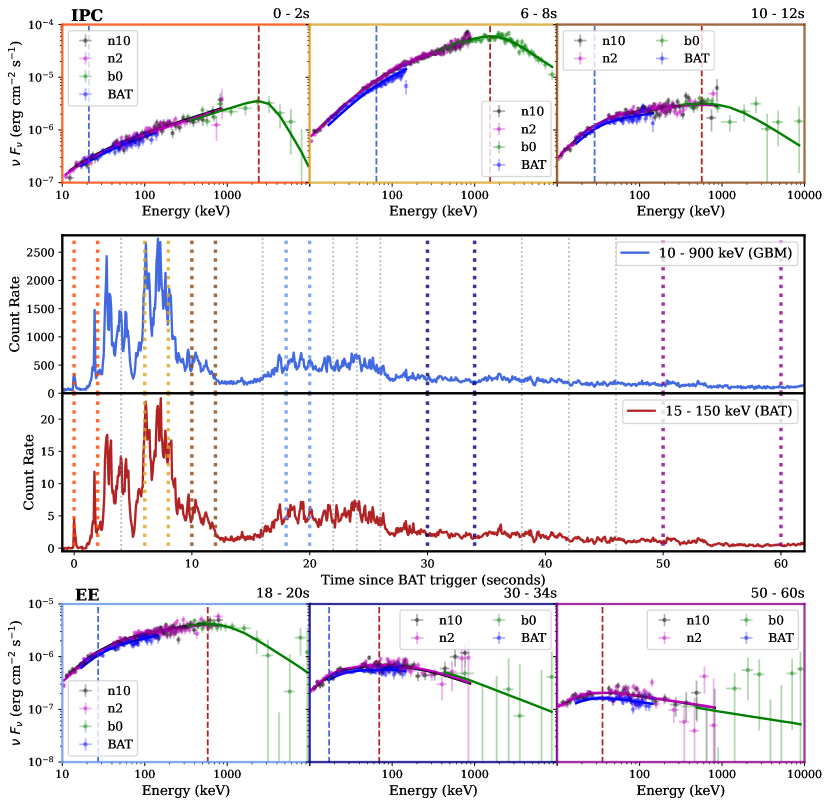
We extract time-resolved spectra in narrow windows of 2–20 s from the Swift and Fermi data and initially fit these with a range of spectral models using xspec v12.11.1 (Arnaud96, ) (see Methods). Spectra from six representative epochs are shown in Figure 1, covering the spectrally hard Initial Pulse Complex (IPC) and softer EE. Although these episodes are distinct in the established nomenclature and are often discussed as such in this work, we do not discriminate between them in our fitting procedure, where we choose our spectral time bins based on signal-to-noise. The IPC and EE structure is reminiscent of GRB 060614, a s long GRB at that was strongly suspected to be a merger due to a lack of a supernova to deep limits (Gehrels06, ). Notably, the hard prompt emission is almost twice as long in GRB 211211A, further emphasising the diversity of merger-driven events. We find that the data are well described by a double smoothly broken power-law model (2SBPL; Ravasio18 , shown in Figure 1). A standard Band function (Band93, ) with a single break is strongly disfavoured by Akaike’s Information Criterion Akaike74 ; Burnham04 (Figure 2). A Band model with an additional thermal component is also disfavoured with respect to 2SBPL, especially in the brightest pulses, and further requires a high intrinsic hydrogen column density, inconsistent with the burst’s afterglow Rastinejad22 (see Methods). The model parameters derived from our full suite of fits are given in Table 1. We focus the rest of our discussion on the 2SBPL model (though for epochs where one of the breaks lies outside the observed frequency range, this reduces to the Band model; see Methods).
The 2SBPL model parameterises a synchrotron spectrum, where relativistic charged particles radiate due to acceleration in magnetic fields. The spectrum is described by power-law segments connecting characteristic break frequencies (see e.g. Rybicki1979, ; Sari1998, ; Piran1999, ). The three power-law segments have photon indices , and (following the convention , for a photon index ), smoothly connected at two breaks, and . These breaks map to the characteristic synchrotron frequency , where most of the electrons radiate, or the cooling frequency , above which electrons rapidly lose their energy. If , all electrons cool down rapidly and the system is in the so-called ‘fast cooling’ regime, while represents a ‘slow cooling’ state (see Methods for more details).
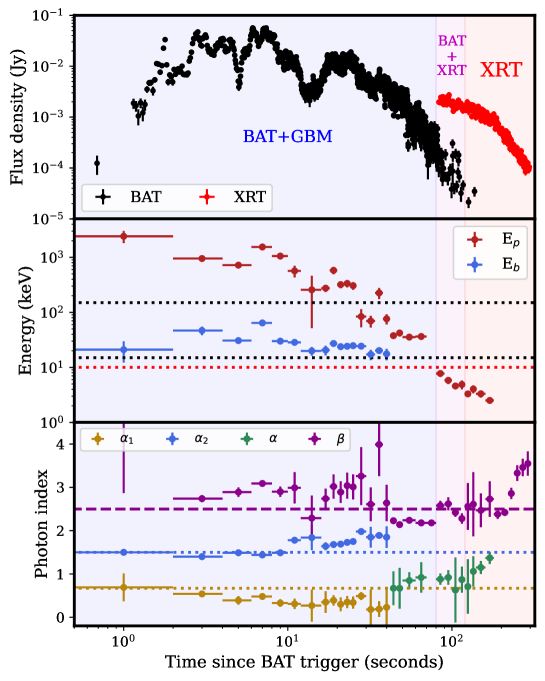
The -ray and X-ray light curves of GRB 211211A and the evolution of the best-fit 2SBPL parameters are shown in Figure 3. During the first 42 s of evolution, we see a rapid decrease in from an initial keV to keV. also shows a smooth but much slower decline from a maximum of keV to keV. We find mean indices of and . These values are in excellent agreement with the expected values of 2/3 and 3/2 for synchrotron emission in the fast-cooling regime. Evidence for the presence of two breaks has been previously found in bright GRBs detected by both Fermi Ravasio18 ; Ravasio19 ; Ronchi2020 ; Burgess2020 ; Toffano2021 and Swift Oganesyan17 ; Oganesyan2018 ; Oganesyan2019 , but all were collapsar GRBs rather than merger-driven.
After 42 s, is unresolved and we fit a single photon index, , below . Initially, the fitted values of are in excellent agreement with the expected value of (Figure 3, lower panel, green points), indicating that and are unresolved because they are too close together, rather than having left the bandpass. From 120 s, the measured value of begins to rise. We interpret the change as being due to the synchrotron breaks now moving away from one another (Methods), resulting in dominating the measurement as approaches the lower limit of the observed bandpass and pushes out of the spectrum.
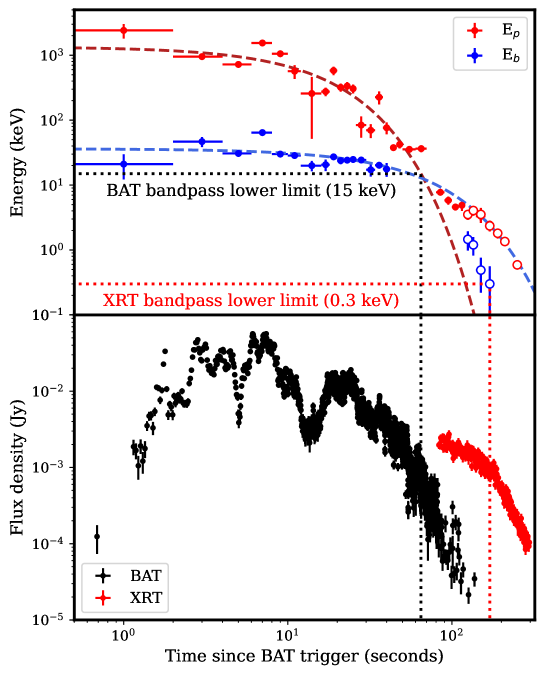
Indeed, by fixing the photon indices to their expected values, we can once again resolve in our fits starting from 120s (Figure 4, open symbols). The increasing separation between and and the coincident evolution of from 2/3 towards 3/2 indicates that the more rapidly-evolving spectral break is now the lower energy of the two, in contrast with the first 42 s of evolution. This apparent crossing of the two spectral breaks is consistent with the source having transitioned from a fast-cooling regime to slow cooling (Rybicki1979, ; Sari1998, ).
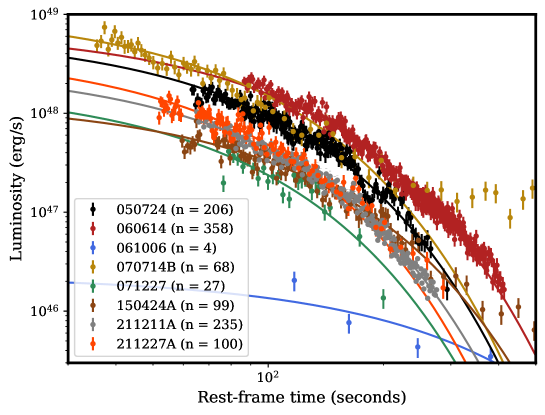
We further test this scenario by fitting an exponential profile of the form to the evolution of both breaks (Figure 4). The two profiles cross at s, and their crossing is further supported by the affinity of the fit to the measurements post-. The evolution of the breaks has a marked effect on the EE light curve. The characteristic timescale for the evolution of ( s) and the turnover of the X-rays ( s) are close to the fast-to-slow cooling transition time ( s) suggesting a connection between the cooling transition and the EE duration. Moreover, they are clearly driving the morphology of the late X-ray decline, which steepens when evolves below the band and ceases when follows (Figure 4). The consistency of this X-ray feature across the EE class (e.g. Gompertz13 , Figure 5) hints that the shock physics may be remarkably uniform across the population of long-duration merger-GRBs.
At higher energies, the characteristic timescale of ( s) is well matched to the duration of the IPC ( s). This likely relates to the duration of the jet, which energises the shock during the IPC, keeping consistently high. Although the duration of -ray EE is highly variable across the known sample (e.g. Supplementary Table 1), the evolution of through the BAT bandpass can explain the relative spectral softness of EE compared to the IPC (e.g. Norris10 ). This framework also naturally leads to the population of GRBs that display the same exponential X-ray light curve as GRB 211211A and other EE GRBs (e.g. Figure 5), but lack EE in -rays Lu15 ; Gompertz20 . This can be achieved with a common evolution in , while is found at lower energies below the BAT bandpass (after the IPC). Further, if is in fact below the XRT bandpass in the majority of cases, one might recover a ‘canonical’ short GRB lasting less than s. However, this would imply a significant duration of ‘unseen’ jet activity in these events.
Our analysis shows that the prompt emission spectrum of GRB 211211A is consistent with the so-called ‘marginally fast-cooling regime’, with (KumarMcMahon2008, ; Daigne11, ; Beniamini2013, ). Detecting the cooling frequency at tens of keV implies that accelerated particles do not cool completely via synchrotron processes within a dynamical timescale (Ghisellini2000, ). By assuming that the electrons cool on a timescale of the order of the adiabatic one, we can derive self-consistent constraints on the magnetic field in the emitting region. For a typical emitting region radius and a bulk Lorentz factor of (consistent with the afterglow; Rastinejad22 ), our findings imply a magnetic field of the order of G, where (the magnetic field falls in the range G for a range of cm). These values are consistent with those derived for marginally fast-cooling collapsar-GRBs Oganesyan2019 ; Oganesyan17 ; Oganesyan2018 ; Ravasio18 ; Ronchi2020 , but at odds with the expectations for a typical GRB emitting region ( G, e.g. Piran2005 ).
Interestingly, we find that the UVOT data at 163 s lie significantly below the extrapolation of the fitted synchrotron spectrum (see Methods, Figure 6). An additional spectral break is required to self-consistently model the spectral energy distribution (SED) from UV to X-rays. In the context of synchrotron emission, this can be interpreted as the synchrotron self-absorption frequency , below which the optical depth to synchrotron self-absorption is larger than unity. Following Shen2009 (but see also Sari1999 ; Granot2000 ; Granot2002 ; Beniamini2013 ), we find that this implies a low -field ( G) and/or compact emitting region ( cm). However, a self-consistent solution that incorporates incomplete electron cooling and synchrotron self-absorption at UV frequencies is challenging, and may require alternative sources of absorption or modified synchrotron models (e.g. Ghisellini2020 ) - particularly to avoid the bright synchrotron self-Compton emission predicted for such a system (see e.g. Ghisellini2020 ; KumarMcMahon2008 ; Beniamini2013 ).
The identification of rapidly-evolving synchrotron emission as the driving force behind long-lived GRBs from mergers is an important step in understanding their genesis. Fundamentally, we do not know how a merger can produce 100s of emission in some cases, since this is well in excess of the expected s accretion timescale of the post-merger torus (e.g. Lee09 ; Fernandez&Metzger13 ). The two main explanations available in the literature are delayed fall-back accretion, or long-lived activity from the central engine.
Delayed fallback is typically invoked for a neutron star - black hole (NS-BH) merger, where a larger tidal tail of ejecta is expected (e.g. Foucart18 ). In this case, EE might be related to the quantity and duration of the fall-back mass (e.g. Rosswog07 ; Desai19 ). On the other hand, the characteristic s duration of the EE has no obvious explanation in the fall-back accretion scenario (however, see Kisaka15 ). The kilonova associated with GRB 211211A is consistent with being a BNS merger Rastinejad22 , though an NS-BH cannot be completely ruled out. In the BNS scenario, EE may be powered by a temporarily or indefinitely stable magnetar remnant (e.g. Metzger08 ; Metzger11 ; Giacomazzo13 ; Gompertz14 ) via a relativistic magnetized wind, potentially shaped by interaction with the merger ejecta into a collimated jet (e.g. Bucciantini12 ). An abrupt change in jet properties is predicted to occur once the magnetar becomes optically-thin to neutrinos, on a timescale of s Pons99 , which is suitable for EE. This transforms the composition of the magnetar outflow from an electron-ion plasma to an electron-positron outflow similar to that of a pulsar wind Metzger11 . Regardless of which, if either, model is the correct physical picture, establishing the observed evolution of and across the EE population represents the first step towards mapping these spectral features to the progenitor binary and post-merger remnant.
The brightness of GRB 211211A enables us to deconstruct both the initial prompt emission complex and the subsequent, softer extended emission. Our results suggest that the characteristics of EE in a merger-GRB with a long-lived engine depend mainly on where the synchrotron spectral breaks reside relative to the observational bandpasses. For the first ten seconds of the burst, and show little evolution. Therefore this period shows no spectral evolution and no spectral lag, a critical distinguishing feature of EE-GRBs (Gehrels06, ). After this time, softens rapidly, creating the observed softer EE component. Therefore, this evolution naturally explains both the lack of spectral lag in the early emission and the later softening seen in EE bursts. While only GRB 211211A has observations of the requisite quality to measure the motion of the spectral breaks directly, there is substantial similarity in spectral evolution and X-ray light curves in all EE bursts (see Methods). This implies that the same physical processes likely shape the entire class of events, and the 211211A template enables this possibility to be tested with a larger sample of merger- and collapsar-driven GRBs even at lower temporal resolution. If such behaviour can be established as unique to mergers through further studies, extended emission can be a smoking gun for the origin of a given GRB even in bursts at much larger distances or with much poorer localisations, e.g. in GW follow-up.
| 2SBPL | ||||||||
| Epoch | NH | fit | dof | |||||
| (s) | (keV) | (keV) | (1020 cm-2) | statistic | ||||
| 1.0 1.0 | 0.69 0.32 | 21.0 8.8 | 1.50 0.06 | 2411.3 602.0 | 4.74 1.87 | — | 315 | 353 |
| 3.0 1.0 | 0.54 0.07 | 46.7 8.2 | 1.40 0.04 | 951.6 47.4 | 2.74 0.08 | — | 480 | 353 |
| 5.0 1.0 | 0.39 0.10 | 30.7 3.3 | 1.49 0.03 | 721.0 47.5 | 2.89 0.11 | — | 401 | 353 |
| 7.0 1.0 | 0.48 0.03 | 64.3 4.9 | 1.44 0.02 | 1543.0 47.5 | 3.09 0.07 | — | 496 | 353 |
| 9.0 1.0 | 0.33 0.09 | 30.0 2.7 | 1.49 0.02 | 1053.6 72.0 | 2.90 0.12 | — | 378 | 353 |
| 11.0 1.0 | 0.31 0.12 | 28.5 2.4 | 1.78 0.04 | 567.1 135.7 | 2.99 0.36 | — | 387 | 353 |
| 14.0 2.0 | 0.27 0.37 | 19.9 3.6 | 1.84 0.29 | 257.3 205.7 | 2.29 0.52 | — | 378 | 353 |
| 17.0 1.0 | 0.35 0.25 | 20.6 4.2 | 1.64 0.09 | 275.0 40.9 | 2.74 0.23 | — | 391 | 353 |
| 19.0 1.0 | 0.39 0.12 | 27.2 2.8 | 1.68 0.04 | 580.0 86.5 | 3.02 0.28 | — | 389 | 353 |
| 21.0 1.0 | 0.30 0.16 | 23.8 2.9 | 1.69 0.06 | 319.6 45.8 | 2.89 0.25 | — | 366 | 353 |
| 23.0 1.0 | 0.35 0.14 | 24.2 2.6 | 1.73 0.05 | 335.2 51.5 | 3.04 0.30 | — | 363 | 353 |
| 25.0 1.0 | 0.34 0.14 | 24.8 2.7 | 1.75 0.05 | 305.5 47.9 | 3.01 0.29 | — | 353 | 353 |
| 28.0 2.0 | 0.49 0.09 | 24.3 0.9 | 1.98 0.02 | 83.9 30.3 | 3.26 0.67 | — | 393 | 353 |
| 32.0 2.0 | 0.18 0.46 | 17.2 3.7 | 1.85 0.24 | 69.8 16.9 | 2.61 0.39 | — | 341 | 353 |
| 36.0 2.0 | 0.19 0.18 | 20.2 1.6 | 1.89 0.04 | 225.6 50.9 | 3.99 0.73 | — | 381 | 353 |
| 40.0 2.0 | 0.23 0.47 | 17.6 4.2 | 1.85 0.25 | 76.3 15.9 | 2.64 0.42 | — | 331 | 353 |
| Band | ||||||||
| Epoch | NH | fit | dof | |||||
| (s) | (keV) | (1020 cm-2) | statistic | |||||
| 44.0 2.0 | 0.67 0.39 | — | — | 37.7 3.06 | 2.23 0.05 | — | 334 | 355 |
| 48.0 2.0 | 0.67 0.47 | — | — | 42.2 5.61 | 2.14 0.05 | — | 337 | 355 |
| 55.0 5.0 | 0.85 0.19 | — | — | 35.5 2.29 | 2.24 0.05 | — | 384 | 355 |
| 65.0 5.0 | 0.92 0.35 | — | — | 36.4 4.32 | 2.18 0.08 | — | 317 | 355 |
| 85.0 5.0 | 0.88 0.13 | — | — | 7.74 0.81 | 2.58 0.11 | 373 | 453 | |
| 95.0 5.0 | 0.92 0.17 | — | — | 5.81 0.83 | 2.62 0.15 | 468 | 530 | |
| 105.0 5.0 | 0.63 0.75 | — | — | 4.59 0.54 | 2.42 0.10 | 442 | 445 | |
| 115.0 5.0 | 0.87 0.30 | — | — | 4.88 0.89 | 2.28 0.12 | 468 | 616 | |
| 125.0 5.0 | 0.71 0.63 | — | — | 3.30 0.37 | 2.56 0.54 | 310 | 408 | |
| 135.0 5.0 | 1.06 0.35 | — | — | 4.04 0.67 | 2.61 0.74 | 375 | 567 | |
| 150.0 10.0 | 1.15 0.15 | — | — | 3.31 0.49 | 2.47 0.39 | 372 | 427 | |
| 170.0 10.0 | 1.37 0.14 | — | — | 2.51 0.30 | 2.73 0.41 | 348 | 478 | |
| Power-law | ||||||||
| Epoch | NH | fit | dof | |||||
| (s) | (1020 cm-2) | statistic | ||||||
| 75.0 5.0 | — | — | — | — | 2.18 0.04 | — | 360 | 357 |
| 190.0 10.0 | — | — | — | — | 2.38 0.11 | 297 | 573 | |
| 210.0 10.0 | — | — | — | — | 2.42 0.08 | 345 | 528 | |
| 230.0 10.0 | — | — | — | — | 2.86 0.13 | 311 | 630 | |
| 250.0 10.0 | — | — | — | — | 3.33 0.18 | 228 | 714 | |
| 270.0 10.0 | — | — | — | — | 3.46 0.20 | 181 | 251 | |
| 290.0 10.0 | — | — | — | — | 3.55 0.28 | 122 | 523 | |
| Afterglow | — | — | — | — | 1.56 0.07 | 1.19 1.61 | 337 | 425 |
Methods
Data products
We retrieved GBM spectral data and their corresponding response matrix files (rsp2) from the online HEASARC archive Gruber14 ; vonKienlin14 ; vonKienlin20 ; Bhat16 . GBM count rate light curves are created using time-tagged event (TTE) data binned to a time resolution of 64 ms (Figure 1). No signal was detected by the Large Area Telescope (LAT) on board Fermi during the prompt emission phase. The source incident angle was greater than 65∘ from the LAT boresight until 800 s after the GBM trigger time.
We downloaded Swift data from the UK Swift Science Data Centre (UKSSDC; Evans07 ; Evans09 ). Data from BAT are processed using the batgrbproduct pipeline v2.48 from NASA’s High Energy Astrophysics Software (HEAsoft v6.28; HEAsoft ). 15–150 keV count-rate light curves are extracted using batbinevt with 64 ms time resolution (Figure 1). Flux density light curves are taken directly from the UKSSDC Burst Analyser. We use the non-evolving data products binned to a signal-to-noise ratio of 4.
To assess spectral evolution, we extract time-resolved spectra in as narrow an interval as possible while retaining sufficient counts for the models to converge. We find that between 0 and 26 s after the BAT trigger, binning the BAT and GBM data into 2 s slices provides the best balance between cadence and signal-to-noise, except for a quiescent period at 12–16 s, which sits between the prompt and EE phases (see Figure 1). This is combined into a 4 s bin. Data between 26 and 50 s are also grouped in 4 s bins. Beyond 50 s we use 10 s bins. At 80 s the GBM data end and the XRT data begin. We continue using 10 s bins of BAT + XRT data up until the end of the BAT data at 120 s after trigger. We then extract 10 s bins of XRT data until 140 s, where we widen our bins to 20 s until the end of the EE phase at 300 s.
Fermi-GBM spectra were extracted using the public software gtburst. We analysed the data of the two NaI detectors with the highest count rates and with the smallest viewing angle (n2, n10) and the most illuminated BGO detector (b0). We selected the energy channels in the range 10–900 keV for NaI detectors, excluding the channels in the range 30–40 keV (due to the iodine K–edge at 33.17 keV), and 0.3–40 MeV for the BGO detector. We modelled the background by manually selecting time intervals before and after the burst and fitting them with a polynomial function whose order is automatically found by gtburst.
After processing with batgrbproduct, time-resolved BAT spectra are extracted using batbinevt. These spectra have a systematic error vector applied via batphasyserr, and batupdatephakw is run to update the ray tracing keywords. We build a detector response matrix for each spectrum using batdrmgen. XRT spectra are extracted using the UKSSDC webtool (Evans07, ; Evans09, ).
Fitting was performed using xspec v12.11.1 (Arnaud96, ). We include a free constant representing an effective area correction (EAC) to account for flux offsets due to the uncertain effective areas of the GBM detectors in flight. This is found to be a few per cent for intra-GBM calibration and up to per cent for GBM-BAT calibration.
Model comparison
We fit our data with three models. The first and simplest is the Band function (Band93, ), which is the standard GRB continuum model and takes the form of two power-laws, with low-energy photon index and a high-energy photon index , smoothly connected at a peak energy :
| (1) |
When there are no spectral breaks in the fitted bandpass, we simplify the Band function to a power-law fit corresponding to either or .
We also test the addition of a blackbody (BB) component, dividing the spectrum into thermal and non-thermal emission. The thermal component represents the emission from the photosphere of the GRB at typical radii of a few times cm from the central engine (Pe'er15, ). Non-thermal emission is produced further out ( cm) either via interactions between expanding shells of material or through magnetic processes.
Finally, we fit a double smoothly broken power-law model (2SBPL; Ravasio18, ). This model allows us to fit the spectra with three power-law segments (with photon indices , and ) smoothly connected at two breaks (hereafter and ):
| (2) |
where
| (3) |
This function represents the synchrotron spectral shape derived from a population of electrons assumed to be accelerated into a power-law distribution of energies, i.e. for . The lower-energy and higher-energy represent either the cooling frequency (, mostly emitted by electrons with Lorentz factor ), or the characteristic synchrotron frequency (, emitted by electrons at ). The order of these breaks dictates the cooling regime: ‘slow cooling’ (), wherein only electrons with cool efficiently within a dynamical timescale, or ‘fast cooling’ (), in which all the electrons cool down rapidly to . The two regimes have specific expectation values for the photon indices between the power-law segments. For fast cooling (), we expect (for ), (for ) and (for ), while for slow cooling () we expect (for ), (for ), and (for ). For the typical parameters of the emitting region ( G, ), the particles are expected to efficiently radiate most of their energy on a timescale much smaller than the dynamical one and therefore the spectra are expected to be in fast-cooling regime (Ghisellini2000, ).
The 2SBPL function has been found to fit the spectra of the brightest Fermi long GRBs significantly better than the standard Band-like single-break function Ravasio19 . The inclusion of the low-energy break (e.g. Oganesyan17 ; Oganesyan2018 ) helps to solve the tension between the typically measured values of in GRB spectra fitted with the Band function (e.g. Preece98 ) and the expected values of and from synchrotron theory (e.g. Ghisellini2000 ). This tension may also be lessened by considering inverse Compton effects in Klein-Nishina regime (e.g. (Daigne11, )). Recent simulations suggest that may actually represent the mean value of these two unresolved spectral slopes Toffano2021 . Motivated by these results, we employ the 2SBPL function to test the consistency of GRB 211211A with a synchrotron-dominated spectrum.
Due to their different treatment of incident photons, the data from the three instruments used in our study must be fit with different fit statistics. For GBM, the background is modelled prior to extracting a spectrum, hence the resultant spectra are fit with PGSTAT, representing a Poissonian source over a Gaussian background. The mask weighting used in BAT means that its data must be fit with statistics. Finally, XRT employs straightforward photon counting, and hence is fit with Cash statistics (Cash79, ). As a result, different model fits cannot be reliably compared with statistic tools like the F-test. We therefore employ Akaike’s Information Criterion (AIC; Akaike74 ; Burnham04 ) to compare models. We find that both the 2SBPL and Band+BB models provide a statistical improvement over the simpler Band function during the first s of data (Figure 2), with indicating no support for the Band function (Burnham04, ) (Supplementary Table 2). The 2SBPL model also provides a consistent improvement over Band+BB fits during the prompt emission phase (Supplementary Table 3).
In epochs that feature data taken with XRT, we include the effects of absorption from the neutral hydrogen column along the line-of-sight in our models. This is split into contributions from the Milky Way and the GRB host galaxy in the form [model]*tbabs*ztbabs (Wilms00, ). Milky Way absorption is fixed to N cm-2 (Willingale13, ), with the contribution from the host galaxy at left free to vary. We find that the Band+BB model requires the host NH to be at least an order of magnitude higher than for fits with the 2SBPL model to achieve similar fit statistics.
To obtain the best measurement of the intrinsic NH, we perform fits to the time-integrated X-ray afterglow for the full set of XRT photon counting (PC) mode data (starting s after trigger). The afterglow spectrum is well described (C-stat/dof = ) by a power-law model with a photon index of . It therefore provides a more reliable measurement of the absorption column than the rapidly evolving time-resolved spectra during EE. We find that N cm-2, consistent with zero and with a upper limit of N cm-2. By contrast, the brightest and best-sampled BAT+XRT bin at 80 – 90 s requires N cm-2 to achieve a good fit with the Band+BB model.
In short GRBs, the absorption column is expected to be constant over the lifetime of the source (e.g. Asquini19, ). In rare cases, variations in NH have been suggested for bright lGRBs (e.g. Campana21, ), but the magnitude of the effect is at most a factor of two, and is sensitive to the choice of spectral model. In addition, an anomalously high neutral hydrogen column was also used to disfavour the thermal model in time-resolved spectral fitting of the EE GRB 060614 (Mangano07, ). We therefore rule out the Band+BB model firstly because our AIC test supports the 2SBPL model during the prompt phase, and secondly because it requires an anomalously high absorption column at X-ray frequencies. We focus the rest of our discussion on the 2SBPL model.
2SBPL fits
We identify a general trend of variable spectral behaviour during the first s (the IPC), which then gives way to a more coherent smooth evolution from the onset of EE ( s) onwards. We describe the evolution of the model parameters in various time windows here.
0 – 80 s: BAT + GBM.
Between 0 and 80 s our spectral coverage ranges from 10 keV to 10 MeV. We fit the full 2SBPL model for the first 42 s of evolution. During this time, we see a rapid decrease in from an initial keV at 0–2 s to keV by 38–42 s. also shows a smooth but much slower decline from an initial keV to keV over the same time range, though is first seen to rise to a peak energy of keV at 6–8 s after trigger.
In the same epoch, early values of show excellent agreement with the expectation value of 2/3 before drifting downwards. The mean value of the low-energy photon index is . The later discrepancy is still consistent with synchrotron expectations within , and can be explained by falling close to the lower GBM bandpass, resulting in a poorly-sampled low-energy power-law segment. A similar issue has been found previously by Ravasio19 (see their figure B.1), who showed that all spectra with notably hard values of the low-energy photon index also had a break energy of keV, suggesting an instrumental effect (the GBM threshold energy is 10 keV). In addition, the smoothness parameter of the fitting function could influence the value of , especially at the edge of the detector bandpass where few energy channels are available to constrain it. We find that a sharper break results in approaching the synchrotron-predicted value of 2/3. However, we retain a consistent smoothness across all of our fits to avoid biasing our results.
The slope of the power-law between and is initially in excellent agreement with the expected value of for fast cooling, but later evolves upwards towards a photon index of 2. This trend may be explained by uncertainties in distinguishing , and as the latter moves downwards though the band. In particular, as the source fades and the signal-to-noise ratio in the high energy GBM BGO detectors decreases, becomes poorly constrained. Our mean values are and .
After 42 s, the 2SBPL model is no longer statistically preferred over the Band function. For consistent fitting, we approximate the Band function by freezing below the bandpass, removing and from the model. The fitted values of are in excellent agreement with the expected value of (Figure 3, lower panel, green points), indicating that and are unresolved because they are too close together rather than having evolved out of the bandpass. We widen our time bins to 10 s after 50 s to improve the signal-to-noise of our spectra. Fitting the simpler Band model between 42 and 80 s results in a much tighter constraint on the post-peak photon index, which now dominates the majority of the bandpass: . This includes a single power-law fit in the 70–80 s bin, indicating that both and are either below or very close to the 10 keV lower bandpass limit of GBM.
We note that, assuming an isotropic-equivalent kinetic energy of the jet erg derived from the afterglow modelling reported in Rastinejad22 and the -ray isotropic-equivalent energy erg we observe in the energy range 10–1000 keV during the first 50 s of emission, the implied prompt -ray efficiency is . This value is consistent with estimates for other GRBs in the literature (e.g. Beniamini2016 ), but requires a large contrast in the jet bulk Lorentz factor (e.g. Beloborodov2000 ). We note however that recent works in the literature found a much smaller efficiency () when the fraction of electrons accelerated at the shock is included as a free parameter in the afterglow model (instead of the typical assumption that all electrons participate – see e.g. Cunningham2020 ; Salafia2021 ). These efficiencies are more compatible with the expectations of an internal shocks model with a mild contrast of bulk Lorentz factors (Rees1994, ; Kumar1999, ; Spada2000, ).
The magnetic field value implied by our findings (–200 G for a range of cm) is consistent with the values derived in the cases of collapsar-GRBs showing marginally fast-cooling synchrotron spectra (Oganesyan2019, ; Oganesyan17, ; Oganesyan2018, ; Ravasio18, ; Ronchi2020, ; Burgess2020, ), but low compared to expectations for a typical GRB emitting region ( G, e.g. Piran2005 ).
For such a low magnetic field in a small emitting region, synchrotron self-Compton (SSC) is expected to dominate the cooling rate (see e.g. Ghisellini2020, ; KumarMcMahon2008, ; Beniamini2013, ). A larger emitting region ( cm) would reduce the SSC luminosity, but is more commonly associated with afterglow radiation and would be inconsistent with the rapid variability of the prompt light curve, unless the Lorentz factor is very high (). One interesting solution to this problem has been recently proposed by Ghisellini2020 , ascribing the emission to proton-synchrotron in dominant adiabatic cooling. While this model offers an interesting alternative, it operates in a relatively small parameter space and its ability to explain all the observations is still under investigation (see e.g. Florou2021, ; Begue2021, ).
80 – 120 s: BAT + XRT.
After 80 s there are too few GBM counts in 10 s bins to obtain sufficient signal-to-noise. However, Swift-XRT began pointed observations of GRB 211211A at s after trigger (D'ai21, ), and we are able to fit combined BAT+XRT spectra between 0.3 and 150 keV (excepting a 5 keV inter-detector gap between 10 and 15 keV). The extension of our spectral coverage down to keV means that the Band function (approximated by 2SBPL with held below the XRT bandpass) is preferred over the single power-law model once more. The low energy index continues to be consistent with the expectations for , indicating that and remain unresolved from one another. continues to evolve smoothly downwards, from keV to keV (see Figure 3, Table 1). The BAT data formally end at s.
120 – 300 s: XRT and a possible transition to slow cooling.
From 120 s, the measured value of begins to rise. We continue to measure a declining that has evolved to just a few keV and a consistent (but poorly constrained) . We therefore interpret the change in as being due to the synchrotron breaks now moving away from one another, resulting in an elongation of the 2SBPL segment between them. Our measured therefore evolves from being dominated by to being a blend of and around the unresolved . The power-law with index then begins to dominate the measurement as it elongates, while approaches the lower bandpass limit and pushes out of the spectrum.
We investigate this possibility by re-fitting the 2SBPL model with and fixed to their expected values (2/3 and 3/2, respectively), leaving the break energies and free. We find that between 50 – 120 s after trigger, the two breaks cannot be resolved from one another even with fixed photon indices. However, after 120 s we measure a clear division again (Figure 4, open symbols). The fixed indices mean that the spectral shape observed at this time is still consistent with the fast-cooling regime (), but it is worth noting that the increasing separation between and and the coincident evolution of from 2/3 towards 3/2 indicates that the more rapidly-evolving spectral break is now the lower energy of the two, in contrast with the first 42 s of evolution. This apparent crossing of the two spectral breaks is consistent with the source having transitioned from a fast-cooling regime to slow cooling (Rybicki1979, ; Sari1998, ) (see Burgess2020 for a possible slow-to-fast cooling transition).
If the spectrum is now slow cooling, is no longer expected to have a value of 3/2, and instead should be . We caution that slow cooling requires . Given that , this is in contrast with the steep values of measured in the early spikes of emission, but is consistent with the values of measured at the implied time of transition (, Figure 3). The transition from fast to slow cooling would therefore also require a change in the electron energy distribution power-law index over time.
For the epochs in which and are unresolved (which are covered by the Band fits in Table 1) we find a mean , which points to and thus an expectation value of in the slow-cooling regime. Unfortunately, beyond 180 s our best fitting model reduces to a power-law while is still evolving, meaning that we are unable to determine whether it supports fast or slow cooling. Our best-fitting 2SBPL model (which is not supported over the power-law fit by AIC) indicates , broadly consistent with either scenario. We note that at very late times evolves to extremely soft values (). This is likely driven by an increase in free NH (see Table 1) and the decreasing signal-to-noise at higher energies in the bandpass.
UVOT: evidence for additional absorption?
Regardless of the cooling regime, the spectral index below the break energy should be . A recent analysis of optical detections obtained during the prompt emission of 21 long GRBs revealed the spectrum between optical and -rays is well-modelled with synchrotron emission, i.e. optical data are consistent with the extrapolation of the expected 2/3 power-law index Oganesyan2019 .
The UVOT detection at s allows us to investigate this possibility in GRB 211211A. We extract a 10 s wide XRT spectrum centred at s and perform a combined fit of the UVOT and XRT data. The UVOT data require the further addition of two zdust components to the model to account for extinction in the GRB host galaxy and the Milky Way. The Milky Way extinction is fixed to (Schlafly11, ). Host extinction is fixed to , representing the upper limit that we derive from modelling the afterglow SED (see Methods: Afterglow SED).
To perform a joint fit of XRT and UVOT data, we use the 2SBPL model and fix , and keV based on the results from our coincident spectral fit in Table 1. was allowed to vary to obtain the best match to the X-ray data, since the fitted epoch is offset in time with respect to the template at s. We find keV.
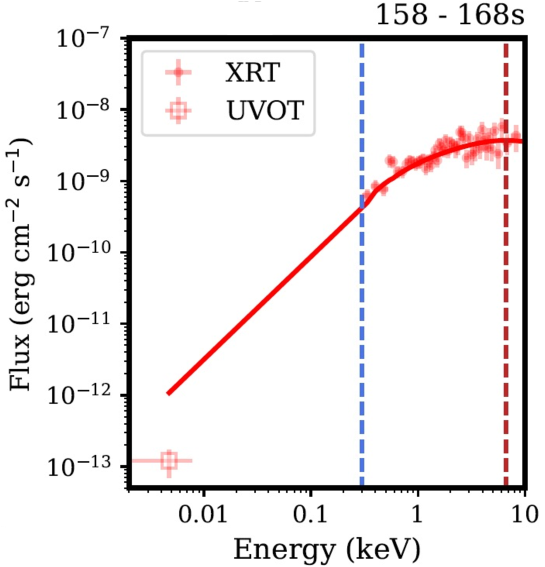
The extrapolation of between the XRT and UVOT data over-predicts the UVOT flux by an order of magnitude (Figure 6). Larger values of extinction would be inconsistent with the afterglow SED observations; a free fit finds , which is inconsistent with our model fit with the highest (see Supplementary Table 4). An additional spectral break may therefore be required between the UVOT white filter and the XRT bandpass. One possibility for this break is the synchrotron self-absorption frequency (), below which photons are absorbed by the emitting electrons (Rybicki1979, ). This region of the spectrum has an expected photon index of (or for an inhomogeneous distribution of electrons; Granot2000 ), and hence can resolve the tension if it lies close to but above the UV.
The co-moving frame synchrotron self-absorption frequency can be computed by equating the co-moving synchrotron flux at to the flux from a blackbody in the Rayleigh–Jeans part of the spectrum. Following Shen2009 , we derived the distance of the emitting region from the central engine that is required to match the observations (i.e. that produce keV 0.3 keV). The synchrotron self-absorption frequency depends on the magnetic field of the emitting region and on the bulk Lorentz factor of the jet. In our computations, we required the magnetic field to be consistent with the one derived from the observed keV during the early prompt emission (see Table 1 and Figure 3) and assumed the same bulk Lorentz factor as before: .
We find that a compact emitting region at cm is required to place between UV and X-rays. We note that the variability timescale implied by such a compact source is in contrast with the smooth emission s after trigger. Moreover, such a small region would imply a high radiation density , increasing the expected SSC luminosity and making it difficult to be optically thin to Thomson scattering and pair production. A larger radius ( a few cm) can be accommodated while still having UVOT XRT by assuming G, but this is inconsistent with the observation of incomplete cooling of the electrons. We therefore conclude it is unlikely that the UVOT flux is suppressed due to synchrotron self-absorption. Other causes of absorption (e.g. synchrotron photons absorbed by a cloud of not completely cooled electrons in the same line of sight, or pair-production with higher-energy photons) have to play a role in shaping the spectrum at low frequencies, but further, more quantitative investigations are needed to assess the feasibility of this process.
Afterglow SED We construct an optical-X-ray SED centred at . The SED was constructed using the methodology of sch10 , using data within a time range of 3 – 10 ks. To construct the pha files for the different optical filters at ks, we first construct a single filter light curve by normalising the individual filter light curves together. Then using this single filter light curve we determine the temporal slope within the 3 – 10 ks interval. We then fit a power-law to the individual filter light curves within this same time interval, fixing the slope to the value determined from the single filter light curve. We use the derived normalisations to compute the count rate and count rate error at ks, which was then applied to the relevant spectral file. For the XRT data, we take PC mode time-slice spectral files built using the UKSSDC webtool Evans09 within the 3 – 10 ks interval. The spectral files were normalised to correspond to the 3 – 10 ks flux of the afterglow at ks. The flux, used to normalise a given spectrum, was determined by fitting a power-law to the temporal data within the SED selected time range. The best-fit decay index was used to compute the flux at ks, in the same way as was done for the optical data.
The SED was fit using xspec v12.11.1, following the procedure outlined in schady07 ; sch10 . We tested two different models for the continuum: a power-law and a broken power-law, with the lower energy photon index fixed to be , which corresponds to the expected spectral slope below the synchrotron peak frequency (Sari1998, ). In each of these models, we also included two dust and gas components to account for the Galaxy and host galaxy dust extinction and photoelectric absorption (phabs, zphabs, zdust; we used zdust for both the Galaxy and host galaxy dust components, but with the redshift set to zero for the Galaxy dust component and set to for the host components). The Galactic components were frozen to the reddening and column density values from schlegel and kalberla , respectively. For the host galaxy dust extinction, we tested the dependence of dust extinction on wavelength for three different scenarios: the Small and Large Magellanic clouds (SMC and LMC, respectively) and on the Milky Way (MW), finding no strong preference for any of these scenarios. In addition, we also account for the absorption due to the Lyman series in the Å restframe wavelength range, with the XSPEC zigm component. We set this component to use the prescription of mad95 to estimate the effective optical depth from the Lyman series as a function of wavelength and redshift and we set this component to also include attenuation due to photoelectric absorption. The results are provided in Supplementary Table 4.
Comparison to other GRBs
The identification of a kilonova by Rastinejad22 means that despite its duration, GRB 211211A is a high-confidence merger event. While this discovery appears to answer the almost 20-year old question posed by the lack of supernovae in the nearby merger candidates GRBs 050724 and 060614 (Barthelmy05b, ; Gehrels06, ), 211211A is also not a typical EE GRB. In particular, the IPC is at least a factor of two longer than any previously identified example, which are generally consistent with the s hard spikes of the broader short GRB class (e.g. Perley09 ; Lien16 ). We note that in this case both BAT and GBM triggered on an extremely faint spike almost 2 s before the ‘main’ episode of prompt emission (e.g. Figure 1). Such a weak pulse would likely not be detectable from much further away than GRB 211211A, and may represent a ‘precursor’ event that artificially extended the IPC duration compared to other EE GRBs. Precursors like this have been suggested to arise from flares due to the resonant shattering of the crusts of pre-merger neutron stars (Tsang12, ; Tsang13, ; Neill21, ). Quasi-periodic oscillations have also been claimed in this feature (Xiao22, ).
We compare the broad properties of GRB 211211A with the sample of EE GRBs with redshifts from Gompertz20 , which we update to include EE GRB 211227A (Lu22, ). We note that Yang22 found GRB 211211A to be spectrally harder than previous EE GRBs during both the IPC and EE phases, though their Band function and cutoff power-law model fits do not capture all of the complex evolution presented here. GRB 211211A has both the shortest and highest of the known EE sample (Supplementary Table 1). 070714B has a shorter in the rest-frame and a comparable , though accounting for redshift in the durations of GRBs has been shown to not be straightforward Littlejohns13 . Despite the diversity in -rays, the X-ray profile of EE is highly similar across all known events (Figure 5).
The sample of merger-driven GRBs investigated by Ravasio19 present a single power-law below the peak, characterized by a hard photon index that is consistent with the expected 2/3 power-law below (if in fast cooling) or (if in slow cooling). In GRB 211211A, both synchrotron breaks have been distinctively identified and tracked in detail, demonstrating that the cooling of electrons via synchrotron processes occurs in merger-driven GRBs. Conversely, the discovery of a power-law segment with photon index 3/2 between and in GRB 211211A is consistent with previous findings for collapsar GRBs, in addition to its long duration.
The measured in GRB 211211A is towards the higher end of the distribution found for the merger-driven GRBs in Ravasio19 , where the value of measured between 0 – 2 s would rank 2/11 (between keV for GRB 120624A and keV for GRB 090227B). This is also higher than the collapsar-driven sample. However, collapsar GRBs display a higher on average by a factor of several. In the extremely bright collapsar GRB 160625B, reached as high as keV and keV at the peak of the main emission episode (Ravasio19, ). There is therefore no particular trend between our 2SBPL fit results for GRB 211211A and those given in the literature for collapsar- and merger-driven GRBs (Ravasio18, ; Ravasio19, ).
Evolution of the breaks
The evolution of the spectral breaks is well-described by an exponential profile of the form in both cases (Figure 4). is best fit with keV and s, while for we find keV and s. The two profiles cross at s, suggesting a transition from fast to slow cooling. Indeed, from 50 s onwards (after the IPC and the peak of the EE luminosity), the spectral shape is consistent with a slow-cooling regime with (Figure 3). Measurements of at early times ( s) are not consistent with this interpretation, and require that the index of the particles’ energy distribution injected by the acceleration mechanism changes before the transition to slow cooling. Notably, is only seen to exceed during spikes in emission, suggesting that this may indeed be the case.
A change in cooling regimes has been claimed recently in Burgess2020 , where the authors found that single-pulse GRB spectra detected by Fermi-GBM are well modelled with idealized synchrotron emission. The majority of the spectra are found to be in the slow-cooling regime, while a transition from slow to fast cooling has been found in some of them during the decay of the luminosity. The associated increase in radiative efficiency of such a transition even as luminosity is seen to decrease further challenges the energetics in the jet. Conversely, the implied fast-to-slow cooling transition in GRB 211211A happens at late times, during the decaying phase of the luminosity. It is therefore more easily reconciled with the expected evolution of the jet.
Once the jet has ceased, the fading luminosity and downwards evolution of may be explained by a combination of adiabatic cooling (cf. Ronchini2021, ) and high-latitude effects. Within a structured jet, the energy dissipation that gives rise to the prompt emission may, in the wider regions where the bulk Lorentz factor is , occur below the photospheric radius, . If this dissipation radius, , is below the photosphere, photons will be coupled to the plasma until the optical depth reaches unity. Unless the condition for efficient thermalisation is met the resultant emission will have a lower luminosity and a spectral peak energy (Lamb16, ).
It is not clear how the exponential profile relates to EE in the BAT bandpass, though we note that Figure 4 suggests that may be under-estimated and perhaps includes the EE phase before the turnover. Indeed, the turnover of the BAT light curve coincides with the faster-evolving break (identified here as ) exiting the BAT bandpass. , which measures the -ray duration exclusively, is highly variable across the EE sample (e.g. Supplementary Table 1), and this may point towards less uniform behaviour from , corresponding to a greater diversity in IPC durations, which is indeed observed. However, is also subject to other effects like redshift or viewing angle, which would serve to obfuscate the implied correlation between the durations of the IPC and of EE at X-ray frequencies.
Evidence for a merger origin
As shown by Rastinejad22 , the radio-to-X-ray observations following GRB 211211A can be readily explained by a kilonova with striking similarity to AT2017gfo Abbott17_BNS superimposed over a GRB afterglow. The measured offset in projection from the putative host at is kpc, consistent with the median offset of kpc for merger-GRBs Fong22 . The -band upper limit at days after trigger excludes all known collapsar-GRB supernovae out to Rastinejad22 . Measurements of the lag in arrival times between high- and low-energy photons are consistent with zero, and hence merger-GRBs Bernardini15 . The measured spectral lag is inconsistent with the established collapsar-GRB lag-luminosity relation Ukwatta10 ; Ukwatta12 unless the redshift is (corresponding to erg s-1), but this is ruled out by the detection in the Swift-UVOT UVM2 filter. A purely Ni56-powered transient (a supernova or the merger of a neutron star with a white dwarf) is unable to evolve fast enough to match the GRB 211211A light curve.
Recently, Waxman22 proposed an alternative explanation for the infrared excess in GRB 211211A by invoking a dust destruction model in which a collapsar (originating from a massive star) was embedded in a dense molecular cloud that was subsequently heated by the UV radiation from the GRB. Their primary argument against the KN interpretation is the seemingly large K- to i-band flux ratio at days post-merger (), but this is only in tension Rastinejad22 with the ratio seen in AT2017gfo (with significant systematic uncertainty) and comfortably within the range of radioactivity-powered models Kasen17 . In addition to the arguments above that strongly favour a merger-driven GRB, the dust destruction model requires that GRB 211211A is not associated with ‘Galaxy A’ (whose light extends to the burst position) at and instead originated from an unseen halo galaxy associated with Galaxy B at . This would be the faintest GRB host ever identified at Lyman17 with a dust content that is atypical of very low mass galaxies Santini14 ; Calura17 . Further, we detect no residual absorption in either or over the Milky Way contribution in our study; the host contribution in both metrics is consistent with zero. We therefore conclude that the observed evolution and location of GRB 211211A strongly favours the merger interpretation.
Declarations
Data Availability
The majority of data generated or analysed during this study are included in this published article (and its supplementary information files). Swift and Fermi data may be downloaded from the UK Swift Science Data Centre (https://www.swift.ac.uk/) and the online HEARSAC archive at https://heasarc.gsfc.nasa.gov/W3Browse/fermi/fermigbrst.html. Additional data is available upon reasonable request.
Code Availability
The codes used in this publication are all publicly available. Fitting was performed in xspec Arnaud96 , available from https://heasarc.gsfc.nasa.gov/xanadu/xspec/. Swift tools are available from https://heasarc.gsfc.nasa.gov/lheasoft/, and Fermi tools from https://fermi.gsfc.nasa.gov/ssc/data/analysis/scitools/gtburst.html. The 2SBPL model is published in Ravasio18 . Plots were created using matplotlib Hunter07 in Python v3.9.7.
Acknowledgments We thank the anonymous referees for careful consideration of our work and comments that improved the manuscript.
We thank Adam Goldstein for his insights into fitting GBM data. We thank Scott Barthelmy, David Palmer, Amy Lien and Donggeun Tak for discussions on the performance of BAT. We would like to thank Gabriele Ghisellini for fruitful discussions on emission physics.
The work makes use of data supplied by the UK Swift Science Data Centre at the University of Leicester and the Neil Gehrels Swift Observatory.
This research has made use of data obtained through the High Energy Astrophysics Science Archive Research Center Online Service provided by the NASA/Goddard Space Flight Center, and specifically this work has made use of public Fermi-GBM data.
B. Gompertz and M. Nicholl are supported by the European Research Council (ERC) under the European Union’s Horizon 2020 research and innovation programme (grant agreement No. 948381, MN). M. Nicholl acknowledges a Turing Fellowship. A.J. Levan and D.B. Malesani are supported by the European Research Council (ERC) under the European Union’s Horizon 2020 research and innovation programme (grant agreement No. 725246, AJL). The Cosmic Dawn Center is funded by the Danish National Research Foundation under grant No. 140. B.D. Metzger is supported in part by the National Science Foundation (grant Nos. Grants AST-2009255, AST-2002577). The Flatiron Institute is supported by the Simons Foundation. G. Lamb is supported by the UK Science Technology and Facilities Council grant, ST/S000453/1. The Fong Group at Northwestern acknowledges support by the National Science Foundation under grant Nos. AST-1814782, AST-1909358 and CAREER grant No. AST-2047919. W.F. gratefully acknowledges support by the David and Lucile Packard Foundation. P.A. Evans and K.L. Page acknowledge funding from the UK Space Agency.
Authors’ Contributions
B.P.G. extracted the Swift data, performed the spectral analysis, provided the interpretation of the spectral evolution and the EE context, and wrote the text. M.E.R. extracted the Fermi data, performed the spectral analysis, provided the interpretation on the emission physics, and co-wrote the text. M.N. and A.J.L. contributed vital insights into the direction of the study and co-wrote the text. B.D.M. provided theoretical interpretation, insights into the progenitor, and contributed to the text. S.R.O. performed the afterglow SED fits, reduced the UVOT data and contributed to the text. G.P.L. provided theoretical interpretation, self-consistency checks of the physics, and made contributions to the text. D.B.M. helped with the interpretation of the emission physics and in writing the text. W.F., J.C.R., N.R.T., P.G.J. and A.P. helped in the discussion and writing of the text. P.A.E. and K.L.P. provided insights into Swift data reduction and handling, and commented on the text.
Conflict of interest
We declare no conflicts of interests.
Supplementary Information
Supplementary Information is available for this paper.
References
- \bibcommenthead
- (1) Mangan, J., Dunwoody, R., Meegan, C. & Fermi GBM Team. GRB 211211A: Fermi GBM observation. GRB Coordinates Network 31210, 1 (2021).
- (2) Stamatikos, M. et al. GRB 211211A: Swift-BAT refined analysis. GRB Coordinates Network 31209, 1 (2021).
- (3) Kouveliotou, C. et al. Identification of Two Classes of Gamma-Ray Bursts. ApJ 413, L101 (1993).
- (4) Burrows, D. N. et al. The Swift X-Ray Telescope. Space Sci. Rev. 120, 165–195 (2005).
- (5) D’Ai, A. et al. GRB 211211A: Swift detection of a bright burst. GRB Coordinates Network 31202, 1 (2021).
- (6) Norris, J. P. Implications of the Lag-Luminosity Relationship for Unified Gamma-Ray Burst Paradigms. ApJ 579, 386–403 (2002).
- (7) Norris, J. P. & Bonnell, J. T. Short Gamma-Ray Bursts with Extended Emission. ApJ 643, 266–275 (2006).
- (8) Norris, J. P., Gehrels, N. & Scargle, J. D. Threshold for Extended Emission in Short Gamma-ray Bursts. ApJ 717, 411–419 (2010).
- (9) Gompertz, B. P., O’Brien, P. T., Wynn, G. A. & Rowlinson, A. Can magnetar spin-down power extended emission in some short GRBs? MNRAS 431, 1745–1751 (2013).
- (10) Roming, P. W. A. et al. The Swift Ultra-Violet/Optical Telescope. Space Sci. Rev. 120, 95–142 (2005).
- (11) Belles, A., D’Ai, A. & Swift/UVOT Team. GRB 211211A: Swift/UVOT detection. GRB Coordinates Network 31222, 1 (2021).
- (12) Rastinejad, J. C. et al. A Kilonova Following a Long-Duration Gamma-Ray Burst at 350 Mpc. arXiv e-prints arXiv:2204.10864 (2022).
- (13) Abbott, B. P. et al. GW170817: Observation of Gravitational Waves from a Binary Neutron Star Inspiral. Phys. Rev. Lett. 119, 161101 (2017).
- (14) Malesani, D. B. et al. GRB 211211A: NOT optical spectroscopy. GRB Coordinates Network 31221, 1 (2021).
- (15) Mei, A. et al. GeV emission from a compact binary merger. arXiv e-prints arXiv:2205.08566 (2022).
- (16) Zhang, H.-M., Huang, Y.-Y., Zheng, J.-H., Liu, R.-Y. & Wang, X.-Y. Fermi-LAT Detection of a GeV Afterglow from a Compact Stellar Merger. ApJ 933, L22 (2022).
- (17) Arnaud, K. A. Jacoby, G. H. & Barnes, J. (eds) XSPEC: The First Ten Years. (eds Jacoby, G. H. & Barnes, J.) Astronomical Data Analysis Software and Systems V, Vol. 101 of Astronomical Society of the Pacific Conference Series, 17 (1996).
- (18) Gehrels, N. et al. A new -ray burst classification scheme from GRB060614. Nature 444, 1044–1046 (2006).
- (19) Ravasio, M. E. et al. Consistency with synchrotron emission in the bright GRB 160625B observed by Fermi. A&A 613, A16 (2018).
- (20) Band, D. et al. BATSE Observations of Gamma-Ray Burst Spectra. I. Spectral Diversity. ApJ 413, 281 (1993).
- (21) Akaike, H. A New Look at the Statistical Model Identification. IEEE Transactions on Automatic Control 19, 716–723 (1974).
- (22) Burnham, K. P. & Anderson, D. R. Multimodel inference: Understanding aic and bic in model selection. Sociological Methods & Research 33, 261–304 (2004). URL https://doi.org/10.1177/0049124104268644.
- (23) Rybicki, G. B. & Lightman, A. P. Radiative processes in astrophysics (1979).
- (24) Sari, R., Piran, T. & Narayan, R. Spectra and Light Curves of Gamma-Ray Burst Afterglows. ApJ 497, L17–L20 (1998).
- (25) Piran, T. Gamma-ray bursts and the fireball model. Phys. Rep. 314, 575–667 (1999).
- (26) Ravasio, M. E., Ghirlanda, G., Nava, L. & Ghisellini, G. Evidence of two spectral breaks in the prompt emission of gamma-ray bursts. A&A 625, A60 (2019).
- (27) Ronchi, M. et al. Rise and fall of the high-energy afterglow emission of GRB 180720B. A&A 636, A55 (2020).
- (28) Burgess, J. M. et al. Gamma-ray bursts as cool synchrotron sources. Nature Astronomy 4, 174–179 (2020).
- (29) Toffano, M. et al. The slope of the low-energy spectrum of prompt gamma-ray burst emission. A&A 652, A123 (2021).
- (30) Oganesyan, G., Nava, L., Ghirlanda, G. & Celotti, A. Detection of Low-energy Breaks in Gamma-Ray Burst Prompt Emission Spectra. ApJ 846, 137 (2017).
- (31) Oganesyan, G., Nava, L., Ghirlanda, G. & Celotti, A. Characterization of gamma-ray burst prompt emission spectra down to soft X-rays. A&A 616, A138 (2018).
- (32) Oganesyan, G., Nava, L., Ghirlanda, G., Melandri, A. & Celotti, A. Prompt optical emission as a signature of synchrotron radiation in gamma-ray bursts. A&A 628, A59 (2019).
- (33) Lü, H.-J., Zhang, B., Lei, W.-H., Li, Y. & Lasky, P. D. The Millisecond Magnetar Central Engine in Short GRBs. ApJ 805, 89 (2015).
- (34) Gompertz, B. P., Levan, A. J. & Tanvir, N. R. A Search for Neutron Star-Black Hole Binary Mergers in the Short Gamma-Ray Burst Population. ApJ 895, 58 (2020).
- (35) Kumar, P. & McMahon, E. A general scheme for modelling -ray burst prompt emission. MNRAS 384, 33–63 (2008).
- (36) Daigne, F., Bošnjak, Ž. & Dubus, G. Reconciling observed gamma-ray burst prompt spectra with synchrotron radiation? A&A 526, A110 (2011).
- (37) Beniamini, P. & Piran, T. Constraints on the Synchrotron Emission Mechanism in Gamma-Ray Bursts. ApJ 769, 69 (2013).
- (38) Ghisellini, G., Celotti, A. & Lazzati, D. Constraints on the emission mechanisms of gamma-ray bursts. MNRAS 313, L1–L5 (2000).
- (39) Piran, T. de Gouveia dal Pino, E. M., Lugones, G. & Lazarian, A. (eds) Magnetic Fields in Gamma-Ray Bursts: A Short Overview. (eds de Gouveia dal Pino, E. M., Lugones, G. & Lazarian, A.) Magnetic Fields in the Universe: From Laboratory and Stars to Primordial Structures., Vol. 784 of American Institute of Physics Conference Series, 164–174 (2005). astro-ph/0503060.
- (40) Shen, R.-F. & Zhang, B. Prompt optical emission and synchrotron self-absorption constraints on emission site of GRBs. MNRAS 398, 1936–1950 (2009).
- (41) Sari, R. & Piran, T. Predictions for the Very Early Afterglow and the Optical Flash. ApJ 520, 641–649 (1999).
- (42) Granot, J., Piran, T. & Sari, R. The Synchrotron Spectrum of Fast Cooling Electrons Revisited. ApJ 534, L163–L166 (2000).
- (43) Granot, J. & Sari, R. The Shape of Spectral Breaks in Gamma-Ray Burst Afterglows. ApJ 568, 820–829 (2002).
- (44) Ghisellini, G. et al. Proton-synchrotron as the radiation mechanism of the prompt emission of gamma-ray bursts? A&A 636, A82 (2020).
- (45) Lee, W. H., Ramirez-Ruiz, E. & López-Cámara, D. Phase Transitions and He-Synthesis-Driven Winds in Neutrino Cooled Accretion Disks: Prospects for Late Flares in Short Gamma-Ray Bursts. ApJ 699, L93–L96 (2009).
- (46) Fernández, R. & Metzger, B. D. Nuclear Dominated Accretion Flows in Two Dimensions. I. Torus Evolution with Parametric Microphysics. ApJ 763, 108 (2013).
- (47) Foucart, F., Hinderer, T. & Nissanke, S. Remnant baryon mass in neutron star-black hole mergers: Predictions for binary neutron star mimickers and rapidly spinning black holes. Phys. Rev. D 98, 081501 (2018).
- (48) Rosswog, S. Fallback accretion in the aftermath of a compact binary merger. MNRAS 376, L48–L51 (2007).
- (49) Desai, D., Metzger, B. D. & Foucart, F. Imprints of r-process heating on fall-back accretion: distinguishing black hole-neutron star from double neutron star mergers. MNRAS 485, 4404–4412 (2019).
- (50) Kisaka, S. & Ioka, K. Long-lasting Black Hole Jets in Short Gamma-Ray Bursts. ApJ 804, L16 (2015).
- (51) Metzger, B. D., Quataert, E. & Thompson, T. A. Short-duration gamma-ray bursts with extended emission from protomagnetar spin-down. MNRAS 385, 1455–1460 (2008).
- (52) Metzger, B. D., Giannios, D., Thompson, T. A., Bucciantini, N. & Quataert, E. The protomagnetar model for gamma-ray bursts. MNRAS 413, 2031–2056 (2011).
- (53) Giacomazzo, B. & Perna, R. Formation of Stable Magnetars from Binary Neutron Star Mergers. ApJ 771, L26 (2013).
- (54) Gompertz, B. P., O’Brien, P. T. & Wynn, G. A. Magnetar powered GRBs: explaining the extended emission and X-ray plateau of short GRB light curves. MNRAS 438, 240–250 (2014).
- (55) Bucciantini, N., Metzger, B. D., Thompson, T. A. & Quataert, E. Short gamma-ray bursts with extended emission from magnetar birth: jet formation and collimation. MNRAS 419, 1537–1545 (2012).
- (56) Pons, J. A., Reddy, S., Prakash, M., Lattimer, J. M. & Miralles, J. A. Evolution of Proto-Neutron Stars. ApJ 513, 780–804 (1999).
- (57) Gruber, D. et al. The Fermi GBM Gamma-Ray Burst Spectral Catalog: Four Years of Data. ApJS 211, 12 (2014).
- (58) von Kienlin, A. et al. The Second Fermi GBM Gamma-Ray Burst Catalog: The First Four Years. ApJS 211, 13 (2014).
- (59) von Kienlin, A. et al. The Fourth Fermi-GBM Gamma-Ray Burst Catalog: A Decade of Data. ApJ 893, 46 (2020).
- (60) Narayana Bhat, P. et al. The Third Fermi GBM Gamma-Ray Burst Catalog: The First Six Years. ApJS 223, 28 (2016).
- (61) Evans, P. A. et al. An online repository of Swift/XRT light curves of -ray bursts. A&A 469, 379–385 (2007).
- (62) Evans, P. A. et al. Methods and results of an automatic analysis of a complete sample of Swift-XRT observations of GRBs. MNRAS 397, 1177–1201 (2009).
- (63) Nasa High Energy Astrophysics Science Archive Research Center (Heasarc). HEAsoft: Unified Release of FTOOLS and XANADU (2014). 1408.004.
- (64) Pe’er, A. Physics of Gamma-Ray Bursts Prompt Emission. Advances in Astronomy 2015, 907321 (2015).
- (65) Preece, R. D. et al. The Synchrotron Shock Model Confronts a “Line of Death” in the BATSE Gamma-Ray Burst Data. ApJ 506, L23–L26 (1998).
- (66) Cash, W. Parameter estimation in astronomy through application of the likelihood ratio. ApJ 228, 939–947 (1979).
- (67) Wilms, J., Allen, A. & McCray, R. On the Absorption of X-Rays in the Interstellar Medium. ApJ 542, 914–924 (2000).
- (68) Willingale, R., Starling, R. L. C., Beardmore, A. P., Tanvir, N. R. & O’Brien, P. T. Calibration of X-ray absorption in our Galaxy. MNRAS 431, 394–404 (2013).
- (69) Asquini, L. et al. X-ray absorbing column densities of a complete sample of short gamma ray bursts. A&A 625, A6 (2019).
- (70) Campana, S., Lazzati, D., Perna, R., Grazia Bernardini, M. & Nava, L. The variable absorption in the X-ray spectrum of GRB 190114C. A&A 649, A135 (2021).
- (71) Mangano, V. et al. Swift observations of GRB 060614: an anomalous burst with a well behaved afterglow. A&A 470, 105–118 (2007).
- (72) Beniamini, P., Nava, L. & Piran, T. A revised analysis of gamma-ray bursts’ prompt efficiencies. MNRAS 461, 51–59 (2016).
- (73) Beloborodov, A. M. On the Efficiency of Internal Shocks in Gamma-Ray Bursts. ApJ 539, L25–L28 (2000).
- (74) Cunningham, V. et al. GRB 160625B: Evidence for a Gaussian-shaped Jet. ApJ 904, 166 (2020).
- (75) Salafia, O. S. et al. Multi-wavelength view of the close-by GRB 190829A sheds light on gamma-ray burst physics. arXiv e-prints arXiv:2106.07169 (2021).
- (76) Rees, M. J. & Meszaros, P. Unsteady Outflow Models for Cosmological Gamma-Ray Bursts. ApJ 430, L93 (1994).
- (77) Kumar, P. Gamma-Ray Burst Energetics. ApJ 523, L113–L116 (1999).
- (78) Spada, M., Panaitescu, A. & Mészáros, P. Analysis of Temporal Features of Gamma-Ray Bursts in the Internal Shock Model. ApJ 537, 824–832 (2000).
- (79) Florou, I., Petropoulou, M. & Mastichiadis, A. A marginally fast-cooling proton-synchrotron model for prompt GRBs. MNRAS 505, 1367–1381 (2021).
- (80) Bégué, D., Samuelsson, F. & Pe’er, A. Bethe-Heitler signature in proton synchrotron models for gamma-ray bursts. arXiv e-prints arXiv:2112.07231 (2021).
- (81) Schlafly, E. F. & Finkbeiner, D. P. Measuring Reddening with Sloan Digital Sky Survey Stellar Spectra and Recalibrating SFD. ApJ 737, 103 (2011).
- (82) Schady, P. et al. Dust and metal column densities in gamma-ray burst host galaxies. MNRAS 401, 2773–2792 (2010).
- (83) Schady, P. et al. Dust and gas in the local environments of gamma-ray bursts. MNRAS 377, 273–284 (2007).
- (84) Schlegel, D. J., Finkbeiner, D. P. & Davis, M. Maps of Dust Infrared Emission for Use in Estimation of Reddening and Cosmic Microwave Background Radiation Foregrounds. ApJ 500, 525–+ (1998).
- (85) Kalberla, P. M. W. et al. The Leiden/Argentine/Bonn (LAB) Survey of Galactic HI. Final data release of the combined LDS and IAR surveys with improved stray-radiation corrections. A&A 440, 775–782 (2005).
- (86) Madau, P. Radiative transfer in a clumpy universe: The colors of high-redshift galaxies. ApJ 441, 18–27 (1995).
- (87) Barthelmy, S. D. et al. An origin for short -ray bursts unassociated with current star formation. Nature 438, 994–996 (2005).
- (88) Perley, D. A. et al. GRB 080503: Implications of a Naked Short Gamma-Ray Burst Dominated by Extended Emission. ApJ 696, 1871–1885 (2009).
- (89) Lien, A. et al. The Third Swift Burst Alert Telescope Gamma-Ray Burst Catalog. ApJ 829, 7 (2016).
- (90) Tsang, D., Read, J. S., Hinderer, T., Piro, A. L. & Bondarescu, R. Resonant Shattering of Neutron Star Crusts. Phys. Rev. Lett. 108, 011102 (2012).
- (91) Tsang, D. Shattering Flares during Close Encounters of Neutron Stars. ApJ 777, 103 (2013).
- (92) Neill, D., Newton, W. G. & Tsang, D. Resonant shattering flares as multimessenger probes of the nuclear symmetry energy. MNRAS 504, 1129–1143 (2021).
- (93) Xiao, S. et al. The quasi-periodically oscillating precursor of a long gamma-ray burst from a binary neutron star merger. arXiv e-prints arXiv:2205.02186 (2022).
- (94) Lü, H.-J. et al. GRB 211227A as a peculiar long gamma-ray burst from compact star merger. arXiv e-prints arXiv:2201.06395 (2022).
- (95) Yang, J. et al. A peculiar, long-duration gamma-ray burst from a neutron star-white dwarf merger. arXiv e-prints arXiv:2204.12771 (2022).
- (96) Littlejohns, O. M. et al. Are gamma-ray bursts the same at high redshift and low redshift? MNRAS 436, 3640–3655 (2013).
- (97) Ronchini, S. et al. Spectral index-flux relation for investigating the origins of steep decay in -ray bursts. Nature Communications 12, 4040 (2021).
- (98) Lamb, G. P. & Kobayashi, S. Low- Jets from Compact Stellar Mergers: Candidate Electromagnetic Counterparts to Gravitational Wave Sources. ApJ 829, 112 (2016).
- (99) Fong, W.-f. et al. Short GRB Host Galaxies I: Photometric and Spectroscopic Catalogs, Host Associations, and Galactocentric Offsets. arXiv e-prints arXiv:2206.01763 (2022).
- (100) Bernardini, M. G. et al. Comparing the spectral lag of short and long gamma-ray bursts and its relation with the luminosity. MNRAS 446, 1129–1138 (2015).
- (101) Ukwatta, T. N. et al. Spectral Lags and the Lag-Luminosity Relation: An Investigation with Swift BAT Gamma-ray Bursts. ApJ 711, 1073–1086 (2010).
- (102) Ukwatta, T. N. et al. The lag-luminosity relation in the GRB source frame: an investigation with Swift BAT bursts. MNRAS 419, 614–623 (2012).
- (103) Waxman, E., Ofek, E. O. & Kushnir, D. Strong NIR emission following the long duration GRB 211211A: Dust heating as an alternative to a kilonova. arXiv e-prints arXiv:2206.10710 (2022).
- (104) Kasen, D., Metzger, B., Barnes, J., Quataert, E. & Ramirez-Ruiz, E. Origin of the heavy elements in binary neutron-star mergers from a gravitational-wave event. Nature 551, 80–84 (2017).
- (105) Lyman, J. D. et al. The host galaxies and explosion sites of long-duration gamma ray bursts: Hubble Space Telescope near-infrared imaging. MNRAS 467, 1795–1817 (2017).
- (106) Santini, P. et al. The evolution of the dust and gas content in galaxies. A&A 562, A30 (2014).
- (107) Calura, F. et al. The dust-to-stellar mass ratio as a valuable tool to probe the evolution of local and distant star-forming galaxies. MNRAS 465, 54–67 (2017).
- (108) Hunter, J. D. Matplotlib: A 2d graphics environment. Computing in science & engineering 9, 90–95 (2007).
- (109) Lien, A. Y. et al. GRB 211227A: Swift-BAT refined analysis. GRB Coordinates Network 31326, 1 (2021).