The observed impact of galaxy halo gas on fast radio bursts
Liam Connor1,2,∗ & Vikram Ravi1,2
1 Cahill Center for Astronomy and Astrophysics, MC 249-17, California Institute of Technology, Pasadena CA 91125, USA.
2 Owens Valley Radio Observatory, California Institute of Technology, Big Pine CA 93513, USA.
∗ E-mail: liam.dean.connor@gmail.com
Galaxies and groups of galaxies exist in dark-matter halos filled with diffuse gas. The diffuse gas represents up to 80% of the mass in baryonic matter within the halos[1, 2], but is difficult to detect because of its low density (particle number densities of cm-3) and high temperature (mostly greater than K). Here we analyze the impact of diffuse gas associated with nearby galaxies using the dispersion measures (DMs) of extragalactic fast radio bursts (FRBs). FRB DMs provide direct measurements of the total ionized-gas contents along their sightlines. Out of a sample of 474 distant FRBs from the CHIME/FRB Catalog 1[3], we identify a subset of events that likely intersect the dark-matter halos of galaxies in the local Universe ( Mpc). The mean DM of the galaxy-intersecting FRBs is larger than the non-intersecting DMs with probability and the excess DM is pc cm-3 with confidence. The excess is larger than expected for the diffuse gas surrounding isolated galaxies, but may be explained by additional contributions from gas surrounding galaxy groups, including from the Local Group. This result demonstrates the predicted ability of FRBs to be used as sensitive, model-independent measures of the diffuse-gas contents of dark-matter halos[4, 5, 6, 7].
The Canadian Hydrogen Intensity Mapping Experiment (CHIME) Fast Radio Burst Project (CHIME/FRB hereafter) published its first catalog of 535 FRBs detected in the 400–800 MHz radio band between 2018 July 25 and 2019 July 1[3]. CHIME is a transit telescope that observes the whole northern sky daily[8, 9]. The first CHIME/FRB catalog includes one-off or “non-repeating” bursts from 474 sources, and 18 repeating sources that have been detected two or more times. The repeaters are not included in our analysis (Methods). This is the largest collection of FRBs from a single survey by more than an order of magnitude. The uniformity of the sample, both in sky position and in terms of selection effects, provides significant power for statistical inference[3]. For example, a correlation has been observed between the locations of CHIME FRBs and the distribution of known galaxies with cosmological redshifts , which indicates that an order-one fraction of CHIME FRBs originate from correspondingly large distances[10].
Despite its central role in the formation and evolution of galaxies, diffuse gas surrounding galaxies is notoriously difficult to study in detail[2]. We refer to this medium as the circumgalactic medium (CGM) in the case of individual galaxies (dark matter halo masses ), the intra-group medium (IGrM) in the case of galaxy groups (), and the intracluster medium (ICM) in the case of galaxy clusters (). As short-duration (approximately millisecond) radio-wavelength pulses, FRBs are dispersed during propagation through astrophysical plasmas along their sightlines. The DM to a redshift is given by the following integral[11]:
| (1) |
where is the vacuum speed of light, is the Hubble constant, is the free-electron number density as a function of redshift, is the fractional cosmic matter density, and is the fractional cosmic dark-energy density. The observed DM, , is conventionally broken down into a series of components:
| (2) |
where and are contributed by the Milky Way interstellar medium and gaseous halo respectively, is contributed by the FRB host galaxy, is contributed by the intergalactic medium, and the CGM contributions from intervening galaxies () are summed over objects. The intergalactic-medium contribution, DMIGM, is often the largest term and is thought to lead to the Macquart (DM–) relation[12]. The exact value of for a given intervening galaxy will depend on the impact parameter of the background FRB (), and the unknown spatial gas-density distribution surrounding the galaxy. Individual FRBs have been found to intersect foreground halos[13, 14], but without the statistics of a larger sample it is difficult to extract the DM contribution of the CGM[4, 5, 7].
CHIME is a compact telescope and lacks the angular resolution to unambiguously identify the host galaxies of FRBs[15, 16]. Typical sky-localization error regions are 0.20.2 degrees2 in the CHIME/FRB Catalog 1. We therefore focus this work on nearby, massive galaxies with dark-matter halo virial radii that subtend large angular scales. An approximately Milky-Way sized halo with a virial radius of 200 kpc will be larger in angular size than a standard CHIME/FRB localization region at distances 40 Mpc.
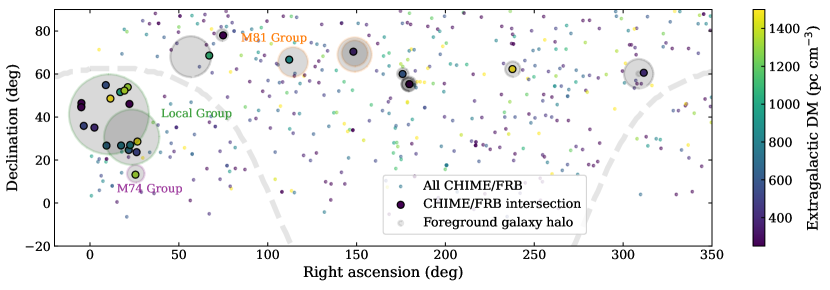
We identify a sample of CHIME FRBs that likely intersect nearby halos within a threshold impact parameter (Methods). We have utilized the Gravitational Wave Galaxy Catalogue (GWGC) containing the position, distance, and -band absolute magnitude () of 53,255 galaxies within 100 Mpc[17]. GWGC is likely complete for all galaxies within 40 Mpc with ; we note that our results below are only likely to be diluted by any incompleteness. We begin by using only galaxies with , that are within 40 Mpc, and are more distant than 500 kpc. For a fiducial threshold impact parameter of kpc, we find 26 intersecting FRBs. We consider it an intersection if the impact parameter between a CHIME FRB and GWGC galaxy is less than the threshold value, , scaled by galaxy mass (see Methods). In Figure 1, we show the sky locations of the full CHIME/FRB catalog of non-repeating FRB sources, as well as the GWGC galaxy / FRB intersectiond within this fiducial . The list of CHIME/FRB galaxy intersections is presented in Table 1.
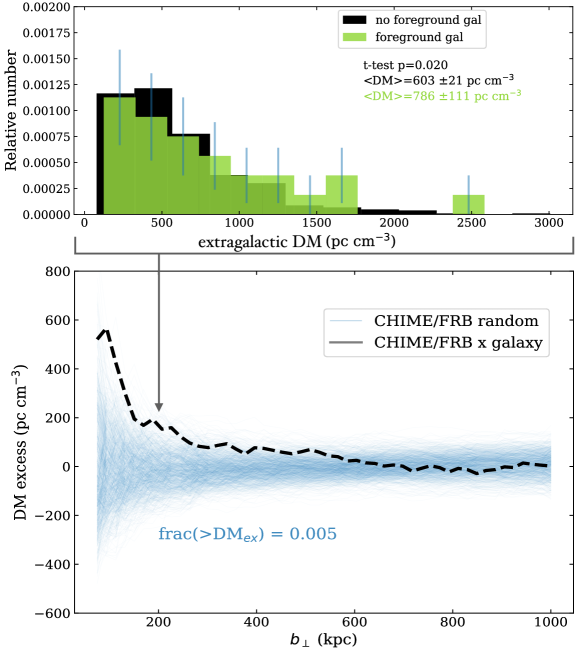
The subset of FRBs that intersect the halos of nearby galaxies have statistically higher extragalactic DMs than the rest of the CHIME/FRB sample. We calculate the extragalactic DM by subtracting a model for the along each FRB sightline[18]. In this fiducial sample, we exclude FRBs observed at Galactic latitudes within 5 degrees of the Galactic plane to mitigate systematic errors in the model for . To determine the significance of the mean-DM excess, we employ two statistical tests (see Methods for details). The first is a jackknife re-sampling of the data, corresponding to a nonparametric test that does not make any assumptions about the underlying DM distribution. Randomized FRBs are put through the same cross-matching procedure with 40 Mpc GWGC galaxies as the real data, and the “intersecting” CHIME/FRB sources are compared with the “non-intersecting” FRB DMs. This allows us to ask, in what fraction of random samples do we see a DM excess larger than the true data. This is a one-sided test. The second statistic we use is a two-sample one-sided t-test, which is designed explicitly to look for a positive shift in the mean DM of galaxy-intersecting FRBs.
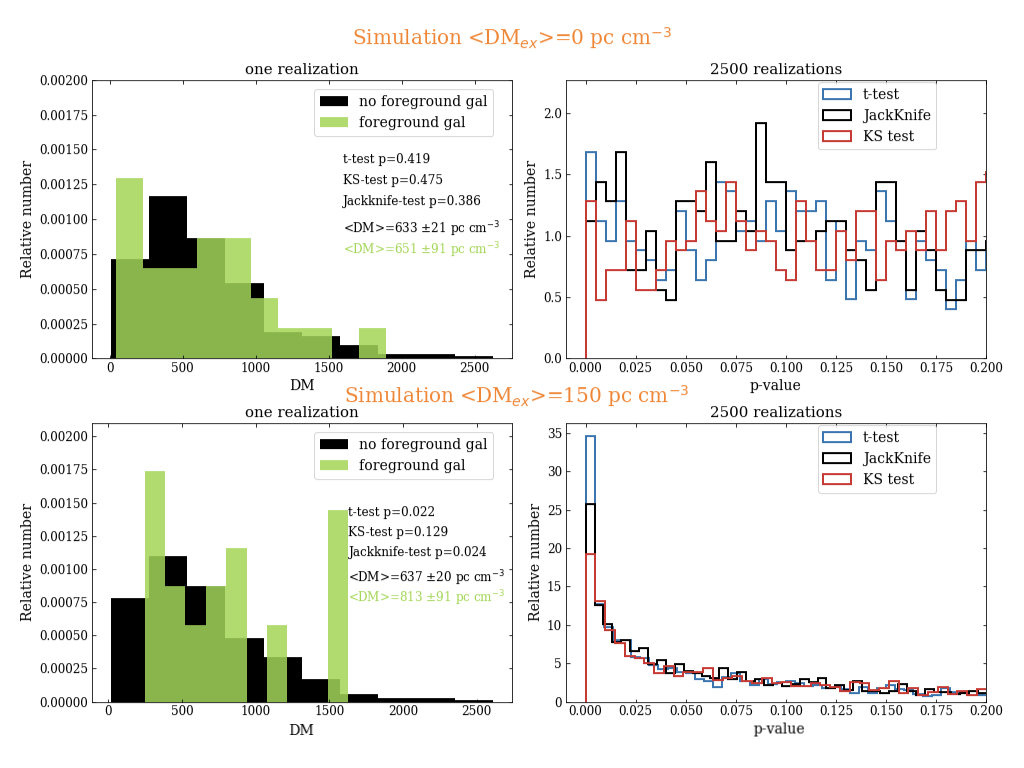
For both statistical tests, we analyze the significance of the observed DM excess as a function of . In Figure 2, we show the DM excess for different choices of together with the results from 1000 jackknife re-samplings of the data. For between 75 kpc and 300 kpc, we find the jackknife and one-sided t-test p-values are all less than and in only of the resampled curves are the mean DM excesses as extreme as those of the real, unshuffled data (Methods). We have shown through simulation that neither test is biased towards small p-values and both are more sensitive to shifts in mean DM than a more generic nonparametric test, the Kolmogorov–Smirnov (KS) test (see Methods and Extended Data Figure 1).
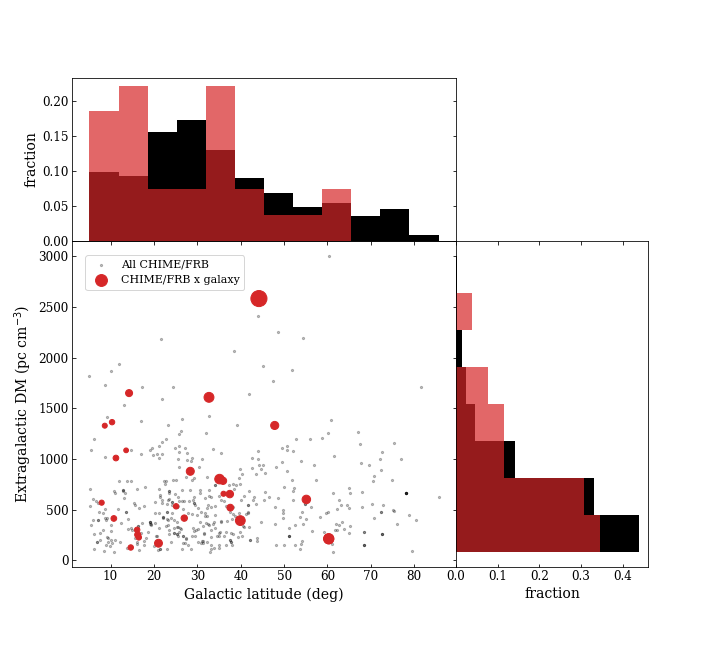
As a further test of robustness, we apply different cuts to the CHIME/FRB catalog and GWGC. In Figure 3, we plot the Galactic latitudes and extragalactic DMs of the intersecting and non-intersecting CHIME FRBs. We find no correlation between extragalactic DM and Galactic latitude for both sub-samples of CHIME FRBs (see Methods). This shows that the observed excess DM of the sample of intersecting FRBs is unlikely to be due to errors in modeling the Milky Way disk and halo DM contributions. For the CHIME/FRB sources, we apply various limits on the Galactic latitude (between 0 deg and 20 deg from the Galactic plane), and consider an additional model for [19] together with no subtraction of . We also alter the cut on foreground galaxies between and , and vary the maximum galaxy distance between 15 Mpc and 50 Mpc. In all of these cases the excess DM persists. However, if we consider only GWGC galaxies at distances between 50 Mpc and 100 Mpc the signal disappears, likely because the halos subtend small solid angles relative to the CHIME/FRB localization regions, and the apparent intersections are false. We consider additional means of identifying CHIME/FRB galaxy intersections, and find no change to our results (Methods).
It is unlikely that the FRBs that we associate with nearby galaxy halos in fact originate from these galaxies (Methods). We also find that the total number of intersections is consistent with the expected range for a background population, based on the probability of halo intercepts (Methods). It is also unlikely that these FRBs pass through the disks of the nearby galaxies, both from a statistical perspective, and because the effects of multi-path propagation would render them undetectable given the CHIME observing frequencies[20]. The excess DM in the CHIME/FRB galaxy intersections can therefore be robustly ascribed to gas in the halos of the nearby galaxies (including the Local Group galaxies) because there is no other difference in the sample selection.
We next compute the observed DM excess over a range of impact parameters. For the fiducial sample of CHIME/FRB galaxy intersections ( kpc), we find a mean DM of 790110 pc cm-3, and the remainder of the CHIME/FRB sample has a mean DM of 60020 pc cm-3 ( errors throughout). We note that this is just one choice of and there is more statistical power in the full DM excess curve. The fiducial value histogram and estimated DM excess for different are shown in Figure 2. For kpc, the DM excess is pc cm -3. This does not necessarily mean that the diffuse gas extends to 300 kpc. Each data point is highly correlated between threshold impact parameters, so excess DM at smaller will appear at larger as well. Not all the CHIME/FRB galaxy associations are secure, and positional uncertainty will act to bias the measured DM excess at fixed downward.
The DM excess ( pc cm-3 at confidence for kpc kpc; see Methods) is substantially larger than predicted for diffuse gas in the halos of individual galaxies[4, 6]. By estimating the halo masses of the sample of intersected galaxies listed in Table 1, we find predicted DM excesses less than 40 pc cm-3 even in the case that these halos retain the expected cosmic fraction of baryons (see Methods and Extended Data Figure 2). However, over two thirds of the FRB/galaxy intersections are with galaxies that belong to groups (Table 1); this is not unexpected[21]. Intersected groups include the Local Group, the M81 Group, and the M74 Group. Galaxy groups host a rich IGrM, aspects of which have been extensively studied through extended thermal X-ray emission[22], ultraviolet absorption spectroscopy[23], and its impact on the cosmic microwave background (the Sunyaev-Zel’dovich / SZ effect)[24]. It is likely that galaxy groups retain significant fractions of their expected baryon contents in a hot ( K) phase, although the effects of energy feedback may complicate the exact distributions of temperature and density[25]. The observed DM excess is nonetheless consistent with simple models for the DM contribution from the IGrM (Methods)[26, 6].
If we consider only the CHIME FRBs that intersect the halos of Local Group galaxies M31 and M33, we see excess DM, but it is not statistically significant on its own (jackknife p-value 0.08 at the fiducial ). If the Local Group IGrM is modeled with a dark matter halo mass of , it could contribute significant DM over tens of degrees on the sky in the direction of M31[6]. The Local Group IGrM has recently been studied with analyses of X-ray O VII and O VIII emission lines and SZ maps that indicate significant hot-gas content extended to an angular radius of approximately degrees from M31[27]. The authors suggested this represents a hot-gas bridge connecting the Milky Way with M31 and M33 that corresponds to a DM of 80–400 pc cm-3. We anticipate that our measurements, when augmented by additional data from CHIME/FRB and other instruments, will significantly aid in the modeling and interpretation of the X-ray and SZ observations of the Local Group IGrM, together with the IGrM of other nearby intersected groups.
The magnitude of the observed DM excess in the CHIME/FRB galaxy intersections is promising for future FRB-DM measurements of the mass and density profile of diffuse gas surrounding galaxies and galaxy groups. For example, with a larger FRB sample, the analysis presented here can be applied to galaxy clusters, where the 10 halos with virial radii of around 2 Mpc may contribute DMs greater than pc cm-3[26, 6]. We note that the most highly dispersed CHIME/FRB source, with extragalactic pc cm-3, appears to intersect within 1.4 Mpc of the center of the galaxy cluster J185.83917+56.47005 at =0.328, found by cross-matching with the GMBCG cluster catalog[28].
References
References
- [1] Anderson, M. E. & Bregman, J. N. Do Hot Halos Around Galaxies Contain the Missing Baryons? ApJ 714, 320–331, DOI: https://dx.doi.org/10.1088/0004-637X/714/1/320 (2010). 1003.3273.
- [2] Tumlinson, J., Peeples, M. S. & Werk, J. K. The Circumgalactic Medium. ARA&A 55, 389–432, DOI: https://dx.doi.org/10.1146/annurev-astro-091916-055240 (2017). 1709.09180.
- [3] Amiri, M. et al. The First CHIME/FRB Fast Radio Burst Catalog. ApJS 257, 59, DOI: https://dx.doi.org/10.3847/1538-4365/ac33ab (2021). 2106.04352.
- [4] McQuinn, M. Locating the “Missing” Baryons with Extragalactic Dispersion Measure Estimates. ApJ 780, L33 (2014).
- [5] Ravi, V. Measuring the Circumgalactic and Intergalactic Baryon Contents with Fast Radio Bursts. ApJ 872, 88, DOI: https://dx.doi.org/10.3847/1538-4357/aafb30 (2019). 1804.07291.
- [6] Prochaska, J. X. & Zheng, Y. Probing Galactic haloes with fast radio bursts. MNRAS 485, 648–665, DOI: https://dx.doi.org/10.1093/mnras/stz261 (2019). 1901.11051.
- [7] Madhavacheril, M. S., Battaglia, N., Smith, K. M. & Sievers, J. L. Cosmology with the kinematic Sunyaev-Zeldovich effect: Breaking the optical depth degeneracy with fast radio bursts. Phys. Rev. D 100, 103532, DOI: https://dx.doi.org/10.1103/PhysRevD.100.103532 (2019).
- [8] Bandura, K. et al. Canadian Hydrogen Intensity Mapping Experiment (CHIME) pathfinder. In Stepp, L. M., Gilmozzi, R. & Hall, H. J. (eds.) Ground-based and Airborne Telescopes V, vol. 9145 of Society of Photo-Optical Instrumentation Engineers (SPIE) Conference Series, 914522, DOI: https://dx.doi.org/10.1117/12.2054950 (2014). 1406.2288.
- [9] Kaspi, V. M. & CHIME/FRB Collaboration. The CHIME Fast Radio Burst Project. In American Astronomical Society Meeting Abstracts #229, vol. 229 of American Astronomical Society Meeting Abstracts, 242.19 (2017).
- [10] Rafiei-Ravandi, M. et al. CHIME/FRB Catalog 1 Results: Statistical Cross-correlations with Large-scale Structure. ApJ 922, 42, DOI: https://dx.doi.org/10.3847/1538-4357/ac1dab (2021). 2106.04354.
- [11] Shull, J. M. & Danforth, C. W. The Dispersion of Fast Radio Bursts from a Structured Intergalactic Medium at Redshifts z < 1.5. ApJ 852, L11, DOI: https://dx.doi.org/10.3847/2041-8213/aaa2fa (2018). 1712.01280.
- [12] Macquart, J. P. et al. A census of baryons in the Universe from localized fast radio bursts. Nature 581, 391–395, DOI: https://dx.doi.org/10.1038/s41586-020-2300-2 (2020). 2005.13161.
- [13] Prochaska, J. X. et al. The low density and magnetization of a massive galaxy halo exposed by a fast radio burst. Science 365, aay0073, DOI: https://dx.doi.org/10.1126/science.aay0073 (2019). 1909.11681.
- [14] Connor, L. et al. A bright, high rotation-measure FRB that skewers the M33 halo. MNRAS 499, 4716–4724, DOI: https://dx.doi.org/10.1093/mnras/staa3009 (2020). 2002.01399.
- [15] Eftekhari, T. & Berger, E. Associating Fast Radio Bursts with Their Host Galaxies. ApJ 849, 162, DOI: https://dx.doi.org/10.3847/1538-4357/aa90b9 (2017). 1705.02998.
- [16] Aggarwal, K. et al. Probabilistic Association of Transients to their Hosts (PATH). ApJ 911, 95, DOI: https://dx.doi.org/10.3847/1538-4357/abe8d2 (2021). 2102.10627.
- [17] White, D. J., Daw, E. J. & Dhillon, V. S. A list of galaxies for gravitational wave searches. Classical and Quantum Gravity 28, 085016, DOI: https://dx.doi.org/10.1088/0264-9381/28/8/085016 (2011).
- [18] Cordes, J. M. NE2001: A New Model for the Galactic Electron Density and its Fluctuations. In Clemens, D., Shah, R. & Brainerd, T. (eds.) Milky Way Surveys: The Structure and Evolution of our Galaxy, vol. 317 of Astronomical Society of the Pacific Conference Series, 211 (2004).
- [19] Yao, J. M., Manchester, R. N. & Wang, N. A New Electron-density Model for Estimation of Pulsar and FRB Distances. ApJ 835, 29, DOI: https://dx.doi.org/10.3847/1538-4357/835/1/29 (2017). 1610.09448.
- [20] Prochaska, J. X. & Neeleman, M. The astrophysical consequences of intervening galaxy gas on fast radio bursts. MNRAS 474, 318–325, DOI: https://dx.doi.org/10.1093/mnras/stx2824 (2018). 1711.00323.
- [21] Yang, X. et al. Galaxy Groups in the SDSS DR4. I. The Catalog and Basic Properties. ApJ 671, 153–170, DOI: https://dx.doi.org/10.1086/522027 (2007). 0707.4640.
- [22] Mulchaey, J. S. X-ray Properties of Groups of Galaxies. ARA&A 38, 289–335, DOI: https://dx.doi.org/10.1146/annurev.astro.38.1.289 (2000). astro-ph/0009379.
- [23] Stocke, J. T. et al. Absorption-line Detections of 105-106 K Gas in Spiral-rich Groups of Galaxies. ApJ 791, 128, DOI: https://dx.doi.org/10.1088/0004-637X/791/2/128 (2014). 1405.4307.
- [24] Planck Collaboration et al. Planck intermediate results. XI. The gas content of dark matter halos: the Sunyaev-Zeldovich-stellar mass relation for locally brightest galaxies. A&A 557, A52, DOI: https://dx.doi.org/10.1051/0004-6361/201220941 (2013). 1212.4131.
- [25] Oppenheimer, B. D., Babul, A., Bahé, Y., Butsky, I. S. & McCarthy, I. G. Simulating Groups and the IntraGroup Medium: The Surprisingly Complex and Rich Middle Ground between Clusters and Galaxies. Universe 7, 209, DOI: https://dx.doi.org/10.3390/universe7070209 (2021). 2106.13257.
- [26] Fujita, Y., Akahori, T., Umetsu, K., Sarazin, C. L. & Wong, K.-W. Probing WHIM around Galaxy Clusters with Fast Radio Bursts and the Sunyaev-Zel’dovich effect. ApJ 834, 13, DOI: https://dx.doi.org/10.3847/1538-4357/834/1/13 (2017). 1609.03566.
- [27] Qu, Z., Huang, R., Bregman, J. N. & Li, J.-T. An X-Ray- and SZ-bright Diffuse Source toward M31: A Local Hot Bridge. ApJ 907, 14, DOI: https://dx.doi.org/10.3847/1538-4357/abc9b9 (2021). 2011.02125.
- [28] Hao, J. et al. VizieR Online Data Catalog: GMBCG galaxy cluster catalog from SDSS DR7 (Hao+, 2010). VizieR Online Data Catalog J/ApJS/191/254 (2013).
- [29] Kourkchi, E. & Tully, R. B. Galaxy Groups Within 3500 km s-1. ApJ 843, 16, DOI: https://dx.doi.org/10.3847/1538-4357/aa76db (2017). 1705.08068.
- [30] Lu, W. & Piro, A. L. Implications from ASKAP Fast Radio Burst Statistics. ApJ 883, 40, DOI: https://dx.doi.org/10.3847/1538-4357/ab3796 (2019). 1903.00014.
- [31] Gardenier, D. W., Connor, L., van Leeuwen, J., Oostrum, L. C. & Petroff, E. Synthesising the repeating FRB population using frbpoppy. A&A 647, A30, DOI: https://dx.doi.org/10.1051/0004-6361/202039626 (2021). 2012.02460.
- [32] Keating, L. C. & Pen, U.-L. Exploring the dispersion measure of the Milky Way halo. MNRAS 496, L106–L110 (2020). 2001.11105.
- [33] Bland, M. An Introduction to Medical Statistics. An Introduction to Medical Statistics (Oxford University Press, 1995).
- [34] Lehmann, E. & D’Abrera, H. Nonparametrics: Statistical Methods Based on Ranks (Prentice Hall, 1998).
- [35] Shull, J. M., Smith, B. D. & Danforth, C. W. The Baryon Census in a Multiphase Intergalactic Medium: 30% of the Baryons May Still be Missing. ApJ 759, 23, DOI: https://dx.doi.org/10.1088/0004-637X/759/1/23 (2012). 1112.2706.
- [36] Planck Collaboration et al. Planck 2018 results. VI. Cosmological parameters. A&A 641, A6, DOI: https://dx.doi.org/10.1051/0004-6361/201833910 (2020). 1807.06209.
- [37] Bregman, J. N. et al. The Extended Distribution of Baryons around Galaxies. ApJ 862, 3, DOI: https://dx.doi.org/10.3847/1538-4357/aacafe (2018). 1803.08963.
- [38] Lim, S. H., Mo, H. J., Wang, H. & Yang, X. Detection of Missing Baryons in Galaxy Groups with Kinetic Sunyaev-Zel’dovich Effect. ApJ 889, 48, DOI: https://dx.doi.org/10.3847/1538-4357/ab63df (2020). 1912.10152.
- [39] Shull, J. M. Where do Galaxies End? ApJ 784, 142, DOI: https://dx.doi.org/10.1088/0004-637X/784/2/142 (2014). 1401.5799.
- [40] Jones, C. & Forman, W. The structure of clusters of galaxies observed with Einstein. ApJ 276, 38–55, DOI: https://dx.doi.org/10.1086/161591 (1984).
- [41] Miller, M. J. & Bregman, J. N. Constraining the Milky Way’s Hot Gas Halo with O VII and O VIII Emission Lines. ApJ 800, 14, DOI: https://dx.doi.org/10.1088/0004-637X/800/1/14 (2015). 1412.3116.
- [42] Watkins, L. L., van der Marel, R. P., Sohn, S. T. & Evans, N. W. Evidence for an Intermediate-mass Milky Way from Gaia DR2 Halo Globular Cluster Motions. ApJ 873, 118, DOI: https://dx.doi.org/10.3847/1538-4357/ab089f (2019). 1804.11348.
- [43] Karachentsev, I. D., Karachentseva, V. E., Huchtmeier, W. K. & Makarov, D. I. A Catalog of Neighboring Galaxies. AJ 127, 2031–2068, DOI: https://dx.doi.org/10.1086/382905 (2004).
- [44] Davé, R. et al. SIMBA: Cosmological simulations with black hole growth and feedback. MNRAS 486, 2827–2849, DOI: https://dx.doi.org/10.1093/mnras/stz937 (2019). 1901.10203.
- [45] Springel, V. et al. First results from the IllustrisTNG simulations: matter and galaxy clustering. MNRAS 475, 676–698, DOI: https://dx.doi.org/10.1093/mnras/stx3304 (2018). 1707.03397.
- [46] Schaye, J. et al. The EAGLE project: simulating the evolution and assembly of galaxies and their environments. MNRAS 446, 521–554, DOI: https://dx.doi.org/10.1093/mnras/stu2058 (2015). 1407.7040.
- [47] Tremmel, M. et al. The Romulus cosmological simulations: a physical approach to the formation, dynamics and accretion models of SMBHs. MNRAS 470, 1121–1139, DOI: https://dx.doi.org/10.1093/mnras/stx1160 (2017). 1607.02151.
- [48] Walker, C. R. H., Ma, Y.-Z. & Breton, R. P. Constraining the redshifts of unlocalised fast radio bursts. A&A 638, A37, DOI: https://dx.doi.org/10.1051/0004-6361/201833157 (2020). 1804.01548.
- [49] Shannon, R. M. et al. The dispersion-brightness relation for fast radio bursts from a wide-field survey. Nature 562, 386–390, DOI: https://dx.doi.org/10.1038/s41586-018-0588-y (2018).
- [50] James, C. W. et al. The fast radio burst population evolves, consistent with the star formation rate. MNRAS 510, L18–L23, DOI: https://dx.doi.org/10.1093/mnrasl/slab117 (2022). 2101.07998.
- [51] James, C. W. et al. The z-DM distribution of fast radio bursts. MNRAS 509, 4775–4802, DOI: https://dx.doi.org/10.1093/mnras/stab3051 (2022). 2101.08005.
- [52] Niu, C.-H. et al. CRAFTS for Fast Radio Bursts: Extending the Dispersion-Fluence Relation with New FRBs Detected by FAST. ApJ 909, L8, DOI: https://dx.doi.org/10.3847/2041-8213/abe7f0 (2021). 2102.10546.
- [53] Heintz, K. E. et al. Host Galaxy Properties and Offset Distributions of Fast Radio Bursts: Implications for Their Progenitors. ApJ 903, 152, DOI: https://dx.doi.org/10.3847/1538-4357/abb6fb (2020). 2009.10747.
- [54] Connor, L. Interpreting the distributions of FRB observables. MNRAS 487, 5753–5763, DOI: https://dx.doi.org/10.1093/mnras/stz1666 (2019). 1905.00755.
- [55] Simard, D. & Ravi, V. Measuring interstellar turbulence in fast radio burst host galaxies. arXiv e-prints arXiv:2107.11334 (2021). 2107.11334.
- [56] Niu, C. H. et al. A repeating fast radio burst in a dense environment with a compact persistent radio source. arXiv e-prints arXiv:2110.07418 (2021). 2110.07418.
Supplementary Information is linked to the online version of the paper at
www.nature.com/nature.
Acknowledgements. We first the referees, whose careful consideration and suggestions were invaluable. We thank Cameron Hummels, Wenbin Lu, J. Michael Shull, and the Caltech FRB group for a helpful discussions. We also thank Calvin Leung, Kiyoshi Masui, and Mohit Bhardwaj for valuable comments on the manuscript. This research was partially supported by the National Science Foundation under grant AST-1836018.
Author contributions. V.R. conceived of searching only nearby foreground galaxies for FRB/halo interceptions. L.C. developed the methods for cross-matching the catalogs, statistically testing the DM distributions, and analyzing the DM excess that are reported in the main text figures and results. V.R. modeled the halo DM contribution shown in Extended Data Figure 3. L.C led the writing of the manuscript in close collaboration with V.R.
Competing interests statement. The authors declare that they have no competing financial interests.
| FRB name | Galaxy | Group | Dist (Mpc) | (kpc) | DM (pc cm-3) | |
|---|---|---|---|---|---|---|
| FRB20190223B | NGC6946 | NGC6946 | 12.1 | 5.9 | 153 | 411.8 |
| FRB20190430B | NGC6015 | None | 15.2 | 19 | 2583.0 | |
| FRB20190423A | NGC3998 | NGC3998 | 12.6 | 14.1 | 48 | 211.0 |
| FRB20181214C | NGC3835 | None | 34.1 | 69 | 599.5 | |
| FRB20190612A | NGC3034 | M81 | 12.6 | 3.9 | 52 | 390.6 |
| FRB20190701D | NGC2403 | M81 | 12.6 | 3.2 | 78 | 877.4 |
| FRB20180925A | IC0391 | None | 20.8 | 80 | 167.1 | |
| FRB20190211A | IC0342 | Maffei | 12.7 | 3.3 | 221 | 1084.4 |
| FRB20190130A | NGC0660 | M74 | 12.2 | 9.2 | 76 | 1330.1 |
| FRB20190128A | M33 | LG | 12.4 | 0.8 | 90 | 652.5 |
| FRB20190217B | M33 | LG | 12.4 | 0.8 | 54 | 800.4 |
| FRB20190226C | M33 | LG | 12.4 | 0.8 | 95 | 783.3 |
| FRB20190605D | M33 | LG | 12.4 | 0.8 | 51 | 1607.7 |
| FRB20190607A | M33 | LG | 12.4 | 0.8 | 108 | 518.5 |
| FRB20181018A | M31 | LG | 12.4 | 0.8 | 154 | 1008.5 |
| FRB20181101A | M31 | LG | 12.4 | 0.8 | 200 | 1327.8 |
| FRB20181129A | M31 | LG | 12.4 | 0.8 | 165 | 299.2 |
| FRB20181130A | M31 | LG | 12.4 | 0.8 | 170 | 125.0 |
| FRB20181224A | M31 | LG | 12.4 | 0.8 | 163 | 225.2 |
| FRB20190102A | M31 | LG | 12.4 | 0.8 | 202 | 655.6 |
| FRB20190106A | M31 | LG | 12.4 | 0.8 | 132 | 251.2 |
| FRB20190116E | M31 | LG | 12.4 | 0.8 | 173 | 1362.6 |
| FRB20190122B | M31 | LG | 12.4 | 0.8 | 123 | 415.1 |
| FRB20190415B | M31 | LG | 12.4 | 0.8 | 188 | 567.6 |
| FRB20190614C | M31 | LG | 12.4 | 0.8 | 170 | 531.7 |
| FRB20190628C | M31 | LG | 12.4 | 0.8 | 101 | 1649.6 |
Methods
Sample selection. We used the 474 non-repeating CHIME/FRB sources published in Catalog 1[3]. We exclude the 18 repeating sources in case they have different distance or DM distributions than apparent non-repeaters. This could arise from the bias towards seeing two or more bursts from nearby objects[30, 31], or if repeaters have preferentially larger . The CHIME/FRB Catalog 1 has three different DM fields: ‘dm_fitb’ is the best fit total DM of the observed FRB. ‘dm_exc_ne2001’ and ‘dm_exc_ymw16’ correspond to total DM minus the expected Milky Way contribution in that direction from the NE2001[18] and YMW16[19] models respectively. We are concerned here with extragalactic DM, so we opt to use ‘dm_exc_ne2001’. However, all three fields produce similar results in our analysis. To avoid potential uncertainties in modeling the Galactic interstellar medium, we exclude CHIME/FRB sources with an absolute value of Galactic latitude less than 5 degrees, and consider a range of limits on the maximum absolute value between 0 and 20 degrees. We do not attempt to subtract the Milky Way halo because its hot gas is assumed to be isotropic and would not affect our excess DM statistic [32].
The Gravitational Wave Galaxy Catalogue (GWGC) contains sky position, distance, -band magnitude, and galaxy type for 53,255 galaxies within 100 Mpc[17]. We select only galaxies at distances less than 40 Mpc such that their angular size is large enough to associate with the CHIME/FRB uncertainty region. We also set a minimum distance of 0.5 Mpc so as to exclude globular clusters and the Magellanic Clouds. Finally, we use only galaxies whose absolute -band magnitude is less than , and explore limits between and . The fiducial cut leaves 2829 galaxies. This corresponds to a density of roughly 0.01 Mpc-3. The optical depth of galaxies with an average virial radius out to a maximum distance is then if we assume the mean virial radius is 200 kpc and of 40 Mpc. We therefore expect approximately 20–25 CHIME/FRB-galaxy intersections. This is in line with our observations.
We have cross-matched the CHIME/FRB Catalog 1 with a subset of the GWGC to look for FRBs for which,
| (3) |
which we parameterize as,
| (4) |
Here, is the impact parameter of the CHIME/FRB source at the reported maximum likelihood position, . Mh is the dark matter halo mass estimated from the galaxy’s absolute -band magnitude and is the impact parameter threshold for a galaxy with a Milky Way halo mass. We allow to vary for Figure 2, but fix it at 200 kpc for Figures 1 and 3. We point out that at low the number of galaxy-intersecting FRBs becomes small and the variance on excess DM is large. This is one reason we choose to compare the excess DM averaged over a range of effective impact parameters. We note that the DM excess tends towards zero for large impact parameter, as expected. We have tried two other methods for associating CHIME FRBs with galaxies. The first is to ignore galaxy mass and assume a halo was intersected if . The second was to use the CHIME/FRB localization confidence interval arrays, provided with their data release111https://chime-frb-open-data.github.io/localization.html. Using these arrays, we take a confidence-weighted average of the impact parameter as opposed to using a single maximum-likelihood position. If this weighted mean is less than some value, it is considered an interception. In all three cross-matching methods, we find similar results for the statistical significance of the difference in mean DMs, as well as similar amplitudes for the DM excess. We have also tried including the DM selection function reported by CHIME/FRB[3] in order to account for incompleteness. We fit their DM recall curve with a polynomial and divide the observed DM distributions for the intersecting and non-intersecting subsets by that curve. We then re-compute p-values on the de-biased DM distributions. We find the statistics are not significantly changed, which is in line with expectation as CHIME is relatively complete in DM and both subsets of data have the same selection effects.
Statistical significance. Our analysis focuses on two primary statistical tests for DM excess: a jackknife resampling of the CHIME/FRB data and Student’s one-sided t-test. The former is a nonparametric order statistic in that it makes no assumptions about the underlying DM distributions. Its “p-value” is the fraction of resamplings in which the DM excess is larger than the true data. To compute this, we first calculate the excess DM as a function of of the real data (see Figure 2). The jackknife resampling is done by randomly shuffling the CHIME/FRB DM data while keeping the source positions constant, and computing excess DM at each threshold impact parameter. This is done for 10,000 realizations, of which 1000 are shown in Figure 2. We then ask, how many of those resampled DM/ curves have a larger sum than the real data in the range 75–300 kpc. We find that only 0.5 of resamplings have a larger excess DM between galaxy-intersecting and non-intersecting FRBs when compared with the real data. Changing the range over which the excess is calculated from 75–300 kpc to other reasonable values does not significantly affect our result. 75 kpc is our lower limit because of the small number of intersections below that impact parameters, but the effect remains if that number is set to 0 kpc. Similarly, 300 kpc is about double the typical virial radius of Milky Way-like galaxies, and allows for the inclusion of more massive halos, such as galaxy groups.
The p-value of our one-sided two-sample t-test can be interpreted as the probability that the difference in mean DMs between the two subsets of FRBs would be at least as extreme as what is found in the data, if there were no positive DM excess. Typical p-values are below 0.05 for the expected virial radii of the foreground galaxies and the average p-values at kpc are smaller than in more than 99 of resamplings in our jackknife test. However, the t-test is a parametric test, meaning it makes certain assumptions about the underlying data. First, it expects that the means of the two samples being compared are normally distributed—a consequence of the central limit theorem. And in the case of Student’s one-sided t-test, the variance of the two samples ought to be roughly equal. Nonetheless, we point out that t-tests are often robust against moderate deviations from the two aforementioned assumptions[33]. We believe the DMs of CHIME/FRB sources can be appropriately compared with Student’s t-test.
To test this claim explicitly, we have simulated CHIME/FRB data with a similar DM distribution as Catalog 1 in order to test the validity of the one-sided t-test. We model the CHIME/FRB DM distribution using a Gamma distribution with shape parameter, , scale parameter, , with the DMs scaled by a factor of 8 to match the empirical distribution. For each realization in this simulation, we draw 474 FRB DMs from the Gamma distribution and randomly select 25 as having intersected a “galaxy”. We then apply a Student’s t-test to the galaxy-intersecting sample of FRBs and the remaining 449 simulated sources. The p-values are uniformly distributed between 0 and 1 and 5 of realizations have , despite the DM data being non-Gaussian and the sample sizes to be different by over an order of magnitude. We conclude that the parametric nature of the t-test we have used on the real data is not a major concern. If it were, we would have expected a non-uniform distribution of p-values and more than 5 of realizations to have , which would indicate an artificially inflated rate of low p-values.
The jackknife and t-test are only two inferential statistics that we could have applied to the data. One common choice for a nonparametric statistic comparing two samples is the Kolmogorov–Smirnov (KS) test. The KS-test does not lead to a highly significant detection when applied to our data. However, the KS-test is non-ideal for our purposes because it is a generic test to determine if two samples are drawn from the same distribution. We are physically-motivated to search for the more specific signal of a positive shift in mean DM in FRBs that intersect foreground galaxies, for which both our particular jackknife and Student’s one-sided t-test are designed. The KS-test, on the other hand, has less statistical power to look for shifts in median or mean because it tests more for deviations from the null hypothesis[34]. In Extended Data Figure 1 we compare three methods for computing p-values on our simulated CHIME/FRB DM data both in the case where there is no excess DM (top row) and the case where excess DM is added to galaxy-intersecting sources (bottom row). The excess is normally distributed with mean 150 pc cm-3 and standard deviation 50 pc cm-3. We find that the t-test and jackknife test are more sensitive to shifts in the mean DM than the KS-test.
A scenario where we expect the DM excess signal to disappear is when the foreground galaxies are too far away for the CHIME/FRB localization region to be unambiguously matched with the galaxy’s halo. While there will be many “intersections” due to the increasing optical depth with distance, most will be false positives because the CHIME/FRB localization uncertainty becomes significantly larger than the halo for distances beyond 40 Mpc. We therefore do not expect excess DM if the minimum galaxy distance is set to 40 Mpc in the GWGC catalog. And indeed, we find only p-values greater than 0.05 with this cut, despite dozens of reported intersections at 100 kpc kpc.
Quantifying the DM excess. We can quantify the excess DM by taking an average in the range 75 kpc kpc. The 1 error is estimated from the distribution of DM excesses in 10,000 jackknife tests. This gives a 90 confidence interval of 90–420 pc cm-3 on the excess DM. However, the upper bound is not robust. It may be that not all FRB/galaxy associations included here are correct because of CHIME localization uncertainties and the uncertain extents of halos. This would lead to our sample being contaminated by non-intersecting FRBs. Further, the impact parameters that we assign to the FRB/galaxy associations are uncertain for the same reasons. As more sky area is covered by larger values than by smaller , it is likely that the true impact parameters of the sample of FRB/galaxy intersections are larger. This would also bias low our estimate of the DM excess at a specific . We therefore only regard the lower bound as robust.
Interpretation: gas in galaxy halos. Our understanding of the warm/hot gaseous contents of dark matter halos hosting galaxies, galaxy groups and galaxy clusters remains foggy. However, it has long been known that this medium is of significant astrophysical importance, because it represents between 80–90% of the baryon contents of dark matter halos[1, 35, 2]. Fundamental open questions include the total mass and radial density profile of the CGM/IGrM/ICM; FRB observations are a promising new technique to address these questions[4, 5, 6, 32, 7]. We express the CGM/IGrM/ICM mass as a fraction, , of the expected baryonic mass in a given dark-matter halo, , where is the fractional cosmic baryon density and is the fractional cosmic matter density[36].
Existing observational probes of for individual galaxies and galaxy groups are beset by systematic issues, and yield uncertain results in comparison with galaxy cluster measurements. The thermal X-ray emission and thermal/kinetic Sunyaev-Zel’dovich (SZ) measurements that are used for galaxy clusters become less reliable for lower halo masses because of decreasing emission columns, lower gas pressures, and the increased effects of feedback from astrophysical processes in galaxies. Individual galaxy halos at low redshifts retain a multi-phase CGM, with a high covering fraction of cool ( K; and therefore primarily ionized) clouds interspersed within the hot ( K), diffuse gas probed by X-ray and SZ observations[2, 37]. Intriguingly, stacked SZ observations of galaxies and galaxy clusters are beginning to reveal a potentially self-similar relation between the inferred signal and , indicating both a universal close to unity and radial density profile[24, 38]. This is consistent with extrapolations of X-ray observations of the IGrM[22], but potentially in tension with X-ray observations of individual galaxies[37]. The tension may be resolved by considering feedback effects in different samples, and the existence of significant gas fractions at sub-virial temperatures. Significant other uncertainties remain, including the mass fractions of cool gas in galaxy halos[2], and indeed the true extents of galaxies[39].
In the following, we consider the expected DM excess for our sample of FRB sightlines that intercept nearby galaxy halos. We first consider each galaxy in isolation, and derive the expected DM accrued for each intercept under two models for the radial number-density distribution of baryons in halos, :
-
•
The fiducial modified Navarro-Frenk-White (mNFW) profile described in[6].
- •
We fix , and approximately derive the halo masses by scaling the approximate Milky Way halo mass[42] of by the ratio between the absolute -band magnitudes of the GWGC galaxies and the Milky Way -band magnitude of [43]. We account for the primordial helium fraction in deriving the DM for each intercept.
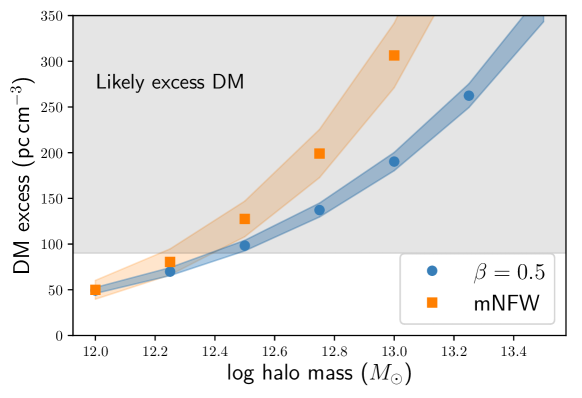
The distribution of expected DM excesses for the fiducial sample of 26 FRB / nearby-galaxy intercepts for kpc is shown in Extended Data Figure 2. We find mean excess DMs for the mNFW and beta models of 34.7 pc cm-3 and 38.7 pc cm-3 respectively, well below the measured 95% confidence lower bound of 90 pc cm-3. This analysis also demonstrates how the distribution of excesses is sensitive to the chosen radial density profile. More centrally concentrated profiles like the mNFW model result in distributions with longer tails. Consistent with previous works that derive the expected DM excesses for typical galaxy-halo intercepts[5, 6], we conclude that gas within individual galaxy halos is insufficient to explain the observed excess in the FRB / nearby-galaxy sample. Although this analysis is approximate by factors of a few due to uncertainties in the halo mass determination, the conclusions are robust because of our conservative assumption of , and because of the downward bias discussed above.
To illustrate how this problem may be solved, we next consider the expected excess DM accrued by FRBs intersecting halos of different masses. Using the same models for as above, we simulate 100 samples of 26 random intercepts for local () halos of different masses. For each realization, we randomly draw 26 FRB positions using the uncertainties (assumed to parameterize elliptical Gaussian distributions) in right ascension and declination in the CHIME/FRB Catalog 1. We then calculate the projected offsets from the centres of the halos they intersect (as listed in Table 1). In calculating the predicted mean DM excess of the sample, an FRB is assigned a zero value if it intersects the halo beyond the virial radius. We do not use the confidence-level maps that accompany each Catalog 1 FRB because these cannot be directly translated into posterior predictive distributions on the FRB positions. We also emphasise that these simulations are illustrative rather than directly representative of reality, because we assume that all FRBs are intersecting halos of the same mass. The resulting mean DM excesses for halo masses are shown in Extended Data Figure 3. Two cases are considered:
-
•
In the top panel of Extended Data Figure 3, we assume , and consider the two models for the radial density distribution of baryons introduced above.
-
•
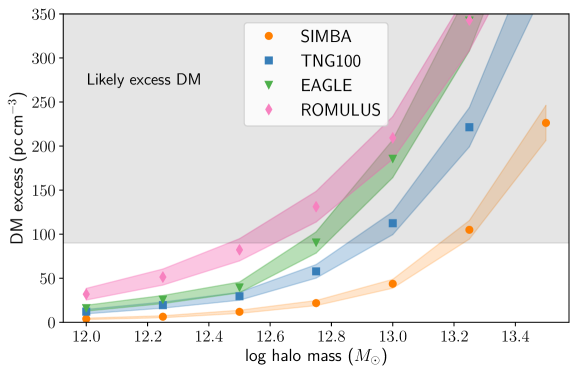
In the bottom panel of Extended Data Figure 3, we instead only consider the modified NFW model, but adopt results from four different cosmological simulations for at different halo masses[25]: SIMBA[44], the IllustrisTNG 100 Mpc box (TNG100)[45], EAGLE[46], and ROMULUS[47]. The variations in between simulations are large, lying in the range 0.2–0.85, and the values typically increase by factors of a few from lower to higher halo masses. These variations are largely due to the (different) feedback prescriptions, which result in different amounts of gas being evacuated from halos. The simulation results are synthesized by Oppenheimer et al.[25]. Results for halo masses below are not given, and we use the values at for lower halo masses.
Consistency between the simulated and measured DM excesses is only achieved for halo masses well in excess of the Milky Way halo mass. Consistent with previous results[6], this analysis makes it clear that membership of the intercepted galaxies in modest galaxy groups can explain the observed DM excess. The larger DM offset for the modified NFW profiles for larger halo masses (in the panel) is due to the fixed impact parameter that is assumed. For the predicted values of , only some simulations (ROMULUS, and possibly EAGLE) are consistent with our observations, given the range of group virial masses listed in Table 1. However, several other uncertainties need to be accounted for in making a quantitative comparison, including uncertainties in the observed virial masses, the true values of , the radial density profiles, and variance between the evolutionary histories of halos at a given mass.
Interpretation: excess host DM. In this section, we consider and reject the possibility that the effect that we observe is explained by a high DM local to FRB host galaxies (). This possibility relies on assuming that FRBs that appear to be spatially coincident with nearby galaxy halos in fact originate from within the nearby galaxies. It may then be possible that, by random chance, these nearby FRBs have substantially larger values of than the remainder of the CHIME sample. Alternatively, if all FRBs have very large values of in their rest frames, nearby FRBs will be observed to have larger values of than more distant FRBs, because of the suppression of the local DM contribution by a factor . If all CHIME FRBs are observed at sufficiently low redshifts such that is the dominant contributor to the total extragalactic DM, then it is possible that the extragalactic DMs of FRBs in fact reduce with increasing redshift. In this contrived example, sources that are close to nearby galaxies on sky will have higher observed DM than those that are not.
The former scenario is unlikely given the large required values of the local FRBs. The characteristic redshift of the CHIME sample of [10] implies a characteristic pc cm-3.[11] Assuming no significant evolution in FRB properties at redshifts , the local sample would need to have values that are more than pc cm-3 larger than those of the remainder of the CHIME sample. For reasonable distributions of generated by considering different FRB progenitor scenarios[48], this is statistically unlikely.
The latter scenario is also not supported, because characteristic values of pc cm-3 would be required. This is inconsistent with the DMs of the majority of CHIME FRBs[3]. The extragalactic DMs of FRBs with host-galaxy redshift measurements typically increase with increasing redshift, and are dominated by gas external to galaxies[12]. The distributions of fluence and DM for FRBs observed at the Parkes, ASKAP, FAST and CHIME telescopes are consistent with a population that exhibits a positive correlation between distance and DM[49, 50, 51, 52, 3]. Most FRBs localized to host galaxies have pc cm-3[53]. It is additionally possible that FRBs with high values of will also undergo excess temporal broadening due to interstellar scattering in their host galaxies, which would make them harder to detect[54, 55].
There are two interesting counterpoints, but they cannot on their own produce our observed DM excess. The first is FRB 190520, whose host DM could be as high as pc cm-3 [56]. The second comes from cross-correlating galaxies between redshifts 0.3 and 0.5 with high-DM CHIME FRBs (DM pc cm-3) [10]. There is a significant cross-correlation signal between those two samples, indicating that some FRBs in that redshift range have large host galaxy dispersion ( pc cm-3). In fact, many CHIME FRBs with large extragalactic DM are at , even though most FRBs do not have large extragalactic DM. These CHIME FRBs, however, are distributed randomly over two galaxy footprints (DESI and WISExSCOS) that are far more distant than our sample of foreground galaxies, which are at ; they do not preferentially intersect nearby galaxies. Finally, our galaxy-intersecting FRBs span a much wider DM range. Combining these facts, we find no evidence for the minority of FRBs with large host galaxy dispersion producing the DM excess reporting in this paper.
Data availability statement. The data used in these analyses are all publicly available. The CHIME/FRB Catalog 1 can be found at https://www.chime-frb.ca/catalog. The Gravitational Wave Galaxy Catalogue (GWGC) can be downloaded online at http://vizier.u-strasbg.fr/viz-bin/VizieR?-source=GWGC.
Code availability statement. This research made use of the open-source numpy, scipy, astropy, hmf, NFW, CHIME/FRB’s “cfod” package, and frb (https://github.com/FRBs/FRB/tree/main/frb) python packages. All custom code used in our analysis will be made available upon request.